Maternal LSD1/KDM1A is an essential regulator of chromatin and transcription landscapes during zygotic genome activation
- Institut Curie, France
- INSERM, France
- Mines ParisTech, France
- High Fidelity Biology, France
- Annoroad Gene Technology Co., Ltd, China
- Urologische Klinik und Zentrale Klinische Forschung, Germany
Figures
Figure 1 with 2 supplements
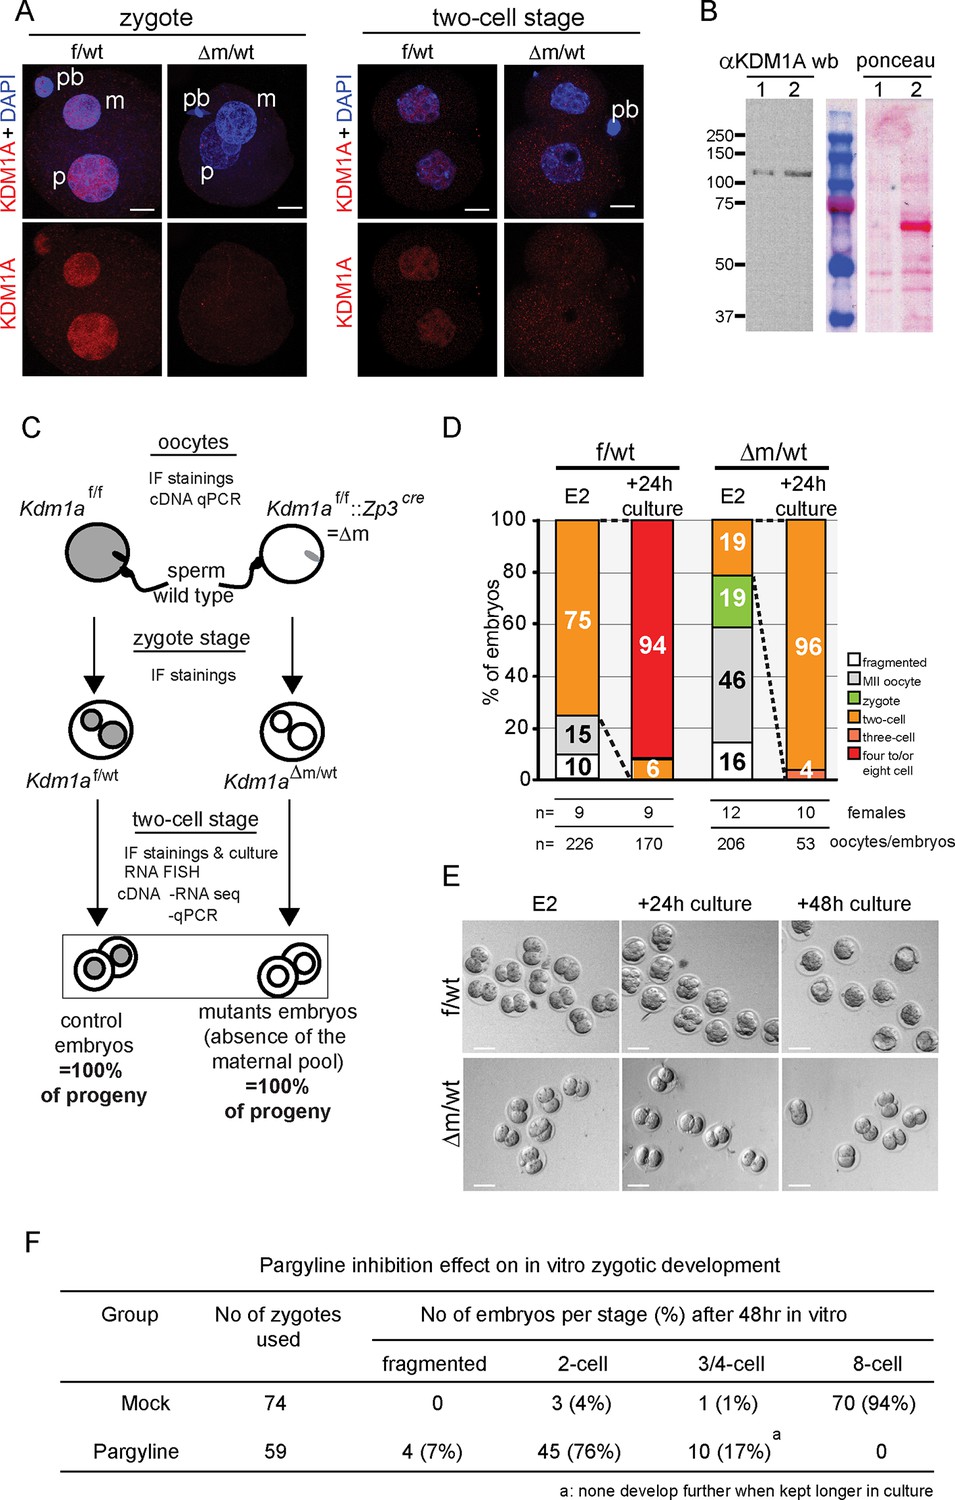
Kdm1a maternally deleted embryos arrest at two-cell stage.
(A) Immunofluorescence using anti-KDM1A antibody (red) at the zygote and two-cell stage shows nuclear accumulation of KDM1A in control embryos (top). Cre-mediated deletion of Kdm1a in maternal germline (bottom) leads to depletion of the protein after fertilization. Paternal pronucleus (p), maternal pronucleus (m) and polar body (pb) are indicated. DNA is counterstained by DAPI (blue). (B) western blot analysis (left panel) for ESC (lane1) and two-cell stage embryo extracts (lane 2) using anti-KDM1A antibody. Ponceau staining (right panel) is shown as loading control. Molecular weights (kDa) are indicated on the left. (C) Mating scheme and experimental outcomes for the different developmental stages used in this study: f/wt control embryos are obtained from superovulated Kdm1af/f females mated with wild-type males, while △m/wt mutant embryos are obtained from superovulated Kdm1af/f::Zp3cre females crossed with wild-type males. (D) Distribution of developmental stages found in f/wt and △m/wt embryos collected at embryonic day 2 (E2) (expected two-cell stage) and after 24 hr of in vitro culture. Numbers of females used and numbers of oocytes/embryos analysedare shown under the graph. See also Figure 1—figure supplement 1 for oocyte analysisand Figure 1—figure supplement 2 for developmental stage distribution using natural matings without superovulation for females. (E) Bright field images representative for two consecutive days of in vitro culture for f/wt and △m/wt embryos collected at E2. (F) Phenotypes and distribution of developmental stages obtained after 48 hr treatment in vitro culture with a catalytic inhibitor (pargyline) of KDM1A in wild-type zygotes recovered at 17 hr post hCG injection. Scale bars represent, 10 μm and 50 μm, in A and D, respectively.
Figure 1—figure supplement 1
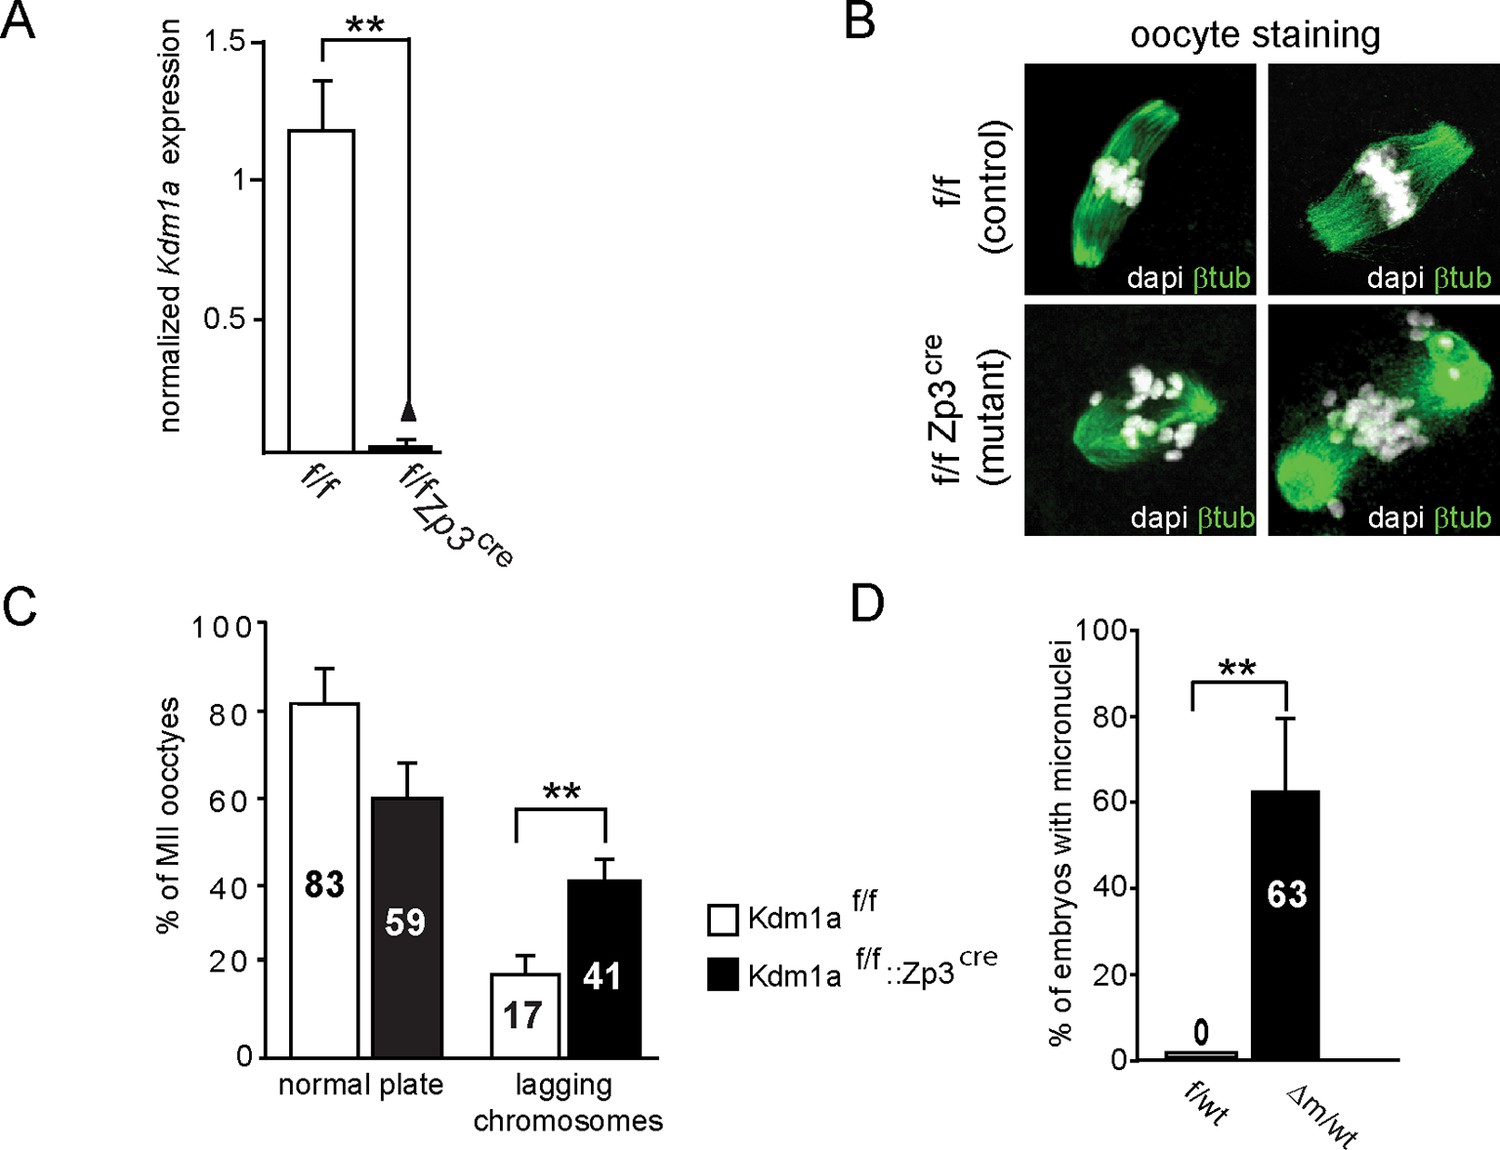
Kdm1a loss of function in female germline.
(A) qPCR analysis of Kdm1a transcripts level from single ovulated oocytes cDNAs. Data are expressed as normalized mean expression levels ± sem for control (in white, n = 7) versus mutant (in black, n = 7) oocytes. Two asterisks indicate p<0.01 as calculated using a Student’s t-test. (B) IF analysis of control MII oocytes (from Kdm1a f/f females; left) or KDM1A depleted oocytes (from Kdm1af/f::Zp3cre females; right) with β-tubulin (green), and metaphase chromosomes are counterstained with DAPI (white). (C) Chromosome instability studied as a proportion of matured MII stages oocytes that exhibited normal alignment of chromosomes on the spindle versus matured MII stages oocytes with lagging chromosomes are shown in the graph. Oocyte genotypes are Kdm1af/f (in white; n = 75) and Kdm1af/f::Zp3cre (in black; n = 55). (D) Proportions of two-cell stage embryos with micronuclei: f/wt control embryos are shown in white n = 60, compared to Δm/wt mutant in black n = 40 (C and D). Data are presented as the mean ± s.e.d of two or three independent experiments. Statistical difference was calculated using a chi-square test.
Figure 1—figure supplement 2

Embryo recovery at day 2 post fertilization using natural matings.
Distribution of developmental stages found in f/wt and Δm/wt embryos collected at embryonic day 2 (E2; expected two-cell stage) using natural breeding for Kdm1af/f or Kdm1af/f::Zp3cre females. Oocytes/embryos numbers, as well as the number of female per genotype are shown under the graph.
Figure 2
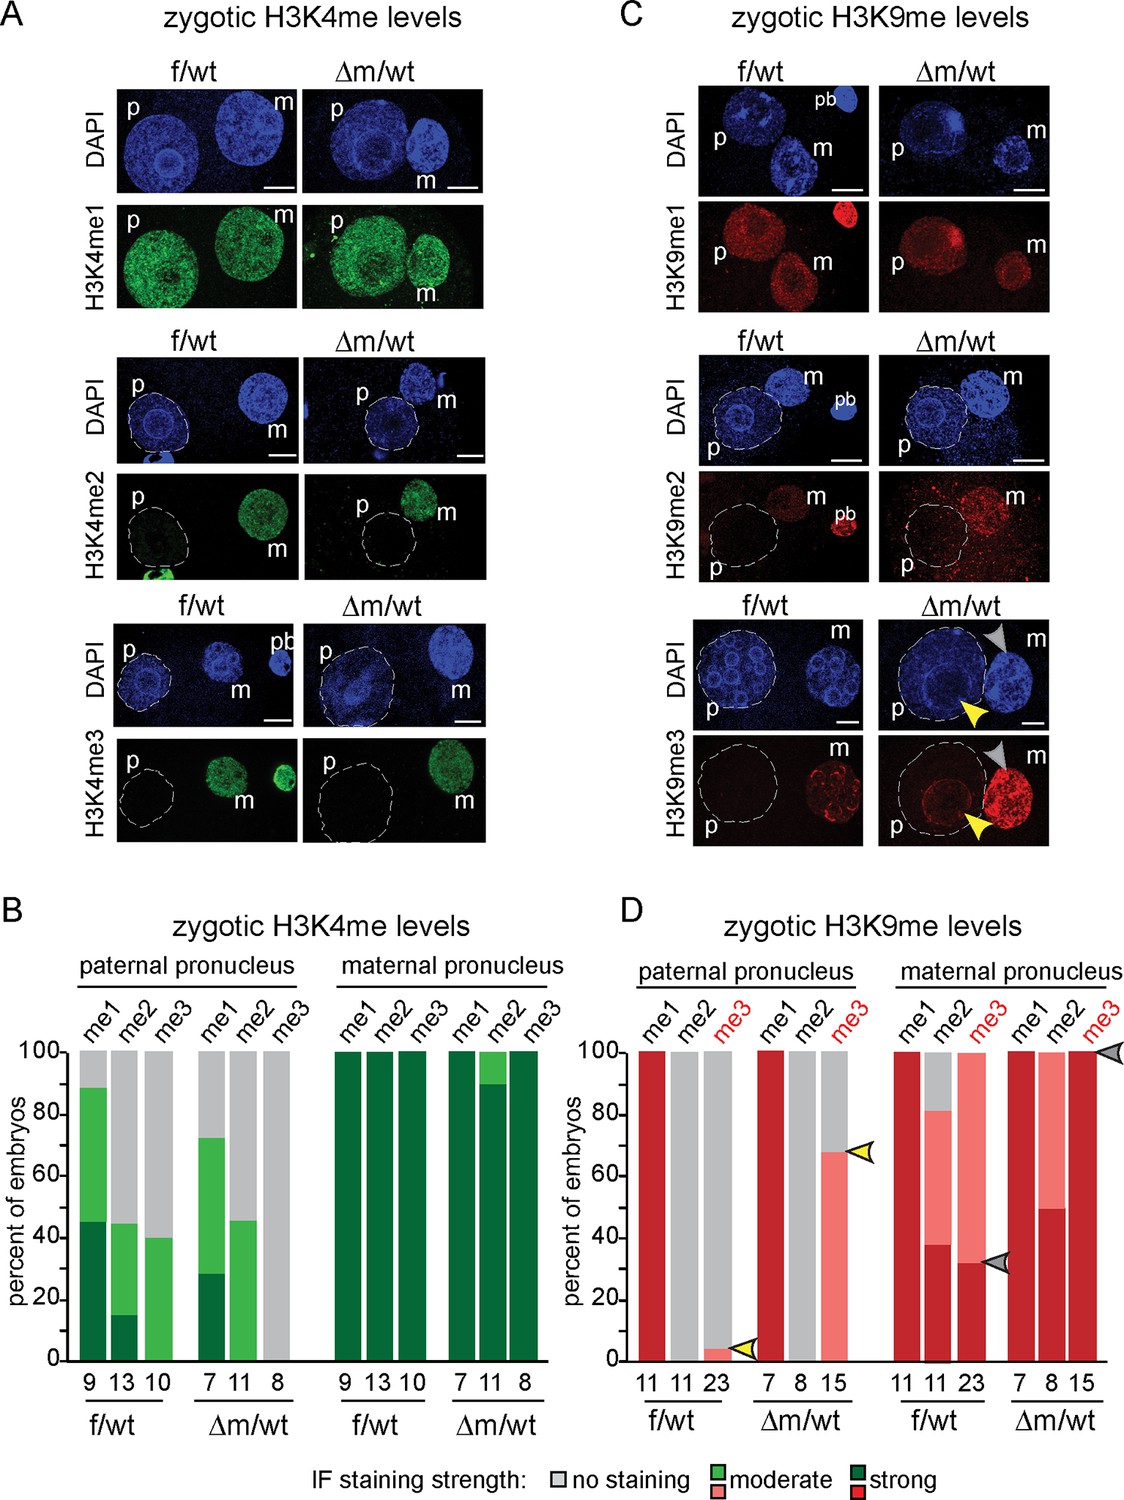
H3K9me3 heterochromatin levels are defined by maternally inherited KDM1A at the zygote stage.
(A and C) IF using antibodies against me1, me2 and me3 of (A) H3K4 (in green) and (C) H3K9 (in red) during zygotic development. Mid to late f/wt and △m/wt zygote are shown. Paternal pronucleus (p), maternal pronucleus (m) and the polar body (pb) are indicated when present. DNA is counterstained with DAPI (blue). In C, note that in △m/wt zygotes, H3K9me3 is increased in the maternal pronucleus (grey arrowhead) and is localized de novo in the paternal pronucleus (yellow arrowhead). (B and D) Classification of embryos based on staining intensity scores for H3K4/K9me1/2/3) in the paternal versus maternal pronuclei in zygotes. Note that concerning H3K9me2, 50% of △m/wt embryos have a strong staining versus 35% in controls (which are also up to 20% with no IF signal). The most striking and only significant differences in proportions are seen for H3K9me3 both in maternal (grey arrowheads) and paternal (yellow arrowheads) pronuclei, with p<0.05 using a Chi square test. The scoring is as follows: light grey for no signal; medium green/red for moderate signal and dark green/red for strong signal. Number of embryos and their genotypes are indicated at the bottom of the graph. Scale bar in A and C represent 10 μm.
Figure 3 with 1 supplement
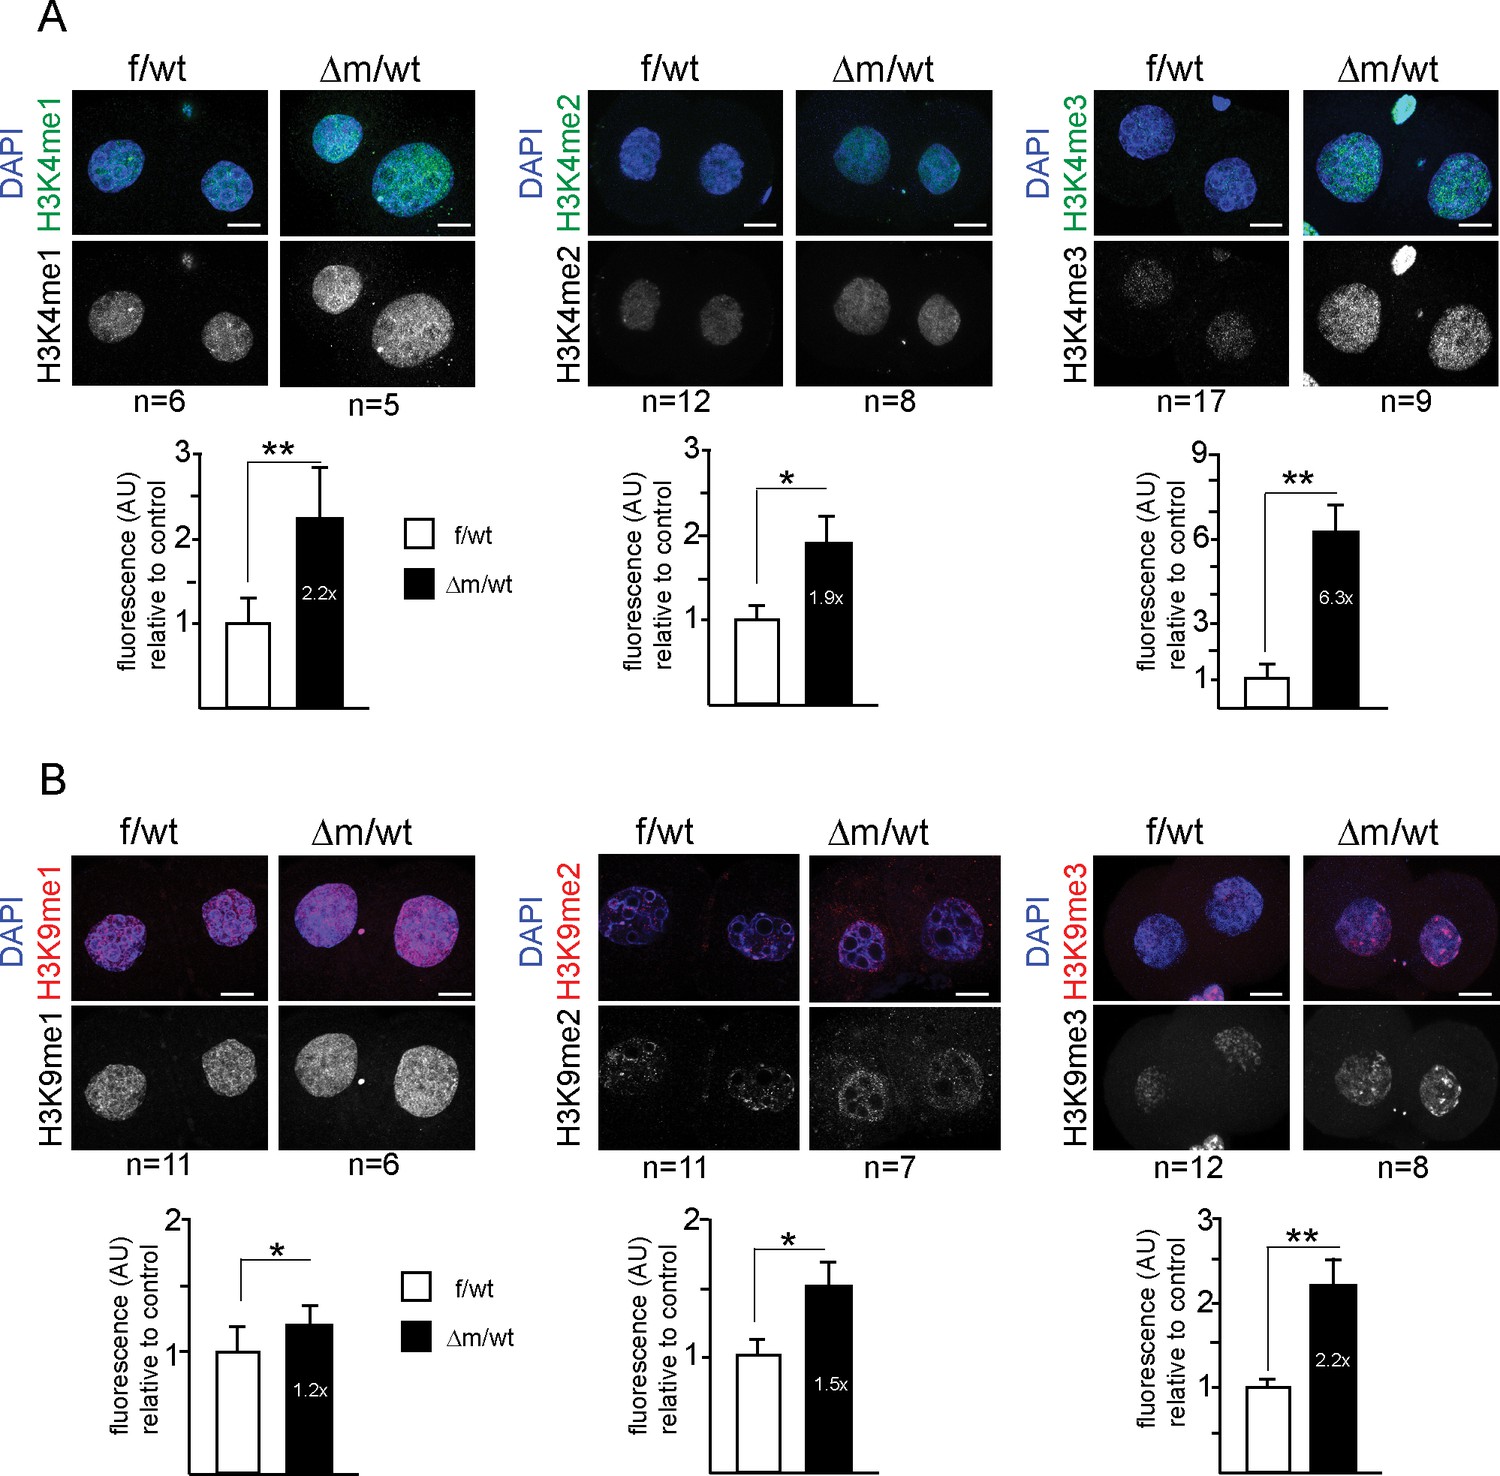
Two-cell stage H3K4 and H3K9 methylation levels are altered upon absence of maternal KDM1A.
Immunofluorescence stainings of two-cell stage embryos using antibodies against me1, me2 and me3 of H3K4 (A; in green) and H3K9 (B; in red) were performed on f/wt (left panels) and △m/wt embryos (right panels). Control and mutant samples were processed in parallel and acquired using similar settings at the confocal microscope. DNA is counterstained with DAPI (blue). Projections of z-stacks are shown of representative embryos for each staining. Scale bars, 10 μm. Error bars represent S.E.M. By t-test; p<0.05 corresponds to * and p<0.001 to ** as performed on the number of embryos indicated below each picture. Below each image are shown the relative quantifications for IF intensity levels of me1, me2 and me3 of △m/wt (in black) relative to f/wt (in white) in two-cell stage embryos. Note that no alteration for H3K27me3 or H4K20me3 could be detected for mutant two-cell stage embryos (Figure 3—figure supplement 1A and B). Also, IF for pargyline-treated two-cell stage embryos revealed changes in both H3K4me3 and H3K9me3 patterns (Figure 3—figure supplement 1C and D).
Figure 3—figure supplement 1

Immunofluorescence analysis of histone tail modifications upon maternal depletion or upon chemical inhibition of KDM1A for two-cell stage embryos.
(A and B) Analysis of heterochromatin marks by IF with antibodies against me3 of H3K27 (A) and H4K20 (B) were performed on f/wt control embryos (left panel) in parallel to Δm/wt mutant embryos (right panel). (C and D) Analysis by IF with antibodies against H3K4me3 (C) and H3K9me3 (D) of two-cell stage wild-type embryos cultured in mock conditions (left panel) or with pargyline (right panel). Antibody staining is shown in green or red and DNA is counterstained with DAPI (blue). The number of embryos processed is indicated under each picture. Shown are full projections of stack sections taken every 0.5 μm. Scale bar, 10 μ. Under each image is the graphical representation of the fluorescent mean intensity ± sem (arbitrary unit, AU) of Δm/wt (in black) relative to f/wt (in white) two-cell stage immunostained embryos.
Figure 4 with 2 supplements
Abnormal ZGA upon absence of KDM1A revealed by transcriptome analysis.
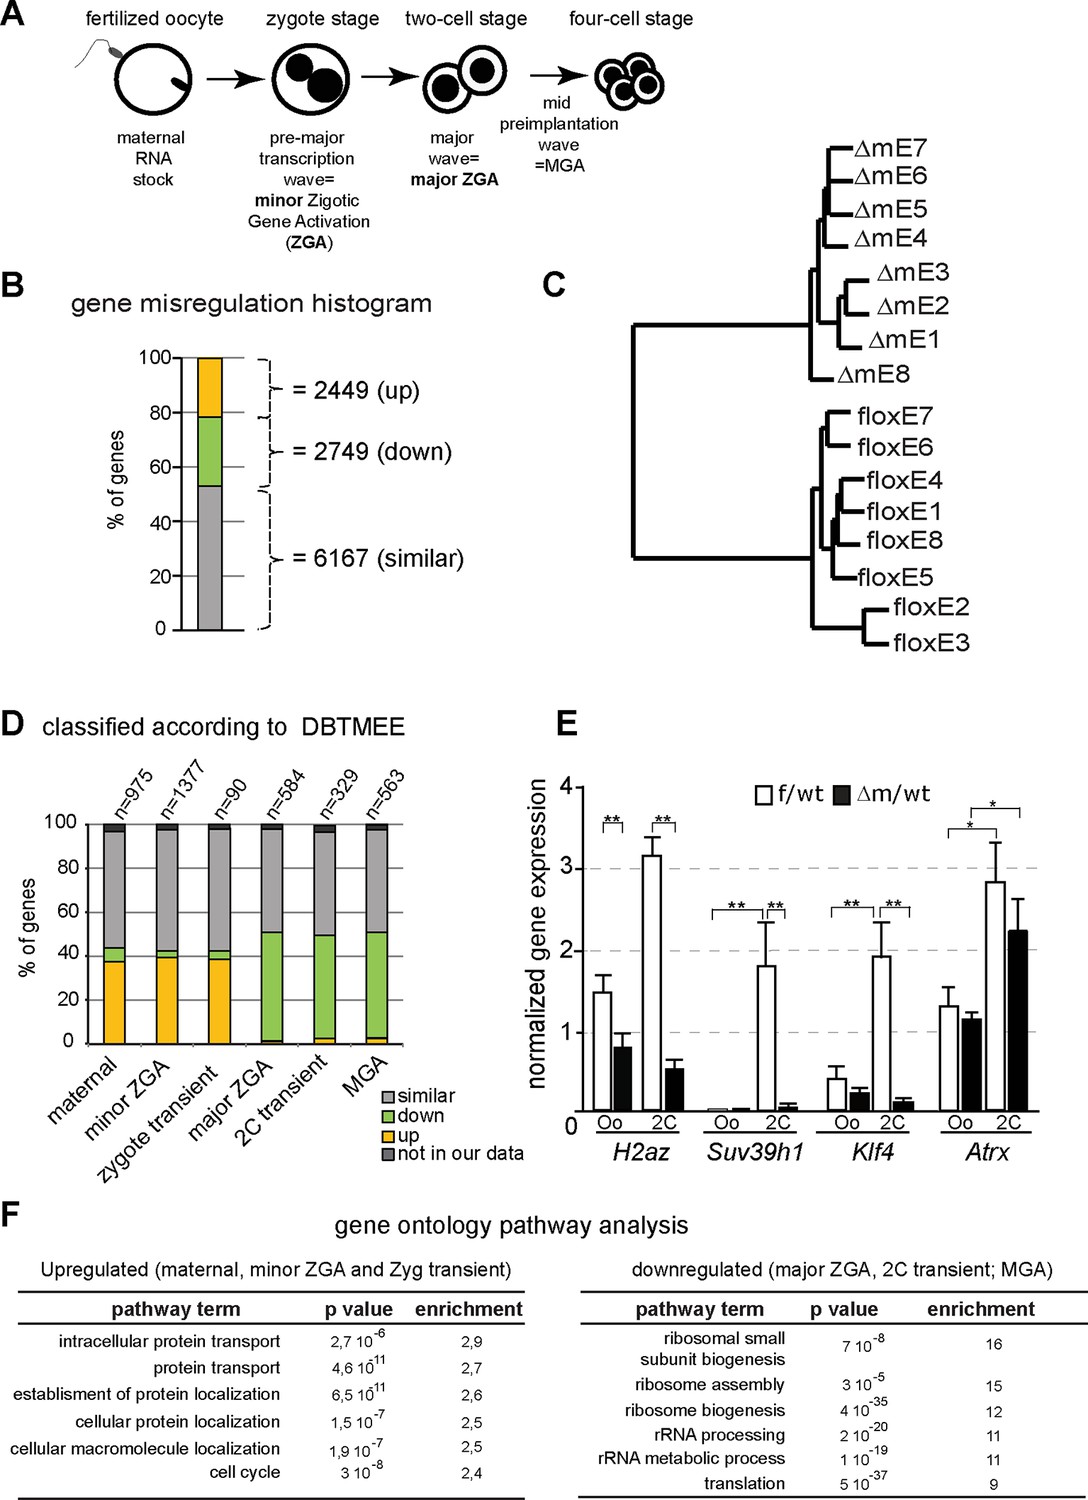
(A) Schematic illustration of the sequential sources of RNA pool over embryonic development. (B) Histogram shows the percent of differentially expressed genes in the △m/wt versus f/wt embryos. Fold difference (in log2) is annotated as upregulated (with log2≥ 1; yellow), downregulated (as log2≤-1; green) and similar (as 1<log2>-1; grey). Number of genes is indicated on the right of the graph. Details concerning the RNA seq analysis are described in Materials and Methods section and Supplementary file 1 (C) Hierarchical clustering analysis for gene expression pattern of 16 libraries shows dramatic expression changes between f/wt (floxE1 to E8) and △m/wt (△mE1 to E8) two-cell stage embryos. See also Figure 4—figure supplement 2 for analysis between two-cell stage and oocyte transcriptomes (D) RNA-seq data comparison with the different categories of the gene catalogue available at the Database of Transcriptome in Mouse Early Embryos (DBTMEE) generated an the ultralarge-scale transcriptome analysis (Park et al., 2013). The total number of genes belongings to each class and found in our RNA seq is indicated on top of the graph (see also Table 1). (E) Graphical representation of the normalized mean expression levels ± sem for chromatin-encoding genes in f/wt (in white) or △m/wt (in black) MII oocytes (Oo, n = 7) and two-cell stage embryos (2C, n = 10). *corresponds to p<0.05 and ** to p<0.001. (F) Top 6 representative GO terms (biological functions) enriched in △m/wt mutant embryos. Fold overrepresentation indicates the percentage of misregulated genes in a particular category over the percentage expected on the basis of all GO-annotated genes present within the sequencing. p-value indicates the significance of the enrichment.
Figure 4—figure supplement 1
Immunostainings and RTqPCR analysis for assessing transcription of Kdm1a mutant two-cell stage embryos.
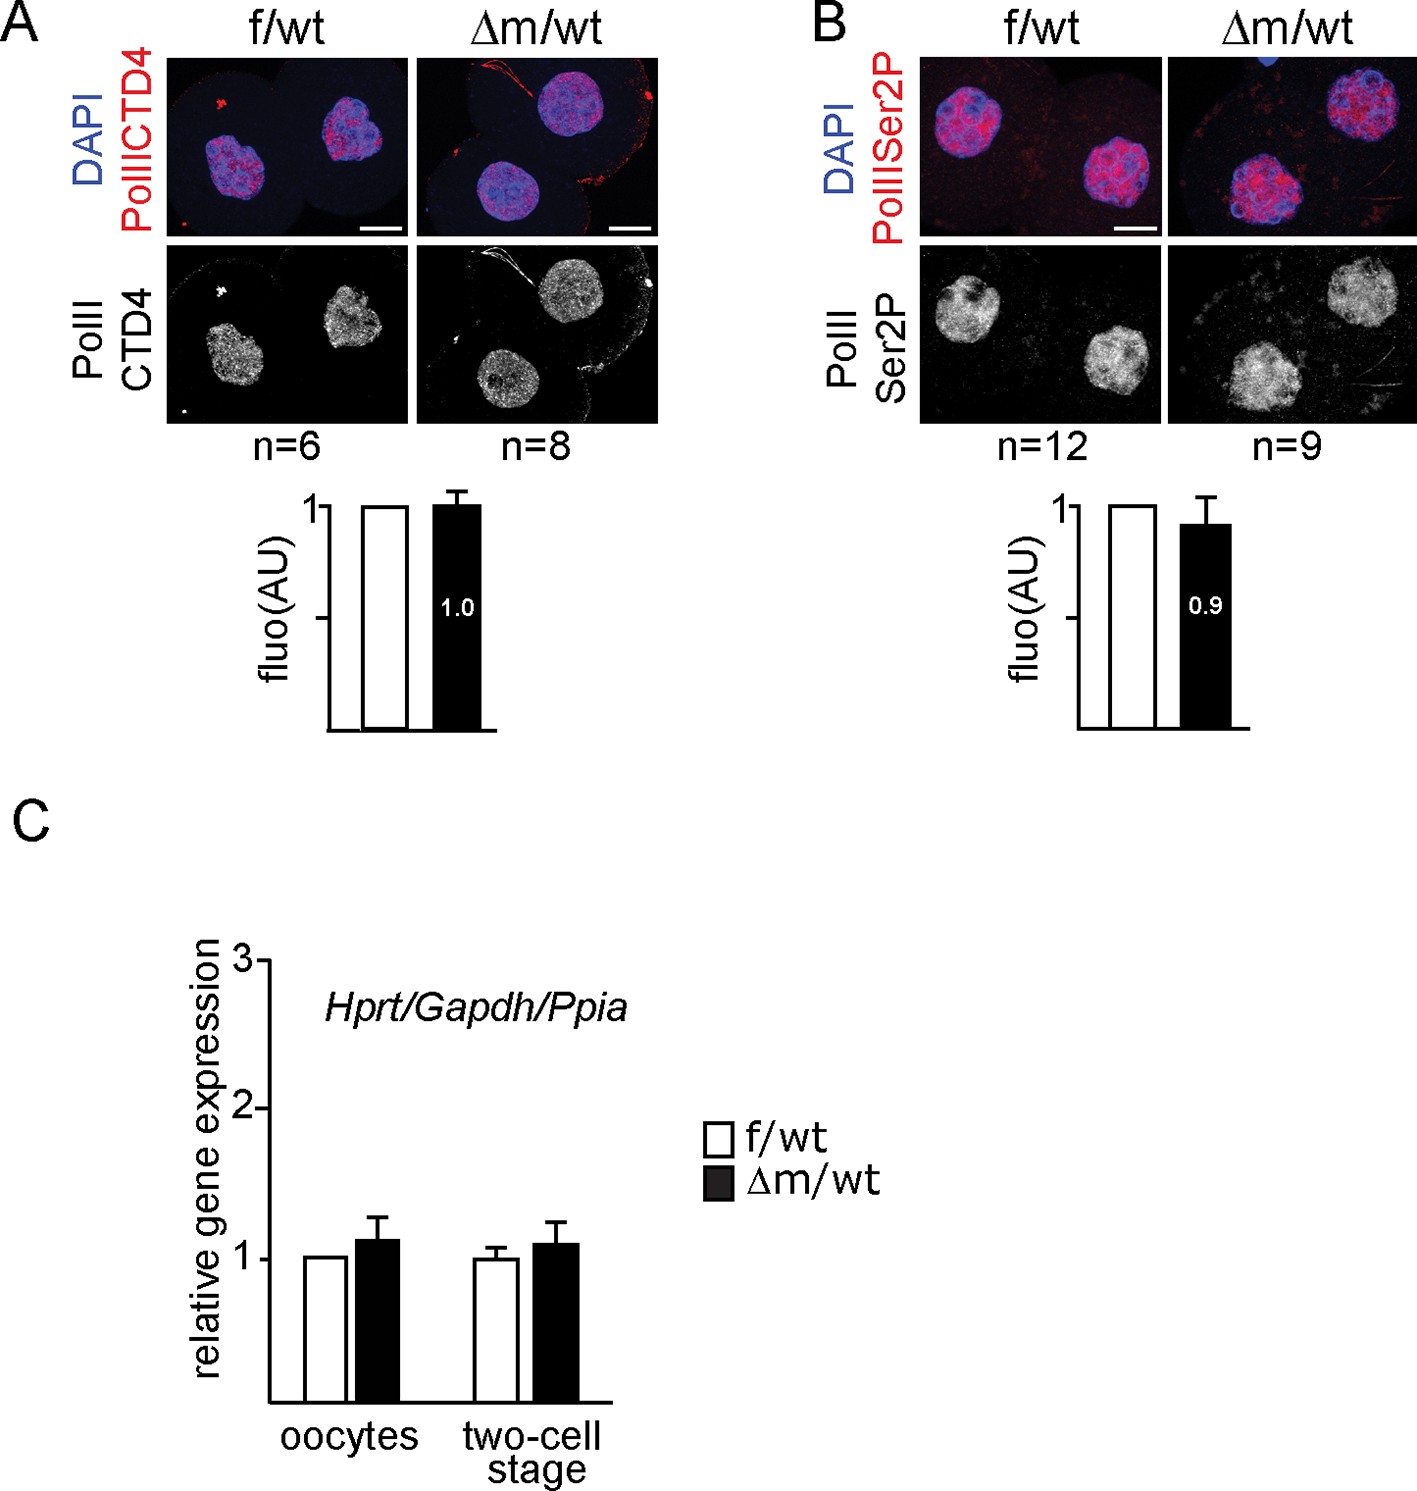
(A, B) Example of IF using anti-PolIICTD antibodies (A) or anti-PolII Ser2P (B) for f/wt control and Δm/wt mutant two-cell stage embryos with below the mean ± s.e.m fluorescence graphical representation (AU) of Δm/wt mutant embryos (in black) relative to f/wt control embryos (in white). Number of processed embryos is indicated under each image. Antibody signal in red, DAPI is blue. Scale bar, 10 μm. (C) Graphical representation of qPCR analysis for individual oocyte or two-cell stage embryos (f/wt control in white, n = 10 or Δm/wt mutant in black, n = 11) plotting the mean expression levels ± sem of three housekeeping genes Gapdh, Hprt and Ppia (according to GeNorm application).
Figure 4—figure supplement 2
Transcriptome analysis of Kdm1a mutant versus control in oocytes or two-cell stage embryos.
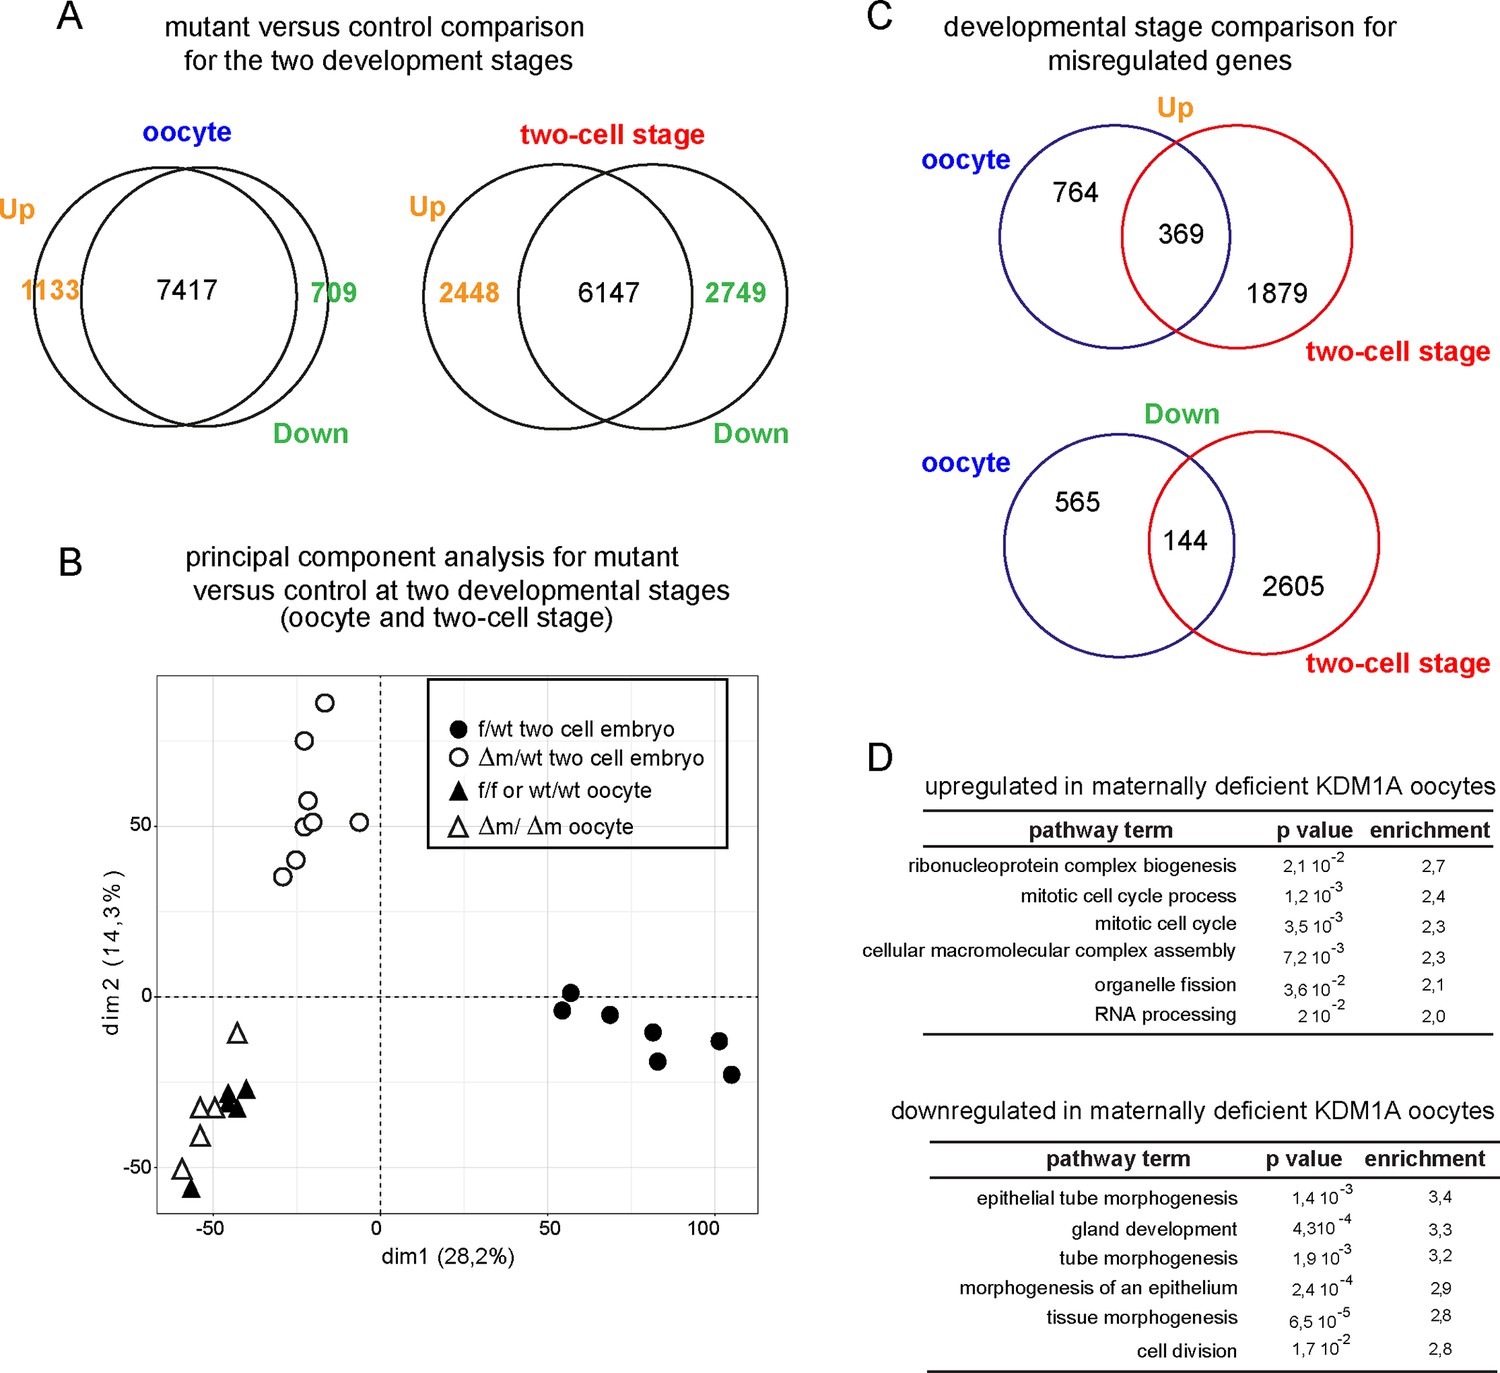
(A) Venn diagrams show the numbers of differentially expressed genes in absence of KDM1A, when considering a fold difference (in log2) annotated as upregulated (with log2≥ 1) or downregulated (with log2≤-1) for two-cell stage embryos or ovulated oocytes (B) Principal component analysis for gene expression pattern of all libraries shows dramatic expression changes between f/wt and Δm/wt two- cell stage embryos, as well as with oocytes from both genotypes. (C) Venn diagram between oocyte stage or two-cell embryos for upregulated genes or down regulated genes (when comparing mutants to controls). (D) Top 6 representative GO terms (biological functions) enriched in oocytes maternally deficient for KDM1A. Fold overrepresentation indicates the percentage of misregulated genes in a particular category over the percentage expected on the basis of all GO-annotated genes present within the sequencing. p-value indicates the significance of the enrichment.
Figure 5 with 2 supplements
Increased LINE-1 protein levels and γH2AX foci in two-cell embryos depleted for KDM1A.
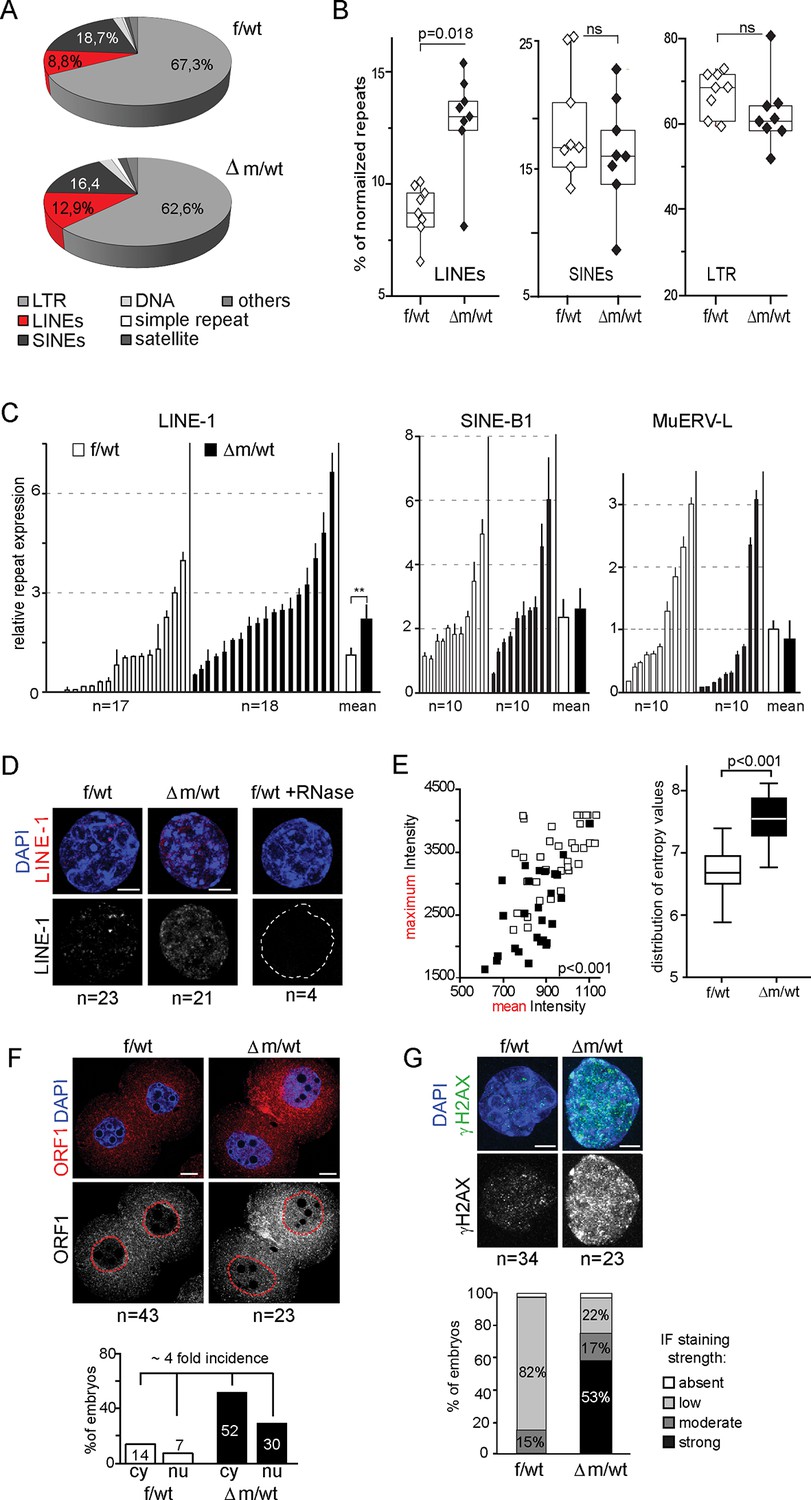
(A) Pie chart representing the percent of each category of repeats analyzed in our 16 RNA-seq data of individual embryos. (B) Box-plot for percent of LINEs, SINEs and LTR element expression for f/wt (white) or △m/wt (black) embryos over the total of reads mapping repeats for each of our 16 samples of RNA-seq. Details of the analysis are in experimental analysis. (C) qPCR analysis for LINE-1, SinesB1 and MuERV-L expression levels from individual two-cell stage cDNAs of f/wt (white) or △m/wt (black). Each embryo is represented as a single bar. Data are expressed as normalized expression to three house-keeping genes. On the right of each graph is represented the mean ± sem. Two asterisks indicate p<0.01 as calculated using a Student’s t-test. (D) Nascent LINE-1 transcripts are detected by RNA FISH (signal in red) using a TCN7 probe on f/wt or △m/wt two-cell stage embryos. RNAse A treated control embryos processed in parallel display no signal for RNA transcription. Also see Figure 5—figure supplement 1 for Atrx expression control. (E) Quantification of LINE-1 RNA FISH. On the left, the graph represents the fluorescent quantification with the mean intensity of fluorescence plotted on the x axis against the respective maximum intensity on the y axis) for each nucleus of the two–cell embryos for the two populations (white squares = f/wt controls and black square = △m/wt mutants). On the right, box-plot representation of the entropy levels analysis of the RNA FISH images for the control versus mutant embryos as defined by Haralick parameters measuring the pattern of the image with each dot corresponding to a f/wt (white) or △m/wt (black) nucleus.P value is calculated with a student T-test and indicated that the two populations are significantly different. (F) IF of two-cell stage embryos using anti-ORF1 antibodies (in red). A dotted line indicates the nucleus. Below is the graphical representation of the percentage of embryos displaying enriched fluorescent signal in either the cytoplasm (cy) or the nucleus (nu) for f/wt or △m/wt embryos. (G) IF of two-cell stage embryos using antibodies directed against phosphorylated histone H2A variant X (γH2AX, in green) for f/wt and △m/wt. Below is the corresponding quantification of embryo percentage according to the strength of γH2AX staining. DNA is counterstained by DAPI (blue). Number of processed embryos is indicated. Scale bar, 2 μm (D, G)) 10 μm (F).
Figure 5—figure supplement 1

RNA FISH controls for LINE-1 ongoing transcription.
RNA FISH using a probe recognizing the Atrx genomic locus (signal in red; DAPI is blue) on two-cell stage f/wt control embryo (left) and Δm/wt mutant embryo (right). Numbers of embryo processed and percentage of nuclei showing pinpoints of nascent transcripts by RNA FISH assays are indicated under each genotype.
Figure 5—figure supplement 2
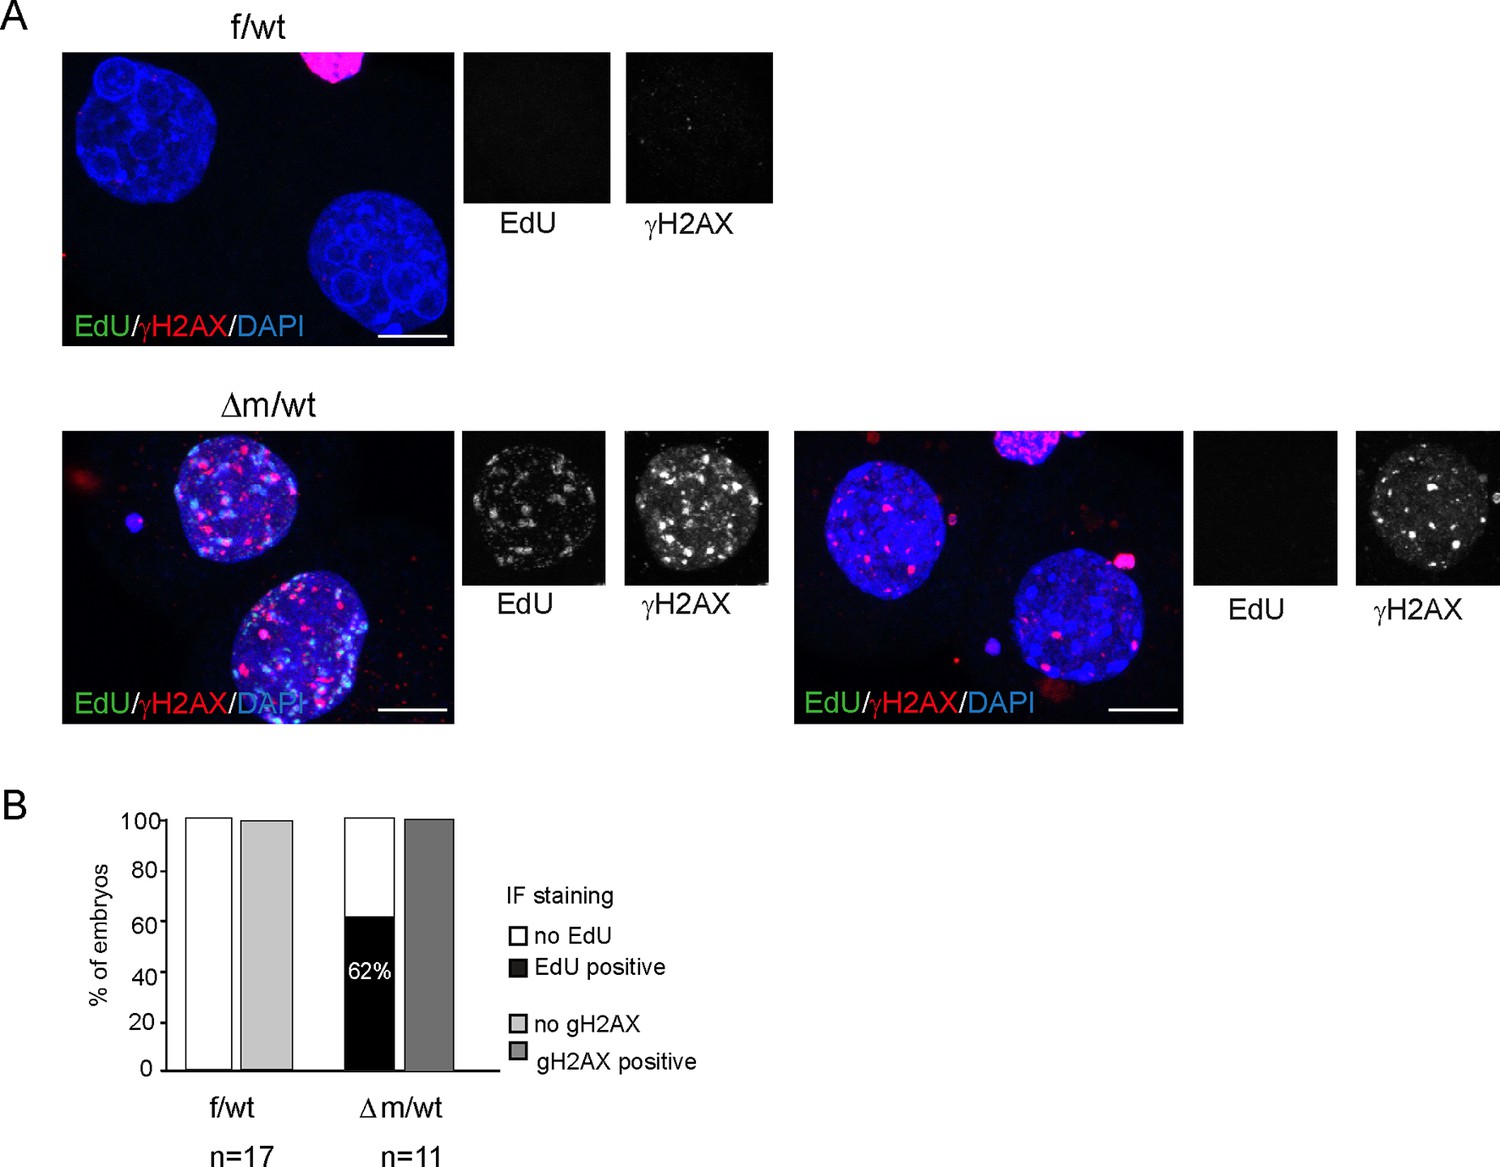
EdU labeling and γH2AX immunofluorescence of Kdm1a mutant versus control two-cell stage embryos.
(A) Two-cell stage embryos (f/wt and Δm/wt) were collected at 40–41 hr post hCG and culture for EdU pulse for 45 min. After fixation, they were analyzed by Click -It reaction to reveal the incorporated EdU (shown in green), then subjected to immunostaining for γH2AX (shown in red). DNA is counterstained with DAPI (in blue). Shown are maximal projection of confocal z series of representative embryos. f/wt control embryo n = 17 and Δm/wt mutant embryo n = 11. Scale bar, 10 μm. (B) quantification of embryo percentage according to the presence of EdU incorporation or γH2AX immunofluorescence.
Author response image 1
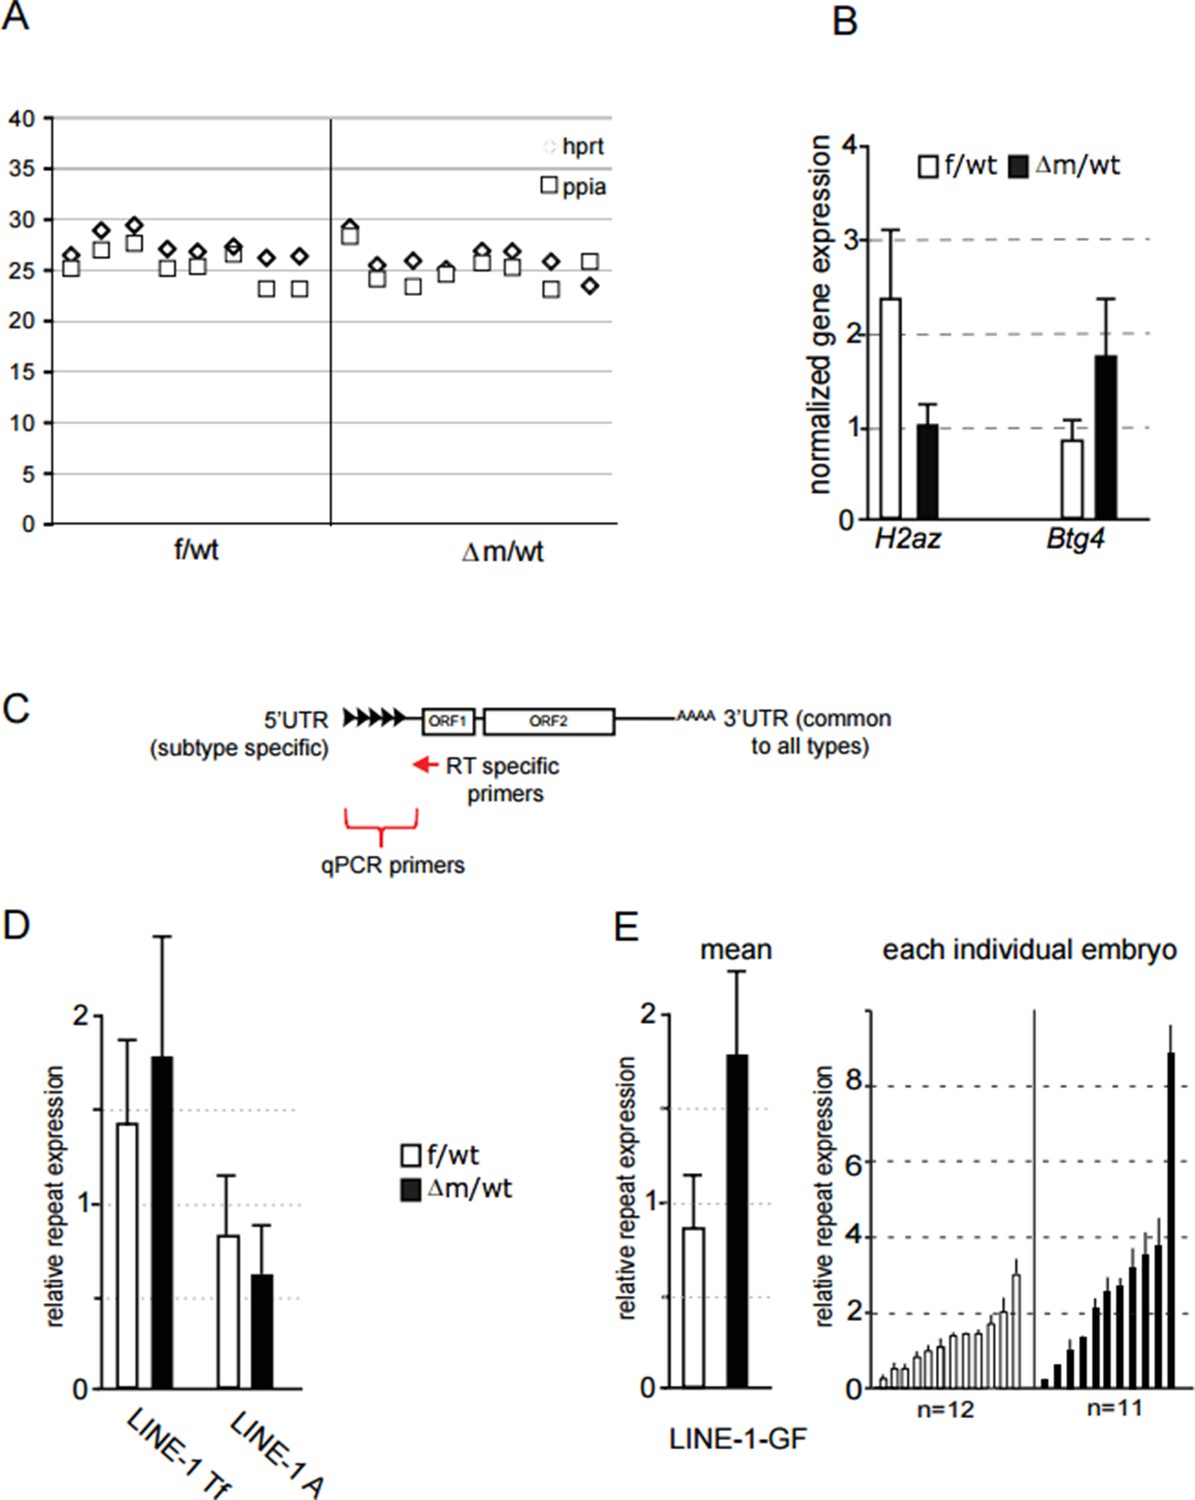
(A) Ct value of qPCR with cDNA obtained using specific primers against hprt and ppia for reverse transcription.
Each row corresponds to one embryo (two-cell stage). This graph shows the reproducibility and good amplification between samples. (B) Graphical representation of the normalized expression level (mean ± sem) as determined by qPCR for H2AZ and Btg4, two genes found respectively down and up regulated in our RNA seq. Data are expressed as normalized expression to the two house-keeping genes shown in A. (C) schematic representation of LINE-1 elements with the region targeted by RT specific primers and the 5' region used to design qPCR primers for each family. (D;E) qPCR analysis for LINE-1 Tf, A and Gf expression levels. The graph shows the normalized expression level for the mean ± sem (D; E left) or the normalized expression from individual embryos represented as a single bar (E right). f/wt Control are in white and Δm/wt mutant are in black.
Author response image 2
Tables
Table 1
Comparing the two-cell stage transcriptome of the Kdm1a mutant embryos to DBTMEE Numbers of genes found for the comparison of our two-cell stage RNA-seq data with the different categories for the gene catalogue found in DBTMEE. Total genes considered = 3811 and total genes changed = 1818 (48%). Our dataset cover the genes categorized on the public resource with a minimum of 96% of genes.
| Up | Down | Similar | Not in our data | Total in DBTMEE | |
|---|---|---|---|---|---|
| maternal | 360 | 63 | 521 | 31 | 975 |
| minor ZGA | 540 | 47 | 750 | 40 | 1377 |
| 1C transient | 34 | 4 | 51 | 1 | 90 |
| major ZGA | 10 | 297 | 297 | 10 | 584 |
| 2C transient | 8 | 156 | 156 | 12 | 329 |
| MGA | 13 | 286 | 286 | 13 | 563 |
Additional files
-
Supplementary file 1
Summary of RNA seq data for control and maternally depleted oocytes or two-cell stage embryos.
Statistical analysis of all the single oocyte or individual two-cell stage embryo RNA-seq used in this study. Datasets are available from GEO under access number GSE75054 and GSE68139.
- https://doi.org/10.7554/eLife.08851.016
-
Supplementary file 2
Differential gene expression at the two-cell stage and oocyte stage upon loss of maternal KDM1A.
The DESeq R package was used to normalize and identify the differentially expressed genes between control and mutant embryos. Genes with 0 counts in all samples were filtered out and only the 60% of the top expressed genes were used for the analysis Differentially expressed genes were identified using a minimum Log2>1 (upregulation) or <-1 (downregulation) fold change (FC) and with an adjusted p-value lower than α = 0.05.
- https://doi.org/10.7554/eLife.08851.017
Download links
A two-part list of links to download the article, or parts of the article, in various formats.
Downloads (link to download the article as PDF)
Open citations (links to open the citations from this article in various online reference manager services)
Cite this article (links to download the citations from this article in formats compatible with various reference manager tools)
Maternal LSD1/KDM1A is an essential regulator of chromatin and transcription landscapes during zygotic genome activation
eLife 5:e08851.
https://doi.org/10.7554/eLife.08851


