The serine protease hepsin mediates urinary secretion and polymerisation of Zona Pellucida domain protein uromodulin
- San Raffaele Scientific Institute, Italy
- Karolinska Institutet, Sweden
- FIRC Institute of Molecular Oncology, Italy
- University of Zurich, Switzerland
- Lerner Research Institute, United States
- University of Lausanne, Switzerland
Figures
Figure 1
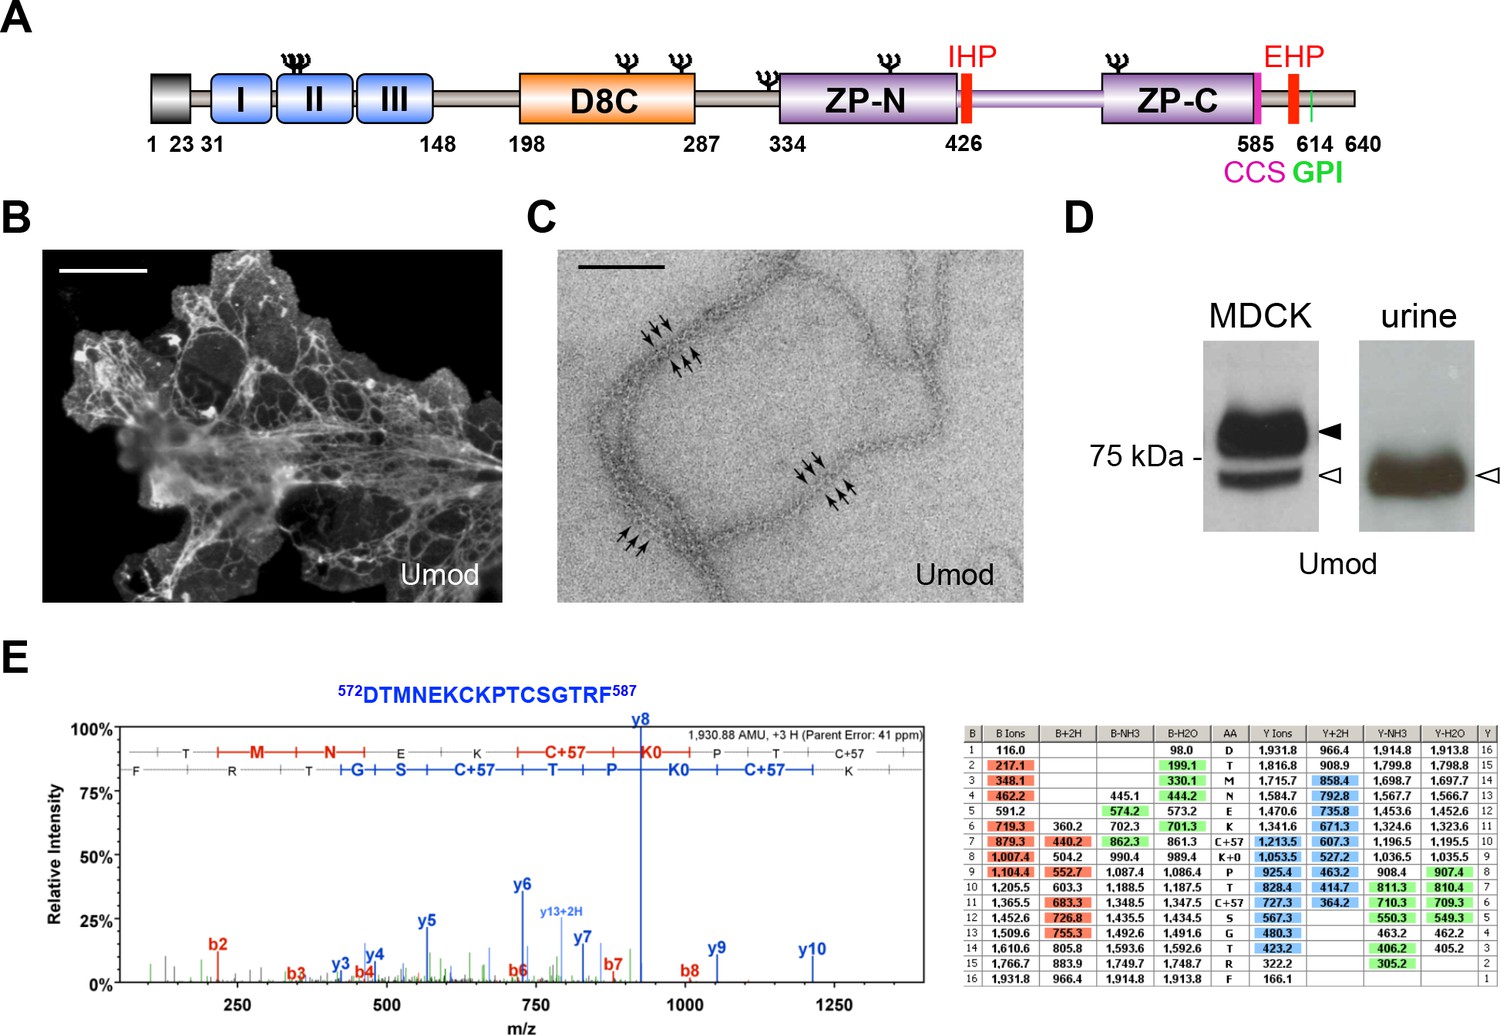
MDCK cells as a model to study physiological uromodulin shedding.
(A) Schematic representation of human uromodulin domain structure containing a leader peptide (predicted to be cleaved at residue 23), three EGF-like domains, a central domain with 8 conserved cysteines (D8C), a bipartite Zona Pellucida (ZP) domain (ZP-N/ZP-C) and a glycosylphosphatidylinositol (GPI)-anchoring site (predicted at position 614). Internal (IHP) and External (EHP) Hydrophobic Patches (Jovine et al., 2004; Schaeffer et al., 2009), Consensus Cleavage Site (CCS) and seven N-glycosylation sites (Ψ) are also indicated. (B) Immunofluorescence analysis of non-permeabilised MDCK cells expressing uromodulin. Polymers formed by the protein are clearly detected on the cell surface. Scale bar, 50 µm. (C) Electron microscopy analysis of uromodulin polymers purified from the medium of MDCK cells. The arrows indicate the typical protrusions of uromodulin filaments spaced about 130 Å. Scale bar, 100 nm. (D) Representative Western blot analysis of N-deglycosylated uromodulin secreted by transfected MDCK cells or purified from urine. A single isoform is clearly seen in the urinary sample. An isoform with similar molecular weight is released by MDCK cells (white arrowhead), which also secrete a longer and more abundant one (black arrowhead). (E) Representative tandem mass-spectrometry (MS/MS) spectrum confirming the identity of the C-terminal peptide 572DTMNEKCKPTCSGTRF587 of the short uromodulin isoform released by MDCK cells and table of fragmented ions. The C-terminal residue F587 is identical to the one that we mapped in human urinary protein (Santambrogio et al., 2008).
Figure 2 with 2 supplements
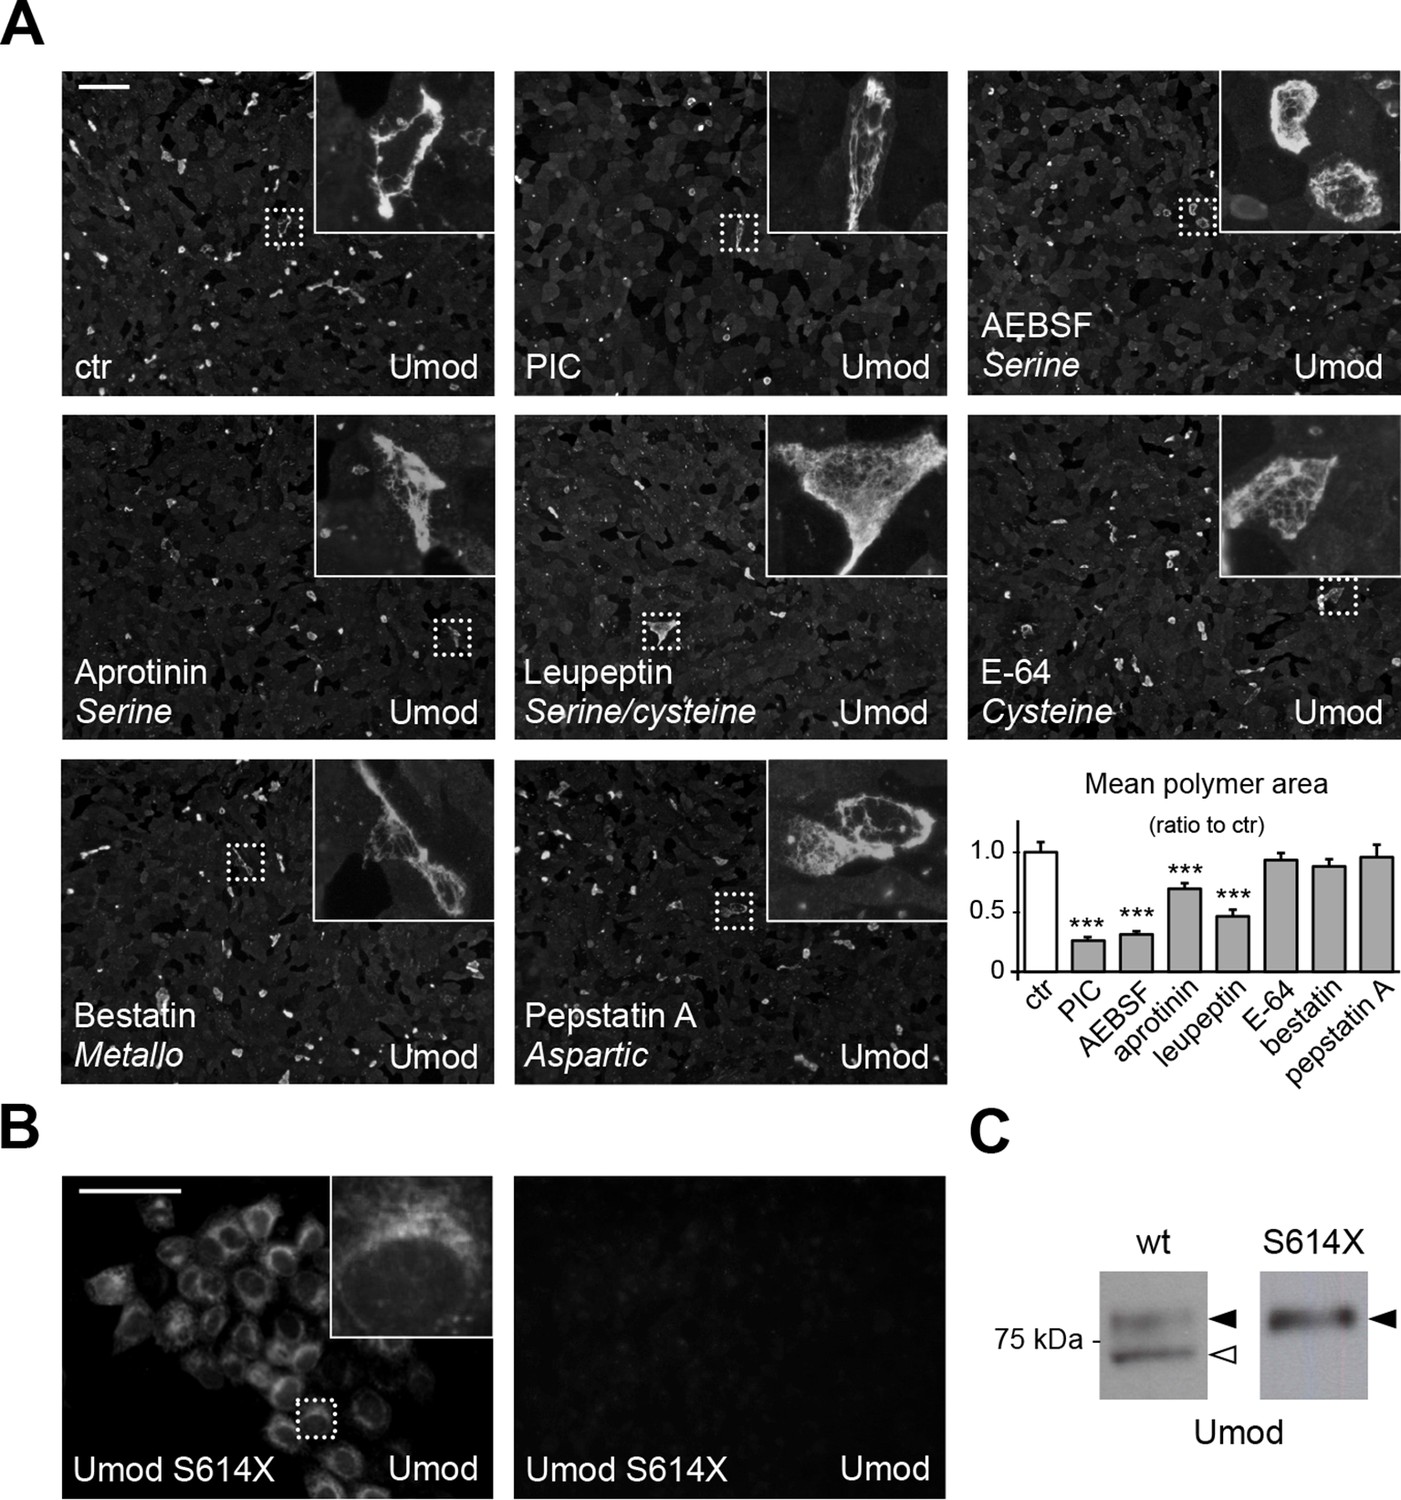
A serine protease is responsible for the release of polymerisation-competent uromodulin.
(A) Immunofluorescence analysis showing uromodulin on the surface of MDCK cells treated with vehicle (DMSO) (ctr), protease inhibitor cocktail (PIC) or single PIC components, as indicated. Scale bar, 50 µm. Quantification of the average surface of uromodulin polymers shows that only treatment with PIC or with specific serine protease inhibitors (AEBSF, aprotinin and leupeptin) significantly reduces uromodulin polymerisation on the surface of MDCK cells. Bars indicate average ± s.e.m. ***p<0.001 (Mann-Whitney test). The graph represents mean ratios of 3 independent experiments (Figure 2—source data 1). (B) Immunofluorescence analysis of permeabilised (left) or non-permeabilised (right) MDCK cells expressing soluble uromodulin mutant S614X. Uromodulin polymerisation is abolished by preventing its association to the membrane. Scale bar, 50 µm. (C) Representative Western blot analysis of N-deglycosylated uromodulin secreted by MDCK cells expressing wild-type or soluble (S614X) uromodulin. Lack of plasma membrane anchoring does not affect uromodulin secretion but it abolishes its cleavage at the physiological site (white arrowhead).
-
Figure 2—source data 1
Quantification of the area of uromodulin polymers on the surface of MDCK cells after protease inhibitor treatment (Figure 2A).
- https://doi.org/10.7554/eLife.08887.005
-
Figure 2—source data 2
Short cleavage inhibition by HAI-1 expression (Figure 2—figure supplement 2C).
- https://doi.org/10.7554/eLife.08887.006
Figure 2—figure supplement 1
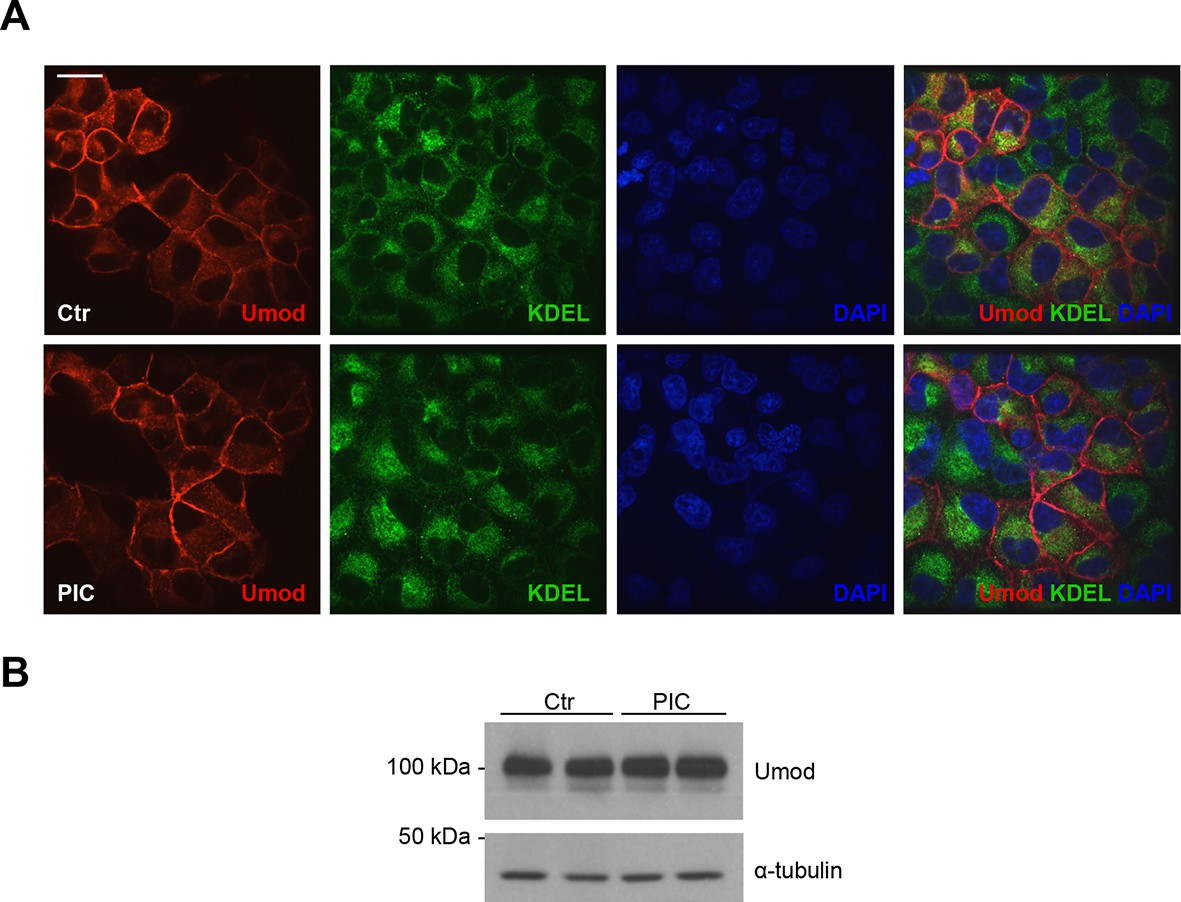
PIC treatment does not affect uromodulin intracellular distribution and expression.
(A) Immunofluorescence analysis showing intracellular distribution of uromodulin in MDCK cells treated with vehicle (DMSO) (ctr) or protease inhibitor cocktail (PIC). KDEL is a marker of the endoplasmic reticulum (ER). Scale bar, 16 µm. (B) Representative Western blot analysis of uromodulin in lysates of MDCK cells under the same conditions as above. The upper band corresponds to the mature, fully glycosylated protein, the lower band corresponds to the immature protein carrying ER-type glycosylation (Schaeffer et al., 2012). Alpha-tubulin is shown as a loading control. PIC treatment does not alter uromodulin intracellular distribution nor its expression.
Figure 2—figure supplement 2
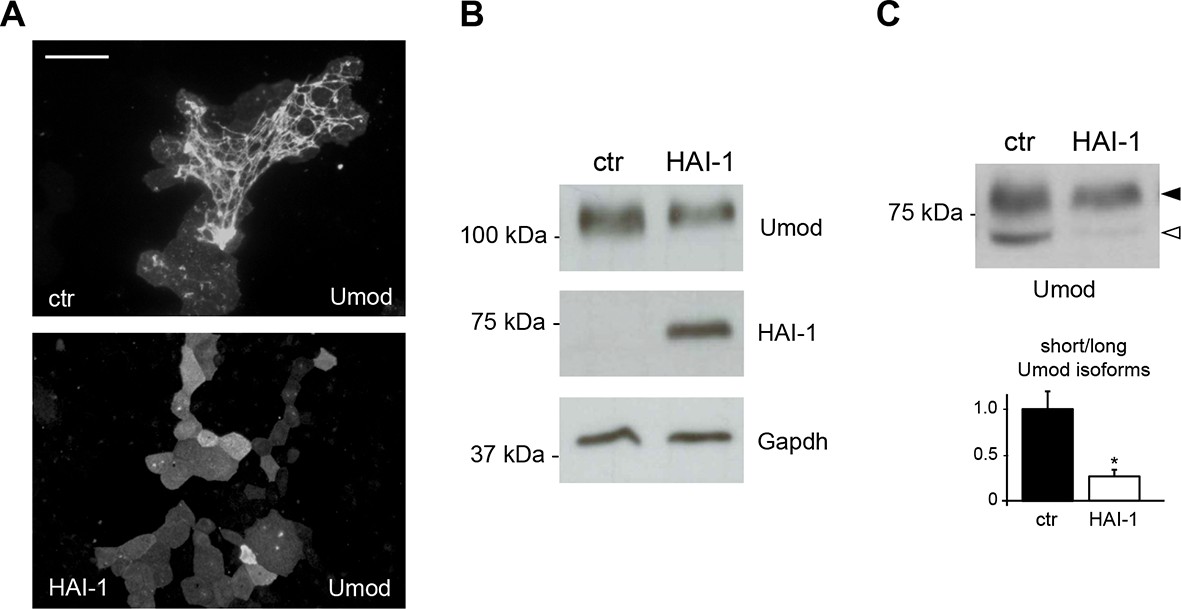
Expression of the serine protease inhibitor HAI-1 effectively reduces uromodulin cleavage at the urinary site.
(A) Immunofluorescence analysis showing uromodulin on the surface of MDCK cells co-expressing the serine protease inhibitor HAI-1 (Hepatocyte growth factor Activator Inhibitor-1), as indicated. HAI-1 expression essentially abolishes uromodulin polymerisation on the cell surface. Scale bar, 50 µm. (B) Representative Western blot analysis showing uromodulin and HAI-1 expression in cell lysates of transfected MDCK cells, as indicated. Glyceraldehyde-3-phosphate dehydrogenase (Gapdh) is shown as a loading control. (C) Representative Western blot analysis of N-deglycosylated uromodulin secreted by MDCK cells co-expressing HAI-1, as indicated. Densitometric analysis (average ± s.d. of 3 independent experiments, Figure 2—source data 2) shows the ratio between the short and the long uromodulin isoforms in the absence or presence of HAI-1 co-expression, as indicated. The serine protease inhibitor HAI-1 strongly reduces the amount of the short uromodulin isoform released in the culturing medium by MDCK cells. *p<0.05 (Student’s t test).
Figure 3 with 1 supplement

Hepsin and prostasin interact with uromodulin to induce its cleavage and polymerisation.
(A) Immunofluorescence analysis (extended focus image) showing uromodulin on the surface of HEK293 cells. The protein is not assembled into polymers when expressed in this cellular system. Scale bar, 21 µm. (B) Representative Western blot analysis of N-deglycosylated uromodulin secreted by MDCK and HEK293 cells. HEK293 cells only secrete the longer polymerisation-incompetent uromodulin isoform (black arrowhead), while MDCK cells also secrete the shorter one (white arrowhead). (C) Schematic representation of the selection process employed to identify candidate enzymes for the secretion of the short uromodulin isoform. Only membrane-bound serine proteases specifically expressed by MDCK cells and by the TAL segment of the nephron, but not by HEK293 cells, were selected. (D) Representative Western blot analysis of N-deglycosylated uromodulin secreted by HEK293 cells expressing wild-type or catalytically inactive human hepsin or prostasin, as indicated. Only wild-type proteases promote the secretion of the short uromodulin isoform by these cells (white arrowhead). (E) Immunofluorescence analysis (extended focus image) showing uromodulin on the surface of HEK293 cells expressing wild-type or catalytically inactive hepsin or prostasin, as indicated. Uromodulin polymerisation is induced only when wild-type proteases are expressed. Scale bar, 21 µm. (F) Representative Western blot analysis of uromodulin immunoprecipitation (upper panels) from lysates of HEK293 cells expressing hepsin or prostasin, as indicated. Both enzymes are co-immunoprecipitated when uromodulin is co-expressed in HEK293 cells (lower panels). The arrowheads point at hepsin and prostasin specific bands.
Figure 3—figure supplement 1
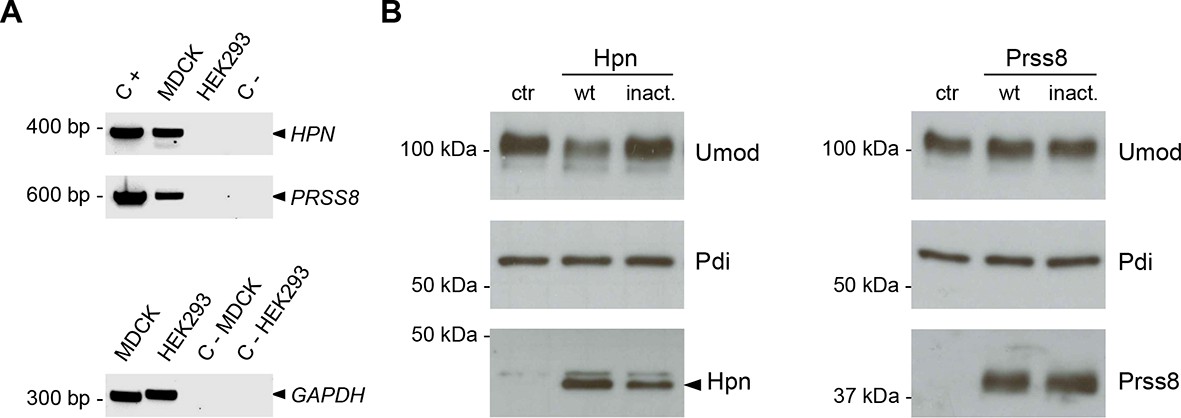
Hepsin and prostasin expression in MDCK and HEK293 cells.
(A) RT-PCR analysis showing gene expression of candidate proteases hepsin (HPN) and prostasin (PRSS8) in MDCK and HEK293 cells. Constructs containing coding sequences of the human proteases were used as PCR positive controls (C+). Expression of GAPDH is shown as a cDNA positive control. PRSS8 and HPN are exclusively expressed in MDCK cells, confirming data obtained from available transcriptomes. (B) Representative Western blot analysis of uromodulin, hepsin and prostasin in lysates of transfected HEK293 cells. Wild-type proteases as well as catalytically inactive enzymes were expressed in HEK293 cells, as indicated. Protein disulfide-isomerase (Pdi) is shown as a loading control. The arrowhead points at hepsin specific band.
Figure 4
Hepsin and prostasin directly cleave uromodulin in vitro.
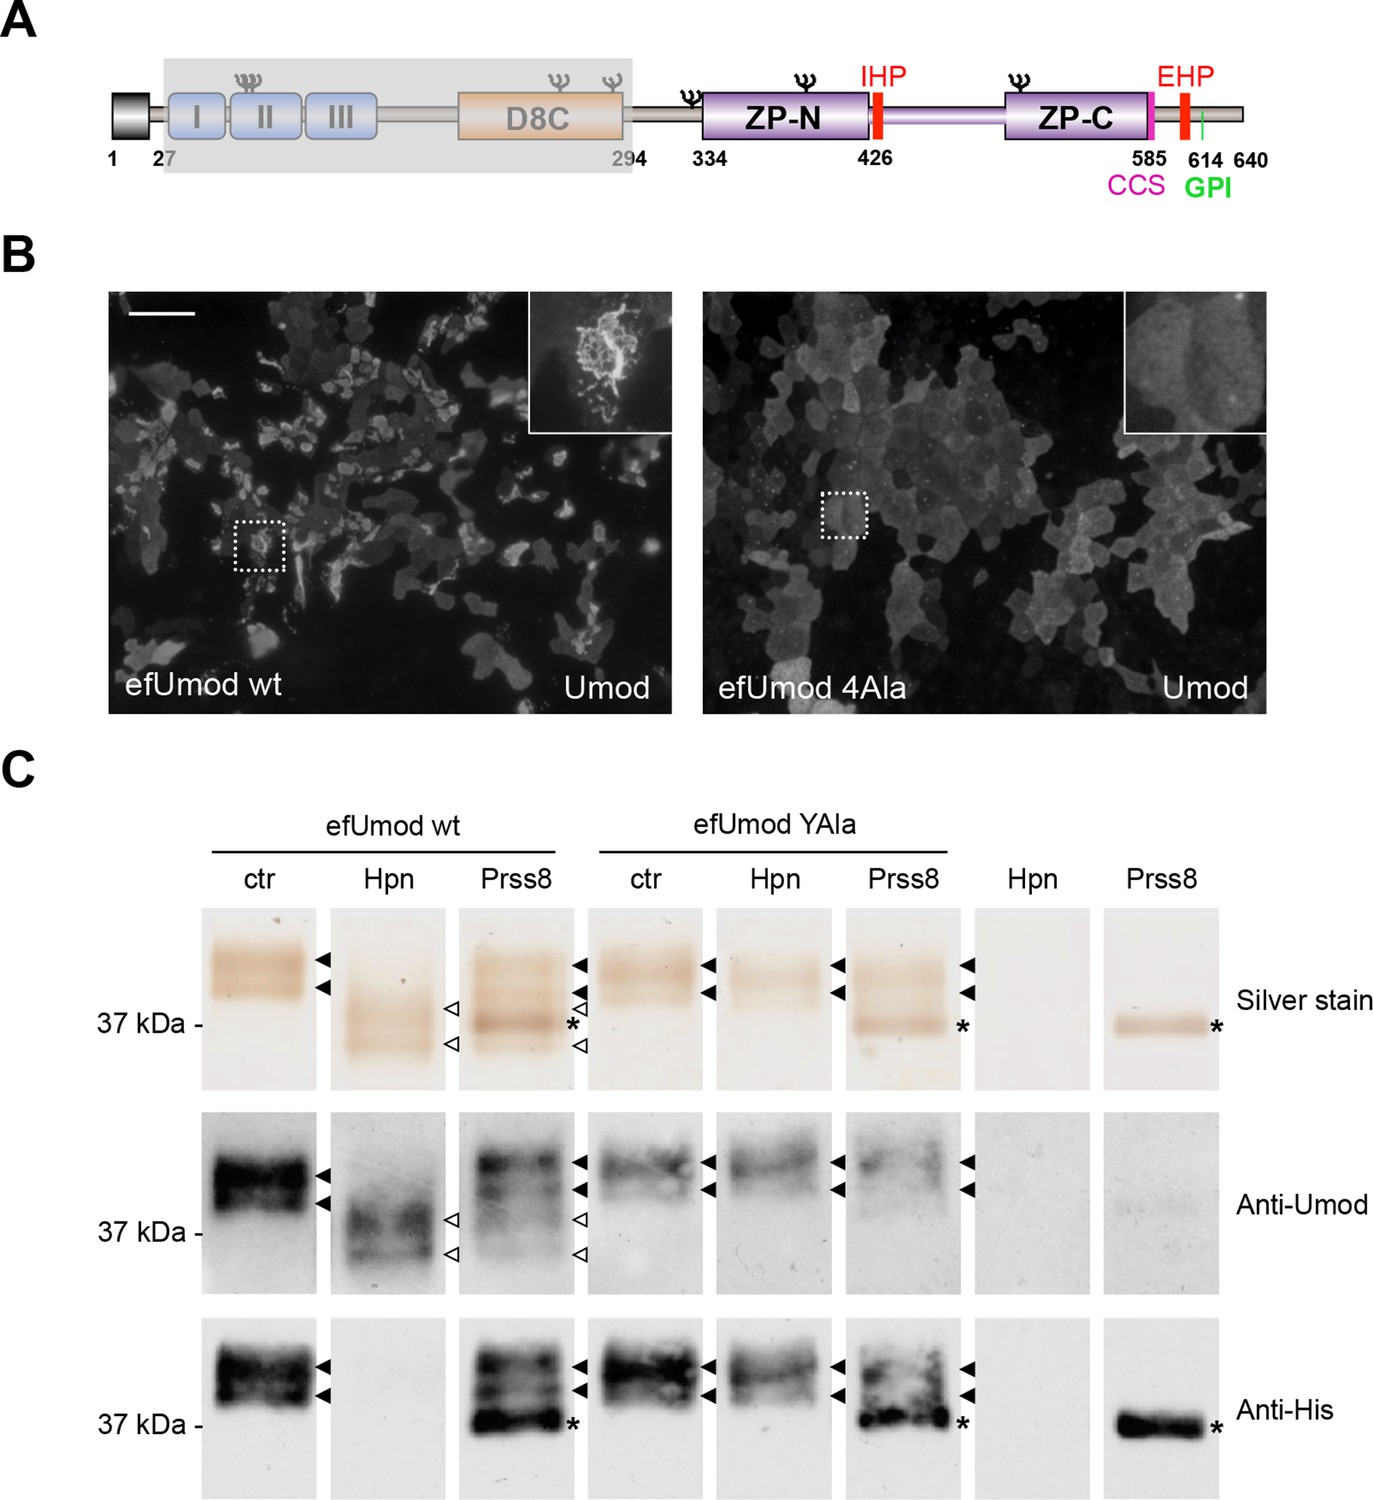
(A) Schematic representation of human uromodulin domain structure as shown in Figure 1A. The region not included in recombinant efUmod is shadowed. (B) The deletion of the elastase-sensitive fragment of uromodulin does not affect protein polymerisation on the surface of MDCK cells, as shown by immunofluorescence analysis (efUmod wt). As for full-length uromodulin (Schaeffer et al., 2009), this process depends on correct protein cleavage at the physiological site, since it is abolished when the consensus cleavage site is mutated (efUmod 4Ala, carrying the mutation 586RFRS589 > 586AAAA589). Scale bar, 50 µm. (C) Purified efUmod, either wild-type (efUmod wt) or mutated at the consensus cleavage site (efUmod YAla, carrying the mutation 586RFRS589 > 586AYAA589), was incubated with recombinant prostasin or hepsin, as indicated. Both proteases decrease the mass of wild-type efUmod (white arrowheads in upper and middle panels) and cause the loss of its C-terminal His-tag (lower panel). Hepsin is more efficient than prostasin, as it drives complete digestion of the product, despite being used at 20x lower concentration (picomolar ratio between protease and efUmod was 1:100 for hepsin and 1:5 for prostasin, see lanes 7 and 8 for comparison). The asterisk indicates His-tagged prostasin.
Figure 5
Hepsin is the protease mediating uromodulin polymerisation in MDCK cells.
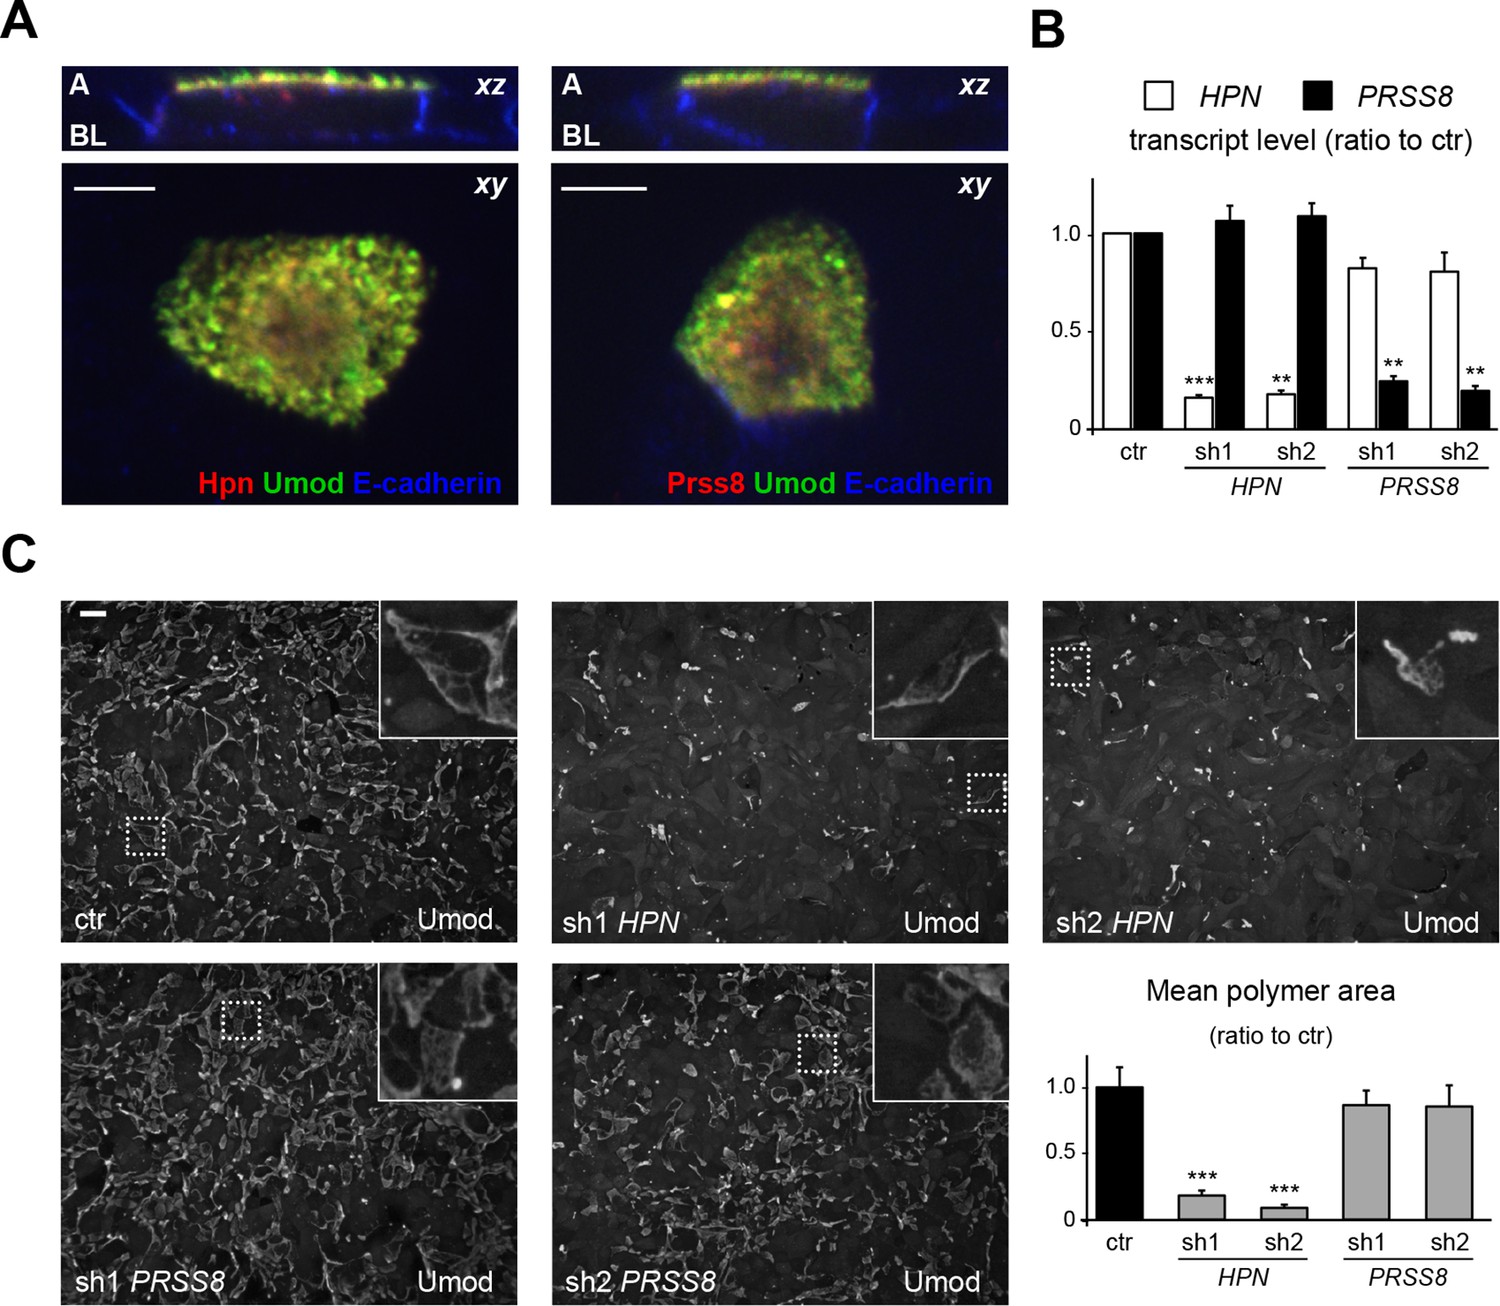
(A) Confocal immunofluorescence analysis showing uromodulin (green), hepsin or prostasin (red) and E-cadherin (blue) (basolateral membrane marker) in polarised MDCK cells, as indicated. Upper panels represent the reconstruction on the xz axis of merged xy scans, for which a representative image is shown in lower panels. Both serine proteases co-localise with uromodulin on the apical plasma membrane of polarised MDCK cells. z stacks = 0.3 µm. A: apical, BL: basolateral. Scale bars, 5 µm. (B) Transcript levels of HPN and PRSS8, as assessed by Real-Time qPCR in MDCK cells transfected with shRNA vectors, as indicated. Expression values (normalised to glyceraldehyde-3-phosphate dehydrogenase, GAPDH) are shown as relative to cells transfected with control vector. Expression of the proteases is specifically reduced in silenced cells. Bars indicate average ± s.e.m. **p<0.01, ***p<0.001 (Student’s t test). The graph represents mean ratios of 3 independent experiments (Figure 5—source data 1). (C) Immunofluorescence analysis showing uromodulin on the surface of MDCK cells transfected with control vector or with shRNA vectors targeting hepsin or prostasin, as indicated. Scale bar, 50 µm. Quantification of the average surface of uromodulin polymers shows that silencing of hepsin, but not of prostastin, substantially reduces uromodulin polymerisation on the membrane of MDCK cells. Bars indicate average ± s.e.m. ***p<0.001 (Mann-Whitney test). The graph represents mean ratios of 3 independent experiments (Figure 5—source data 2).
-
Figure 5—source data 1
Transcript level of HPN and PRSS8 in MDCK cells after shRNA transfection (Figure 5B).
- https://doi.org/10.7554/eLife.08887.013
-
Figure 5—source data 2
Quantification of the area of uromodulin polymers on the surface of MDCK cells after shRNA transfection (Figure 5C).
- https://doi.org/10.7554/eLife.08887.014
Figure 6

Defective uromodulin urinary secretion in mice lacking hepsin.
(A) Transcript level of Hpn, as assessed by Real-Time qPCR on microdissected nephron segments (normalised to Gapdh). Expression of Hpn is detected in proximal straight tubules (PST), thick ascending limb (TAL), proximal convoluted tubules (PCT), distal convoluted tubules (DCT) and, to a lesser extent, in collecting ducts (CD). Minimal expression of the protease is detected in glomeruli (GI). Bars indicate average ± s.e.m. of 3 independent experiments (Figure 6—source data 1). (B) Immunofluorescence analysis of mouse kidney sections showing co-localisation of endogenous hepsin and uromodulin on the apical plasma membrane of TAL epithelial cells. Scale bar, 20 µm. (C) Representative Western blot analysis of urinary uromodulin secretion in Hpn-/- mice or control animals. Urinary protein loading was normalised to urinary creatinine concentration. Densitometric analysis shows reduced uromodulin urinary secretion in animals lacking hepsin (average ± s.d., n = 10/group, Figure 6—source data 2). ***p<0.001 (Student’s t test). (D) Western blot analysis of uromodulin in kidney lysates of Hpn-/- mice or control animals. Beta-actin is shown as a loading control. Densitometric analysis shows accumulation of uromodulin in kidney lysates from Hpn-/- mice (average ± s.d., n = 3/group, Figure 6—source data 3). **p<0.01 (Student’s t test). (E) Representative immunofluorescence analysis showing apical plasma membrane signal of uromodulin in kidney sections from Hpn-/- mice or control animals. Scale bar, 50 µm. (F) Transcript level of Umod, as assessed by Real-Time qPCR on total kidney extracts from Hpn-/- mice or control animals (normalised to Hprt1). Expression of Umod is comparable between the two groups of animals (n = 3/group, Figure 6—source data 4). Bars indicate average ± s.e.m. (Student’s t test).
-
Figure 6—source data 1
Transcript level of Hpn in mouse microdissected nephron segments (Figure 6A).
- https://doi.org/10.7554/eLife.08887.016
-
Figure 6—source data 2
Quantification of urinary uromodulin secretion in Hpn-/- and control mice (Figure 6C).
- https://doi.org/10.7554/eLife.08887.017
-
Figure 6—source data 3
Quantification of uromodulin levels in kidney lysates of Hpn-/- and control mice (Figure 6D).
- https://doi.org/10.7554/eLife.08887.018
-
Figure 6—source data 4
Transcript levels of Umod in Hpn-/- and control mice (Figure 6F).
- https://doi.org/10.7554/eLife.08887.019
Figure 7 with 2 supplements
Absence of hepsin in vivo abolishes physiological cleavage and polymerisation of uromodulin.
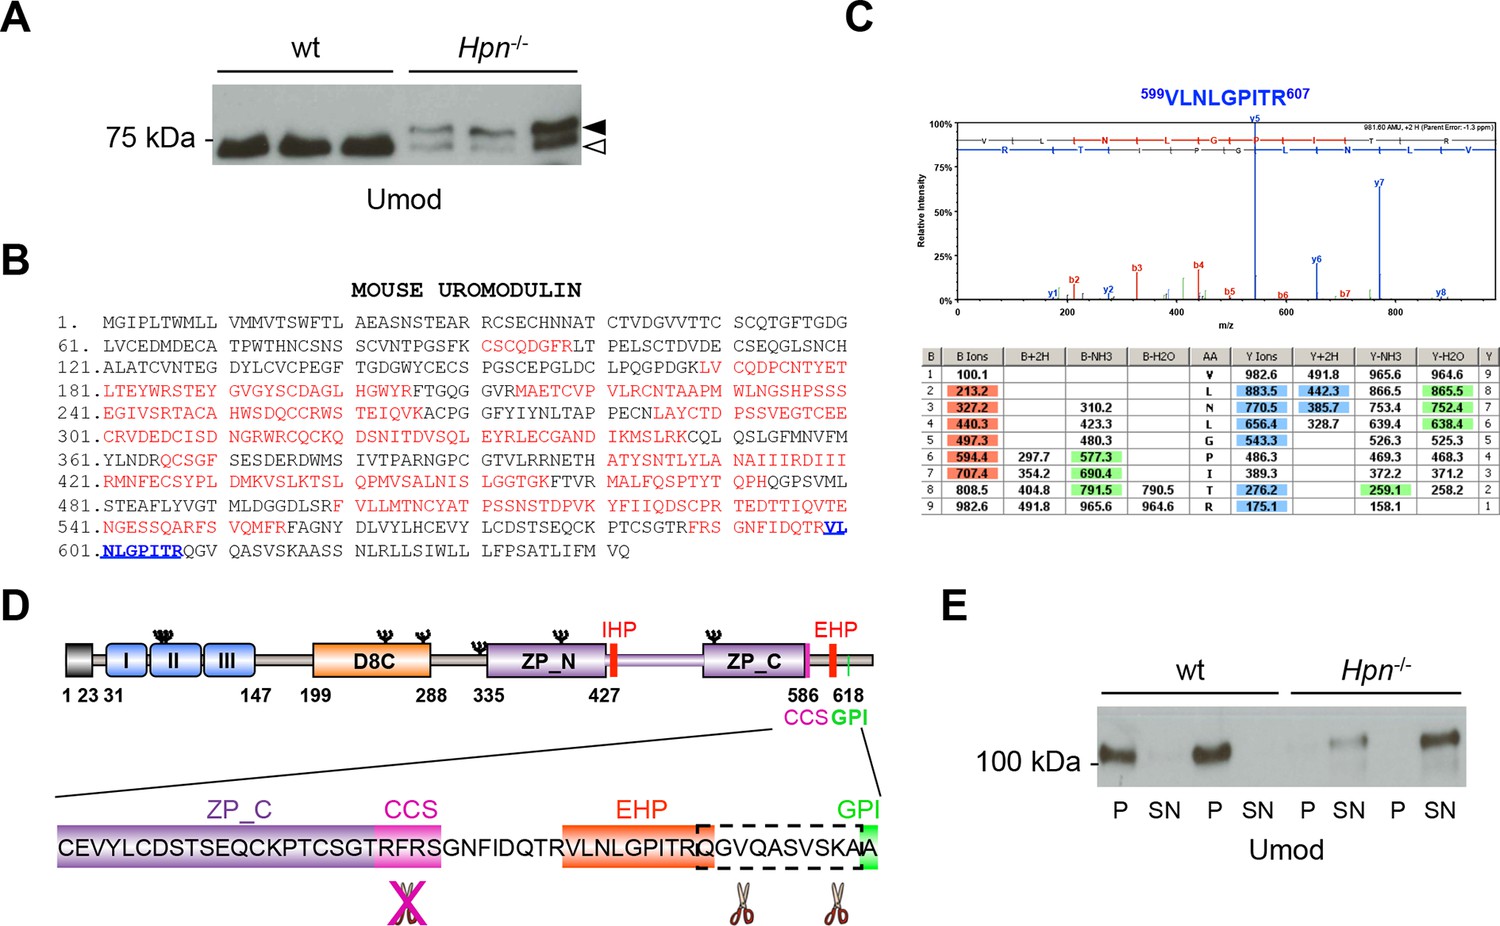
(A) Representative Western blot analysis of N-deglycosylated urinary uromodulin secreted by Hpn-/- mice or control animals. Hpn-/- mice show the presence of two uromodulin isoforms: a short one with similar electrophoretic mobility as in wild-type urines (white arrowhead), and a longer one that is absent in samples from wild-type mice (black arrowhead) (n = 6/group). (B) Mass spectrometry (MS) sequence coverage (52% over the entire protein) of trypsin-digested mouse uromodulin (short isoform) (UniProt accession Q91X17) purified from urine of Hpn-/- mice. Matching peptides are shown in red, while the C-terminal peptide is shown in blue. This peptide ends at R607, a distal C-terminal residue with respect to the one reported for mouse urinary uromodulin (F588 [Santambrogio et al., 2008]). (C) Representative tandem mass-spectrometry (MS/MS) spectrum, confirming the identity of the identified C-terminal peptide (599VLNLGPITR607) of the short uromodulin isoform released by Hpn-/- mice, and table of fragmented ions. (D) Schematic representation of mouse uromodulin domain structure as in Figure 1A. The blow-up shows that in the absence of hepsin, the cleavage generating the short uromodulin isoform is abolished and alternative ones at more C-terminal sites (distal to R607) take place. (E) Representative Western blot analysis of uromodulin in supernatant (SN) and pellet (P) fractions from a polymerisation assay performed on urinary samples from Hpn-/- mice or control animals. Urinary uromodulin from control animals is precipitated in the pellet fraction, reflecting full engagement in polymeric structures, while the one from Hpn-/- mice is only detected in the supernatant (n = 4/group).
-
Figure 7—source data 1
Transcript level of Prss8 in mouse microdissected nephron segments (Figure 7—figure supplement 2A).
- https://doi.org/10.7554/eLife.08887.021
-
Figure 7—source data 2
Quantification of urinary uromodulin secretion in Prss8-/- and control mice (Figure 7—figure supplement 2C).
- https://doi.org/10.7554/eLife.08887.022
Figure 7—figure supplement 1
Urinary uromodulin misprocessing in Hpn-/- mice.
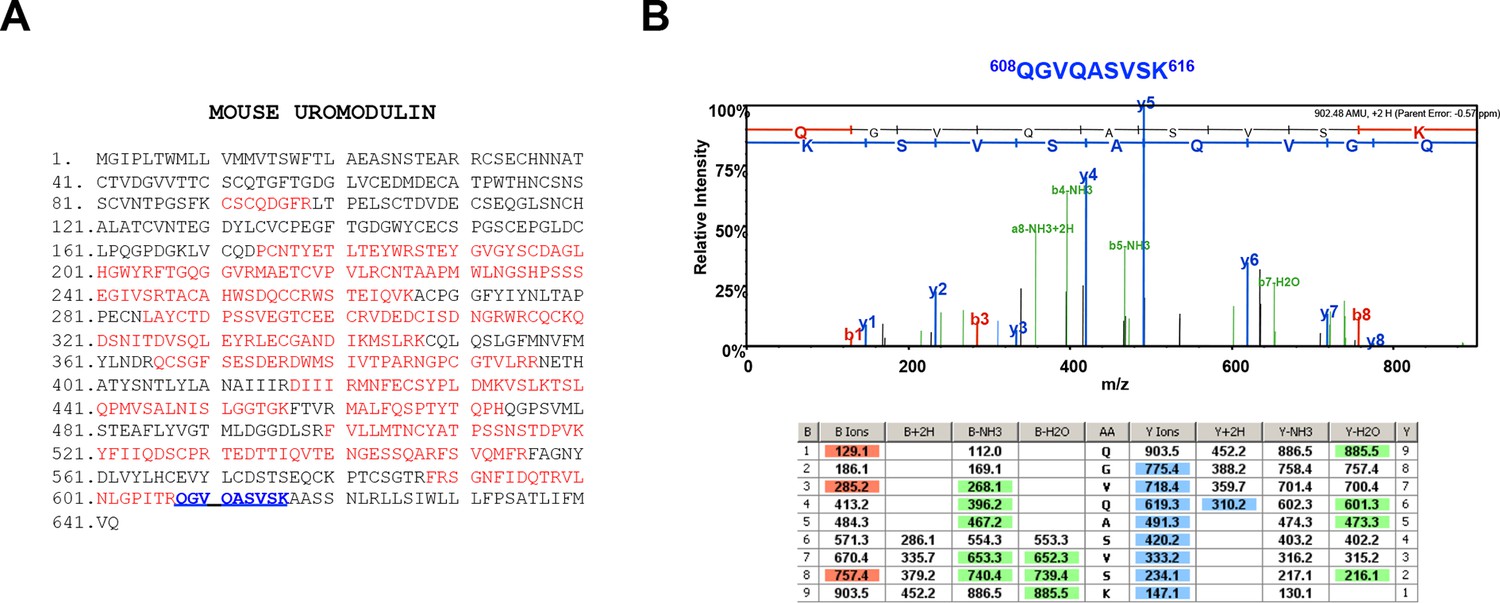
(A) Mass spectrometry (MS) sequence coverage (51% over the entire protein) of trypsin-digested mouse uromodulin (long isoform) (UniProt accession Q91X17) purified from urine of Hpn-/- mice. Matching peptides are shown in red, while the C-terminal peptide is shown in blue. This peptide ends at K616, a distal C-terminal residue with respect to the one reported for mouse urinary uromodulin (F588 [Santambrogio et al., 2008]). (B) Representative tandem mass-spectrometry (MS/MS) spectrum, confirming the identity of the identified C-terminal peptide (608QGVQASVSK616) of the long uromodulin isoform released by Hpn-/- mice, and table of fragmented ions.
Figure 7—figure supplement 2

Uromodulin secretion is not affected by lack of prostasin in vivo.
(A) Transcript level of Prss8, as assessed by Real-Time qPCR on microdissected nephron segments (normalised to Gapdh). Expression of Prss8 is detected in proximal convoluted tubules (PCT), proximal straight tubules (PST) and, to a lesser extent, in thick ascending limb (TAL) and collecting ducts (CD). Bars indicate average ± s.e.m. of 3 independent experiments (Figure 7—source data 1). (B) Immunofluorescence analysis of mouse kidney sections shows strong signal of endogenous prostasin on the apical plasma membrane of proximal tubules, and weak signal on the apical plasma membrane of TAL epithelial cells where it co-localises with uromodulin. Scale bar, 20 µm. (C) Representative Western blot analysis of urinary uromodulin from control Prss8lox/loxor Prss8-/- mice. Urinary protein loading was normalised to urinary creatinine concentration. Densitometric analysis shows that uromodulin secretion is comparable between Prss8-/- mice and control Prss8lox/loxanimals (average ± s.d., n = 5/group, Figure 7—source data 2) (Student’s t test). (D) Representative Western blot analysis of N-deglycosylated urinary uromodulin secreted by Prss8-/- mice or control animals. An isoform of identical molecular weight, corresponding to the short uromodulin isoform, is detected in urine samples of both genotypes (n = 5/group). (E) Mass spectrometry sequence coverage (55% over the entire protein) of AspN-digested mouse uromodulin (UniProt accession Q91X17) purified from urine of Prss8-/- mice. Matching peptides are shown in red, while the C-terminal peptide is shown in blue. This peptide ends at F588, the same C-terminal residue identified in urinary uromodulin of wild-type mice (Santambrogio et al., 2008) and control Prss8lox/loxanimals (data not shown). (F) Representative MS/MS spectrum confirming the sequence of urinary uromodulin C-terminal peptide (573DSTSEQCKPTCSGTRF588) in Prss8-/- mice and table of fragmented ions.
Figure 8
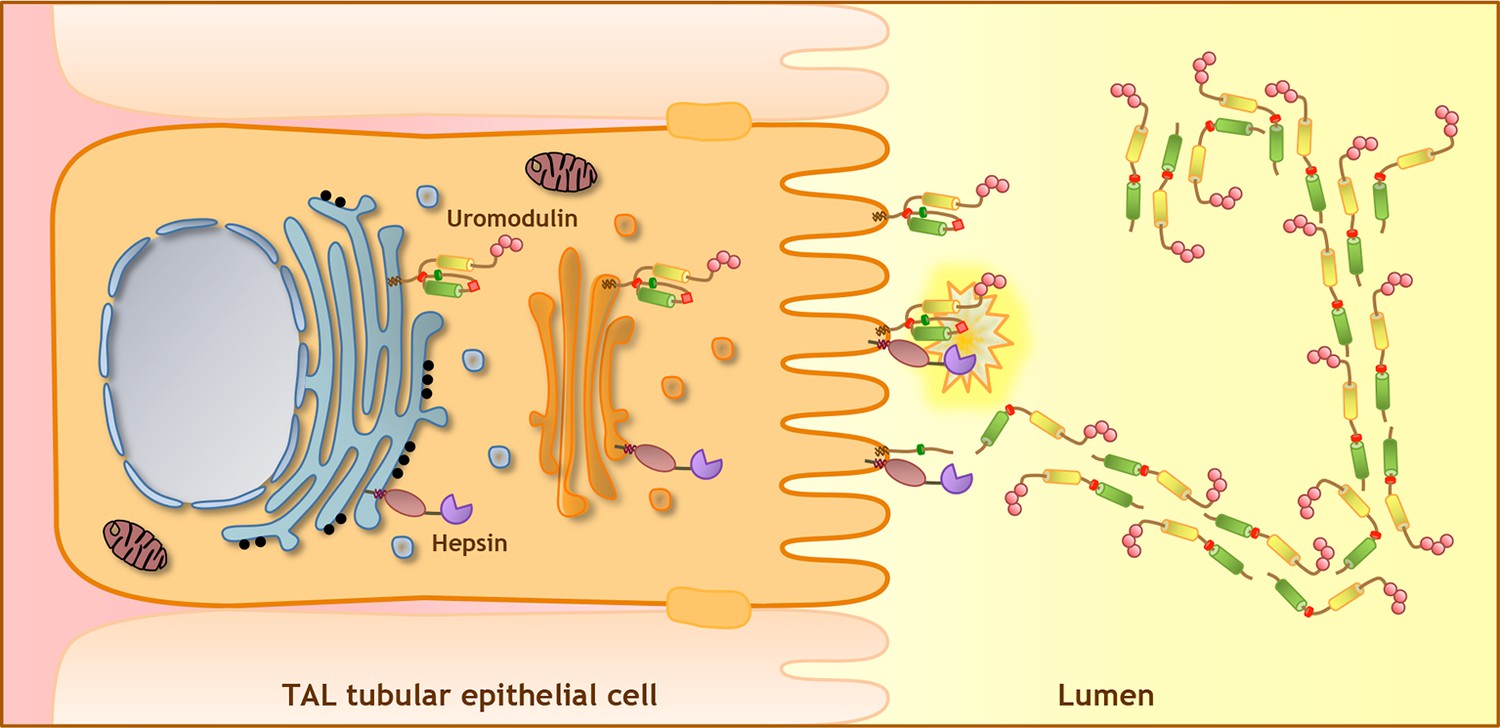
Model of uromodulin shedding and polymerisation.
Uromodulin is exclusively expressed by TAL tubular epithelial cells. The protein enters the secretory pathway and reaches the plasma membrane in a polymerisation-incompetent conformation. This is ensured by the interaction between two hydrophobic patches within and next to the ZP-C subdomain (Internal Hydrophobic Patch, red circle, and External Hydrophobic Patch, dark green circle) (Jovine et al., 2004; Schaeffer et al., 2009; Han et al., 2010). Shedding by hepsin at the uromodulin consensus cleavage site (red diamond), likely occurring at the plasma membrane, releases the hydrophobic interaction, generating polymerisation-competent species that are assembled into polymeric filaments within the tubular lumen. Pink circles indicate N-terminal EGF-like domains, yellow and green cylinders represent ZP-N and ZP-C subdomains. The orientation of uromodulin within polymers is hypothetical.
Author response image 1
Mass spectrometry analysis of the long uromodulin isoform released by MDCK cells.
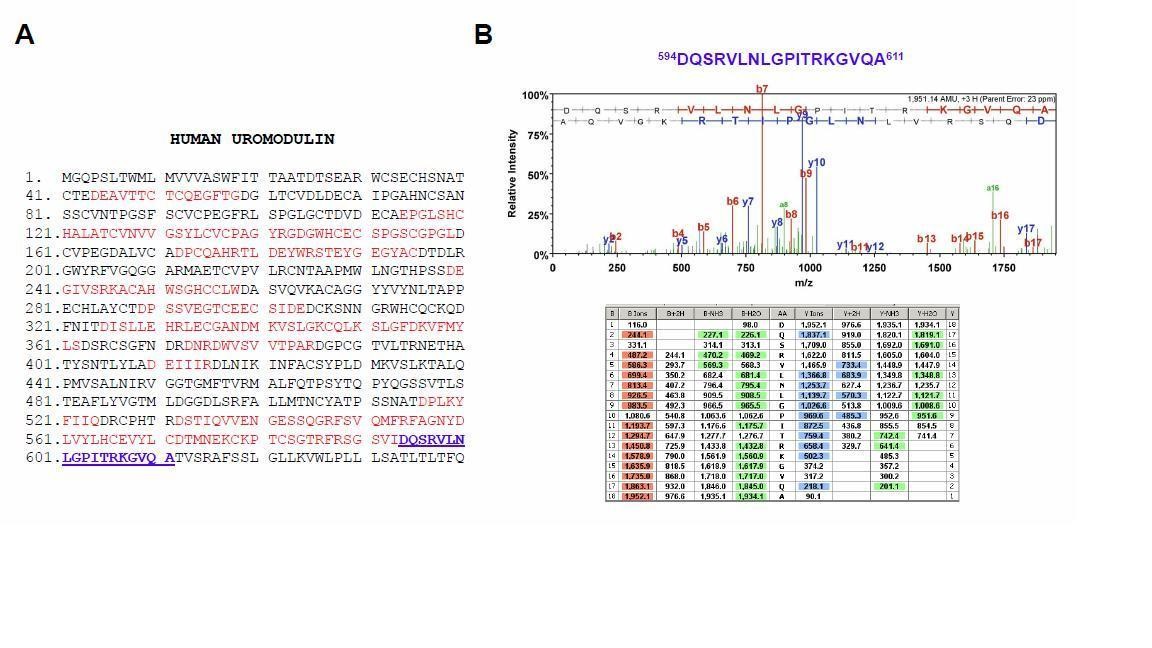
(A) Mass spectrometry sequence coverage (42%) of Asp-N-digested human uromodulin (long isoform) from the medium of stably expressing MDCK cells. The analysis was carried out as described in the Methods section of the manuscript. The long isoform was separated in 2D electrophoresis. Matching peptides are shown in red, while the C- terminal peptide is shown in blue. This peptide ends at A611, a distal C-terminal relative to the one identified for the short isoform (F587) that is identical to the one reported for human urinary uromodulin (Santambrogio et al., 2008). (B) Representative tandem mass-spectrometry (MS/MS) spectrum confirming the identity of the 594DQSRVLNLGPITRKGVQA611 C-terminal peptide of the long uromodulin isoform released by MDCK cells and table of fragmented ions.
Author response image 2

Expression level of renal genes in Hpn-/- mice.
Quantification by Real-time qPCR of the mRNA levels of cyclooxygenase 2 (Cox2) (Ptgs2), sodium-chloride co-transporter (NCC) (Slc12a3) and the renal outer medullary potassium channel (ROMK) (Kcjn1) in kidneys of Hpn-/-mice relative to age- and sex- matched wild-type controls (n = 3/group). Bars indicate average ratio ± s.e.m.
Author response image 3

Yeast agglutination assays on uropathogentic E. coli clinical isolates.
Representative images of yeast agglutination assay. The assay was performed incubating 10 µl of previously identified bacteria isolates (haemagglutination-positive isolates #9, 12, 10), grown in static condition (final concentration 2x10⁹ cells/ml), with 10 µl of S. cerevisiae yeast strain W303 Mata (final concentration of 109 cells/ml). The appearance of white aggregates (arrows) indicates agglutination. UTI isolates were pre-incubated with D- mannose at a final concentration of 2.5% in order to identify mannose-sensitive agglutination, indicative of type 1-fimbriated phenotype. The assay was carried out in 3 replicates.
Tables
Table 1
Primers (5'-3') used to generate UMOD and protease constructs.
| efUMOD-PCR1 T7: TAATACGACTCACTATAGGG Reverse: ACACGTCCCCTCCACGTGGTGATGGTGATGATGAC |
| efUMOD-PCR2 Forward: CATCACCATCACCACGTGGAGGGGACGTGTGAGGA BGHrev: TAGAAGGCACAGTCGAGG |
| efUMOD_sol Forward: GGACAGATCTACGTCGACGGGACGTGTGAGGAGTGCAG Reverse: CCGGAATTCCTAGTGATGATGGTGATGATGCTGGACACCTTTCCGTGTG |
| efUMOD_AYAA Forward: CCTACCTGCTCTGGGACCGCATACGCAGCTGGGAGTGTCATAGATCAATCCC Reverse: GGGATTGATCTATGACACTCCCAGCTGCGTATGCGGTCCCAGAGCAGGTAGG |
| efUMOD_N513Q Forward: CACCCAGTAGCCAGGCCACGGACCCCC Reverse: GGGGGTCCGTGGCCTGGCTACTGGGTG |
| PRSS8_S238A Forward: GCCAGGGTGACGCTGGGGGCCCA Reverse: TGGGCCCCCAGCGTCACCCTGGC |
| HPN_S353A Forward: CTGCCAGGGCGACGCCGGTGGTCCCTTT Reverse: AAAGGGACCACCGGCGTCGCCCTGGCAG |
Table 2
Oligonucleotide sequences used to generate shRNAs.
| Target gene | Target position from ATG codon | siRNA oligo (5’-3’) |
|---|---|---|
| HPN_siRNA#1 | 122-140 | CCTTCCTACTCAAGAGTGA |
| HPN_siRNA#2 | 1195-1213 | TGGATCTTCCAGGCCATAA |
| PRSS8_siRNA#1 | 258-276 | GAAGGAAGACTATGAGGTA |
| PRSS8_siRNA#2 | 593-611 | TGTACAACATCAACGCTAA |
| Control siRNA | NA | TAGTGAGATTCGTTAAGAT |
Table 3
Primers used for gene expression analysis (RT-PCR).
| Gene | PCR product length | Primer (5’-3’) |
|---|---|---|
| HPN (Dog / Human) | 353 bp | Forward: GCTGCGAGGAGATGGGCTTC Reverse: CGGGAAGCAGTGGGCGGCTG |
| PRSS8 (Dog / Human) | 547 bp | Forward: CCTGGCAGGTCAGCATCACC Reverse: CCAGAGTCACCCTGGCAGGC |
| GAPDH (Human) | 314 bp | Forward: CCACCCAGAAGACTGTGGAT Reverse: GTTGAAGTCAGAGGAGACCACC |
| GAPDH (Dog) | 289 bp | Forward: CTCTGGGAAGATGTGGCGTGAC Reverse: GTTGAAGTCACAGGAGACCACC |
Table 4
Primers used for gene expression analysis (Real-Time qPCR).
| Gene | PCR product length | Primer (5’-3’) |
|---|---|---|
| HPN (Dog) | 164 bp | Forward: TGGTCCACCTGTCCAGCCCC Reverse: GACTCGGGCCTCCTGGAGCA |
| Hpn (Mouse) | 152 bp | Forward: CTGACTGCTGCACATTGCTT Reverse: GGGTCTCGAAAGGGAAGGTA |
| PRSS8 (Dog) | 156 bp | Forward: TCCGGACTTGCCTTCTGCGGT Reverse: AGCTGAGAGCACCCACTGCTCA |
| GAPDH (Dog) | 289 bp | Forward: CTCTGGGAAGATGTGGCGTGAC Reverse: GTTGAAGTCACAGGAGACCACC |
| Prss8 (Mouse) | 147bp | Forward: ATCACCCACTCAAGCTACCG Reverse: AGTACAGTGAAGGCCGTTGG |
| Umod (Mouse) | 207 bp | Forward: ATGGACCAGTCCTGTCCTG Reverse: CCGTCTCGCTTCTGTTGAGT |
| Hprt1 (Mouse) | 162 bp | Forward: ACATTGTGGCCCTCTGTGTG Reverse: TTATGTCCCCCGTTGACTGA |
Download links
A two-part list of links to download the article, or parts of the article, in various formats.
Downloads (link to download the article as PDF)
Open citations (links to open the citations from this article in various online reference manager services)
Cite this article (links to download the citations from this article in formats compatible with various reference manager tools)
The serine protease hepsin mediates urinary secretion and polymerisation of Zona Pellucida domain protein uromodulin
eLife 4:e08887.
https://doi.org/10.7554/eLife.08887


