Many lncRNAs, 5’UTRs, and pseudogenes are translated and some are likely to express functional proteins
- Harvard Medical School, United States
- Broad Institute of MIT and Harvard, United States
- Howard Hughes Medical Institute, Massachusetts Institute of Technology, United States
Figures
Figure 1 with 1 supplement
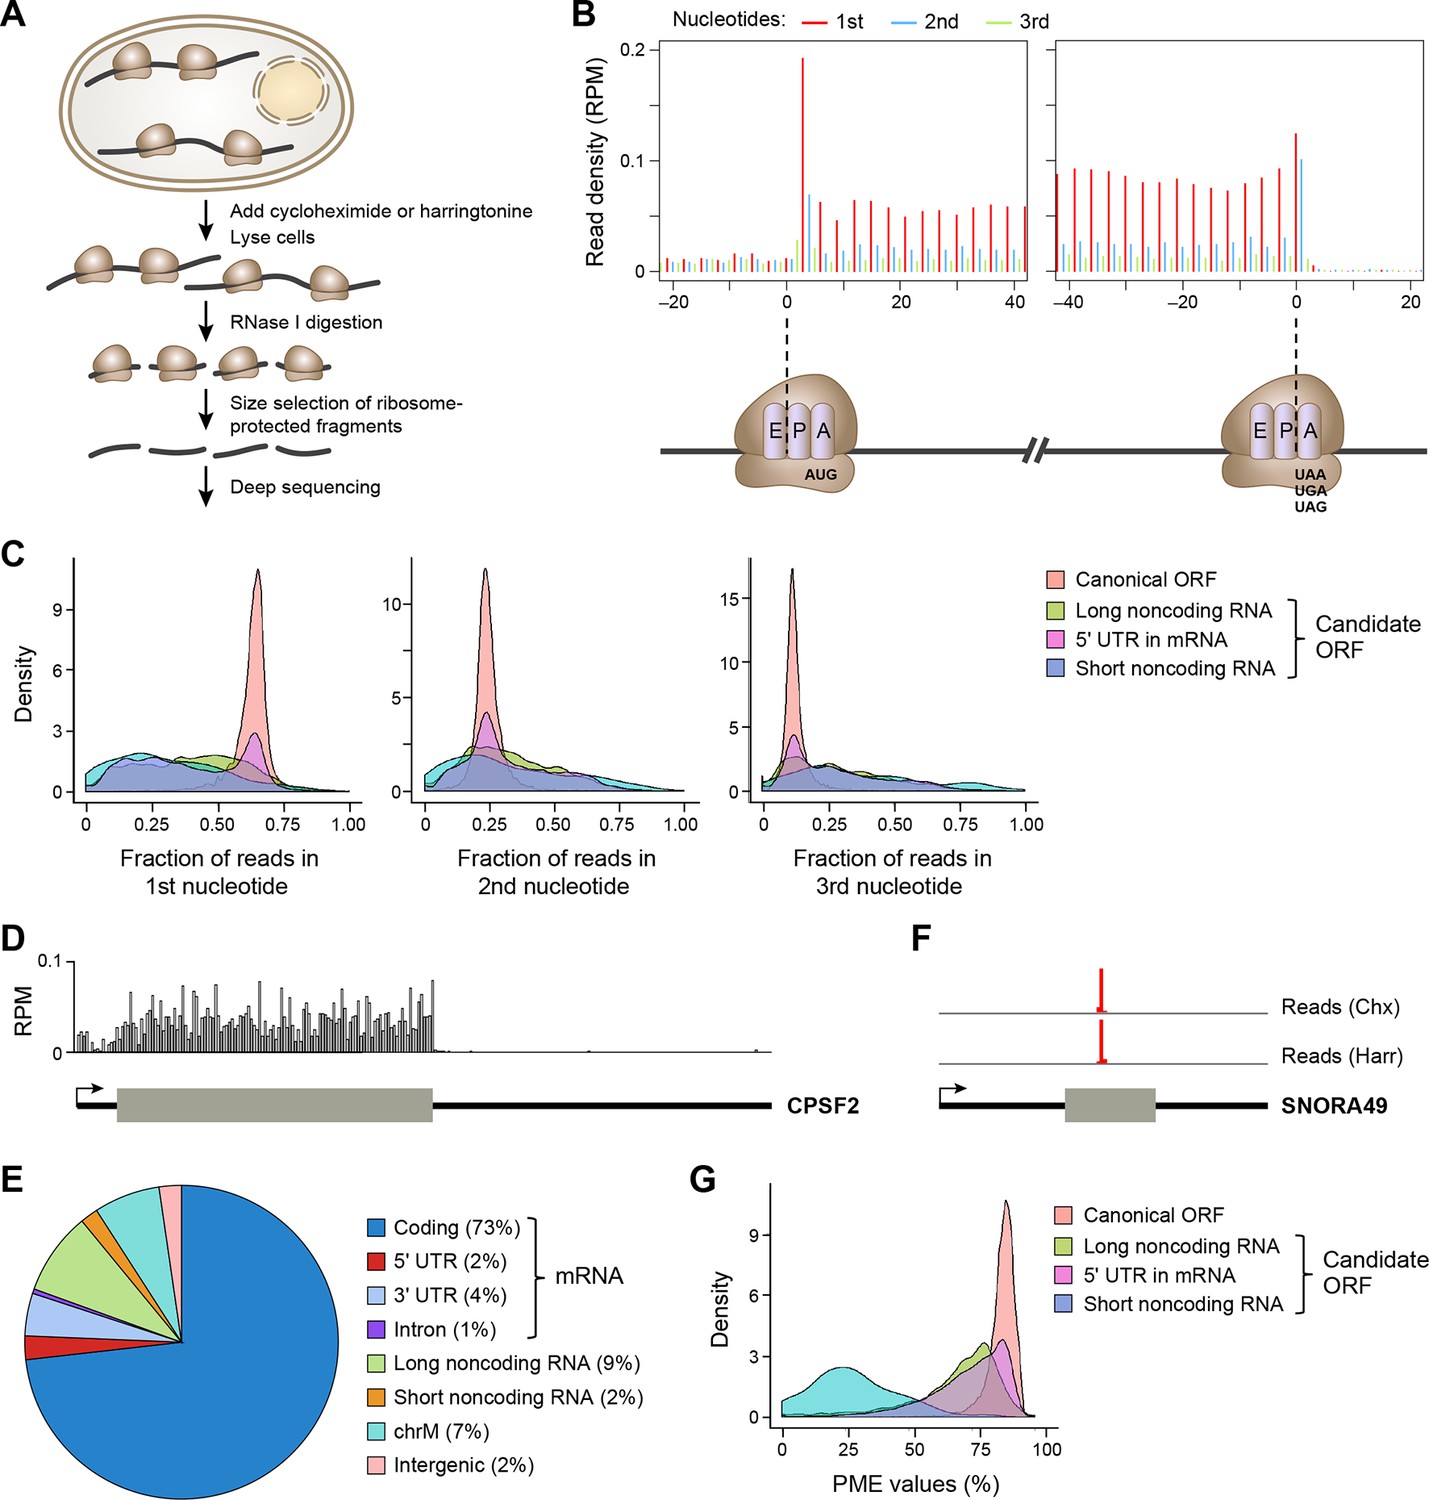
Ribosome profiling reveals in vivo translation with single nucleotide resolution.
(A) Ribosome profiling experiment. (B) Read distribution (reads/million mappable reads; RPM) around start and stop codons of canonical protein coding genes. (C) Fractions of reads in 1st, 2nd and 3rd nucleotides of codons in the indicated types of ORFs. (D) Read distribution in the protein-coding gene CPSF2. The RPM value was calculated for every 20-nt region along the transcript. (E) Distribution of reads across human genome. (F) Read distribution of the snoRNA gene SNORA49 in cells treated with cycloheximide (Chx) or harringtonine (Harr). (G) Distribution of PME values in the indicated types of ORFs.
Figure 1—figure supplement 1
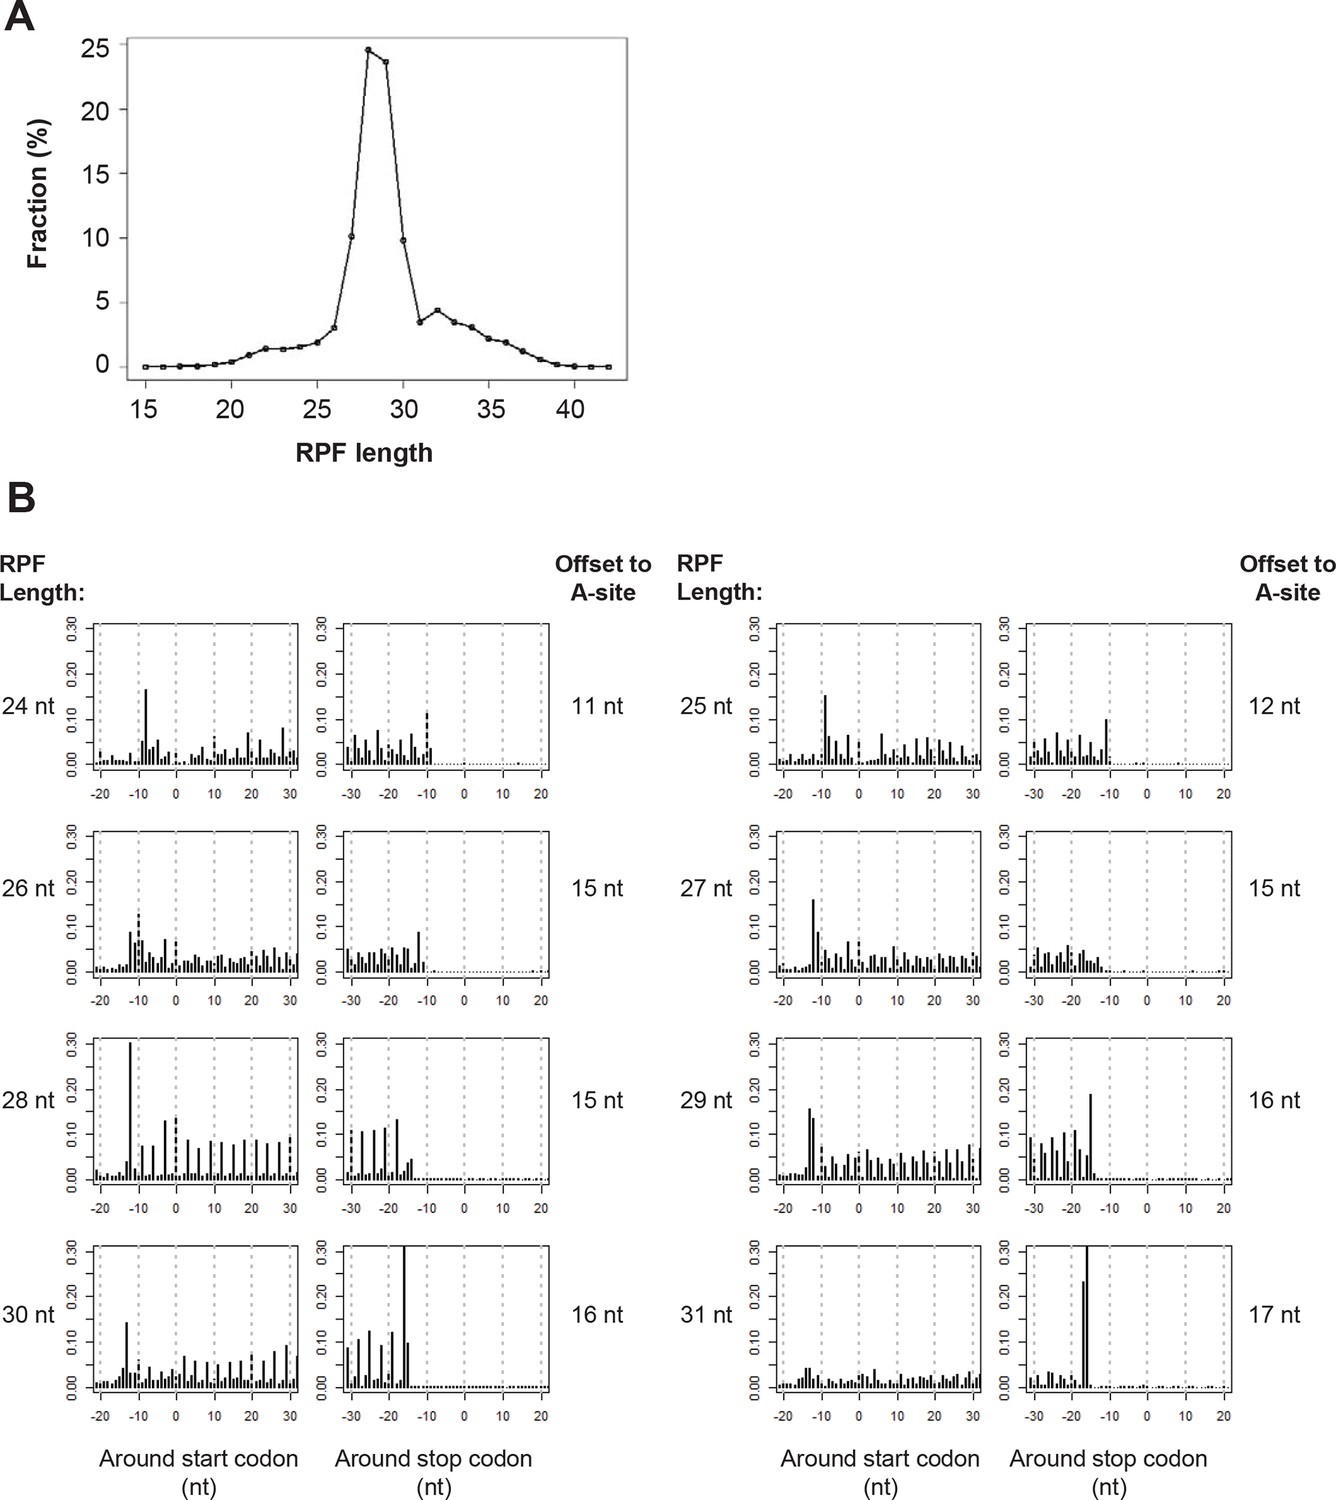
Ribosome profiling data.
(A) RPF length distribution. (B) The read distribution of RPFs around start and stop codons of canonical mRNA ORFs. RPFs were grouped based on their length.
Figure 2 with 2 supplements

RibORF identifies translating ORFs.
(A) Receiver-operating characteristic (ROC) curves to measure algorithm performance using different training parameters. (B) Types of translated ORFs identified in this study, with ORF number:gene number shown in parenthesis. (C) Distribution of reads upon cycloheximide treatment around start codon of predicted positive and negative lncRNA ORFs. Examples of (D) a translated lncRNA (E) an mRNA with a uORF (F) an mRNA with a dORFs; the 3’ most exon is shown. Enlarged figures show 3-nt periodicity can be observed for each codon in Figure 2D–F.
Figure 2—figure supplement 1
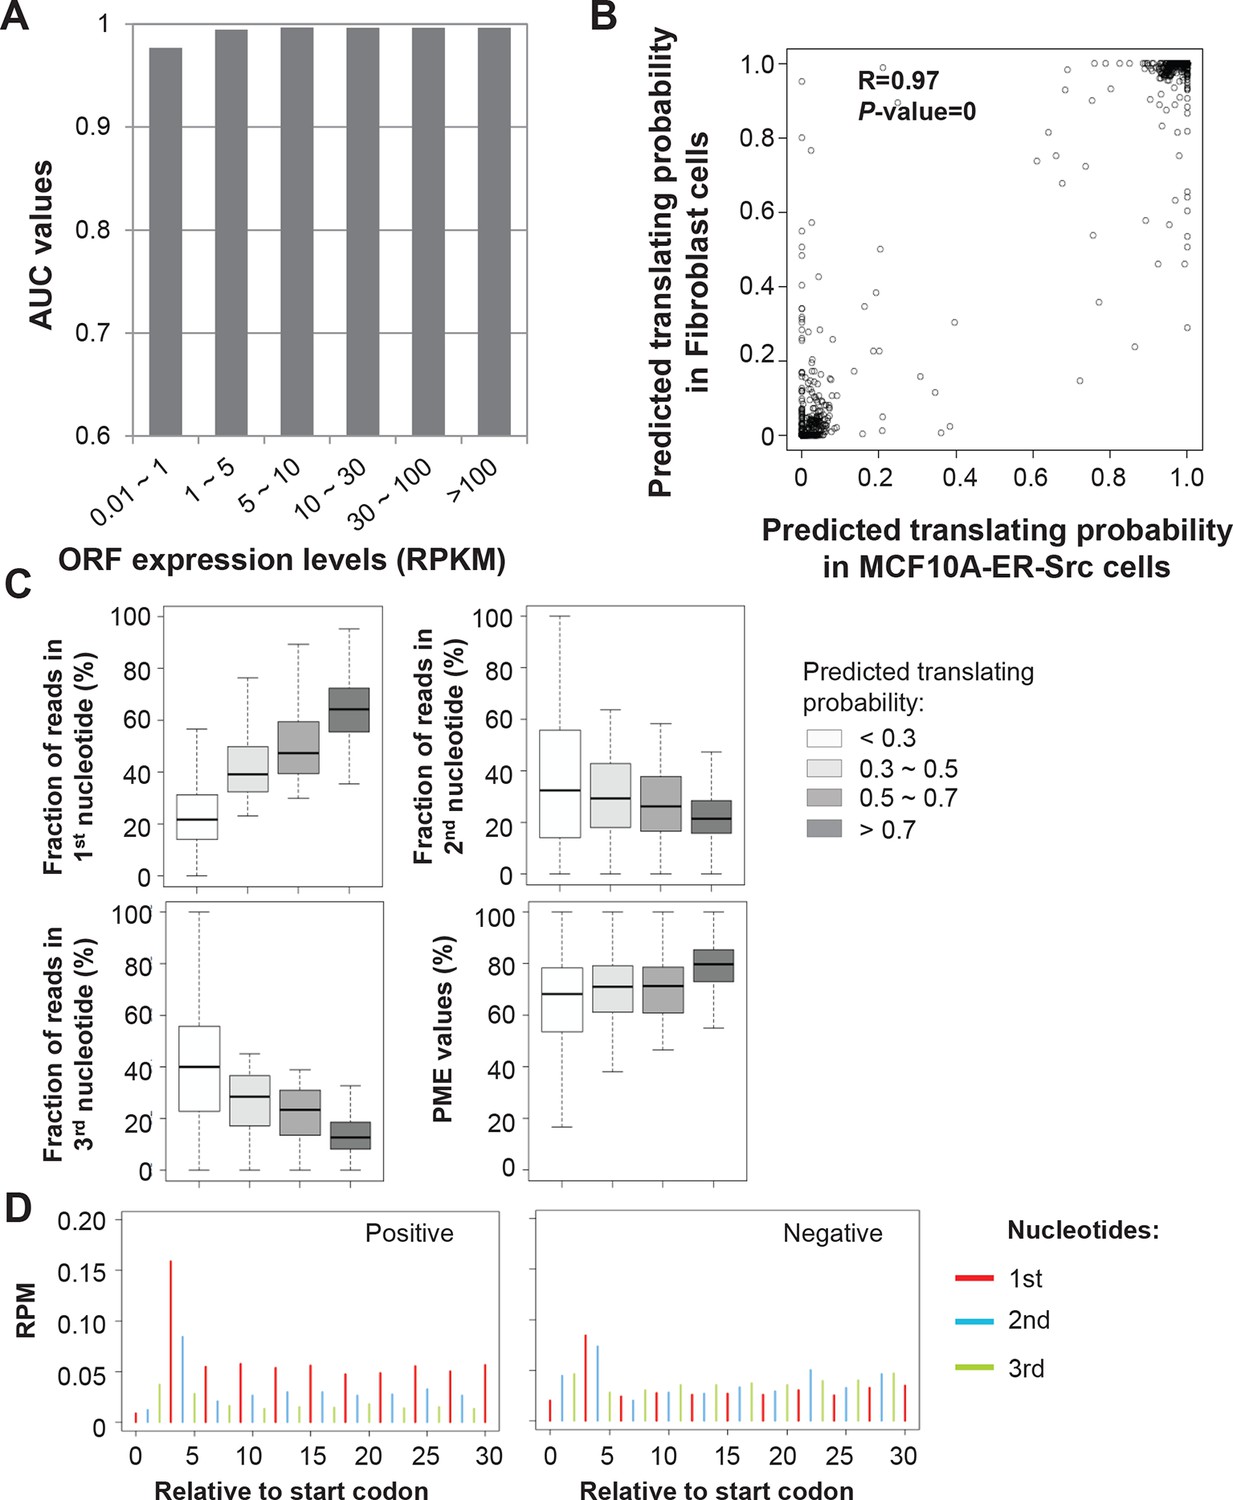
RibORF algorithm performance.
(A) ORFs were grouped based on expression levels, and corresponding AUC values were plotted as in Figure 2A. (B) Correlation of predicted translating probability of candidate ORFs, using ribosome profiling data from MCF10A-ER-Src cells and fibroblast cells. 1000 randomly selected candidate ORFs were used in the analyses. (C) Candidate ORFs were grouped based on predicted translating probability. Fractions of reads in 1st, 2nd and 3rd nucleotides of codons and PME values in different groups were shown. (D) Distribution of ribosome profiling reads around start codon of predicted positive and negative uORFs.
Figure 2—figure supplement 2
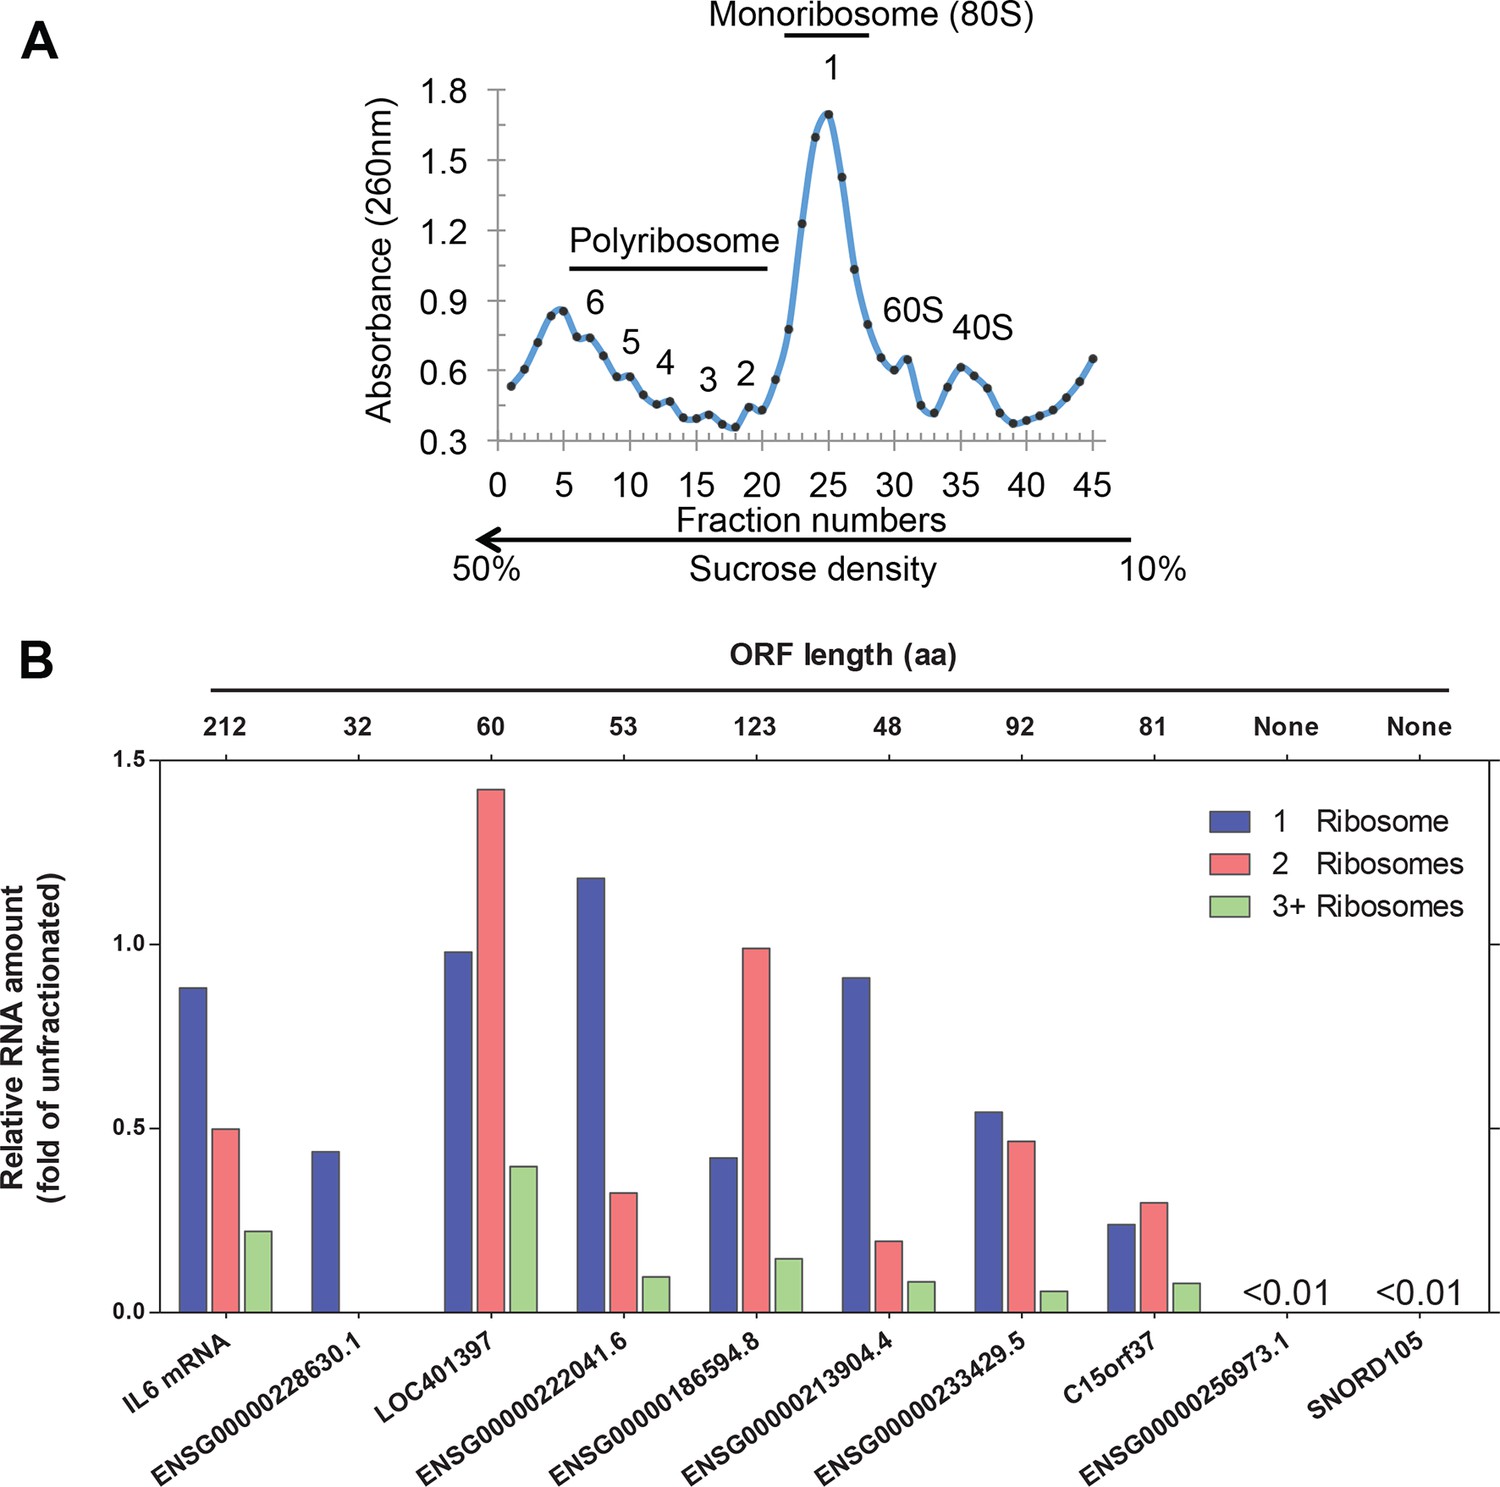
Analysis of ribosome-associated RNA.
(A) Sucrose gradient fractionation of polyribosomes with fractions indicated. (B) Analysis of RNAs associated with 80S monoribosomes (fraction 1) and polyribosomes with 2 (fraction 2) or 3+ (combining fractions 3–6) ribosomes. The RNAs analyzed including seven predicted translated lncRNAs, the IL6 mRNA as a positive control, and non-translating lncRNA ENSG00000256973.1 and snoRNA SNORD105 as negative controls. The amounts for the ribosome-associated RNAs are expressed with respect to the amounts of these RNAs in the unfractionated samples prior to sucrose gradient centrifugation.
Figure 3 with 1 supplement
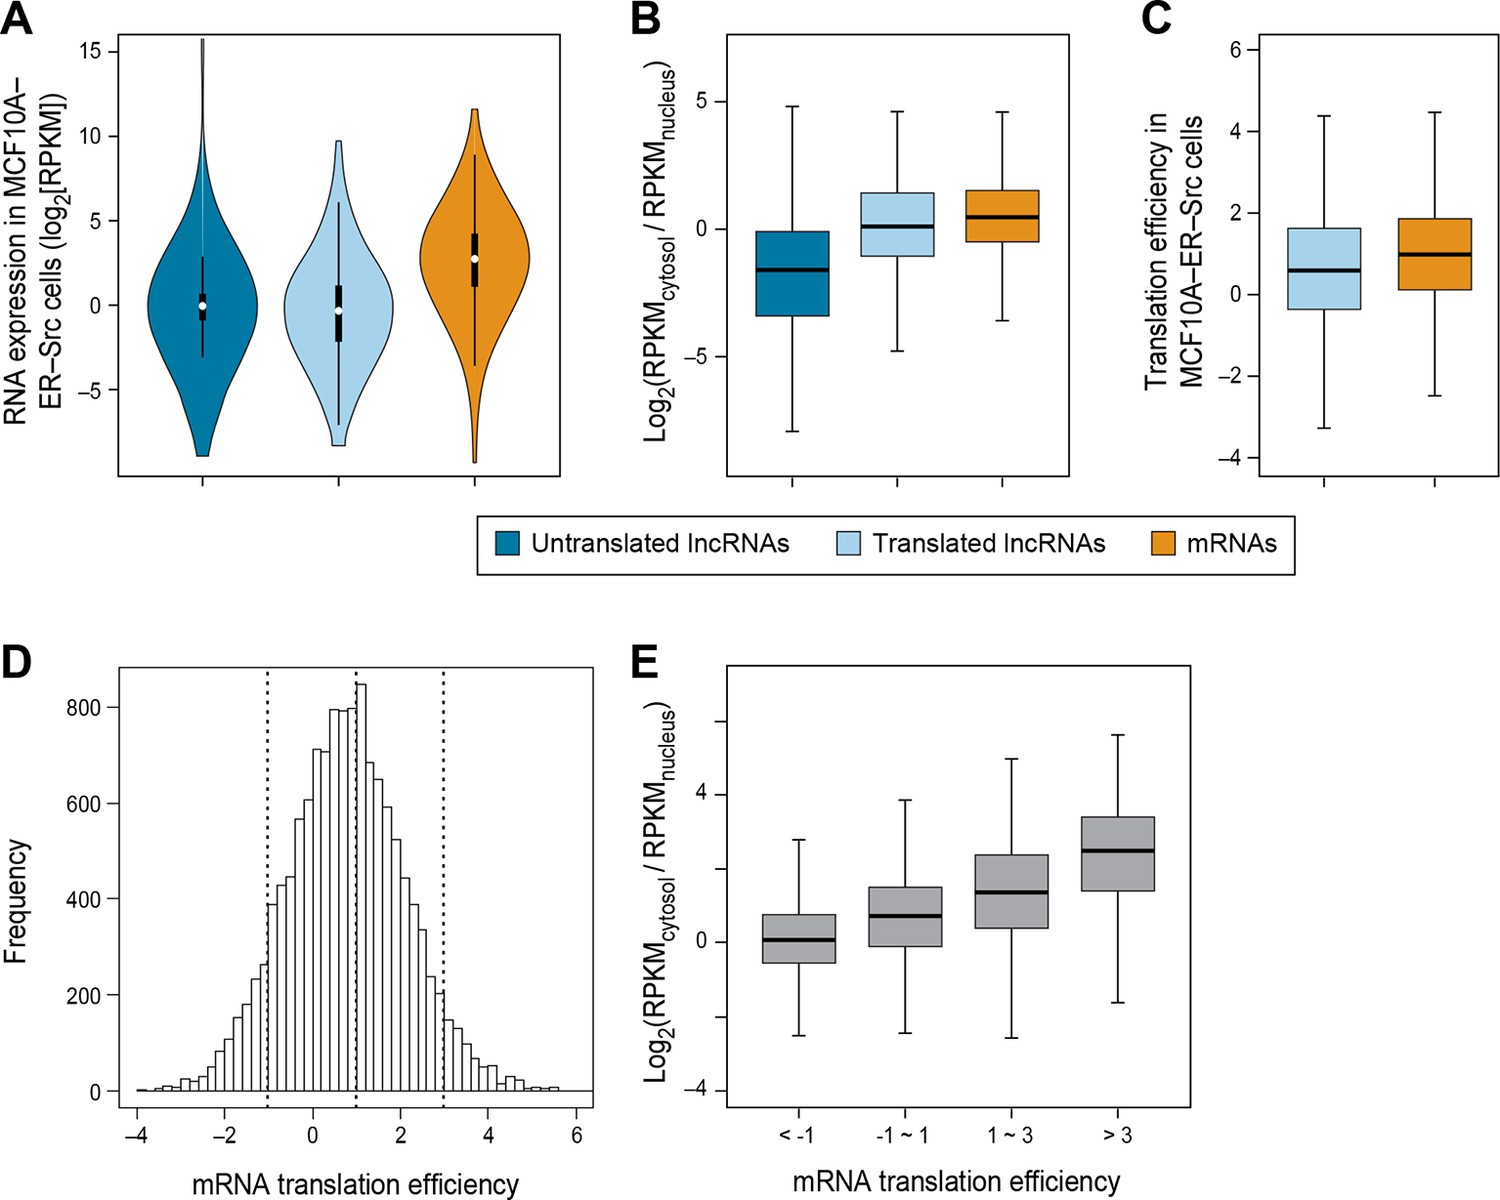
RNA subcellular localization is a major determinate of translation efficiency.
(A) RNA expression levels of lncRNAs with or without translated ORFs and canonical mRNAs in MCF10A-ER-Src cells. (B) Relative subcellular location of translated and untranslated lncRNAs and canonical mRNAs. (C) Translation efficiency of translated lncRNAs and canonical mRNAs. (D) Distribution of translation efficiency of canonical mRNAs, calculated as averaged translation efficiency values in breast epithelial and fibroblast cells. (E) Relative subcellular locations of mRNAs grouped based on translation efficiency.
Figure 3—figure supplement 1
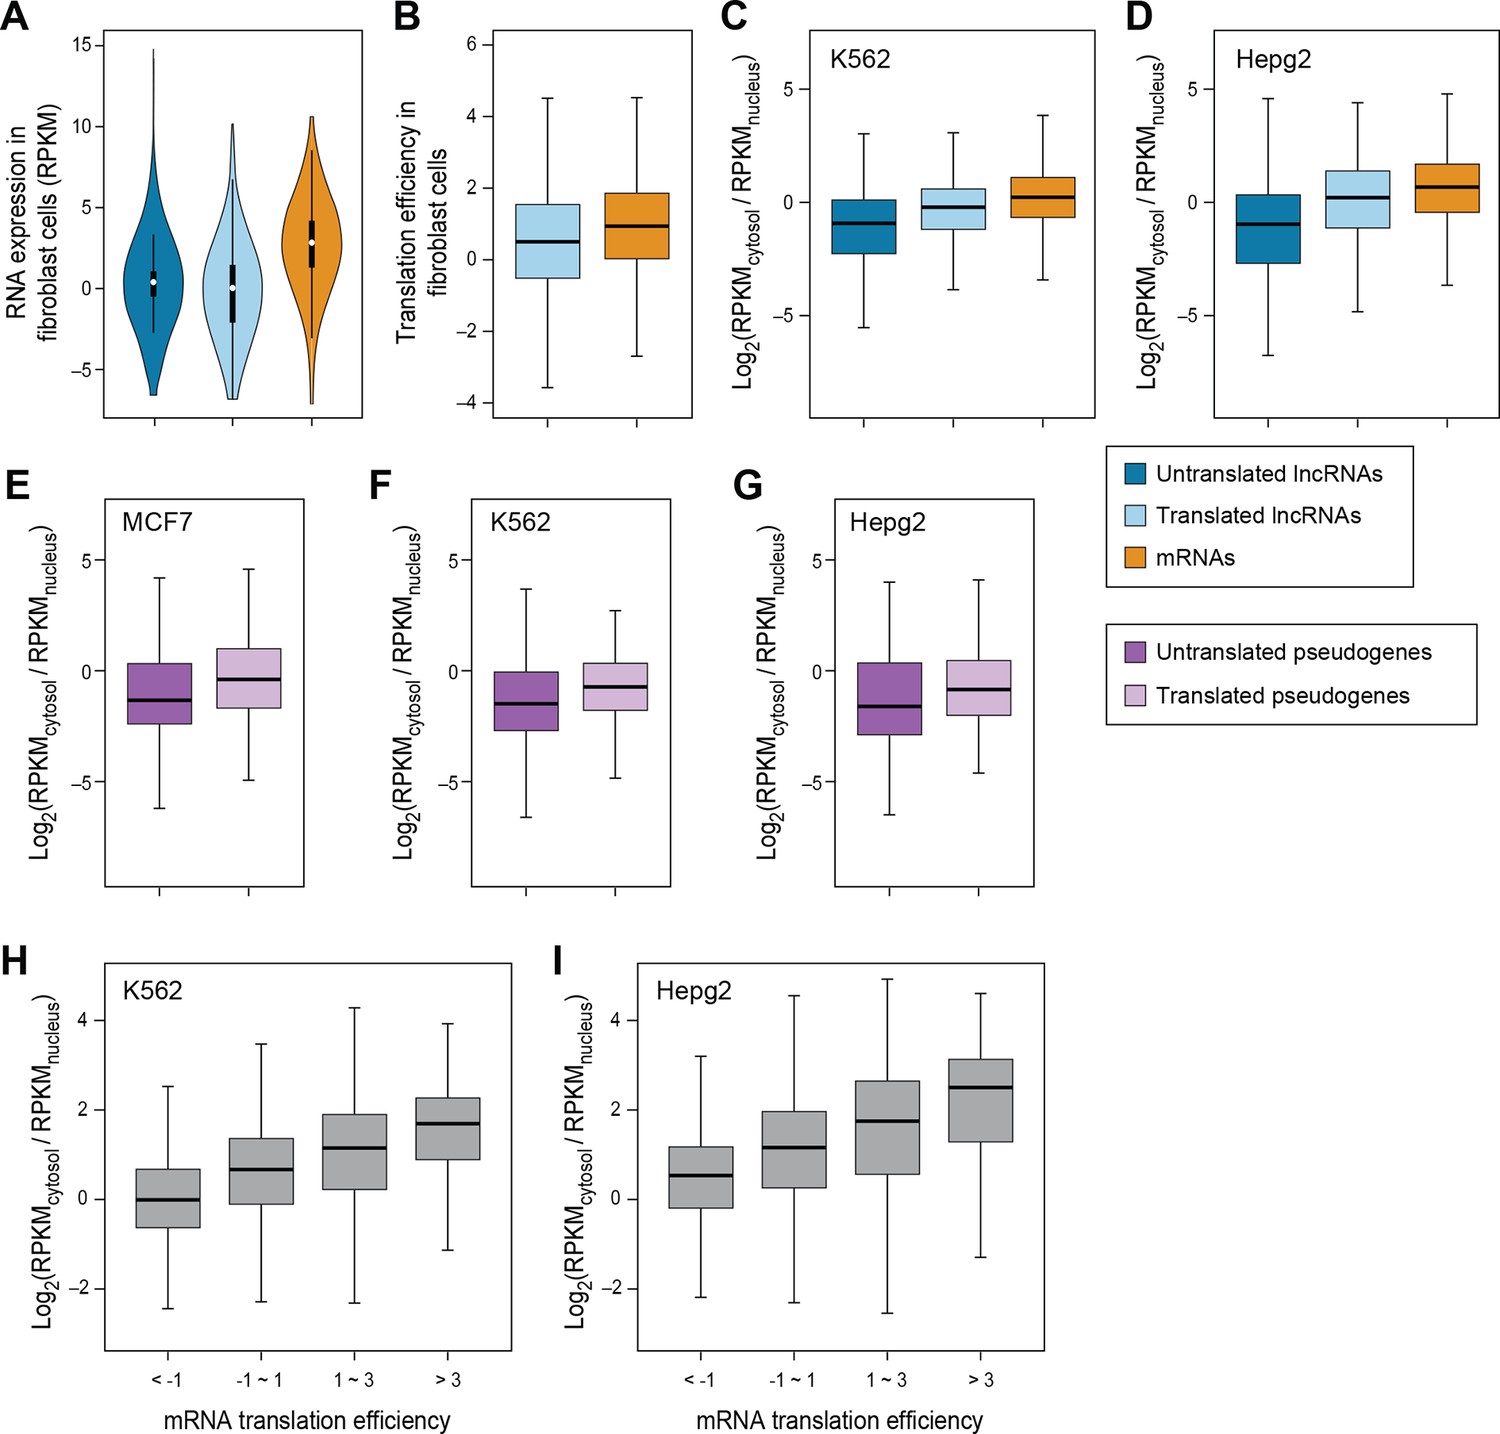
RNA subcellular localization regulates translation.
(A) RNA expression levels of expressed lncRNAs with or without translated ORFs and mRNAs in fibroblast cells measure by RNA-seq. (B) Translation efficiency of translated ORFs in lncRNAs and canonical ORFs in mRNAs in fibroblast cells. (C,D) Relative subcellular location of translated/untranslated lncRNAs and mRNAs. RPKM values were calculated using RNA-seq data for nucleus and cytosol fractions of K562 (C) and Hepg2 (D) cells. (E–G) Relative subcellular localization of translated/untranslated pseudogenes. (H, I) mRNAs were grouped based on translation efficiency as in Figure 3D, and relative subcellular locations of mRNAs in K562 (H) and Hepg2 (I) cells were shown.
Figure 4 with 6 supplements
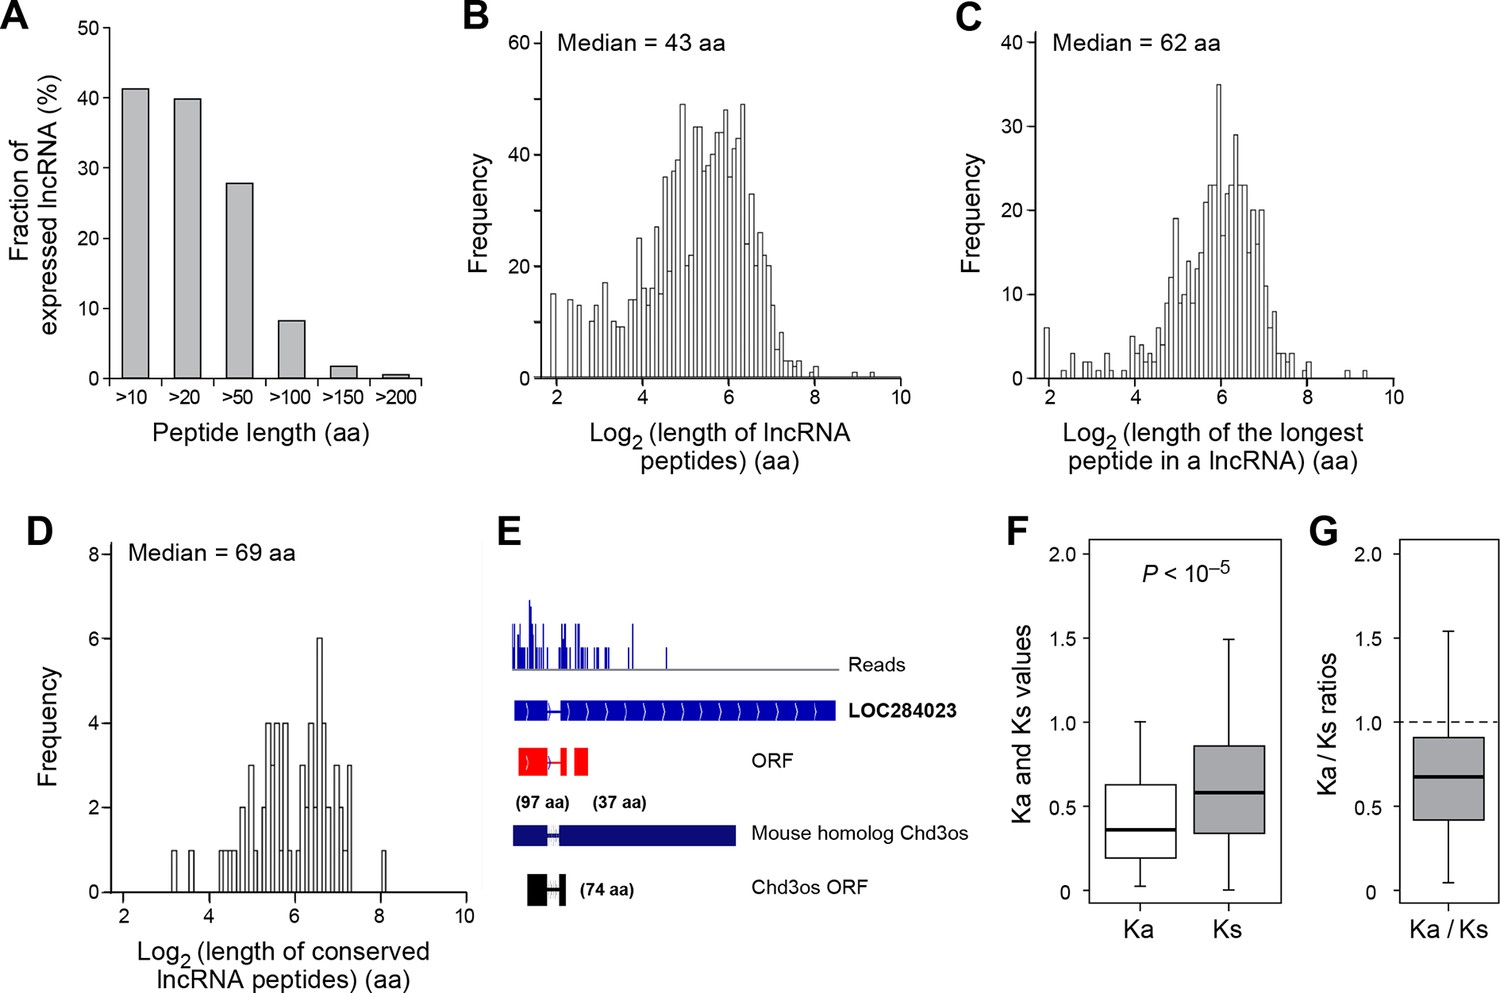
Features and conservation of lncRNA peptides.
(A) Fraction of expressed lncRNAs that encode peptides longer than a certain length. (B) Peptide length encoded by lncRNAs. (C) Length of the longest peptide in a given lncRNAs. (D) Length of conserved lncRNA peptides. (E) LncRNA LOC284023 encodes two peptides, the upstream one being conserved in the mouse lncRNA Chd3os. (F) Ka and Ks values of types of conserved lncRNA peptides with Z-Test p-values shown. (G) Ka/Ks ratios of types of conserved lncRNA peptides.
Figure 4—figure supplement 1
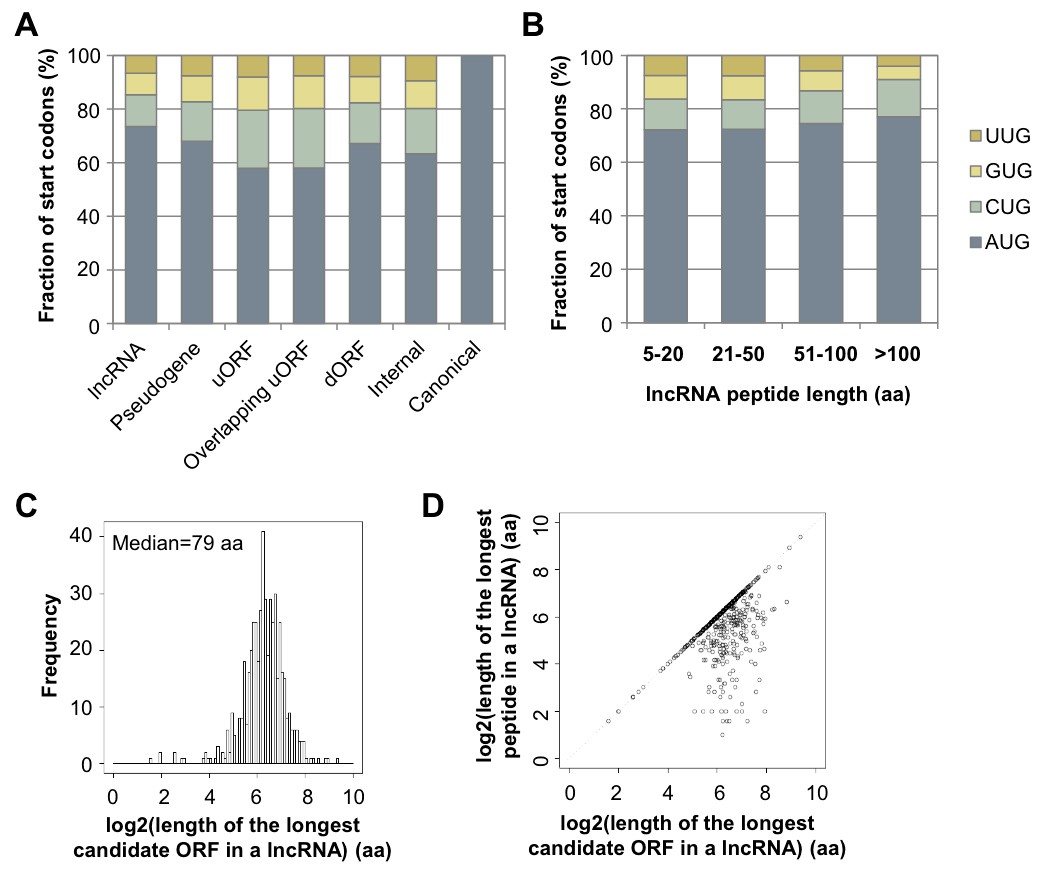
Features of lncRNA translation.
(A) Start codon of translated ORFs in lncRNAs and mRNAs. (B) Start codon of translated ORFs in lncRNA grouped based on length. (C) Length of the longest candidate ORFs in a given lncRNAs considering start codon variants (A/C/G/UUG). (D) Length of the longest candidate ORFs in a given lncRNAs versus length of the longest peptides translated in a given lncRNAs.
Figure 4—figure supplement 2
Conservation of nucleotides encoding lncRNA and pseudogene peptides.
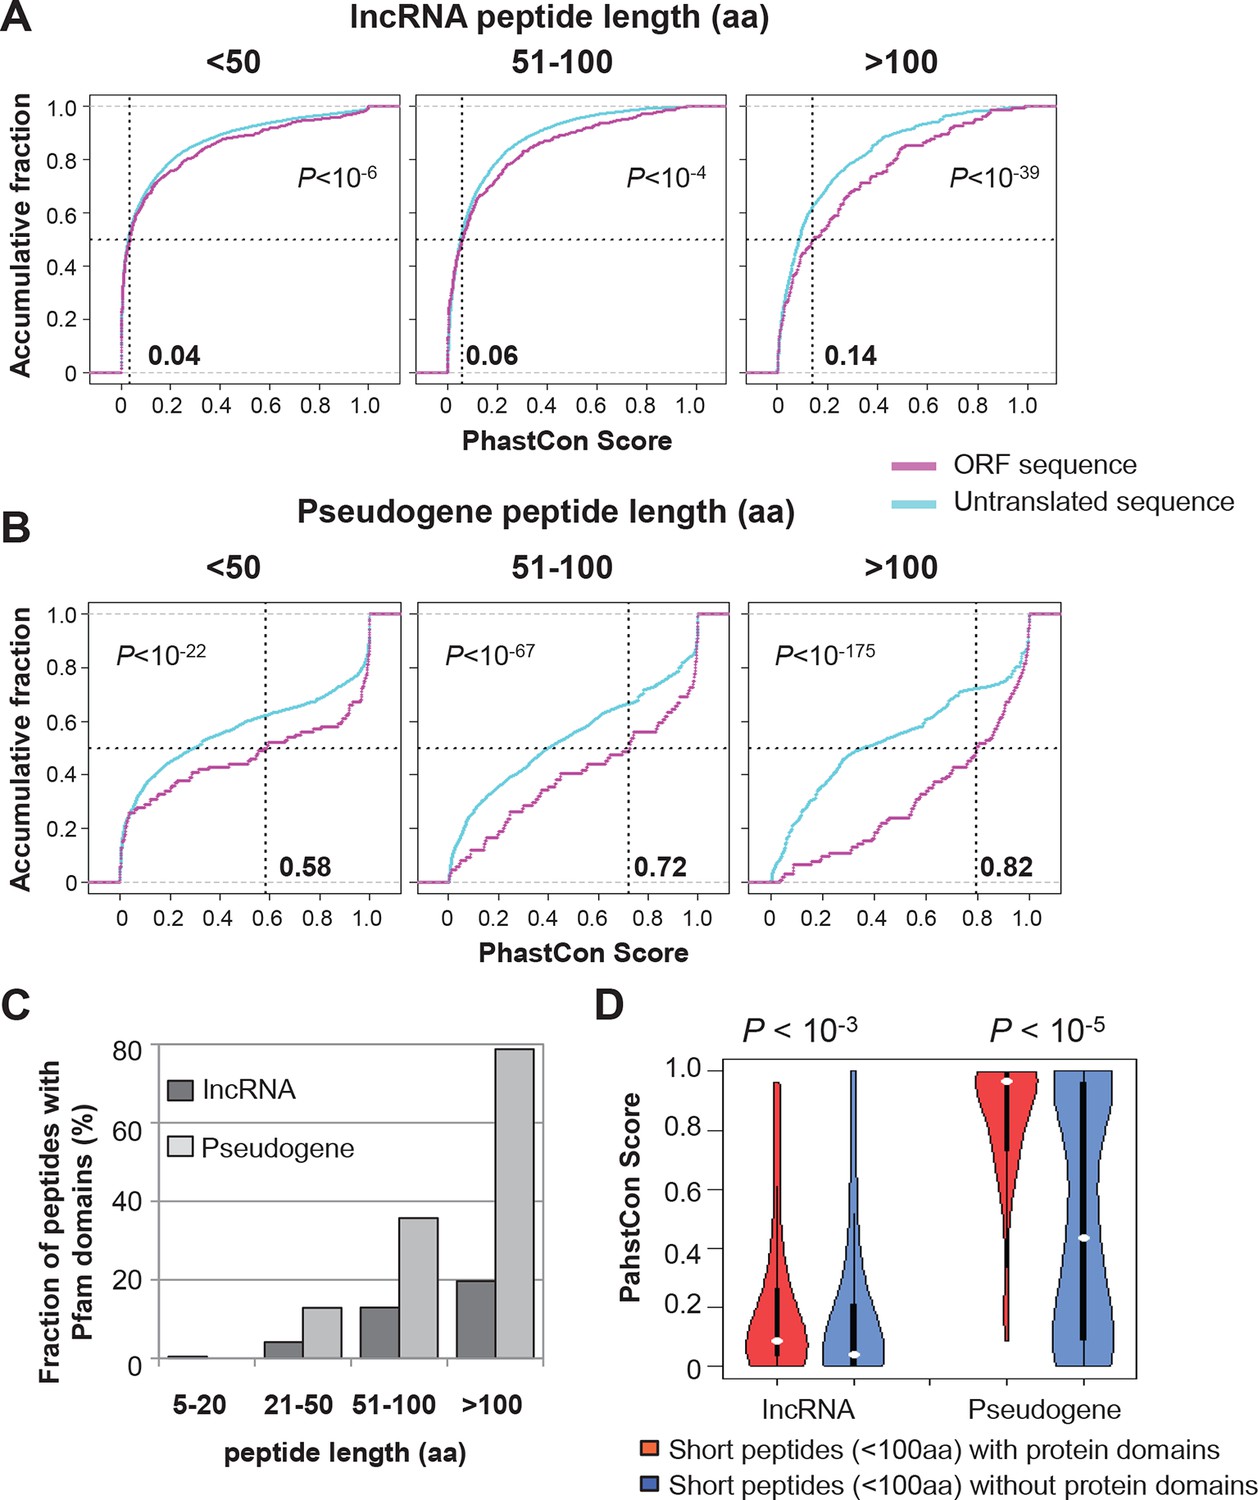
(A) PhastCon scores of nucleotides encoding lncRNA peptide grouped based on length. The median PhastCon value of translated ORFs in each group was shown. The PhastCon scores of random untranslated sequences of matching sizes and locations are also plotted. (B) PhastCon scores of nucleotides encoding pseudogene peptide grouped based on length. The median PhastCon value of translated ORFs in each group was shown. The PhastCon scores of random untranslated sequences of matching sizes and locations are also plotted. (C) Fractions of lncRNA and pseudogene peptides with protein domain annotated by Pfam (including both Pfam-A and Pfam-B) using default cutoff E-value <1). (D) PhastCon scores of nucleotides in ORFs of short lncRNA and pseudogene peptides (<100 aa) with or without protein domains. p-values based on the Wilcoxon Rank Sum Test were shown.
Figure 4—figure supplement 3

Coding potential of nucleotides encoding lncRNA and pseudogene peptide.
(A) PhyloCSF scores of nucleotides encoding lncRNA peptide grouped based on length. The PhyloCSF scores of random untranslated sequences of matching sizes and locations are also plotted. Wilcoxon Rank Sum Test p-value comparing ORF sequences and untranslated sequences were shown. And scores of ORFs encoding peptides conserved in mouse and those with Ka/Ks < 0.5 were also shown. (B) PhyloCSF scores of nucleotides encoding pseudogene peptide grouped based on length. The PhyloCSF scores of random untranslated sequences of matching sizes and locations are also plotted. Wilcoxon Rank Sum Test p-value comparing ORF sequences and untranslated sequences were shown. And scores of ORFs encoding peptides conserved in mouse and those with Ka/Ks < 0.5 were also shown.
Figure 4—figure supplement 4

BLASTP E-values of peptide sequences encoded by homologous human and mouse ORF.
(A) LncRNAs (B) Pseudogene RNAs BLASTP E-values between human translated ORFs and their randomized sequences were shown as the control.
Figure 4—figure supplement 5
BLASTP E-values of peptide sequences encoded by homologous human and mouse peptides.
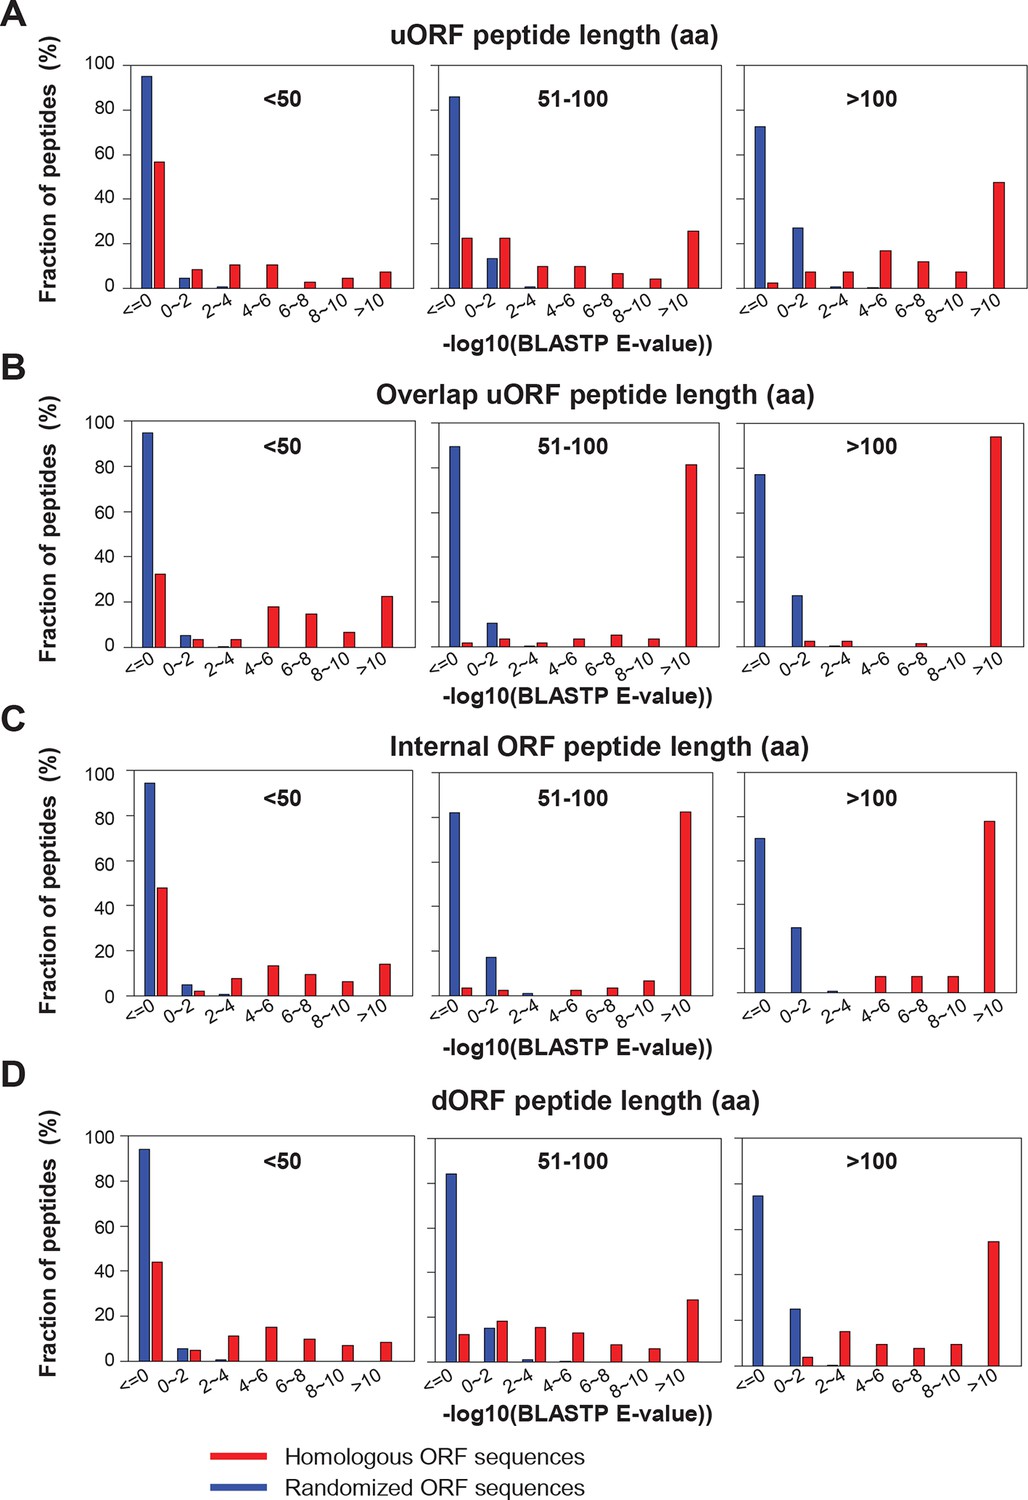
(A) uORFs (B) Overlapping uORFs (C) Internal ORFs (D) dORFs BLASTP E-values between human translated ORFs and their randomized sequences were shown as the control.
Figure 4—figure supplement 6
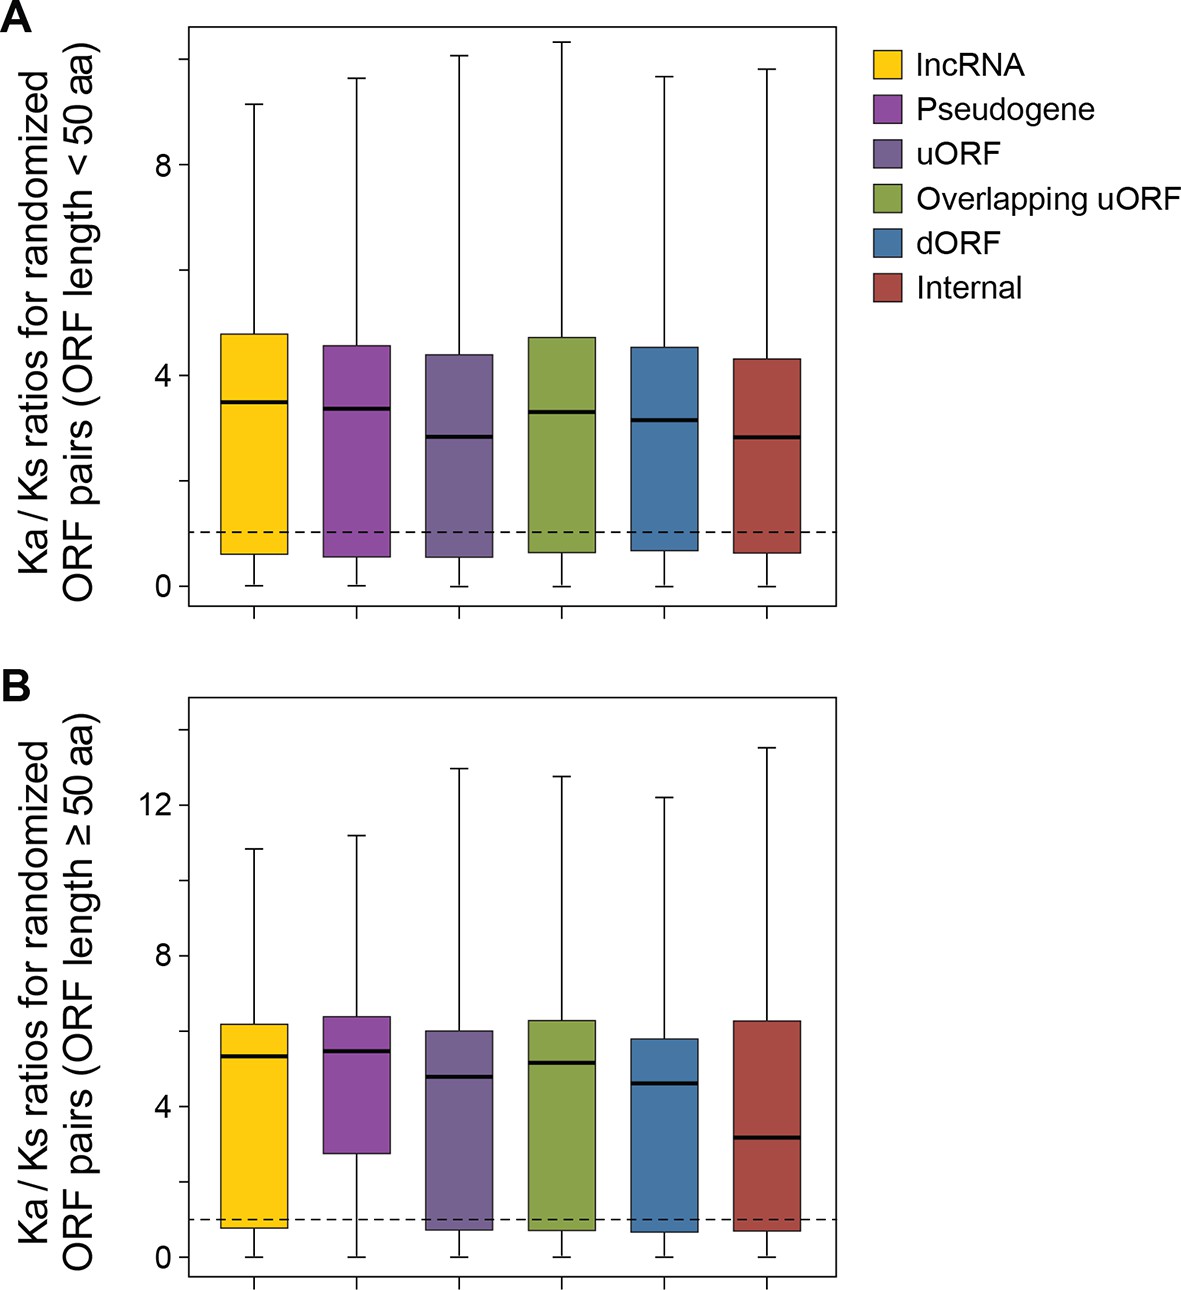
The Ka/Ks ratios between human translated ORFs and 50 randomly generated sequences with BLASTP alignment E-value <10-4.
(A) ORFs < 50 aa. (B) ORFs ≥ 50 aa.
Figure 5
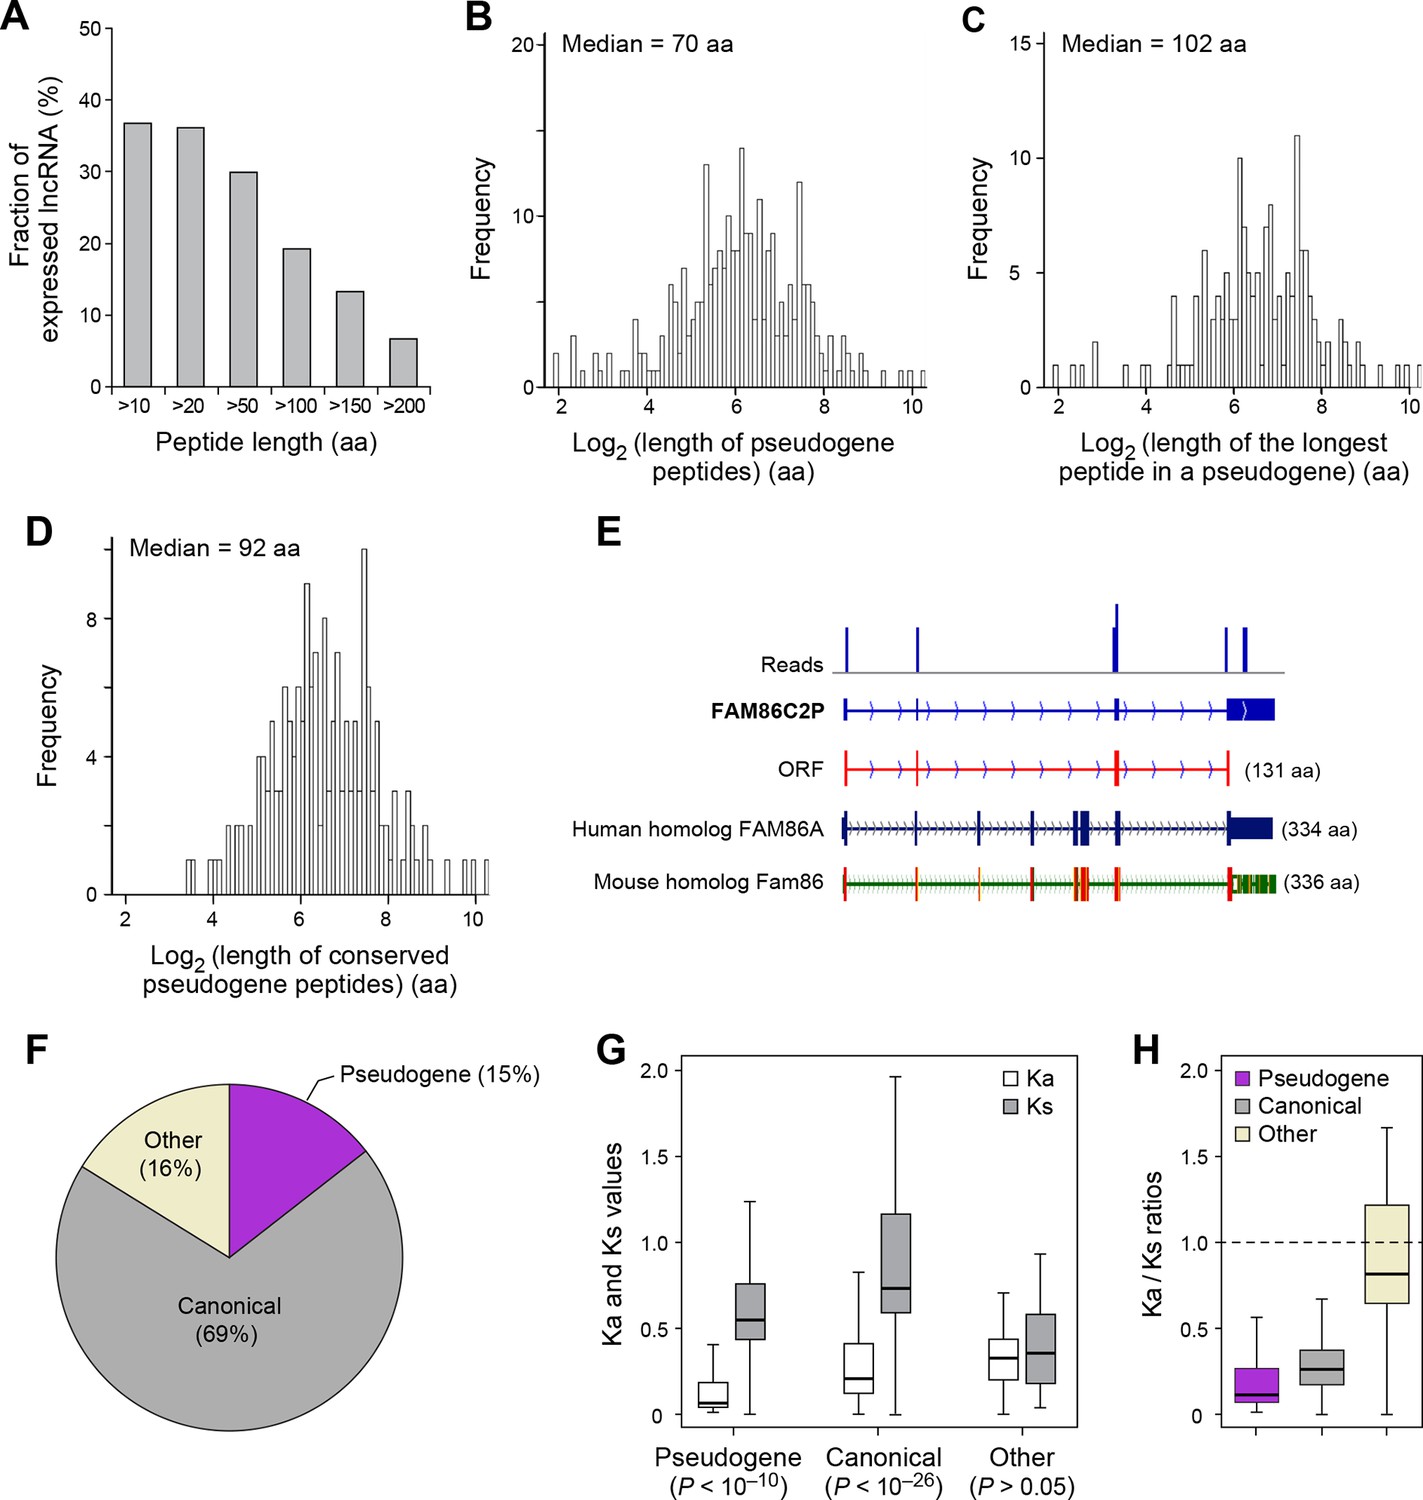
Features and conservation of pseudogene peptides.
(A) Fraction of expressed pseudogenes that encode peptides longer than a certain length. (B) Peptide length encoded by pseudogenes. (C) Length of the longest peptides in a given pseudogenes. (D) Length of conserved pseudogene peptides. (E) Peptide in a human pseudogene FAM86C2P is conserved in the mouse protein coding gene Fam86. FAM86C2P also has a homologous human protein coding gene FAM86A. (F) Conserved human pseudogene peptides, grouped based on their homologous ORF types in mouse genome. (G) Ka and Ks values of types of conserved pseudogene peptides with Z-Test p-values shown. (H) Ka/Ks ratios of types of conserved pseudogene peptides.
Figure 6 with 1 supplement
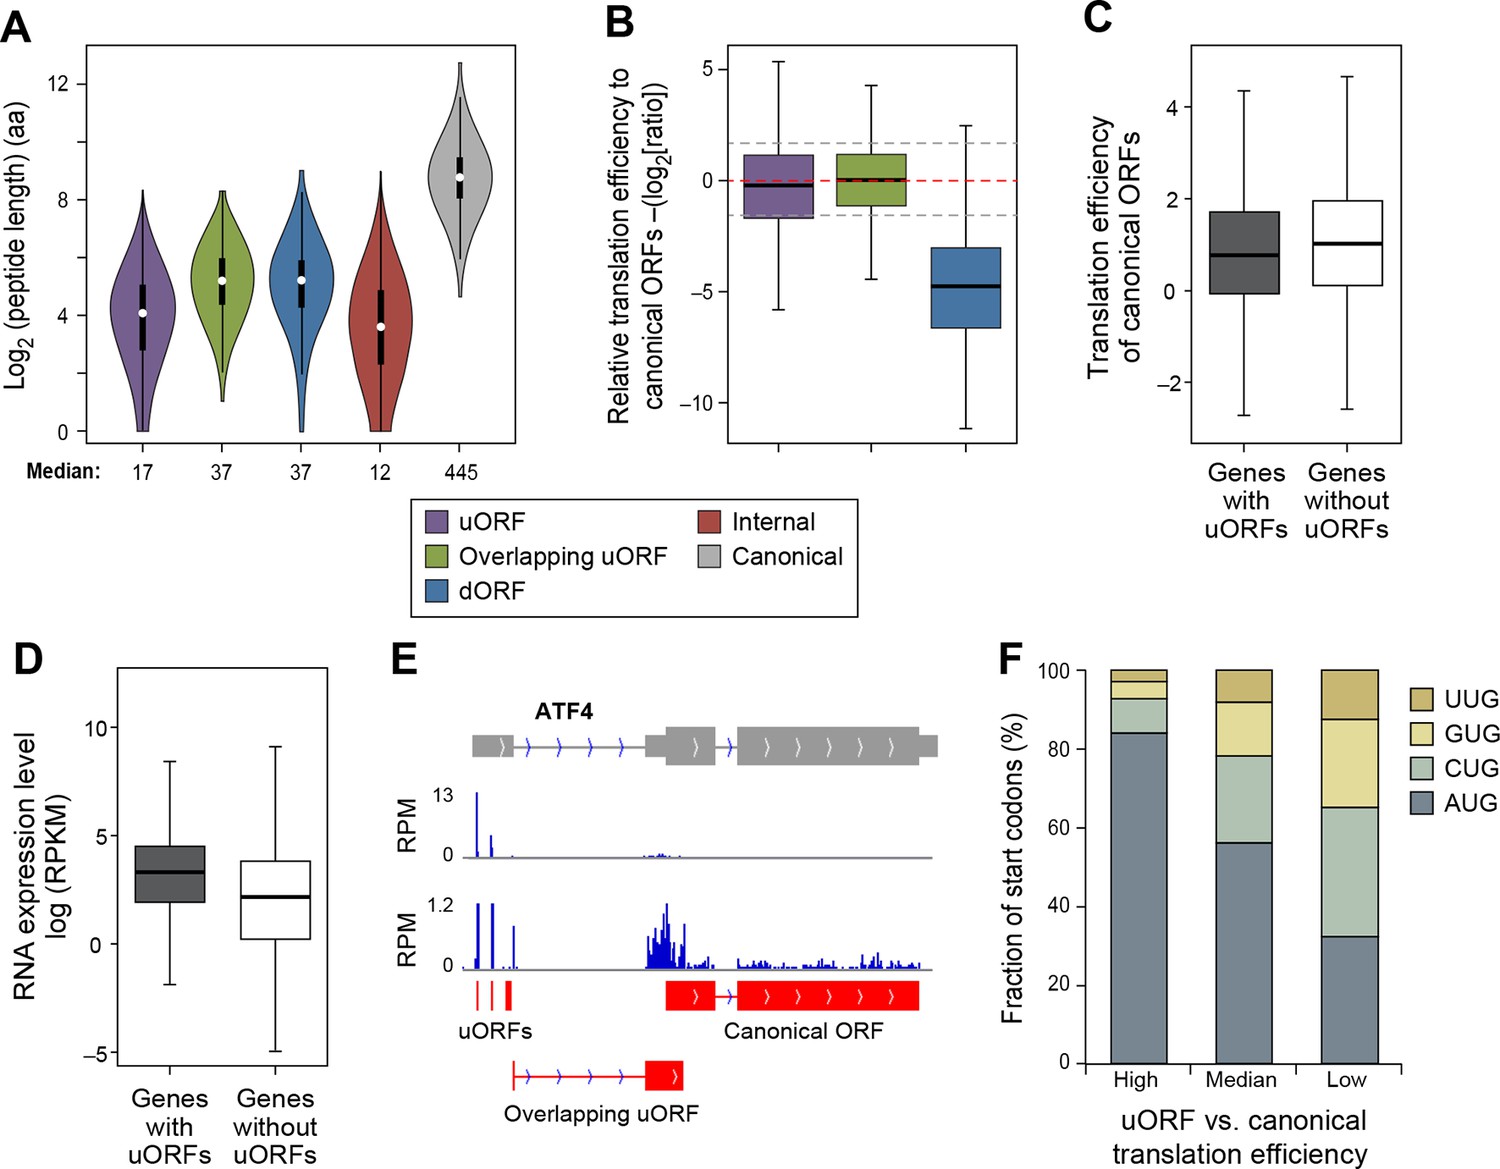
Features of ORFs encoded by protein coding genes.
(A) Length distribution of peptides encoded by human protein coding genes. (B) Relative translation efficiency comparing non-canonical ORF vs. canonical ORF from the same gene. (C) Translation efficiency of canonical ORFs comparing genes with/without uORFs. (D) RNA expression level of genes with/without uORFs, measured by RNA-seq. (E) ATF4 encoded 3 uORFs and 1 overlapping uORF, whose translation efficiency is much higher than the canonical ORF. (F) Start codon types of uORFs showing differential relative expression levels to canonical ORFs. High: >three-fold higher than canonical ORFs. Low: >three-fold lower than canonical ORFs.
Figure 6—figure supplement 1
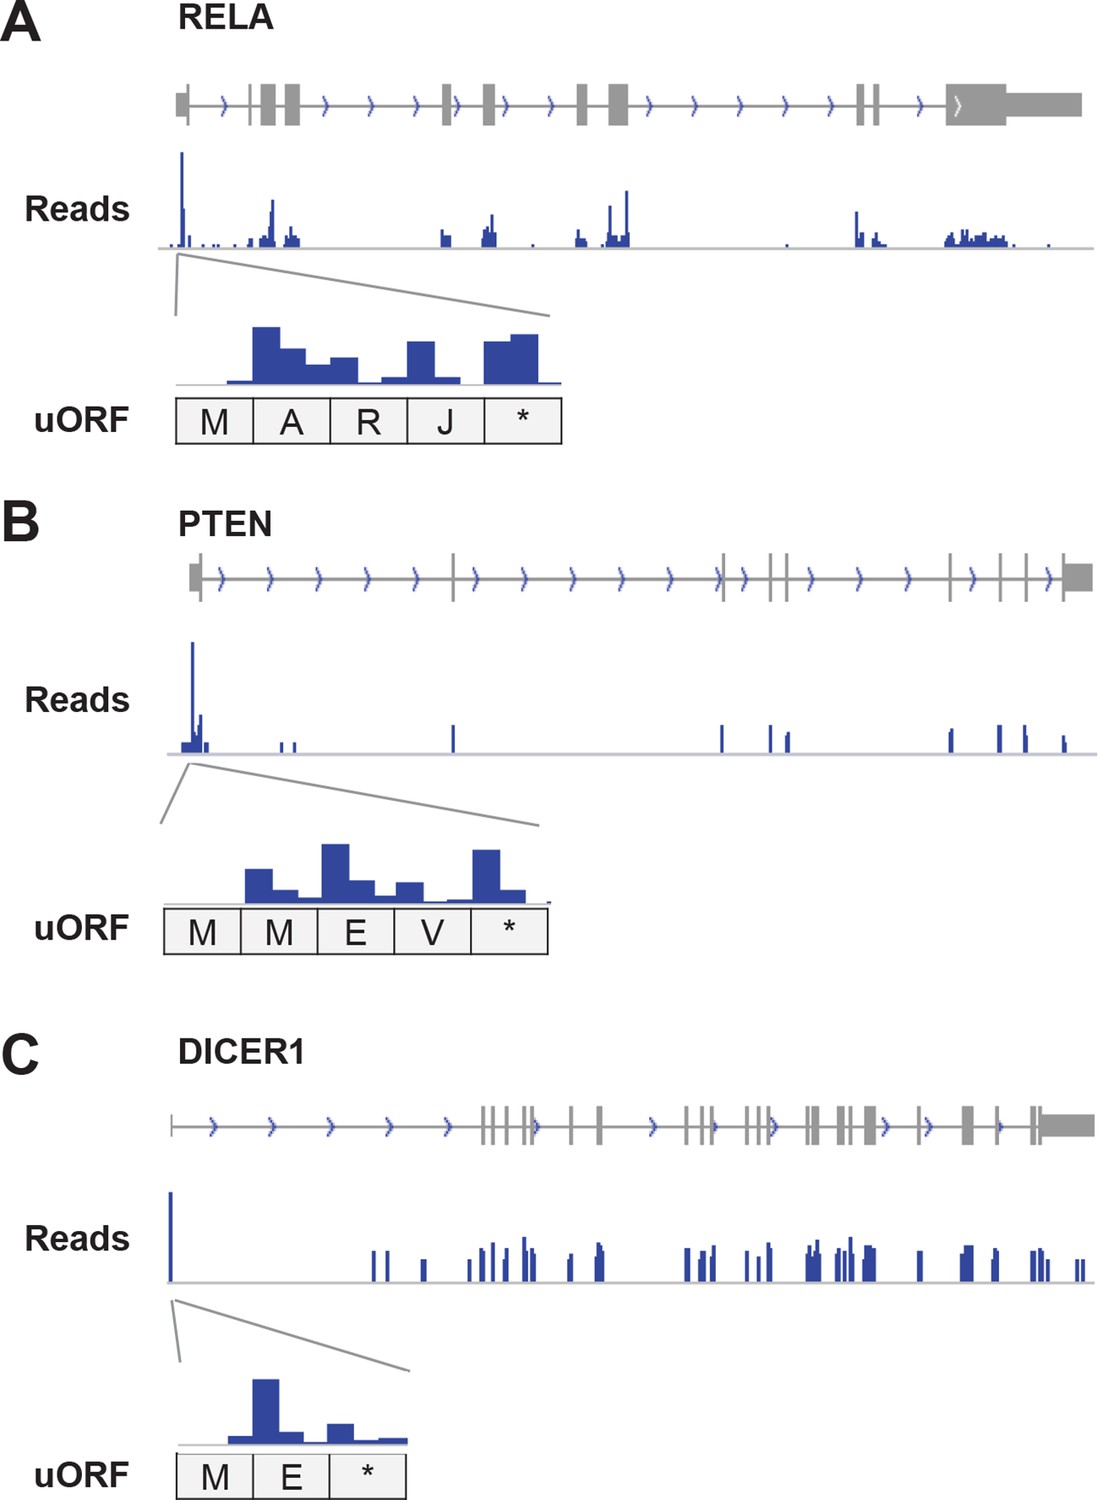
Example genes showing high translation of uORFs.
(A) RELA (B) PTEN (C) DICER1 Enlarged figures show supporting read distribution in uORFs.
Figure 7 with 2 supplements
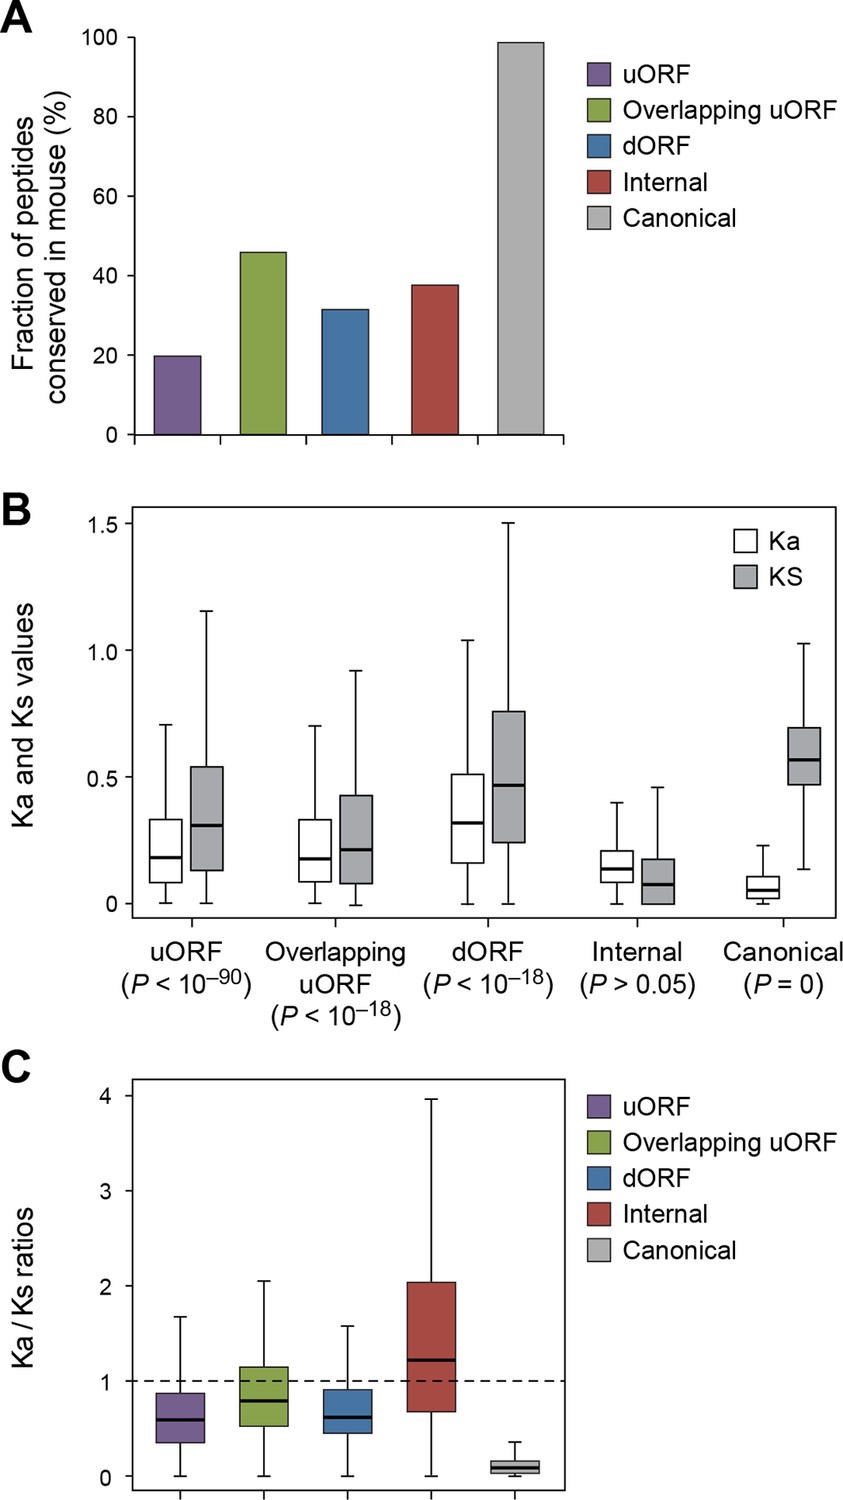
Conservation of non-canonical peptides encoded by mRNAs.
(A) Fraction of human mRNA peptides conserved in mouse. (B) Ka and Ks values of conserved mRNA peptides with Z-Test p-values shown. (C) Ka/Ks ratios of conserved mRNA peptides.
Figure 7—figure supplement 1
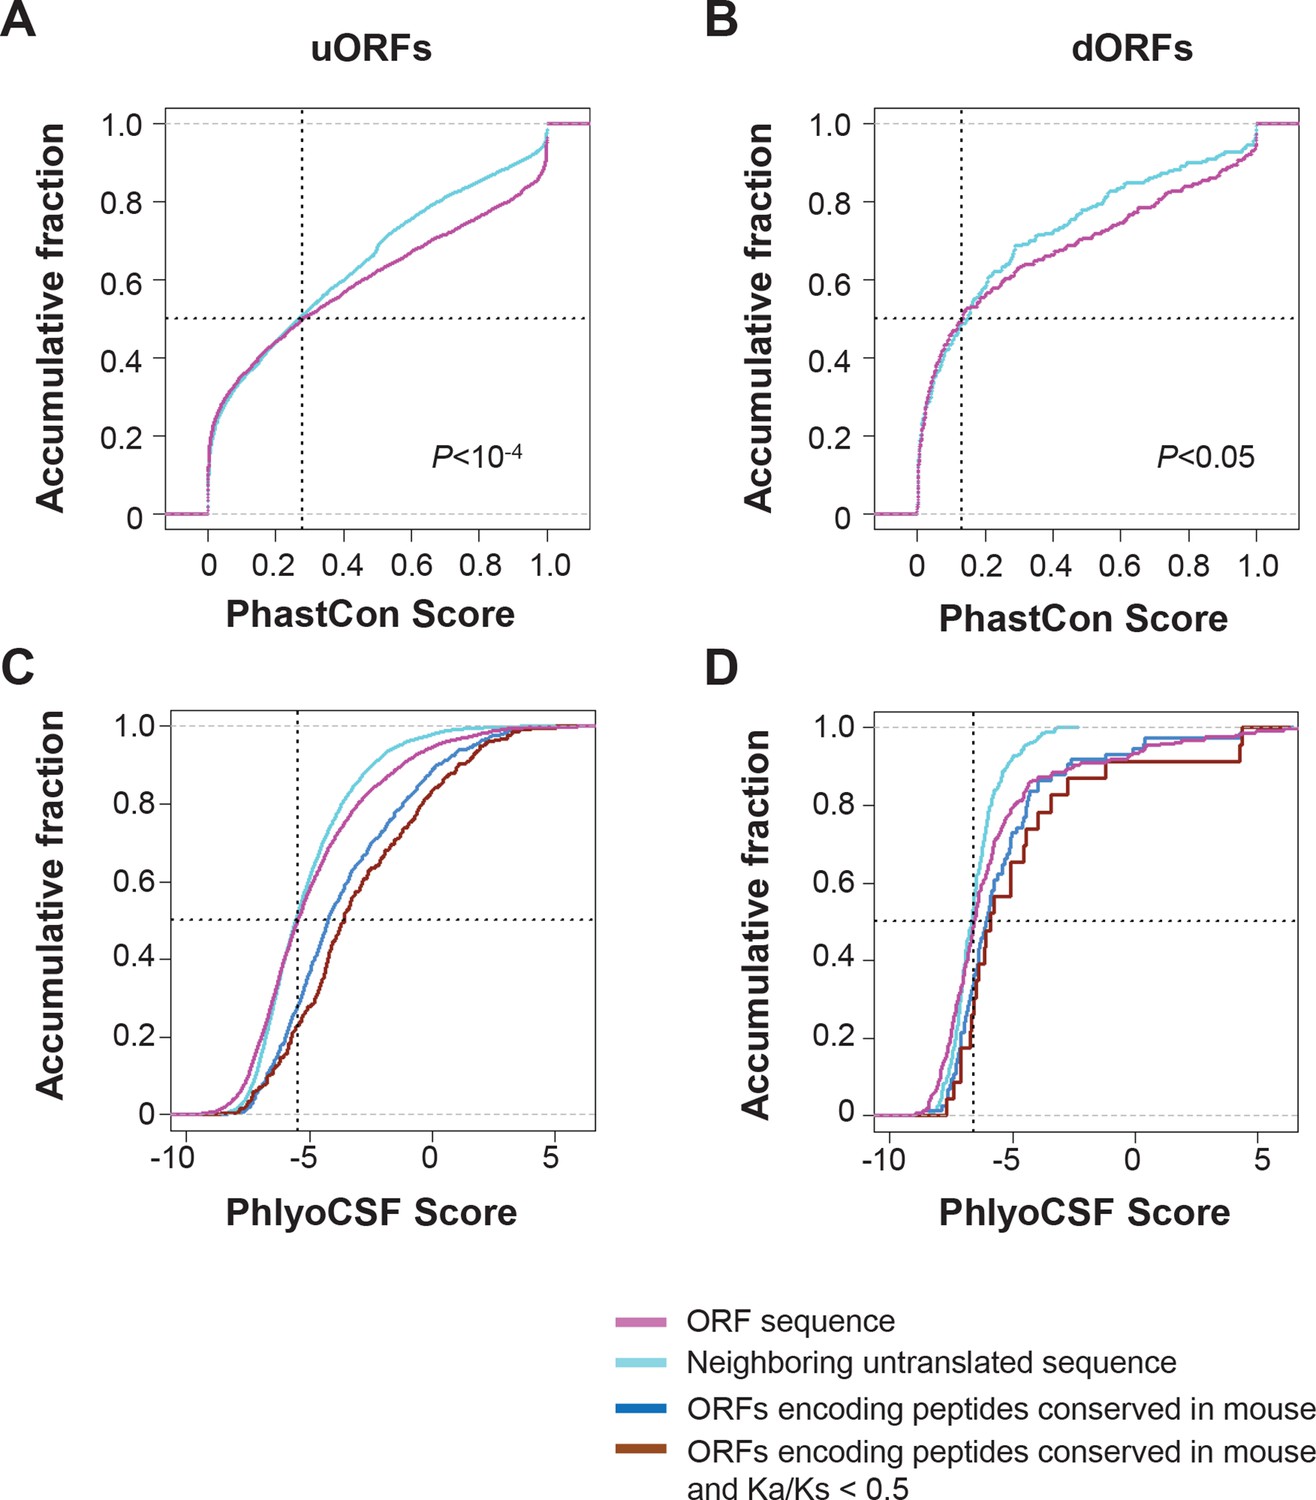
Conservation of nucleotides encoding uORF and dORF peptides.
(A,B) PhastCon scores of nucleotides in uORFs (A) and dORFs (B) and their neighboring untranslated sequences of matching size and location (See methods for detail) were plotted. (C,D) PhyloCSF scores of nucleotides in uORFs (C) and dORFs (D) and their neighboring untranslated sequences of matching size and location were plotted. And scores of ORFs encoding peptides conserved in mouse and those with Ka/Ks < 0.5 were also shown.
Figure 7—figure supplement 2
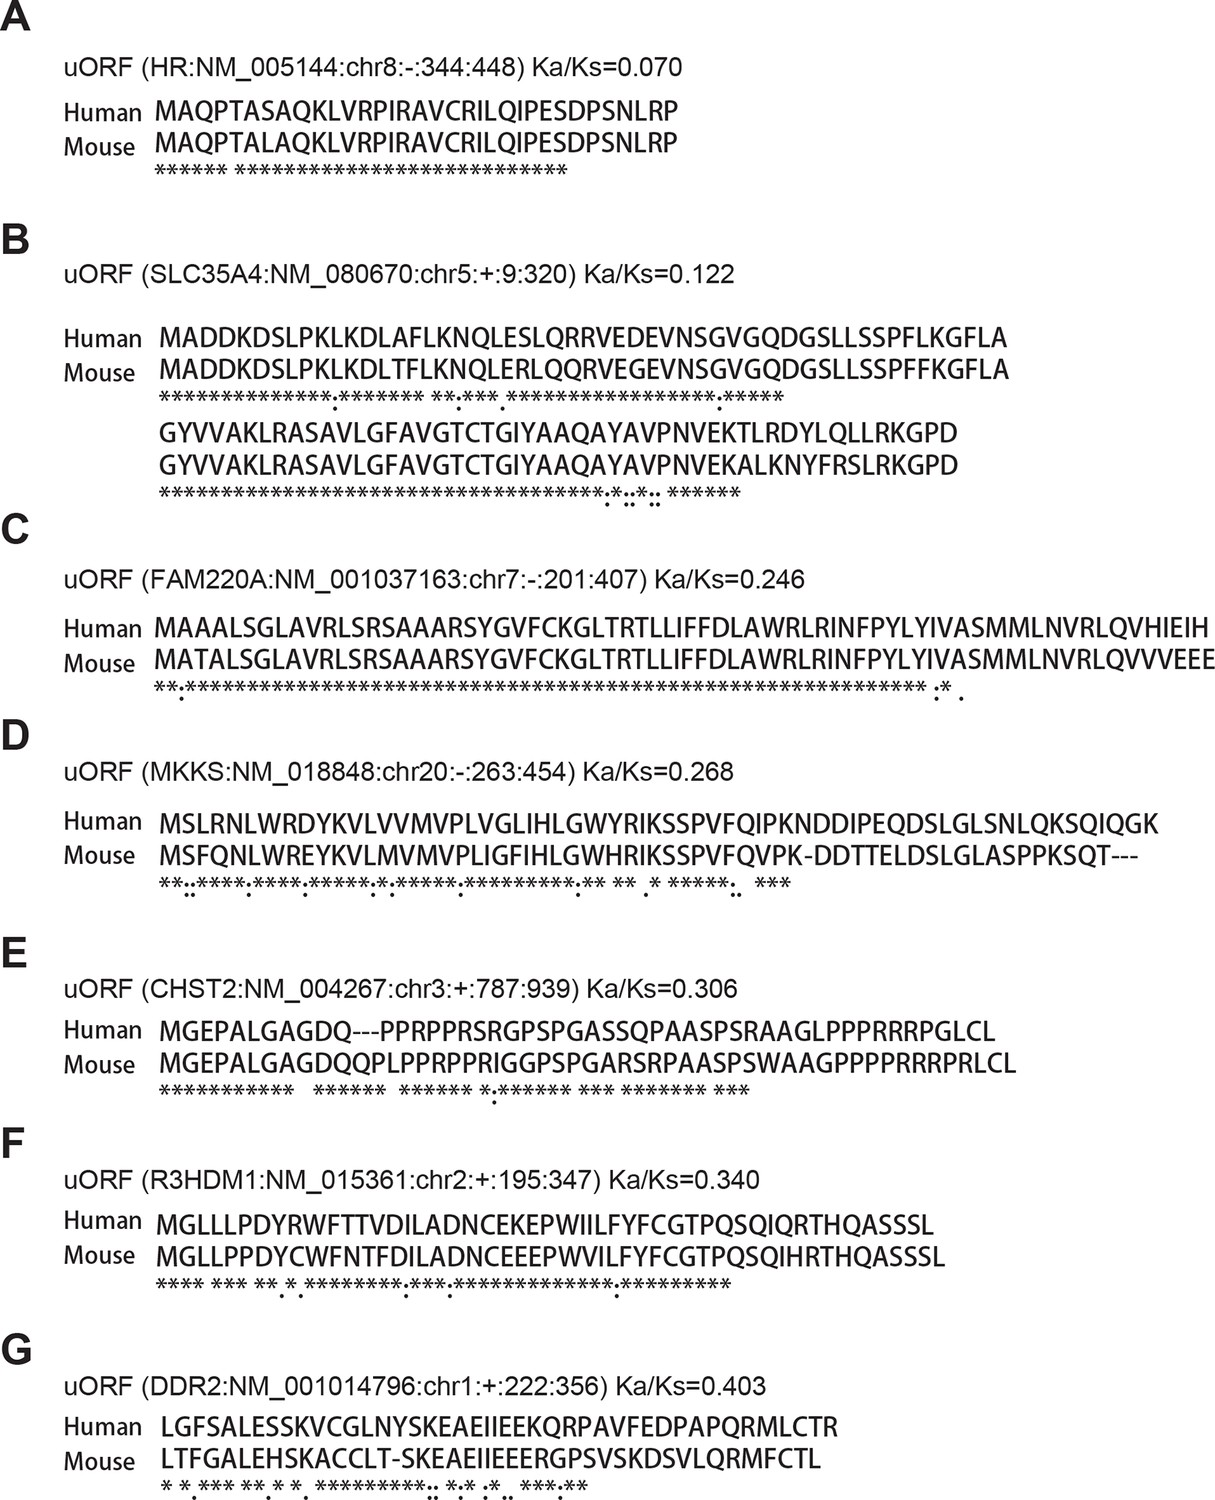
Examples of conserved uORF peptides.
https://doi.org/10.7554/eLife.08890.022Additional files
-
Supplementary file 1
Identified non-canonical human translated ORFs.
- https://doi.org/10.7554/eLife.08890.023
-
Supplementary file 2
Human non-canonical peptides conserved in mouse.
- https://doi.org/10.7554/eLife.08890.024
-
Supplementary file 3
uORF and dORFs with high translational efficiency (>three-fold higher than canonical ORFs).
- https://doi.org/10.7554/eLife.08890.025
Download links
A two-part list of links to download the article, or parts of the article, in various formats.
Downloads (link to download the article as PDF)
Open citations (links to open the citations from this article in various online reference manager services)
Cite this article (links to download the citations from this article in formats compatible with various reference manager tools)
Many lncRNAs, 5’UTRs, and pseudogenes are translated and some are likely to express functional proteins
eLife 4:e08890.
https://doi.org/10.7554/eLife.08890


