Specific cancer-associated mutations in the switch III region of Ras increase tumorigenicity by nanocluster augmentation
- Åbo Akademi University, Finland
- University of Helsinki, Finland
- University of Texas Health Science Center at Houston, United States
- University of Turku, Finland
Figures
Figure 1 with 1 supplement
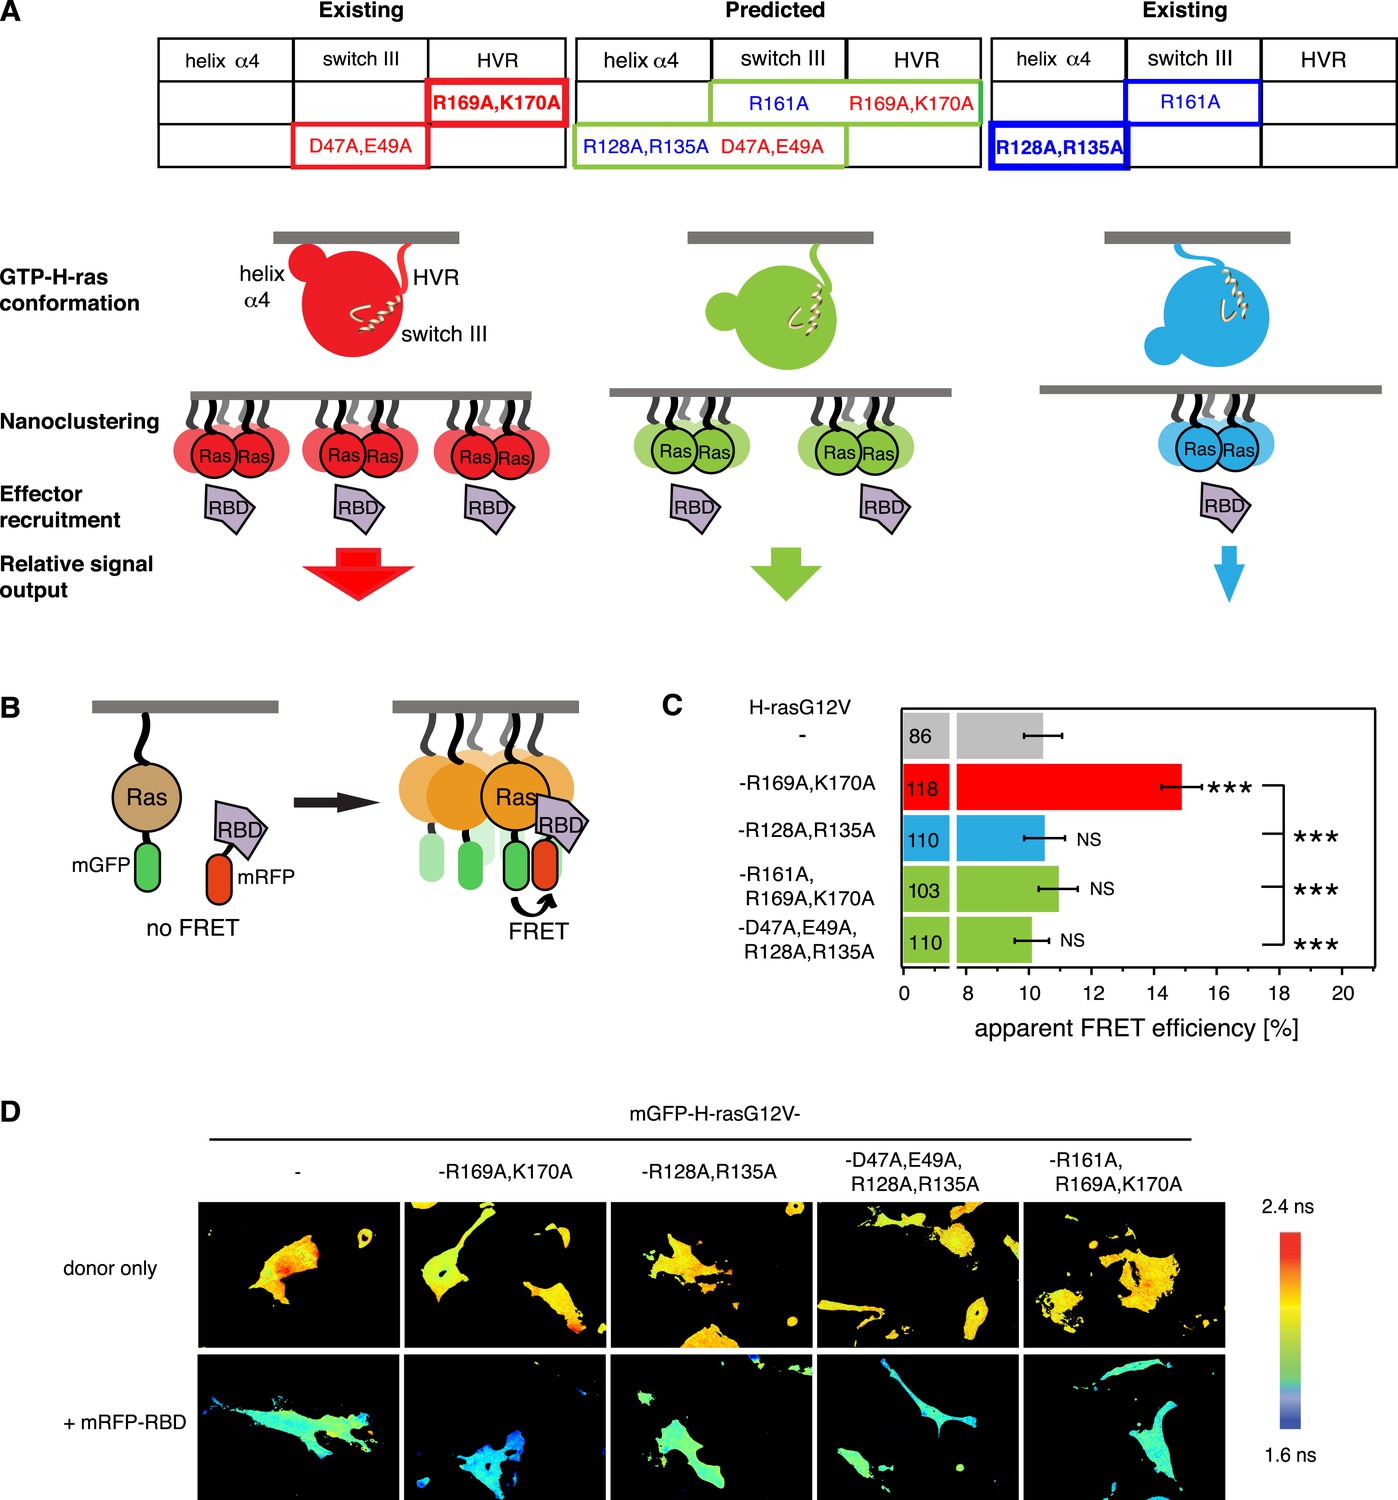
Intramolecular switch III-conformer coupling suggests altered nanoclustering in switch III mutants.
(A) Schematic representation of conformer-nanocluster coupling and its effect on H-ras signaling. For GTP-Ras a conformational equilibrium is assumed, which can be shifted by mutations as indicated by matching colors (top tables, show mutations by region in Ras). Mutations in the table increase (red) or decrease/neutralize (blue) H-ras activity. For mutations boxed in bold this was previously shown to proceed by increasing or decreasing H-ras nanoclustering, respectively. As a consequence, the effector recruitment and thus downstream signaling are correspondingly modulated. Note, that a direct effect of the Ras conformation on effector engagement is not excluded. The green scenario represents the normal activity, which is predicted for the combinations of activity increasing and decreasing/neutralizing mutations (green scenario in centre), if switch III couples to H-ras reorientation. (B) Schematic representation of the RBD-recruitment FRET assay. Ras activity was measured by mRFP-C-Raf-RBD recruitment to mGFP-tagged mutants of Ras in intact cells using FRET. (C) RBD-recruitment FRET data of indicated H-ras mutants transiently expressed in BHK cells. Numbers in bars give number of analyzed cells from three independent experiments. Error bars represent the standard error of the mean (±SEM). The color code of the bars is as in (A) and indicates if the mutations increased, decreased/neutralized or normalized RBD-recruitment as compared to H-rasG12V. Statistical analysis of differences vs H-rasG12V was performed as described in ‘Materials and methods’ (NS, non-significant; ***, p < 0.001). (D) FRET in (C) was measured by fluorescence lifetime microscopy of transfected BHK cells as indicated. Color look up table to the right shows fluorescence lifetimes. See also Figure 1—figure supplement 1.
Figure 1—figure supplement 1
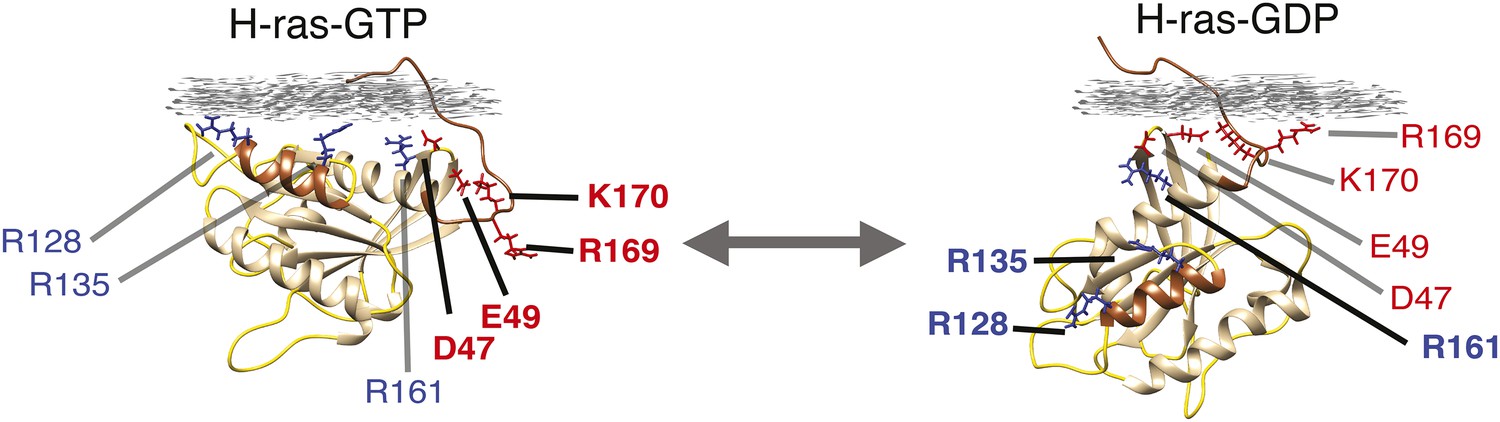
Nucleotide-dependent H-ras conformers on the membrane.
Computational modeling-derived structures of the predominant H-ras-GTP- (left) and H-ras-GDP- (right) conformers on the membrane. Conformer stabilizing residues R128,R135 on helix α4 and R169,K170 in the hypervariable region (hvr), as well as switch III region residues of helix α5 (R161) and β2-β3-loop (D47,E49) are indicated. Color-coding as in Figure 1A.
Figure 2 with 2 supplements

Computational modeling-derived switch III mutations D47A,E49A in H-ras increase nanoclustering and RBD-recruitment.
(A) Electron microscopic nanoclustering analysis of mGFP-H-rasG12V and mGFP-H-rasG12V-D47A,E49A in BHK cells. Normalized univariate K-functions, where maximal L(r)-r values above the 99% CI for complete spatial randomness indicate clustering at that value of r (number of membrane sheets analyzed per condition, n = 17). (B) Schematic representation of nanoclustering-FRET analysis, where mGFP-tagged and mCherry-tagged Ras constructs were co-expressed in cells. (C) The nanoclustering-FRET response of H-rasG12V-D47A,E49A and its parent construct in dependence of the dose of the nanocluster scaffold Gal-1 in BHK cells. (D) Representative nanoclustering-FRET fluorescence lifetime images of BHK cells expressing FRET-pairs (or donor only, left column) of constructs indicated on the left, under Gal-1 conditions as annotated on the top. Color look up table to the right shows fluorescence lifetimes. (E) RBD-recruitment FRET data of H-rasG12V-D47A,E49A and its parent construct at three different Gal-1 doses analyzed using FRET-imaging of transiently transfected BHK cells. (C, E) Numbers in bars give numbers of analyzed cells from three independent experiments. Error bars represent the standard error of the mean (±SEM). Statistical analysis vs parent RasG12V was performed as described in ‘Materials and methods’ (*p < 0.05; **p < 0.01; ***p < 0.001). (F) Western blot analysis of C-Raf, MEK, and ERK phosphorylation and C-Raf in BHK cells transiently expressing mGFP-H-rasG12V-D47A,E49K, its parent or an empty vector control. Equal expression of Ras constructs can be seen in the mGFP row, equal loading in the Actin row. (G) In vitro RBD binding to mant-GTPγS loaded wild-type (wt) H-ras or H-ras-D47A,E49A measured with a fluorescence anisotropy assay. Details on the fitting function are in the ‘Materials and methods’. Data are averages ±SEM of three repeats. (H) RBD-pulldown experiments in BHK cells transiently expressing indicated H-ras mutants or wt H-ras. Top panel shows level of active Ras after EGF-stimulation (100 ng/ml). Bottom panel shows GAP sensitivity of wt and mutant H-ras proteins. See also Figure 2—figure supplement 1 and Figure 2—figure supplement 2.
Figure 2—figure supplement 1
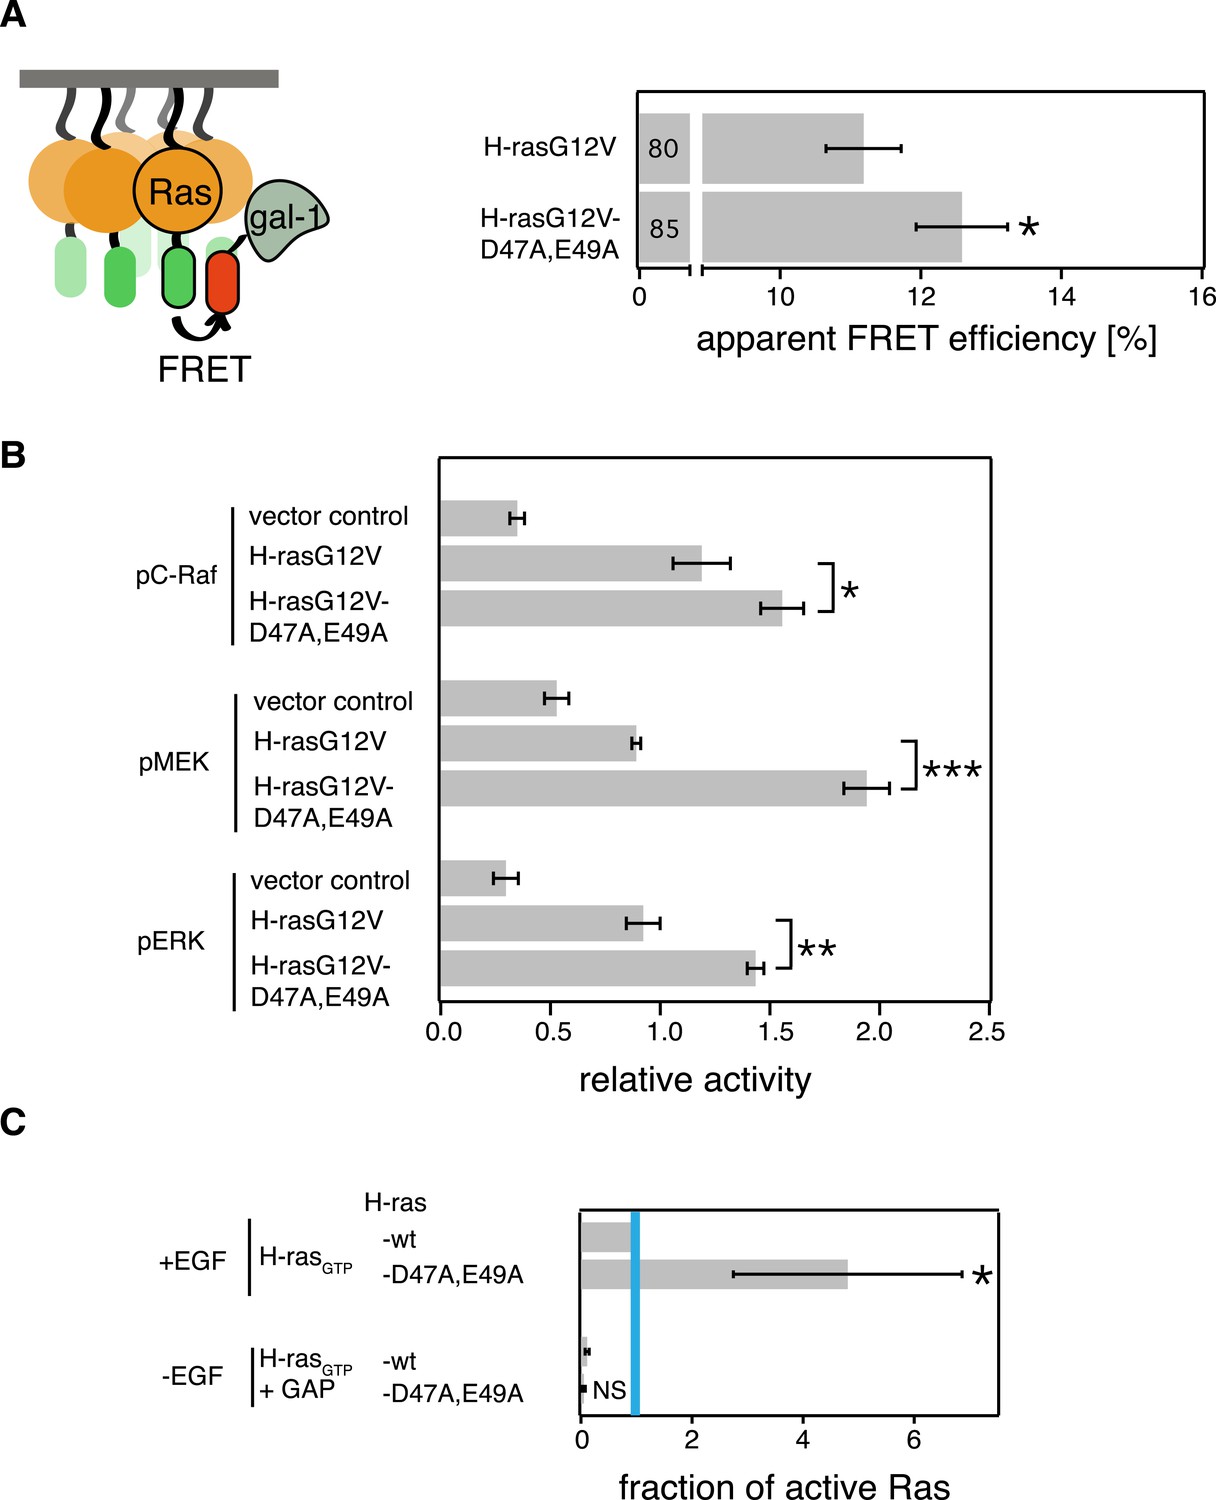
The computational modeling-derived switch III H-ras mutant exhibits stronger Gal-1 complexation and remains sensitive to GAP-mediated hydrolysis.
(A) Schematic representation of the Gal-1-complexation FRET assay in which complexation of mRFP-Gal-1 with mGFP-tagged mutants of Ras was measured in intact BHK cells using FRET (left). Gal-1-complexation FRET analysis of H-rasG12V-D47A,E49A and its parent construct. Numbers in bars give number of analyzed cells from three independent experiments. Error bars represent the standard error of the mean (±SEM). Statistical analysis of differences vs H-rasG12V was performed as described in ‘Materials and methods’ (*p < 0.05) (right). (B) Relative amounts of phosphorylated C-Raf, MEK and ERK in BHK cells transiently expressing vector control, mGFP-H-rasG12V or mGFP-H-rasG12V-D47A,E49A determined by western blotting from three independent repeats. Error bars represent the standard error of the mean (±SEM). Quantification of band intensities and statistical analysis was performed as described in ‘Materials and methods’ (*p < 0.05, **p < 0.01, ***p < 0.001). (C) RBD-pulldown experiment quantification of the active, GTP-bound fraction of H-ras-D47A,E49A in BHK cells. +EGF denotes stimulation with 100 ng/ml EGF. −EGF serum starved cells. +GAP incubation with GAP domain of NF1, to assay for GAP-sensitivity. The graphs represent the averages of active H-ras-D47A,E49A normalized to wt H-ras + EGF-stimulation from three independent experiments. Blue vertical line annotates the activity of wt H-ras when stimulated with EGF. Error bars represent the standard error of the mean (±SEM). Statistical analysis was performed as described in ‘Materials and methods’ (NS, non-significant; **p < 0.01, *p < 0.05).
Figure 2—figure supplement 2
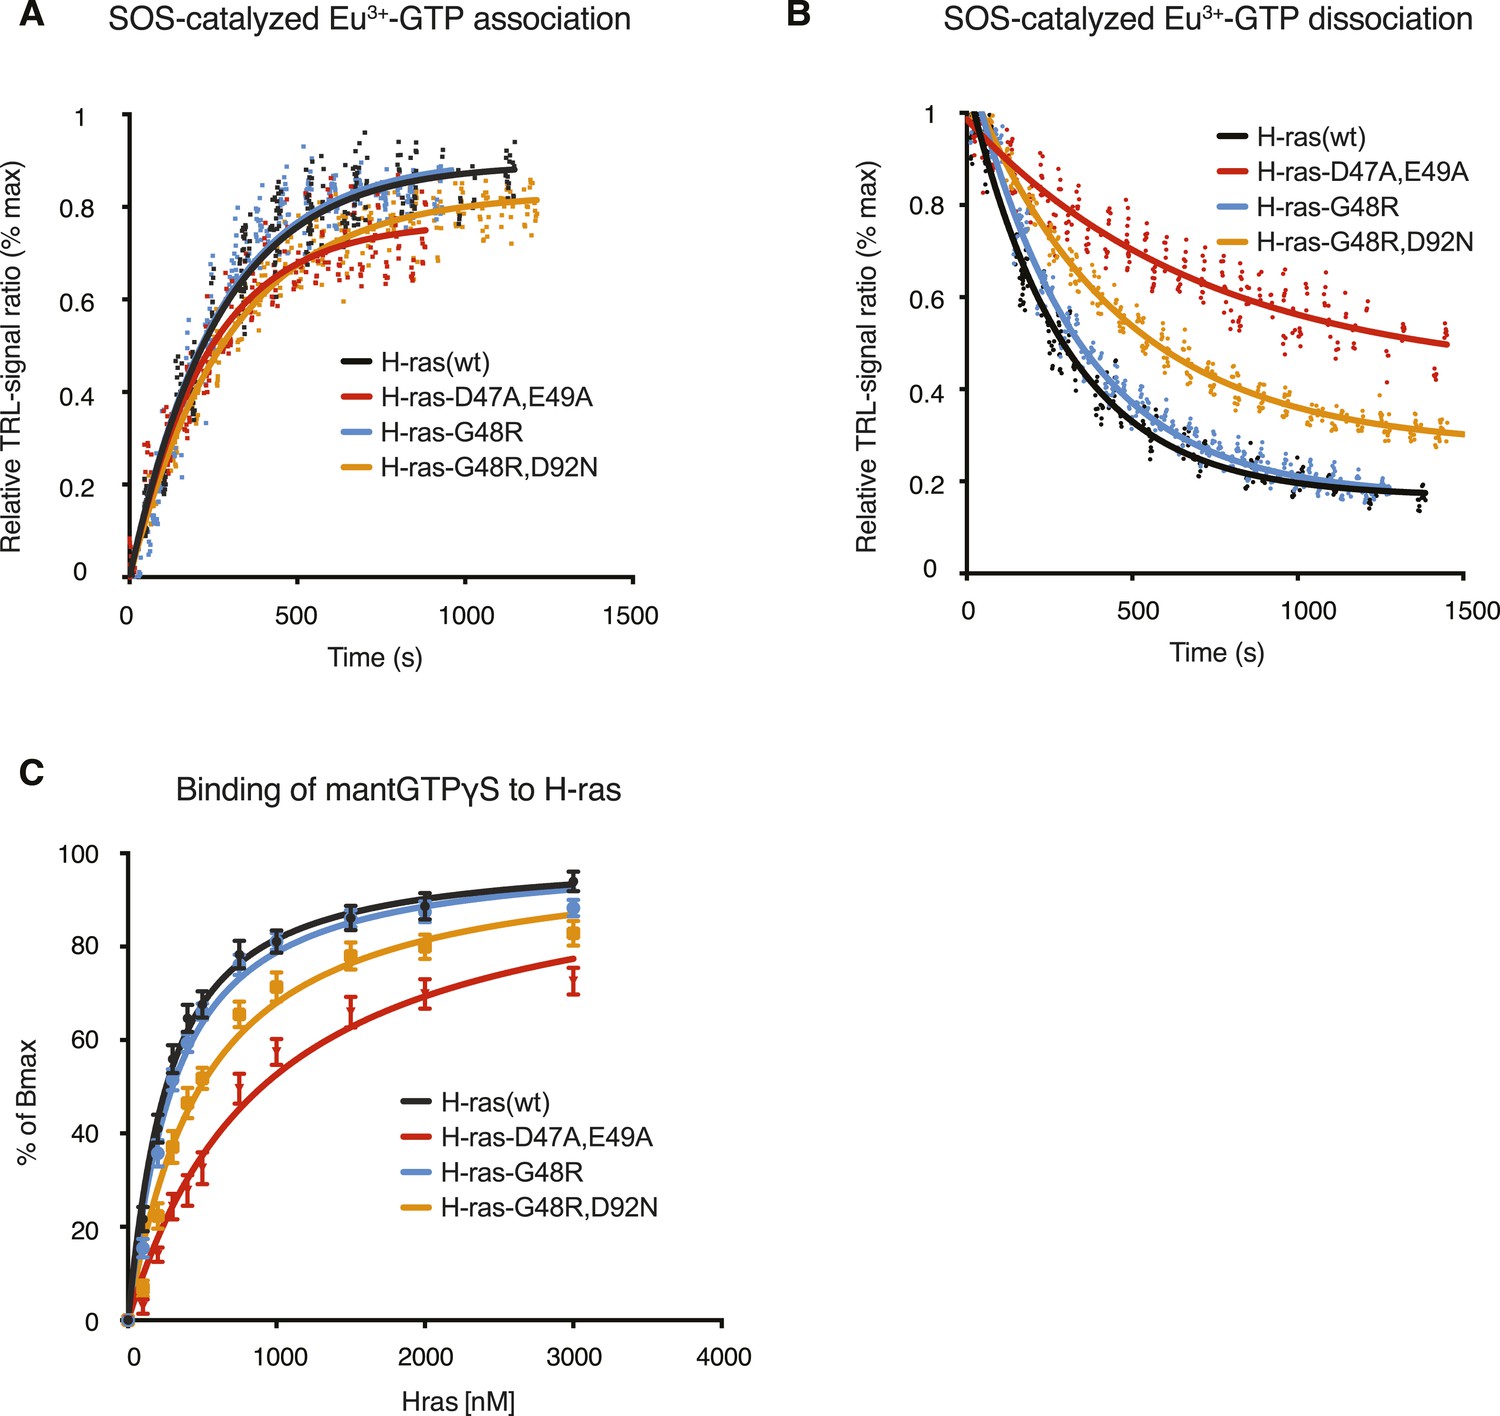
SOS-mediated nucleotide exchange kinetics, as well as mantGTPγS dissociation constants of wt H-ras and mutants.
SOS-induced Eu3+-GTP association (A) and dissociation (B) kinetics with wt H-ras (black), H-ras-D47A,E49A (red), H-ras-G48R (blue), and H-ras-G48R,D92N (orange) monitored using the quenching resonance energy transfer (QRET) technique. Dots represent data points obtained from individual reactions, with a total of 360 individual data points for each H-ras. (C) Fluorescence anisotropy binding data for the derivation of dissociation constants (Kd) between mantGTPγS and wt H-ras (black), H-ras-D47A,E49A (red), H-ras-G48R (blue), and H-ras-G48R,D92N (orange). Details are described in the ‘Materials and methods’.
Figure 3 with 1 supplement
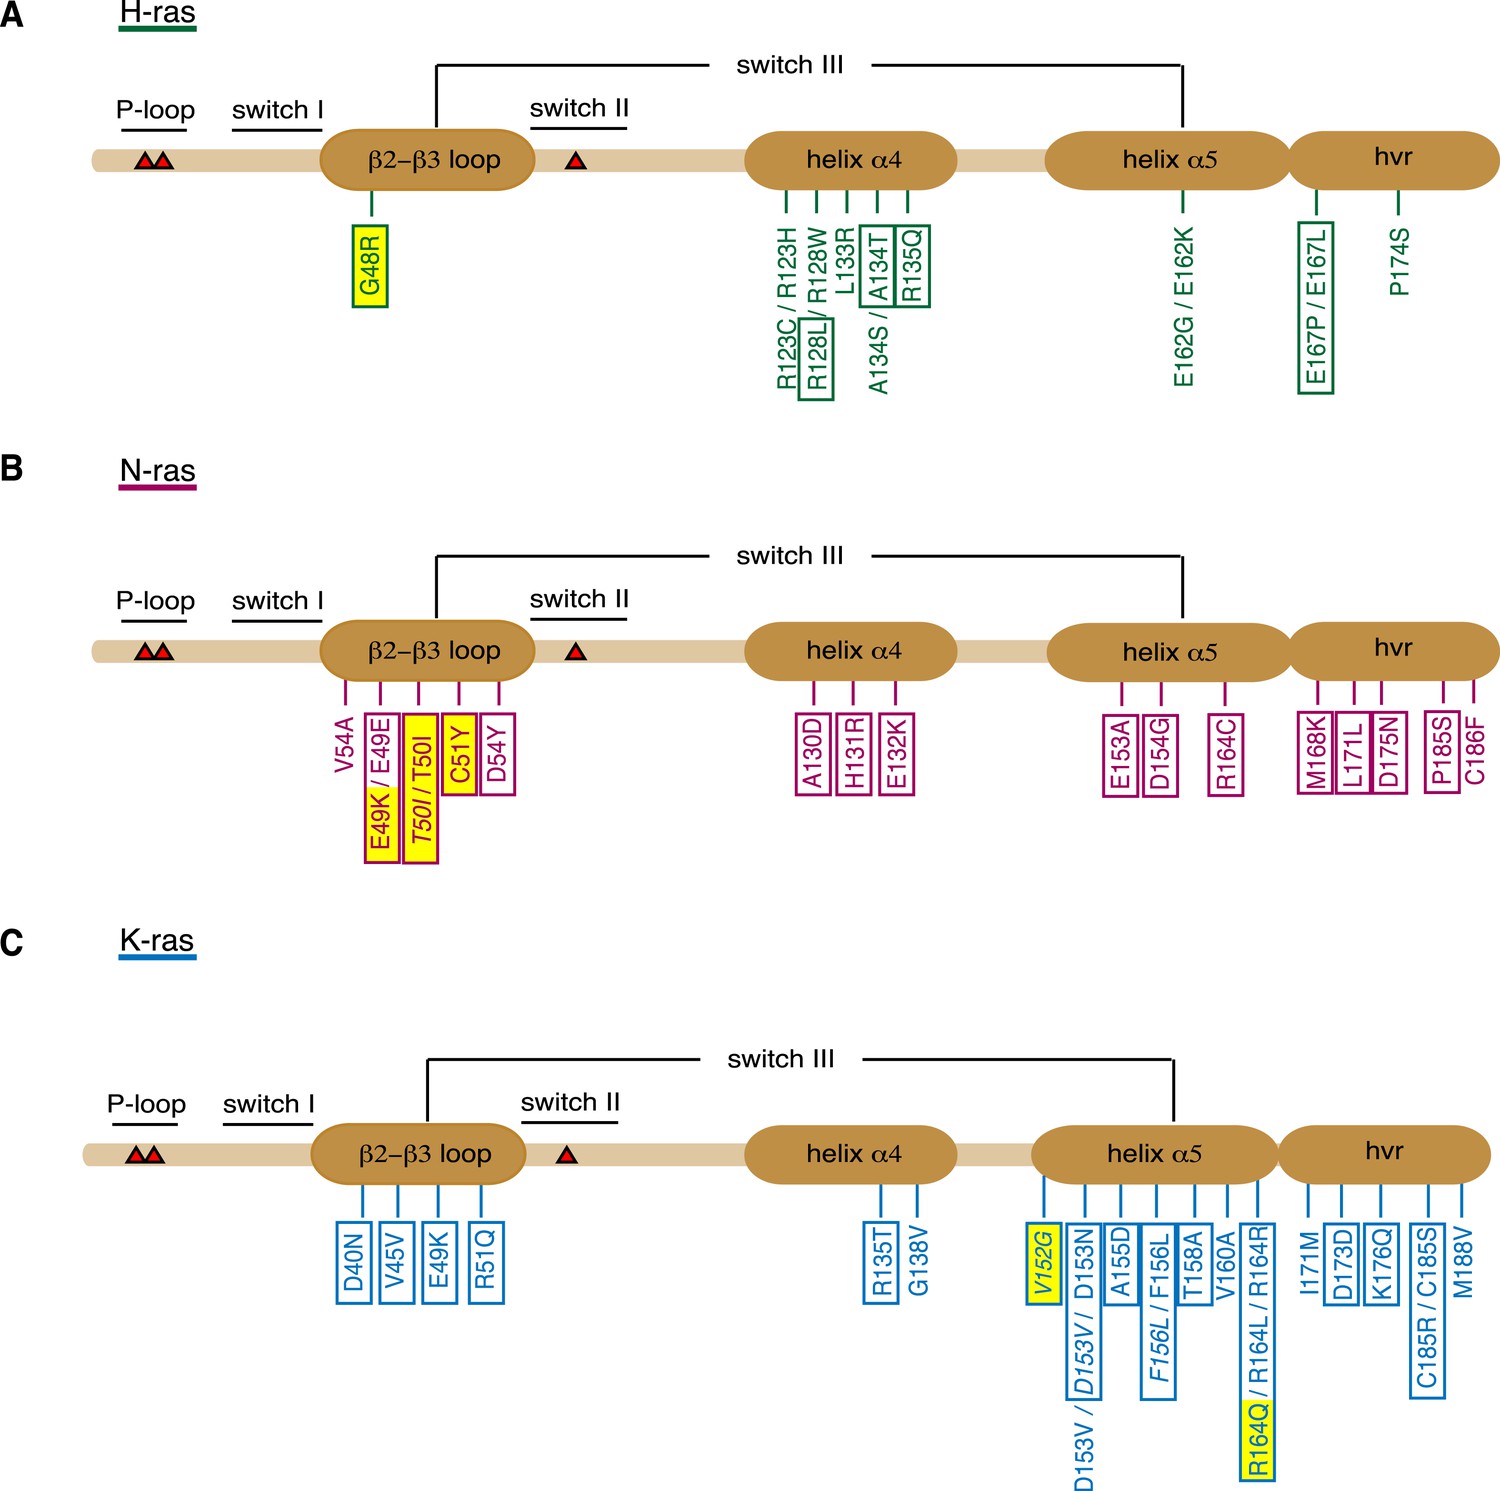
Orientation-switch III mutations in oncogenic Ras isoforms that are reported in cancer genome databases.
Cancer-associated point mutations (missense, nonsense, and silent) in the orientation-switch III regions as reported in COSMIC, cBioPortal, and ICGC databases. Schematic representations of the linear protein structures of (A) H-ras, (B) N-ras, and (C) K-ras. Critical functional regions in the structures are annotated; those of the orientation-switch III by ovals. Approximate position of hot-spot mutation residues (G12, G13, and Q61) is marked with red triangles. Mutations from cancer patient samples are boxed, RASopathy mutations are boxed and in italics, other annotated mutations are from cancer cell lines (Prior et al., 2012). Mutations that are studied here are highlighted in yellow. See also Figure 3—figure supplement 1.
Figure 3—figure supplement 1
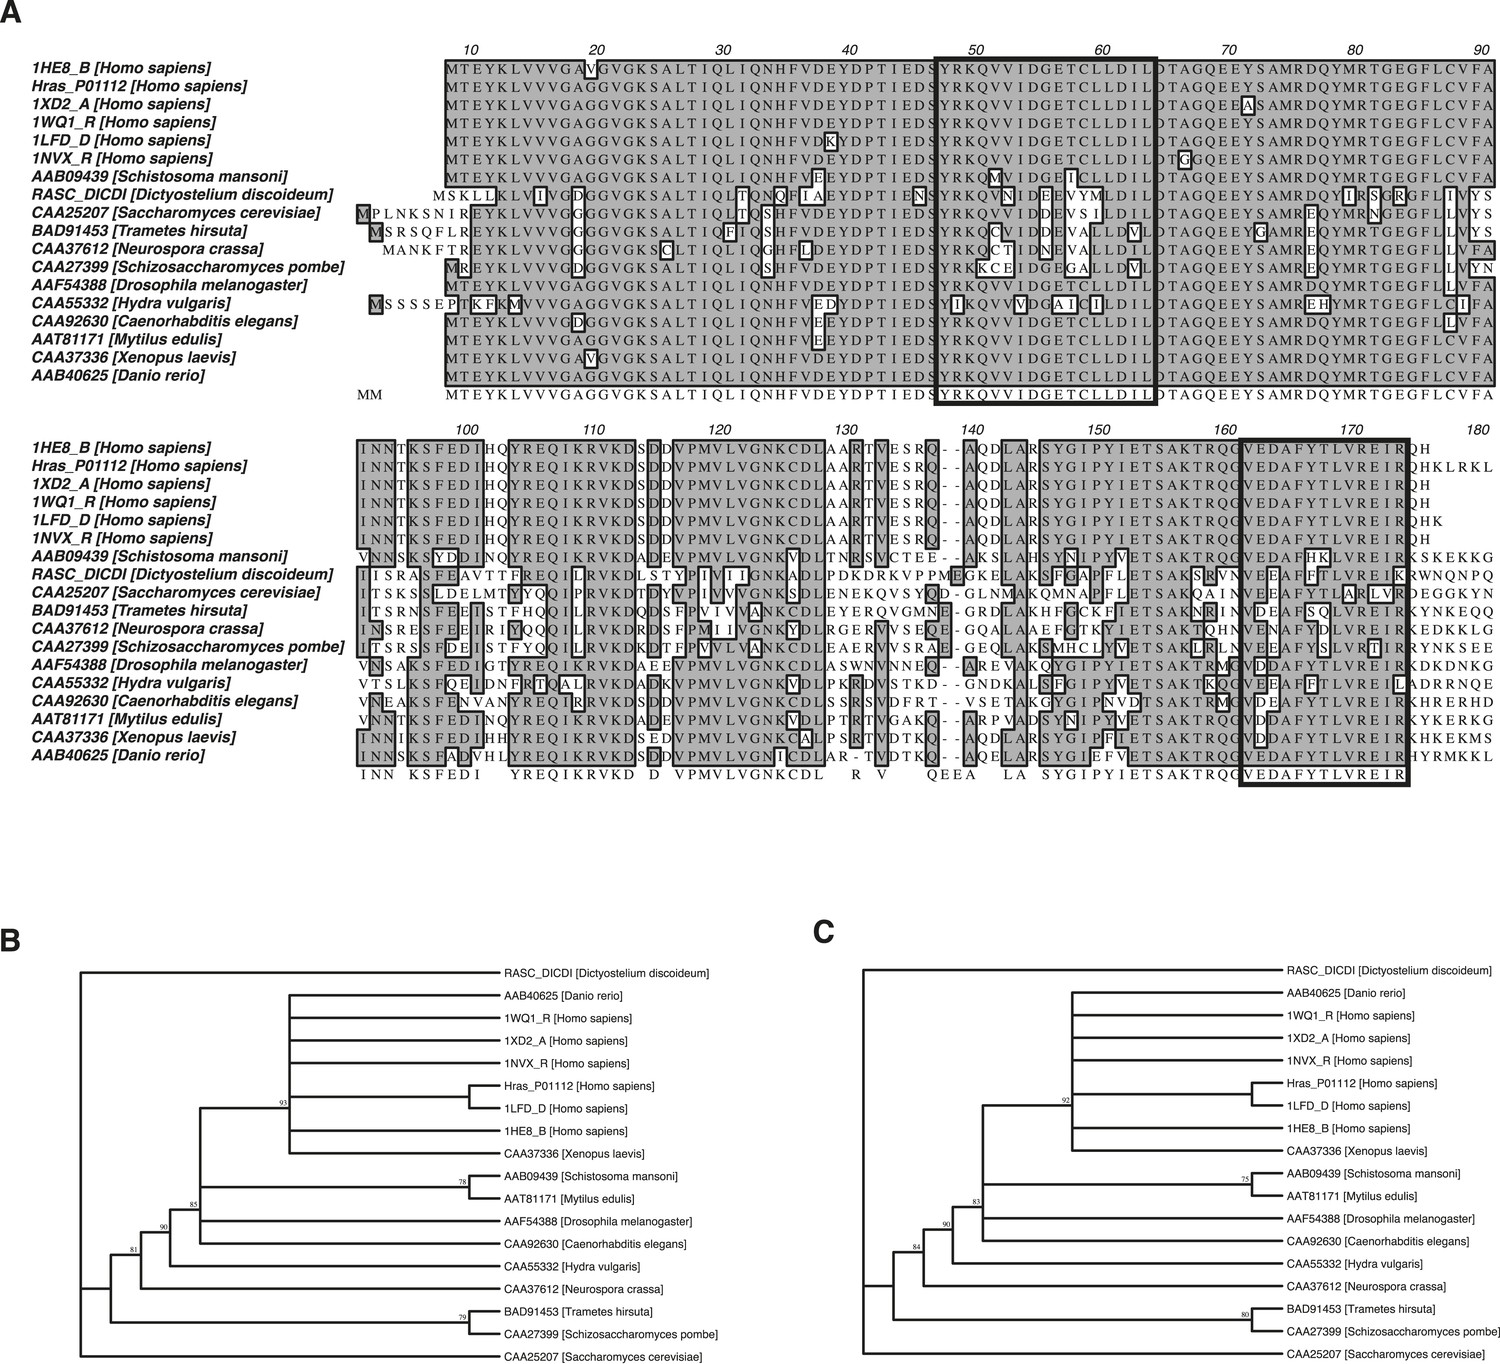
Phylogenetic analysis of the Ras switch III region.
(A) ClustalW sequence alignment of 18 Ras proteins from different species as annotated on the left. Consensus sequence is shaded in dark and switch III region elements β2-β3-loop (residues 40–56) and helix α5 (residues 152–166) are highlighted with a black frame. (B) Unrooted phylogenetic trees were built from these proteins for the β2-β3-loop and (C) helix α5. (B, C) Numbers on internal branches indicate the percentage of 1000 bootstrap trials that support the branch (numbers <70% are omitted). Residues outside the region of interest were excluded using the position-masking tool for both phylogenetic analyses. The analysis revealed that switch III residues are highly conserved among all analyzed Ras proteins. The human Ras isoforms cluster together with other Ras proteins from the Bilateria species (D. rerio, X. laevis, S. mansoni, M. edulis, D. melanogaster, and C. elegans). Ras proteins from the Fungi kingdom (S. pombe and T. hirsuta) and Cnidaria phylum (H. vulgaris) species show a divergent pattern that corresponds to the speciation events that occurred in the course of evolution (∼1298 Ma for Bilateria—Cnidaria and ∼1513 Ma for Animalia—Fungi speciation event) (Hedges et al., 2004).
Figure 4 with 1 supplement
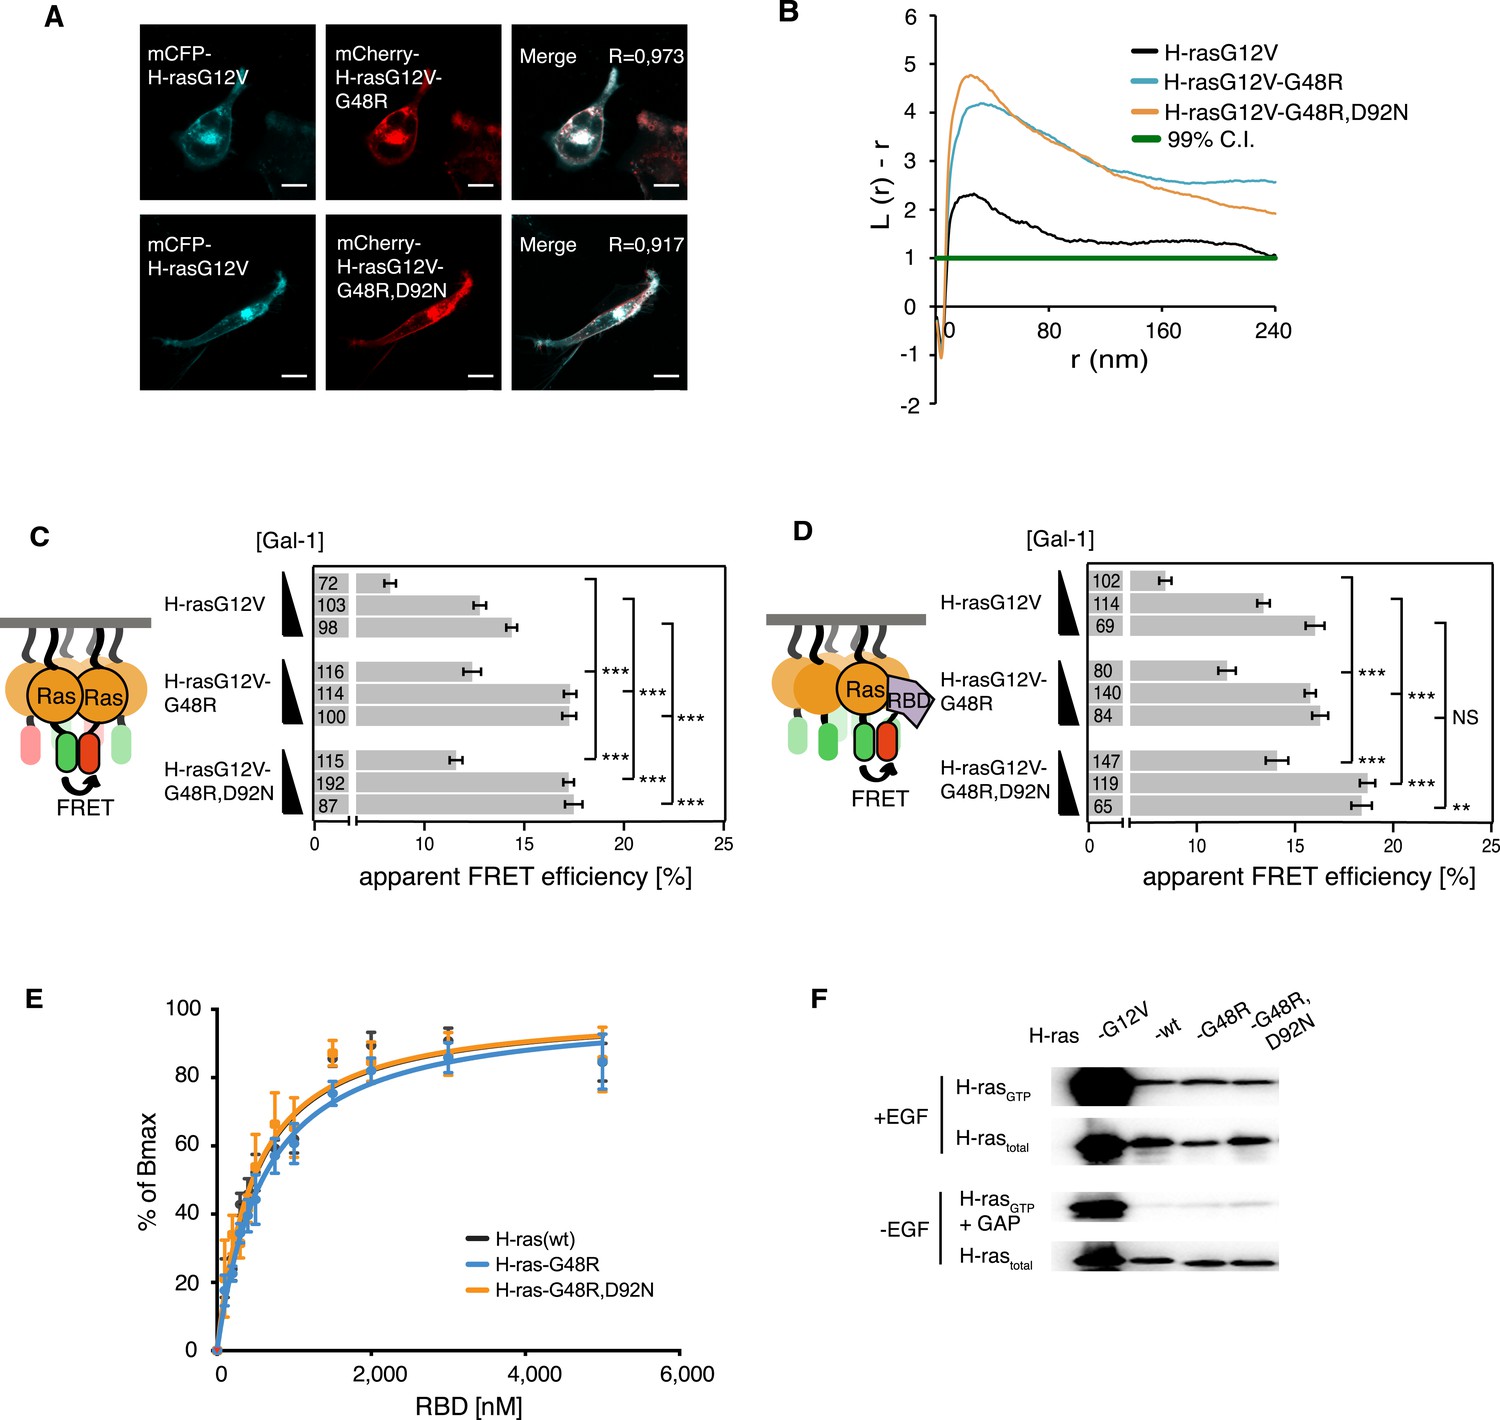
Increased nanoclustering and effector recruitment by a tumor-derived switch III mutation in H-ras.
(A) Representative confocal images of mCFP-H-rasG12V co-localization with the switch III mutants mCherry-H-rasG12V-G48R (top) or mCherry-H-rasG12V-G48R,D92N (bottom) in BHK cells. The colocalization Manders' overlap coefficient (R) is marked on the merged images. Scale bar is 10 μm. (B) Electron microscopic nanoclustering analysis of mGFP-tagged H-ras mutants in BHK cells. Normalized univariate K-functions, where maximal L(r)-r values above the 99% CI for complete spatial randomness indicate clustering at that value of r (number of membrane sheets analyzed per condition, n > 17). (C) The nanoclustering-FRET response of the tumor-derived H-rasG12V-G48R,D92N mutant, its switch III mutation-only derivative H-rasG12V-G48R and its parent construct in dependence of the dose of the nanocluster scaffold Gal-1 in BHK cells. (D) RBD-recruitment FRET analysis of H-rasG12V with or without mutations G48R or G48R,D92N at three different Gal-1 doses in BHK cells. (C, D) Numbers in bars give number of analyzed cells from three independent experiments. Error bars represent the standard error of the mean (±SEM). Statistical analysis vs parent RasG12V was performed as described in the ‘Materials and methods’ (NS, non-significant; **p < 0.01; ***p < 0.001). (E) In vitro RBD binding to mant-GTPγS loaded wild-type (wt) H-ras or H-ras carrying mutations G48R or G48R,D92N measured with a fluorescence anisotropy assay. Binding constants are given in Supplementary file 1. Note the orange curve covers the black. Details on the fitting function are in the ‘Materials and methods’. Data are averages ±SEM of three repeats. (F) RBD-pulldown experiments in BHK cells transiently expressing indicated H-ras mutants or wild type (wt) H-ras. Top panel shows level of active Ras after EGF-stimulation (100 ng/ml). Bottom panel shows GAP-sensitivity of wt and mutant H-ras proteins. Note that control lanes marked G12V and wt are identical to those in Figure 2H, as these H-ras samples were always run on the same gel. See also Figure 4—figure supplement 1.
Figure 4—figure supplement 1
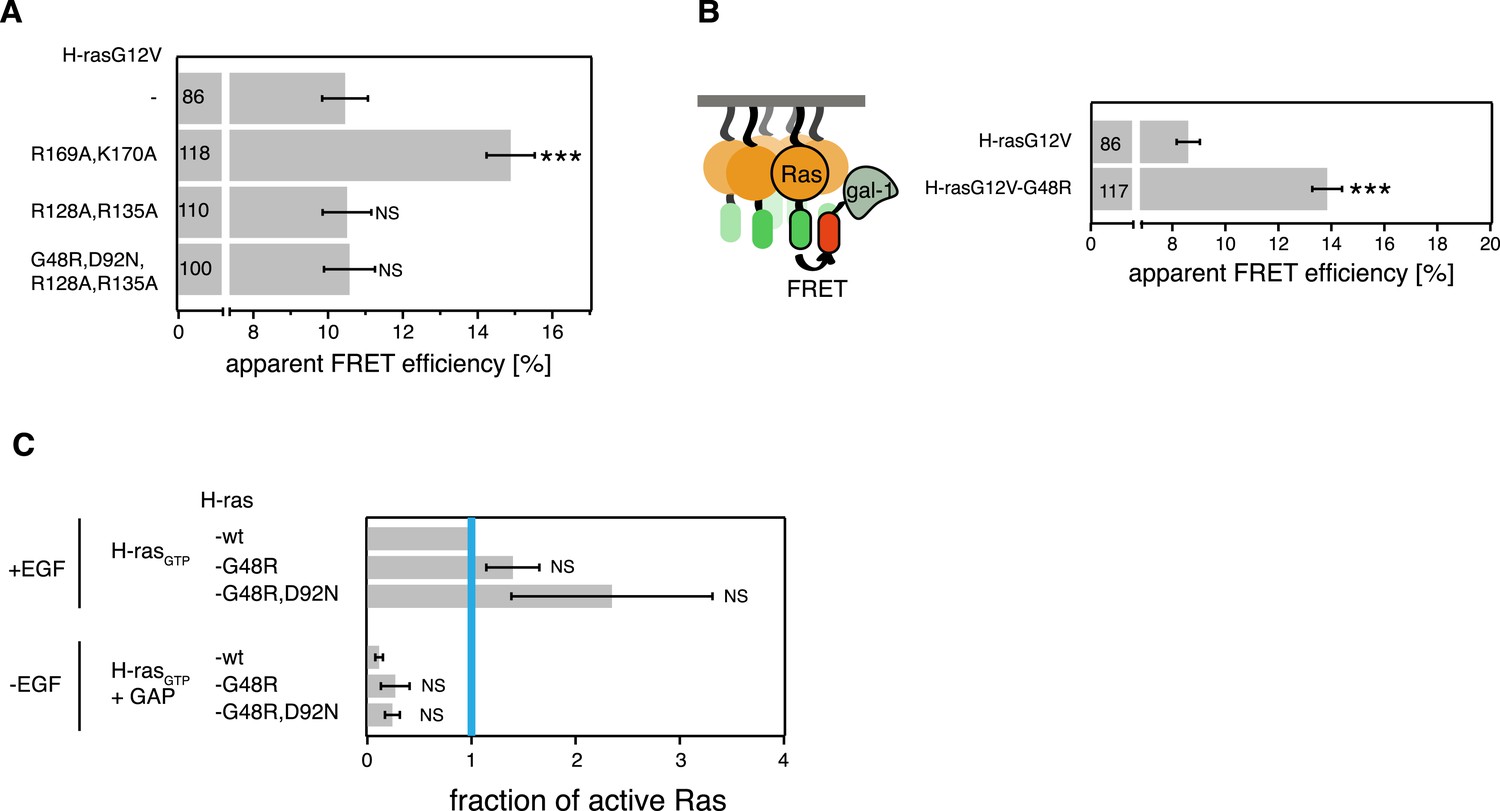
Cancer-associated H-ras switch III mutations have no relevant effect on its biochemical properties.
(A) RBD-recruitment FRET data of indicated H-ras mutants transiently expressed in BHK cells. (B) Gal-1-complexation FRET analysis of H-rasG12V-G48R and its parent construct. (A, B) Numbers in bars give number of analyzed cells from three independent experiments. Error bars represent the standard error of the mean (±SEM). Statistical analysis was performed as described in ‘Materials and methods’ (NS, non-significant; ***p < 0.001). (C) RBD-pulldown experiment quantification of the active, GTP-bound forms of H-ras mutants. +EGF denotes stimulation with 100 ng/ml EGF. −EGF serum starved cells. +GAP incubation with GAP domain of NF1, to assay for GAP sensitivity. The graphs represent the averages of active H-ras-G48R and H-ras-G48R,D92N normalized to wt H-ras + EGF-stimulation from three independent experiments. Blue vertical line annotates the activity of wt H-ras when stimulated with EGF. Error bars represent the standard error of the mean (±SEM). Statistical analysis was performed as described in ‘Materials and methods’ (NS, non-significant).
Figure 5 with 1 supplement
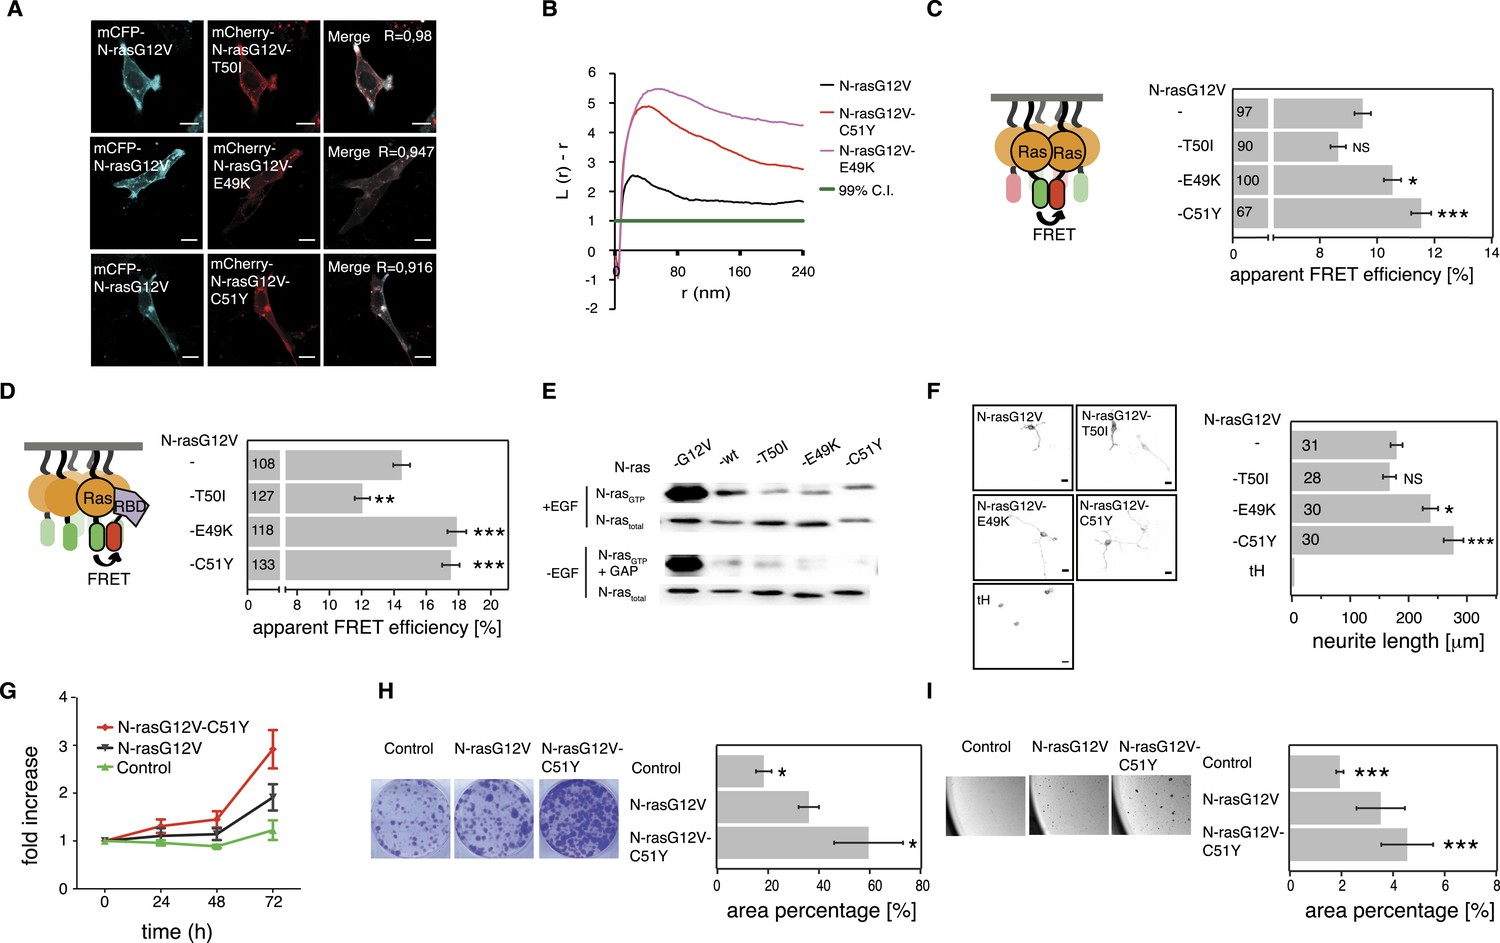
Tumor-derived N-ras switch III mutations increase cell proliferation and transforming activity by increased nanoclustering.
(A) Representative confocal images of mCFP-N-rasG12V co-localization with the switch III mutants mCherry-N-rasG12V-T50I, mCherry-N-rasG12V-E49K, or mCherry-N-rasG12V-C51Y in BHK cells. The Manders' coefficient (R) that quantifies co-localization is marked on the merged images. Scale bar is 10 μm. (B) Electron microscopic nanoclustering analysis of mGFP-tagged N-ras mutants in BHK cells. Normalized univariate K-functions, where maximal L(r)-r values above the 99% CI for complete spatial randomness indicate clustering at that value of r (number of membrane sheets analyzed per condition, n > 17). (C) Nanoclustering-FRET analysis of cancer-associated N-rasG12V-T50I, N-rasG12V-E49K and N-rasG12V-C51Y as compared to their parent construct in BHK cells. (D) RBD-recruitment FRET analysis of N-rasG12V-T50I, N-rasG12V-E49K, and N-rasG12V-C51Y as compared to their parent construct in BHK cells. (E) RBD-pulldown experiments in BHK cells transiently expressing indicated N-ras mutants or wild-type (wt) N-ras. Top panel shows level of active N-ras after EGF-stimulation (100 ng/ml). Bottom panel shows GAP-sensitivity of wt N-ras and mutant N-ras proteins. (F) MAPK-dependent PC12-differentiation assay. PC12 cells transiently expressed indicated mGFP-tagged N-rasG12V with or without switch III mutations, or the control tH (minimal membrane anchor of H-ras) for 48 hr. Subsequently neurite length was assessed (right). Examples of confocal images of PC-12 cells expressing indicated constructs used for neurite length quantification (left). Scale bar is 15 μm. (C, D, F) Numbers in bars give number of analyzed cells from three independent experiments. Error bars represent the standard error of the mean (±SEM). Statistical analysis vs parent RasG12V was performed as described in the ‘Materials and methods’ (NS, non-significant; *p < 0.05; **p < 0.01; ***p < 0.001). (G) Proliferation of NIH/3T3 cells stably expressing N-rasG12V, N-rasG12V-C51Y, or a control construct. Control is transduced with the GFP reporter only. Error bars represent the standard error of the mean (±SEM). (H) Transformation of NIH/3T3 cells stably expressing N-rasG12V as compared to N-rasG12V-C51Y or a vector-only control. Foci formed after 7 days of growth were stained with crystal violet and mean (±SEM) foci areas from three biological repeats were quantified (right). Representative images of crystal violet-stained foci of transduced NIH/3T3 cells (left). (I) Anchorage-independent growth of NIH/3T3 cells stably expressing N-rasG12V as compared to N-rasG12V-C51Y or a vector-only control. Colonies were imaged after 14 days (left), and the colony area was determined (right). Three independent biological repeats were performed and each repeat was done in triplicate. Error bars represent the standard error of the mean (±SEM). See also Figure 5—figure supplement 1.
Figure 5—figure supplement 1

Cancer-associated mutations in switch III of N-ras do not alter its biochemical properties and Gal-1 complexation.
(A) Gal-1-complexation FRET data of indicated N-ras mutants and parent construct transiently expressed in BHK cells. (B) RBD-recruitment FRET analysis of indicated N-ras mutant and parent constructs transiently expressed in BHK cells with (+) or without (−) 5 μM compactin treatment for 48 hr. Compactin treatment relocalized N-ras mutant/RBD complexes to the cytoplasm, allowing us to assess binding in solution. (A, B) Numbers in bars give number of analyzed cells from three independent experiments. Error bars represent the standard error of the mean (±SEM). Statistical analysis was performed as described in ‘Materials and methods’ (NS, non-significant). (C) RBD-pulldown experiment quantification of the active, GTP-bound forms of wt and mutant N-ras. +EGF denotes stimulation with 100 ng/ml EGF; −EGF serum starved cells; +GAP incubation with GAP domain of NF1, to assay for GAP-sensitivity. The graphs represent the averages of active N-ras mutants normalized to wt N-ras + EGF-stimulation from two independent experiments. Blue vertical line annotates the activity of wt N-ras when stimulated with EGF. Error bars represent the standard error of the mean (±SEM). Statistical analysis was performed as described in ‘Materials and methods’ (NS, non-significant). (D) Western blot analysis of phosphorylated MEK, ERK, and AKT and total MEK, ERK, and AKT in BHK cells transiently expressing EGFP only, mCit-N-ras-wt, mCit-N-ras-T50I, mCit-N-ras-E49K, or mCit-N-ras-C51Y. Cells were serum starved and collected without EGF stimulation (−EGF) or after stimulation with 100 ng/ml EGF for 10 min (+EGF). Equal expression of Ras constructs can be seen in the GFP row, equal loading in the β-actin row. (E) Validation of comparable protein expression levels of HA-tagged N-ras mutants stably expressed in NIH/3T3 cells. Anti-HA-tag Western blot.
Figure 6 with 1 supplement
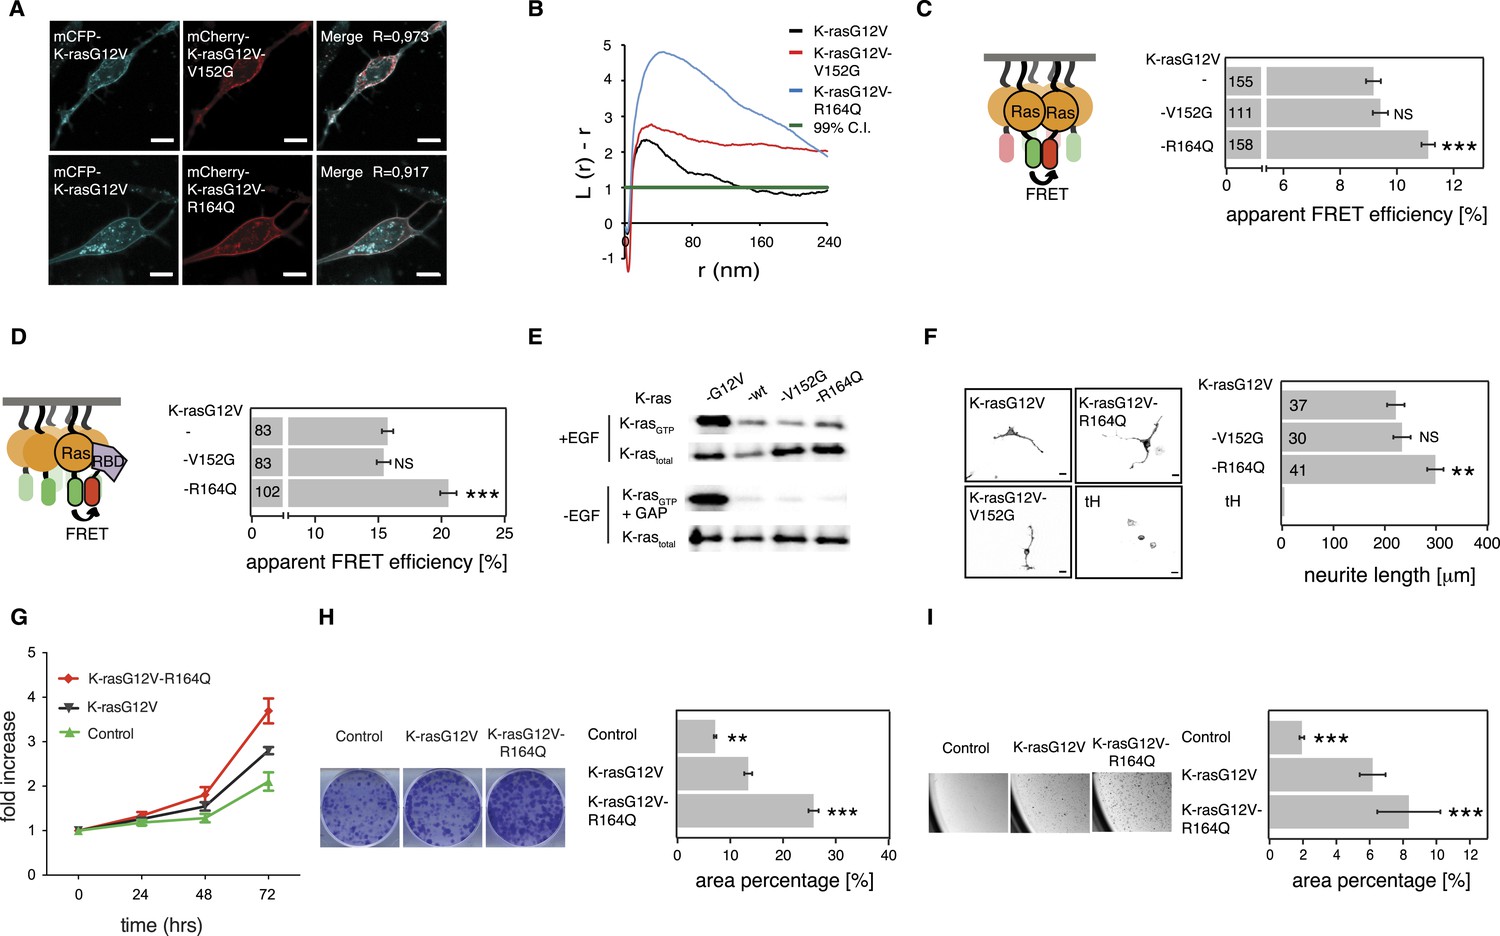
K-ras with colorectal cancer-associated mutation R164Q displays increased nanoclustering to drive oncogenic transformation.
(A) Colocalization of mCFP-K-rasG12V and switch III mutants mCherry-K-rasG12V-V152G and mCherry-K-rasG12V-R164Q in BHK cells. The Manders' coefficient (R) that quantifies colocalization is marked on the merged images. Scale bar is 10 μm. (B) Electron microscopic nanoclustering analysis of BHK cells expressing indicated mGFP-tagged K-ras mutants. Normalized univariate K-functions, where maximal L(r)-r values above the 99% CI for complete spatial randomness indicate clustering at that value of r (number of membrane sheets analyzed per condition, n > 15). (C) The nanoclustering-FRET response of K-rasG12V-V152G, K-rasG12V-R164Q as compared to their parent construct in BHK cells. (D) RBD-recruitment FRET analysis of K-rasG12V-V152G, K-rasG12V-R164Q as compared to their parent construct in BHK cells. (E) RBD-pulldown experiments in BHK cells transiently expressing indicated K-ras mutants or (wild-type) wt K-ras. Top panel shows level of active K-ras after EGF-stimulation (100 ng/ml). Bottom panel shows GAP-sensitivity of wt and mutant K-ras proteins. (F) MAPK-dependent PC12 differentiation assay. Cells transiently expressed indicated mGFP-tagged K-rasG12V with or without mutations V152G and R164Q, or the control tH for 48 hr. Subsequently neurite length was assessed (left). Examples of confocal images of PC-12 cells expressing indicated constructs used for quantification (right). Scale bar is 15 μm. (C, D, F) Numbers in bars give number of analyzed cells from three independent experiments. Error bars represent the standard error of the mean (±SEM). Statistical analysis was performed as described in the ‘Materials and methods’ (NS, non-significant; *p < 0.05; **p < 0.01; ***p < 0.001). (G) Proliferation of NIH/3T3 cells stably expressing K-rasG12V, K-rasG12V-R164Q, or a control construct for 72 hr. Control is transduced with the GFP reporter only. Error bars represent the standard error of the mean (±SEM). (H) Transformation assay of NIH/3T3 cells virally transduced to stably express-indicated constructs and a GFP reporter. Foci formed after 7 days of growth were stained with crystal violet and mean (±SEM) foci areas from three biological repeats were quantified (right). Representative images of crystal violet stained foci of transduced NIH/3T3 cells (left). (I) Anchorage-independent growth of NIH/3T3 cells stably expressing K-rasG12V as compared to K-rasG12V-R164Q or a vector-only control. Colonies were imaged after 14 days (left), and the colony area was determined (right). Three independent biological repeats were performed, and each repeat was done in triplicate. Error bars represent the standard error of the mean (±SEM). See also Figure 6—figure supplement 1.
Figure 6—figure supplement 1
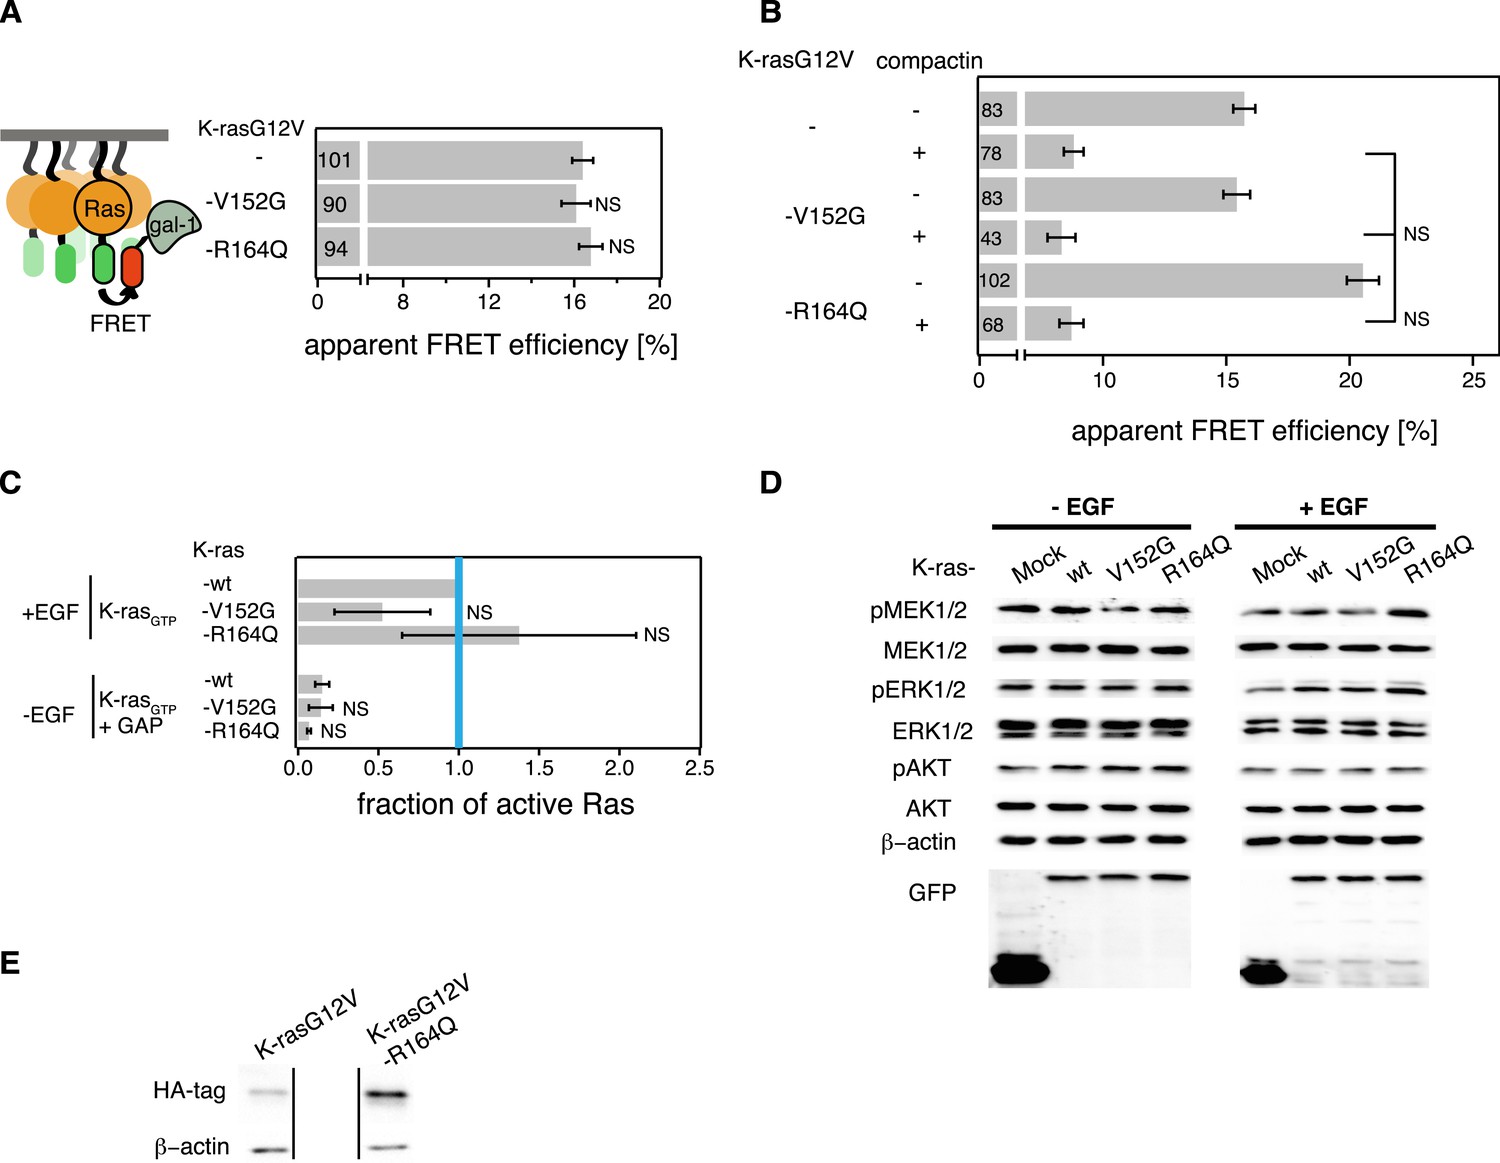
K-ras with mutation R164Q has unaltered Gal-1-complexation and biochemical properties.
(A) Gal-1-complexation FRET analysis of K-ras mutants and its parent construct transiently expressed in BHK cells. (B) RBD-recruitment FRET analysis of K-ras mutants and its parent construct transiently expressed in BHK cells with (+) or without (−) 5 μM compactin treatment for 48 hr. Compactin treatment relocalized K-ras mutant/RBD complexes to the cytoplasm, allowing us to assess binding in solution. (A, B) Numbers in bars give number of analyzed cells from three independent experiments. Error bars represent the standard error of the mean (±SEM). Statistical analysis was performed as described in ‘Materials and methods’ (NS, non-significant, ***p < 0.001). (C) RBD-pulldown experiment quantification of the active, GTP-bound forms of wt and mutant K-ras. +EGF denotes stimulation with 100 ng/ml EGF. −EGF serum-starved cells. +GAP incubation with GAP domain of NF1, to assay for GAP sensitivity. The graphs represent the averages of active K-ras mutants normalized to wt K-ras + EGF-stimulation from three independent experiments. Blue vertical line annotates the activity of wt K-ras when stimulated with EGF. Error bars represent the standard error of the mean (±SEM). Statistical analysis was performed as described in ‘Materials and methods’ (NS, non-significant, ***p < 0.001). (D) Western blot analysis of phosphorylated MEK, ERK, and AKT and total MEK, ERK, and AKT in BHK cells transiently expressing EGFP only, mCFP-K-ras-wt, mCFP-K-ras-V152G, or mCFP-K-ras-R164Q. Cells were serum starved and collected without EGF stimulation (−EGF) or after stimulation with 100 ng/ml EGF for 10 min (+EGF). Equal expression of Ras constructs can be seen in the GFP row, equal loading in the β-actin row. (E) Validation of comparable protein expression levels of HA-tagged K-ras mutants stably expressed in NIH/3T3 cells. Anti-HA-tag Western blot.
Figure 7
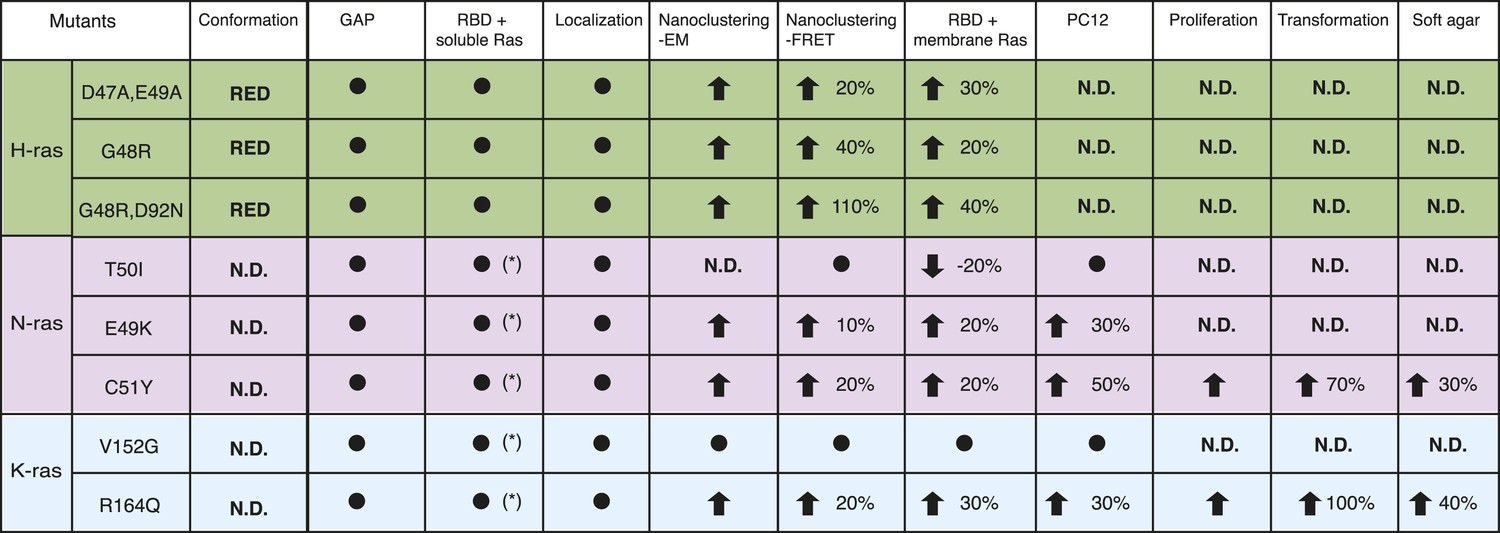
Summary table of Ras switch III mutant properties studied in this work.
The table summarizes major experimental results obtained in different assays that were used to characterize switch III mutants of H-ras (highlighted in green), N-ras (violet), and K-ras4B (blue). Note that in addition extensive biochemical characterization data of the H-ras mutants can be found in Supplementary file 1. Black circle dot indicates that no significant change was observed. Black arrows represent significant increase (up) or decrease (down) of quantified parameters as compared to the parent RasG12V control. The percentage of these changes is given in addition. The following columns (italics) report on: Conformation—predicted H-ras mutant conformation, according to Figure 1A; GAP—sensitivity of mutants to GAP-stimulated GTP hydrolysis; RBD + soluble Ras—binding of the C-Raf-RBD to Ras mutants in solution, which was either measured by fluorescence anisotropy with purified proteins or in BHK cells treated with compactin using FRET (annotated with *); Localization—change in colocalization of mutants relative to their parent constructs in BHK cells determined by confocal microscopy; Nanoclustering-EM—changes in Ras nanoclustering obtained by electron microscopy or -FRET in BHK cells; RBD + membrane Ras—binding of the C-Raf-RBD to Ras mutants in BHK cells measured by FRET; PC12—results of PC12-cell neurite outgrowth assay; last three columns report on Ras-mutant transformed NIH/3T3 cell proliferation, focus formation (transformation) and anchorage-independent growth (soft agar).
Additional files
-
Supplementary file 1
Thermodynamic and kinetic parameters of H-ras mutant in vitro experiments. Table contains background corrected GEF-dependent Eu3+-GTP association (kon), and dissociation (koff) kinetics of wt H-ras and mutants. The Kon, Koff, and Kd derived from Koff/Kon values are calculated from corrected association and dissociation data as described in ‘Materials and methods’. Dissociation constants (Kd) between mantGTPγS and wt H-ras and its mutants (in the presence of EDTA and in the absence of Mg2+). The absence of Mg2+ increases the Kd, which is otherwise in the pM range (John et al., 1988, 1990). Dissociation constants (Kd) of C-Raf-RBD and mantGTPγS-bound wt H-ras and its mutants were measured by fluorescence anisotropy as described in ‘Materials and methods’. Raw data are shown in Figure 2—figure supplement 2.
- https://doi.org/10.7554/eLife.08905.017
-
Supplementary file 2
Distribution of isoform specific coding mutations in the switch III region by cancer tissue type. Table details the frequency of amino acid changes due to coding mutations observed in switch III region of each isoform in different tissue types of cancer. Point mutations leading to different amino acid residue changes at the same coding position have been added to indicate the number of changes at that position. Summary for total mutations observed in all isoforms and total mutations per isoform have also been provided. Gray highlighted cells are the tissue types and switch III regions having the highest number of coding mutations at that position. Red and bold highlighted numbers indicate coding mutations observed in patient samples with the corresponding cancer tissue type.
- https://doi.org/10.7554/eLife.08905.018
Download links
A two-part list of links to download the article, or parts of the article, in various formats.
Downloads (link to download the article as PDF)
Open citations (links to open the citations from this article in various online reference manager services)
Cite this article (links to download the citations from this article in formats compatible with various reference manager tools)
Specific cancer-associated mutations in the switch III region of Ras increase tumorigenicity by nanocluster augmentation
eLife 4:e08905.
https://doi.org/10.7554/eLife.08905


