Codon-level information improves predictions of inter-residue contacts in proteins by correlated mutation analysis
- Bar-Ilan University, Israel
- Weizmann Institute of Science, Israel
Figures
Figure 1
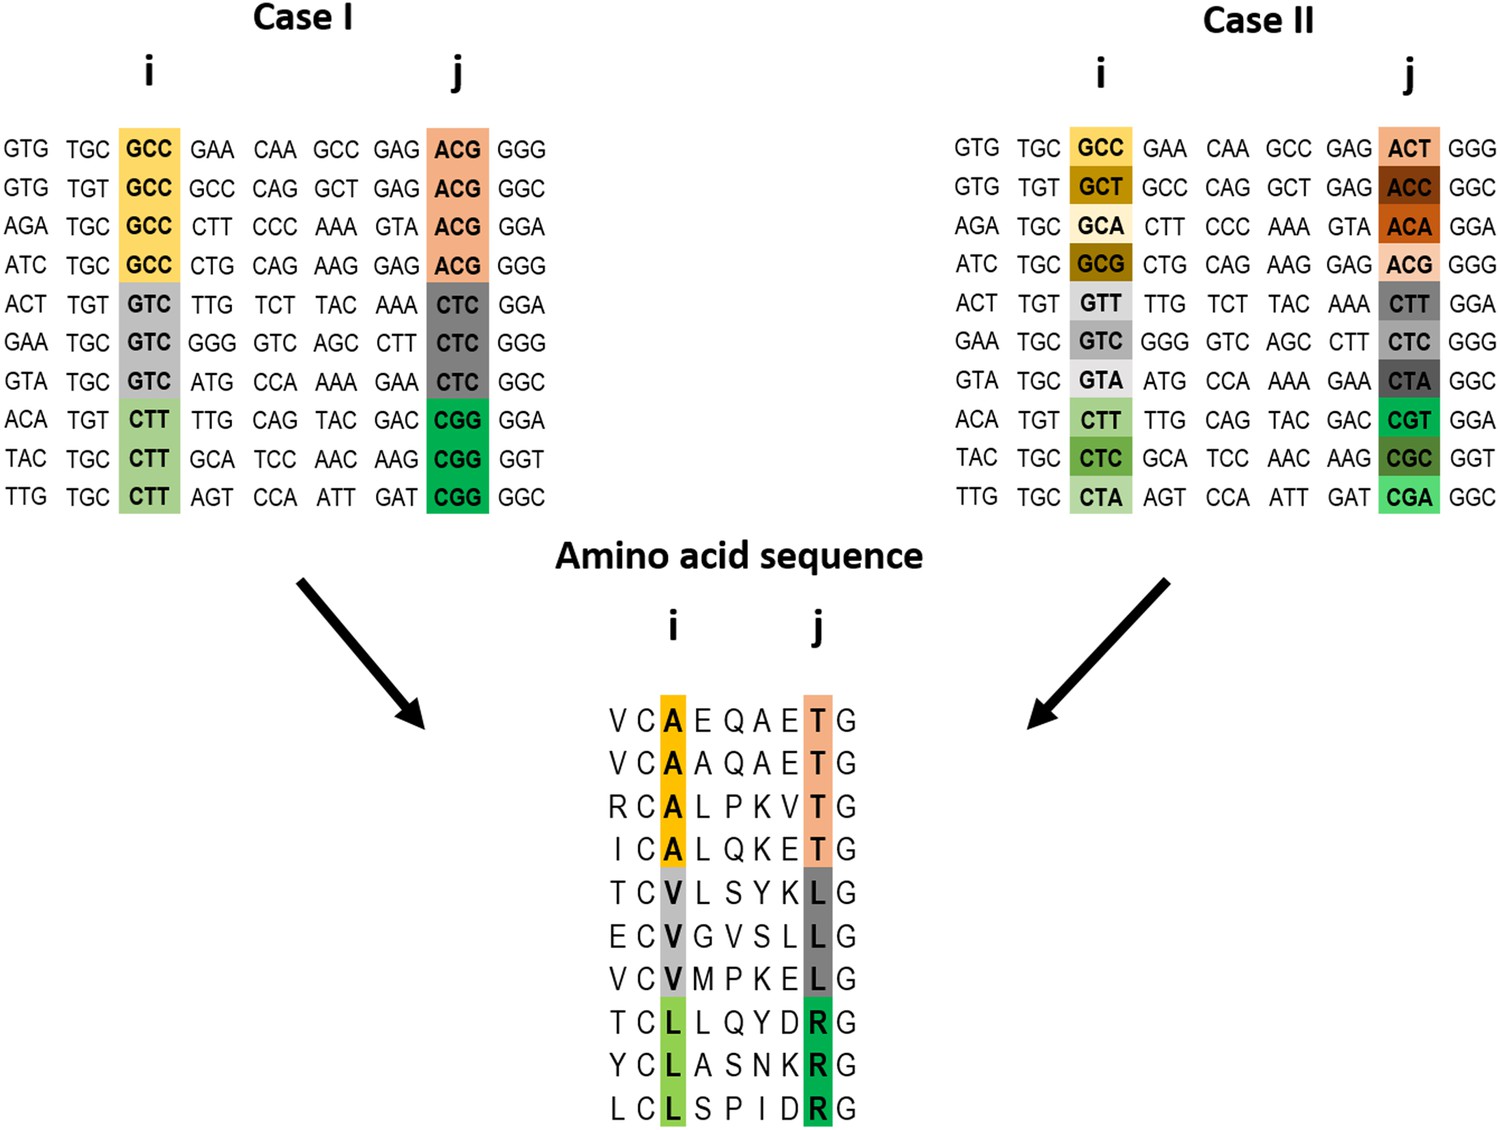
Example of a pairwise correlation in a multiple amino acid sequence alignment and two possible corresponding codon alignments.
A correlation at the amino acid level between two positions i and j may (top left) or may not (top right) be accompanied by a correlation at the codon level. The premise of the method introduced here is that a correlation at the amino acid level between two positions is more likely to reflect a direct interaction if the correlation at the codon level for these positions is weak (top right).
Figure 2 with 2 supplements

Plots of the mean accuracy of contact identification by various methods of correlated mutation analysis as a function of the top ranked fraction of protein length, L, number of predicted pairwise contacts.
The mean accuracies of contact identification by the OMES, MI, MIp, DCA and PSICOV methods are shown either with or without incorporating codon data. Residues were defined as being in contact if the distance between their Cβ atoms is ≤8 Å. PSICOV* indicates that it was carried out without the APC.
Figure 2—figure supplement 1
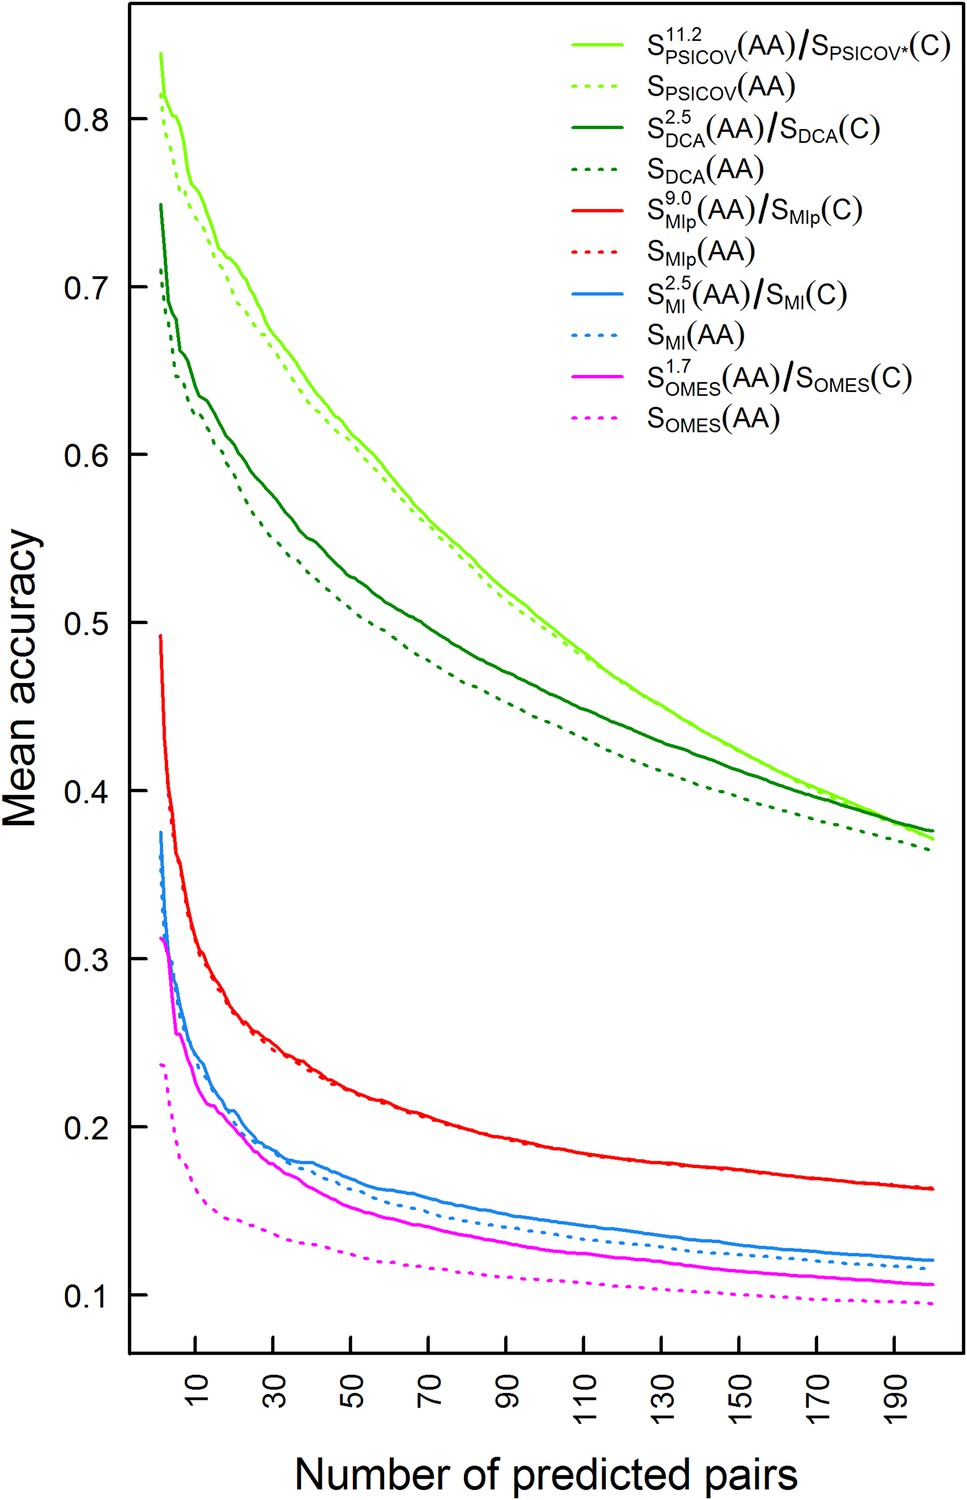
Plots of the mean accuracy of contact identification by various methods of correlated mutation analysis as a function of the top ranked number of predicted pairwise contacts.
The mean accuracies of contact identification by PSICOV, DCA MIp, MI and OMES are shown either with or without incorporating codon data. Residues were defined as being in contact if the distance between their Cβ atoms is ≤8 Å.
Figure 2—figure supplement 2

Histogram of the fractions of residue pairs in physical contact out of those considered to be in contact according to two widely used definitions.
Residue pairs defined to be in contact if at least one inter-atomic distance between them is ≤8 Å (designated ‘All’) or if the distance between their Cβ atoms is ≤8 Å were identified in 2481 proteins with high-resolution structures. The fraction of these residue pairs that are in direct contact, that is, with a distance <3.5 Å between two of their respective heavy atoms, was then determined for each protein. Only pairs of residues that are separated by at least five amino acids along the protein sequence were considered.
Figure 3 with 1 supplement
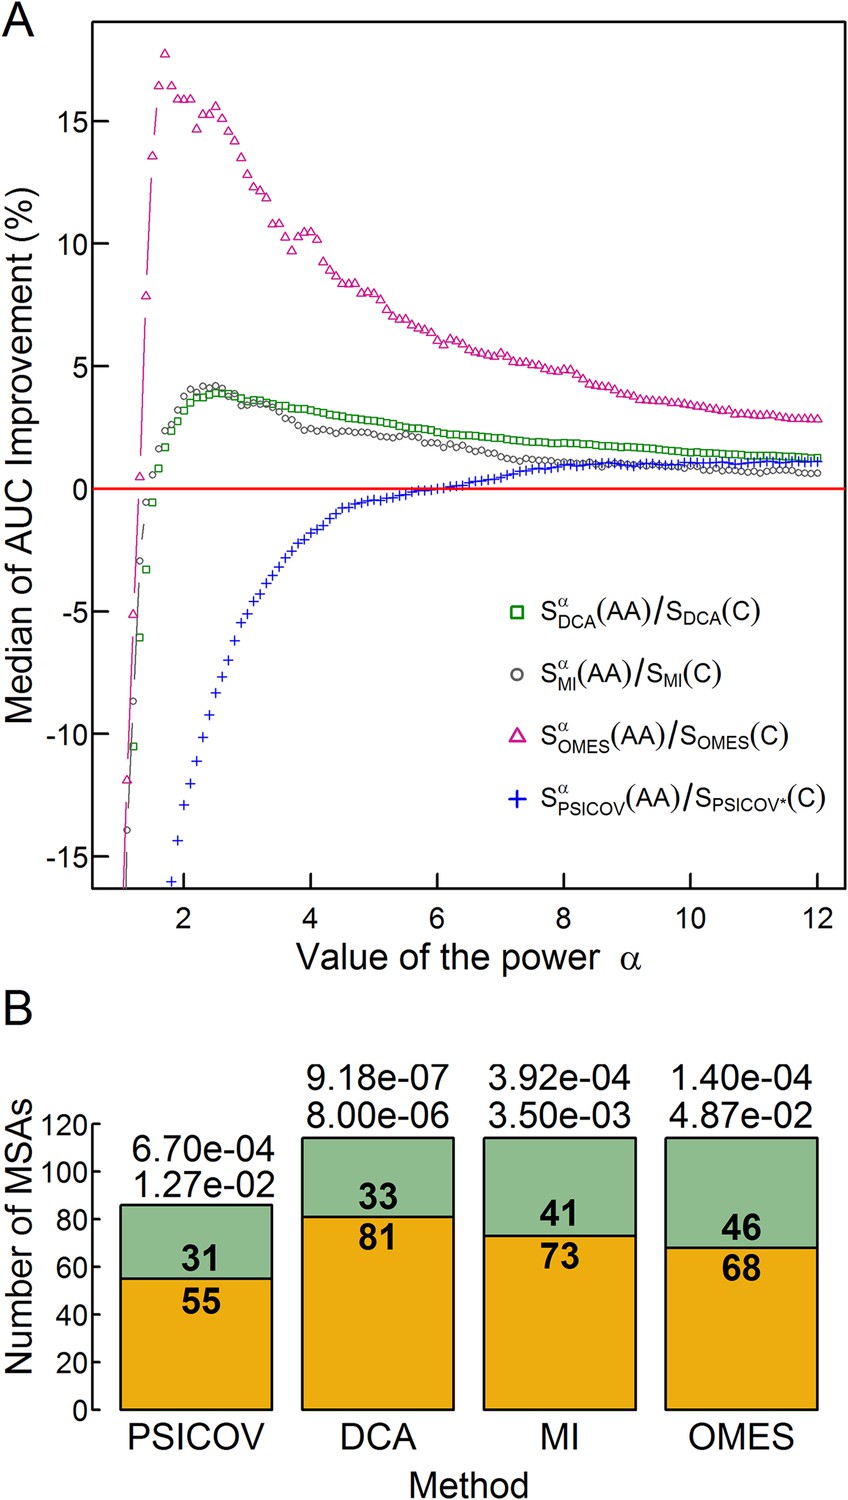
The effect of the relative weights of amino acid and codon information on contact prediction improvement and its statistical significance.
(A) The median of the extent of improvement in contact prediction for 114 MSAs (86 in the case of PSICOV) is plotted as a function of the value of the power α which determines the relative weights of the amino acid and codon correlations in the score, Si (Si = Siα(AA)/Si(C), where Si(AA) and Si(C) are the respective amino acid and codon scores generated by method i). The extent of improvement was determined by calculating the difference in the areas under the curves (AUC) of prediction accuracy vs number of predictions for each method i with and without incorporation of the codon data normalized by the area under the curve generated without codon data. The analysis was done for domains of length between 200 and 500 residues and at least 2000 coding sequences in their MSA. The value of α which maximizes the median improvement was used for predictions. Maximal respective improvements of 3.9% and 4.2% were found for DCA and MI when α is 2.5, 17.6% for OMES when α is 1.7 and 1.13% for PSICOV when α is 11.2. (B) Stacked bar plots showing the number of MSAs for which including codon data improved the contact predictions using the different methods (orange) and the number of those for which it was otherwise (green). The statistical significance of the improvement achieved by incorporating codon data is indicated by the top and bottom p-values obtained using the Wilcoxon signed-rank and sign tests, respectively.
Figure 3—figure supplement 1
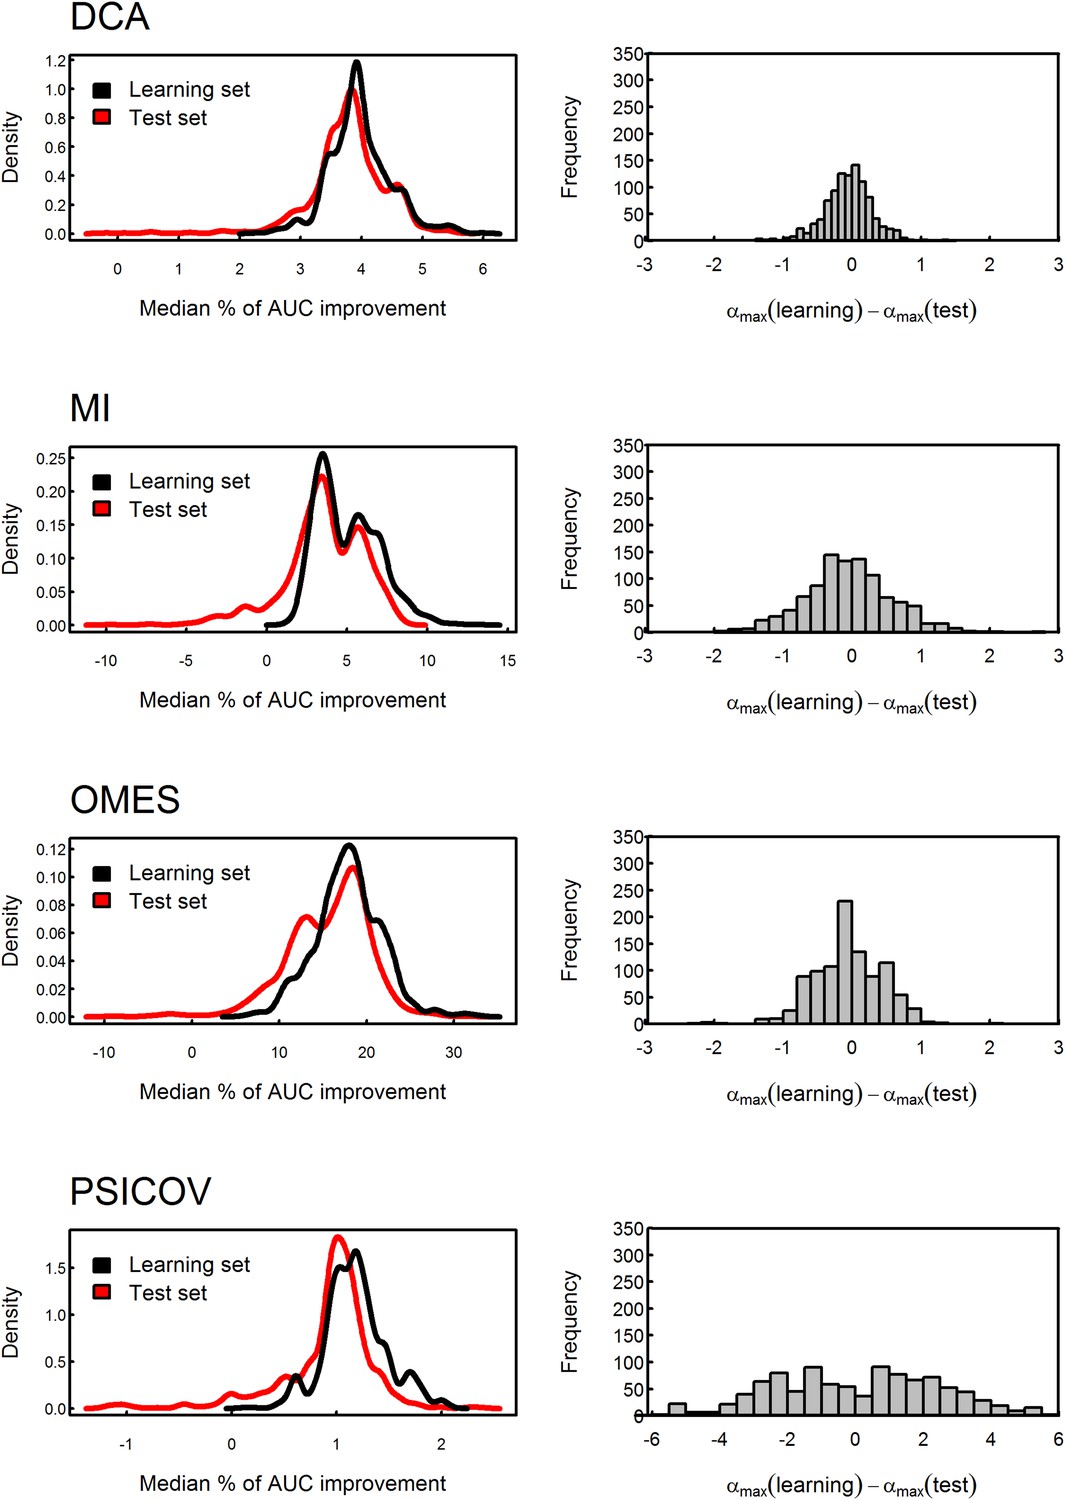
Testing the stability of the value of α by cross-validation.
The MSA data set was divided into 10,000 different learning and test sets of equal size. The value of α which produces the maximal median percent of AUC improvement in accuracy of contact prediction was obtained for each learning set and then used to assess the median percent of AUC improvement for the corresponding test set. The distributions of the median percent of improvement obtained for the test sets are shown for OMES, MI, DCA and PSICOV. The mean values of these test sets distributions obtained using the different methods are similar to those of their learning sets, thus, showing that the improvement is not due to over-fitting. In the case of OMES, MI and DCA, the mean difference between the values of α which maximizes the median of the percent of AUC improvement for the learning and test sets equals zero, thus, reflecting the stability of the values of α. In the case of PSICOV, the variance of that difference is high due to the asymptotic nature of the median percent of AUC improvement as a function of α.
Figure 4
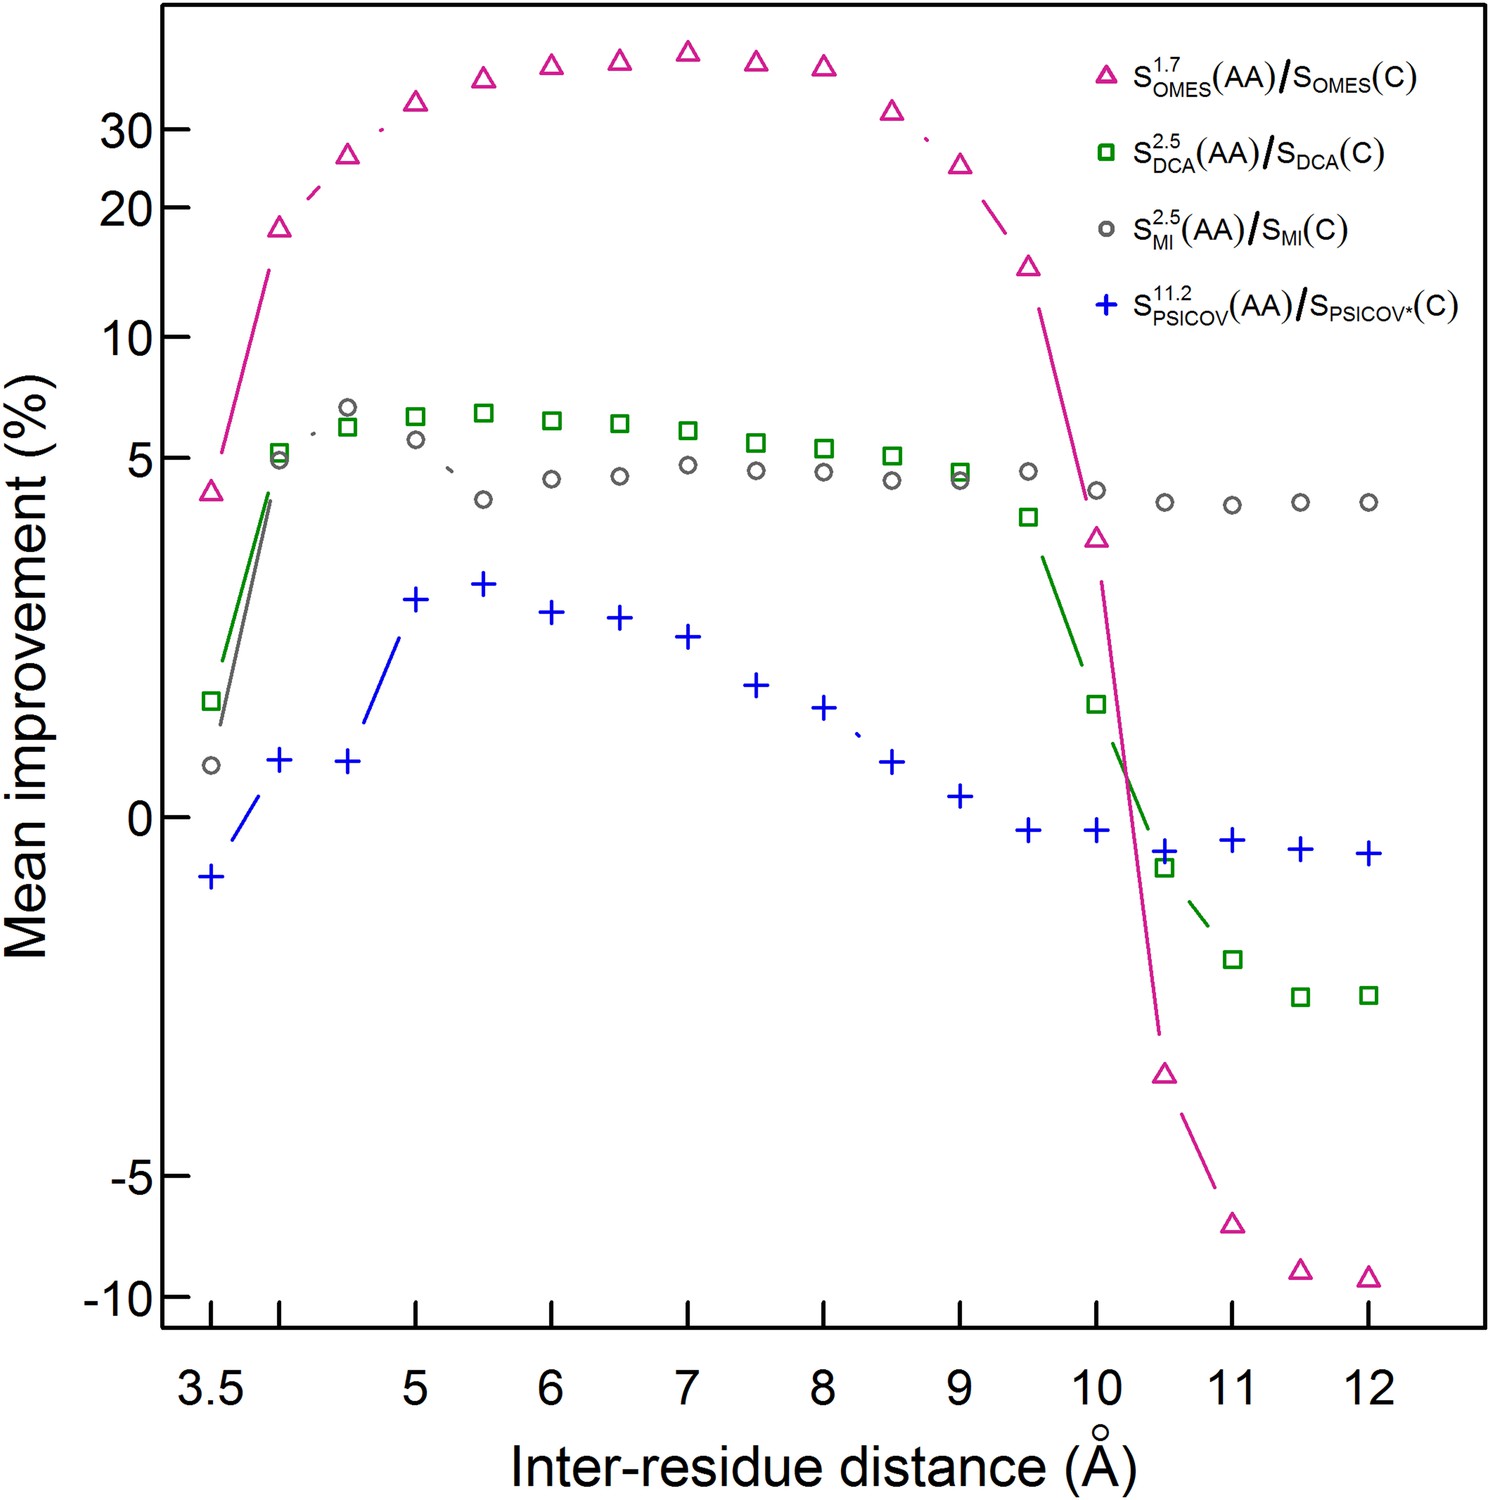
Improvement in contact prediction as a function of the distance used to define a physical contact.
The mean of the extent of improvement in contact prediction for 114 domains (or 86 in the case of PSICOV) is plotted as a function of the distance that must exist between two Cβ atoms in different residues in order for them to be defined as being in contact. The extent of improvement was determined by calculating the difference in the areas under the curves of prediction accuracy vs number of predictions by OMES, MI, DCA and PSICOV with and without incorporation of the codon data normalized by the area under the curve generated without codon data. The analysis was done for domains of length between 200 and 500 residues and at least 2000 coding sequences in their MSA. The contact predictions were made for the seven sequences with available crystal structures that have the highest resolution and that in all cases is <3 Å.
Figure 5 with 1 supplement
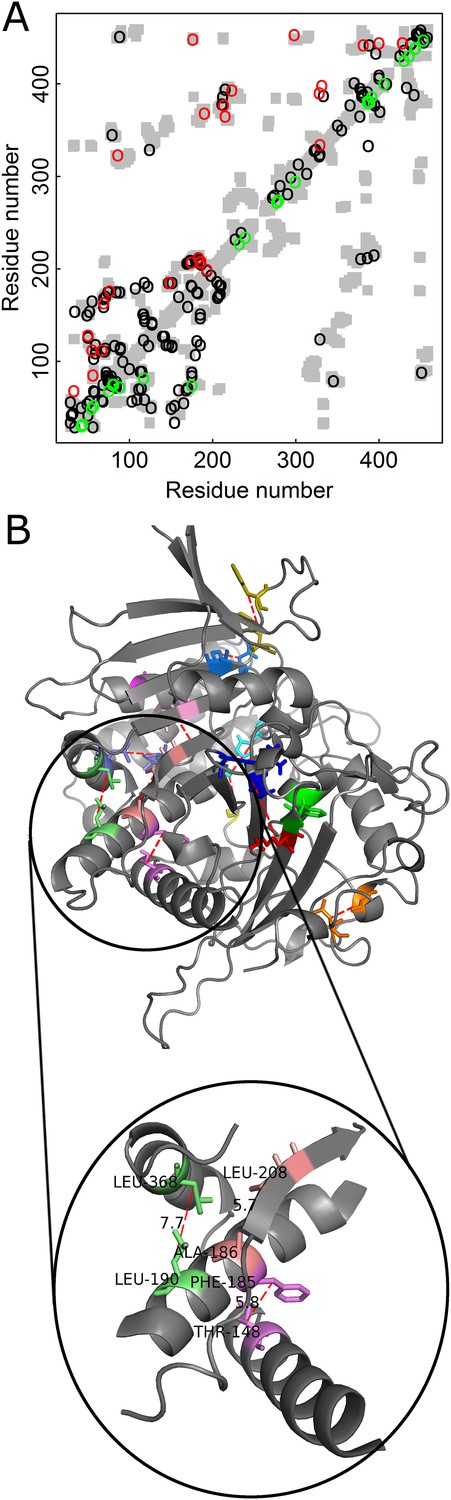
Added value of combining amino acid and codon data in contact prediction by DCA illustrated for Kex1Δp, a prohormone-processing carboxypeptidase from Saccharomyces cerevisiae.
(A) Contact map of the structure of Kex1Δp (PDB ID: 1AC5) in which all the contacts are shown as gray rectangles. Residues were defined as being in contact if the distance between their Cβ atoms (Cα for glycine) is ≤8 Å. The top 100 predictions of contacts made with or without incorporating codon data are highlighted above (in red) and below (in green) the diagonal, respectively, and those predicted by both methods by black circles. (B) The crystal structure of Kex1Δp with predicted contacts highlighted. Only true predicted contacts that were not predicted by the original method are highlighted. Each contacting pair has a different color. The contacts were predicted using an MSA with 1877 coding sequences with a length of 415 codons. The magnified region shows some long-range contacts between different secondary structure elements that are predicted only when also the codon data is used.
Figure 5—figure supplement 1
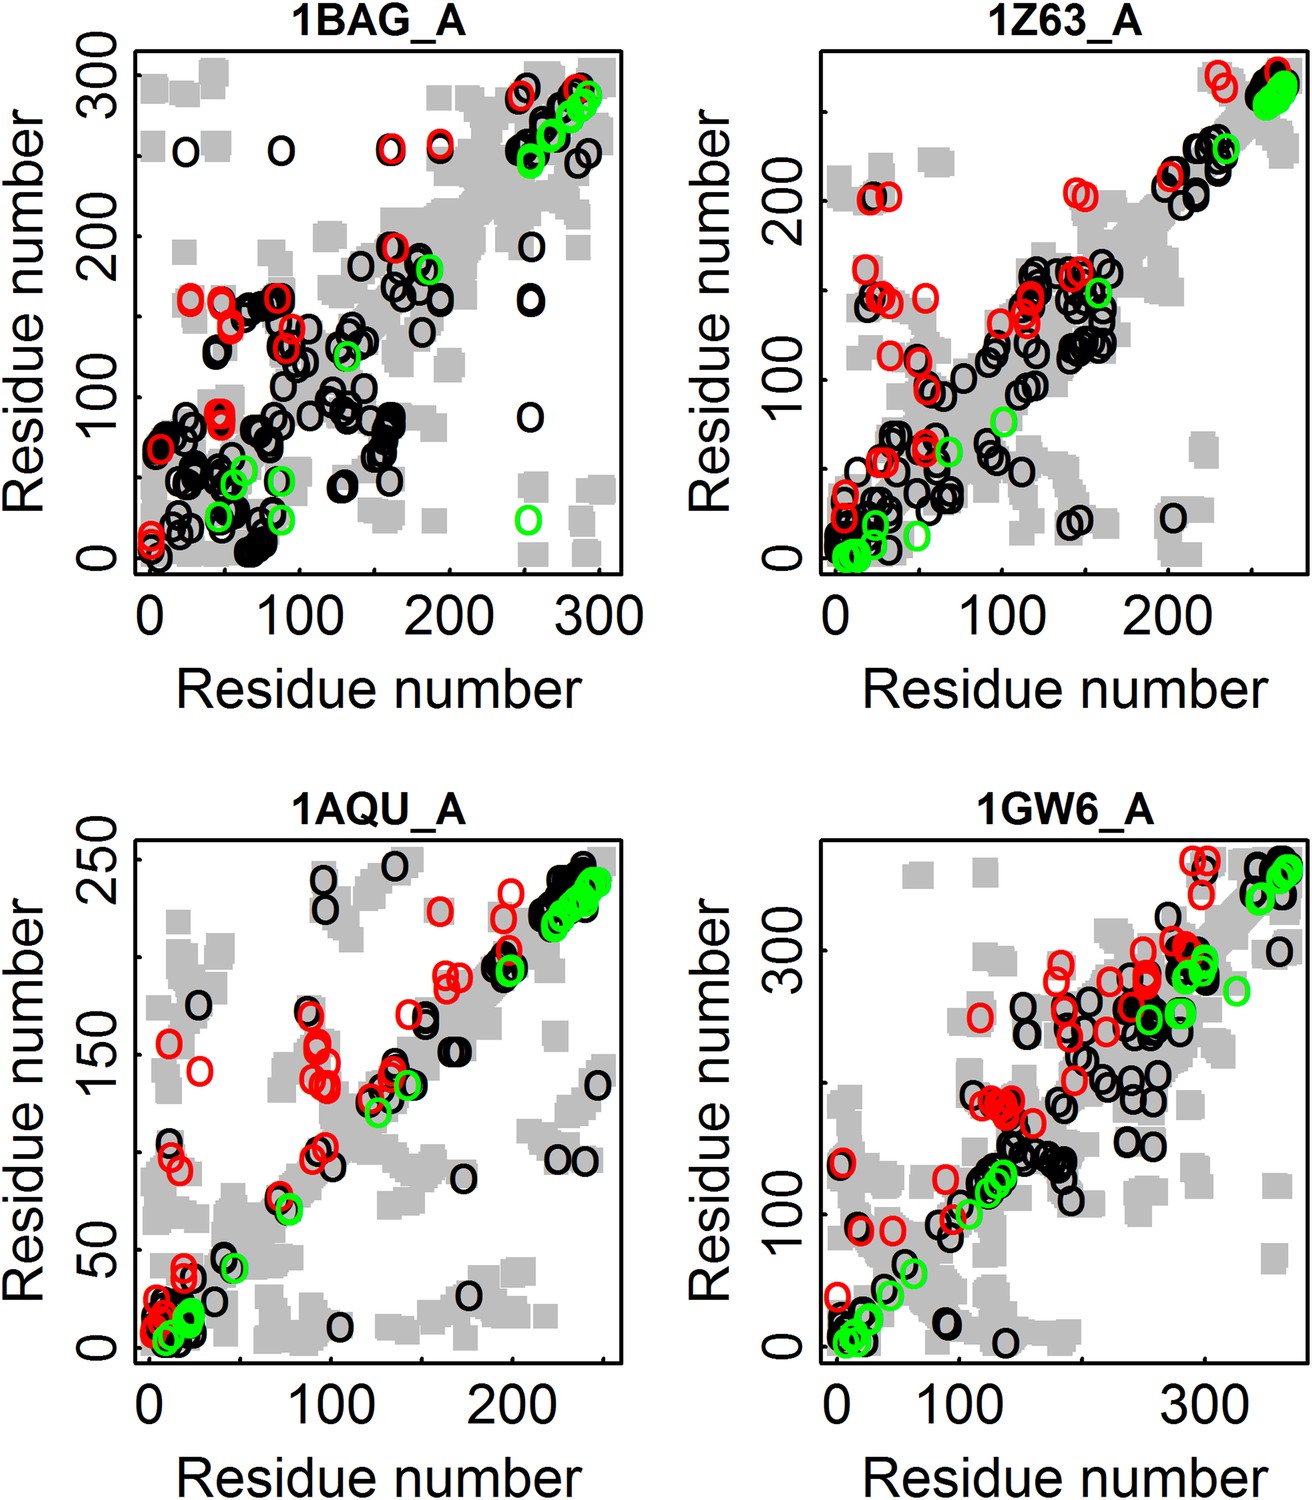
Illustration for four proteins of added value of combining amino acid and codon data in contact prediction by DCA.
All the contacts are shown as gray rectangles. Residues were defined as being in contact if at least one inter-atomic distance between their Cβ atoms (Cα for glycine) is ≤8 Å. The top 100 predicted contacts made with or without incorporating codon data are highlighted above (in red) and below (in green) the diagonal, respectively, and those predicted by both methods by black circles. 1BAG_A—contact map of the structure of alpha-amylase from Bacillus subtilis (Pfam id: PF00128). 1Z63_A—contact map of the structure of Sulfolobus solfataricus SWI2/SNF2 ATPase core (Pfam id: PF00176). 1AQU_A—contact map of the structure of mouse estrogen sulphotransferase (Pfam id: PF00685). 1GW6_A—contact map of the structure of human leukotriene A4 hydrolase (Pfam id: PF01433).
Download links
A two-part list of links to download the article, or parts of the article, in various formats.
Downloads (link to download the article as PDF)
Open citations (links to open the citations from this article in various online reference manager services)
Cite this article (links to download the citations from this article in formats compatible with various reference manager tools)
Codon-level information improves predictions of inter-residue contacts in proteins by correlated mutation analysis
eLife 4:e08932.
https://doi.org/10.7554/eLife.08932


