NG2 glia are required for vessel network formation during embryonic development
- University of Lausanne, Switzerland
- Collège de France, France
Figures
Figure 1
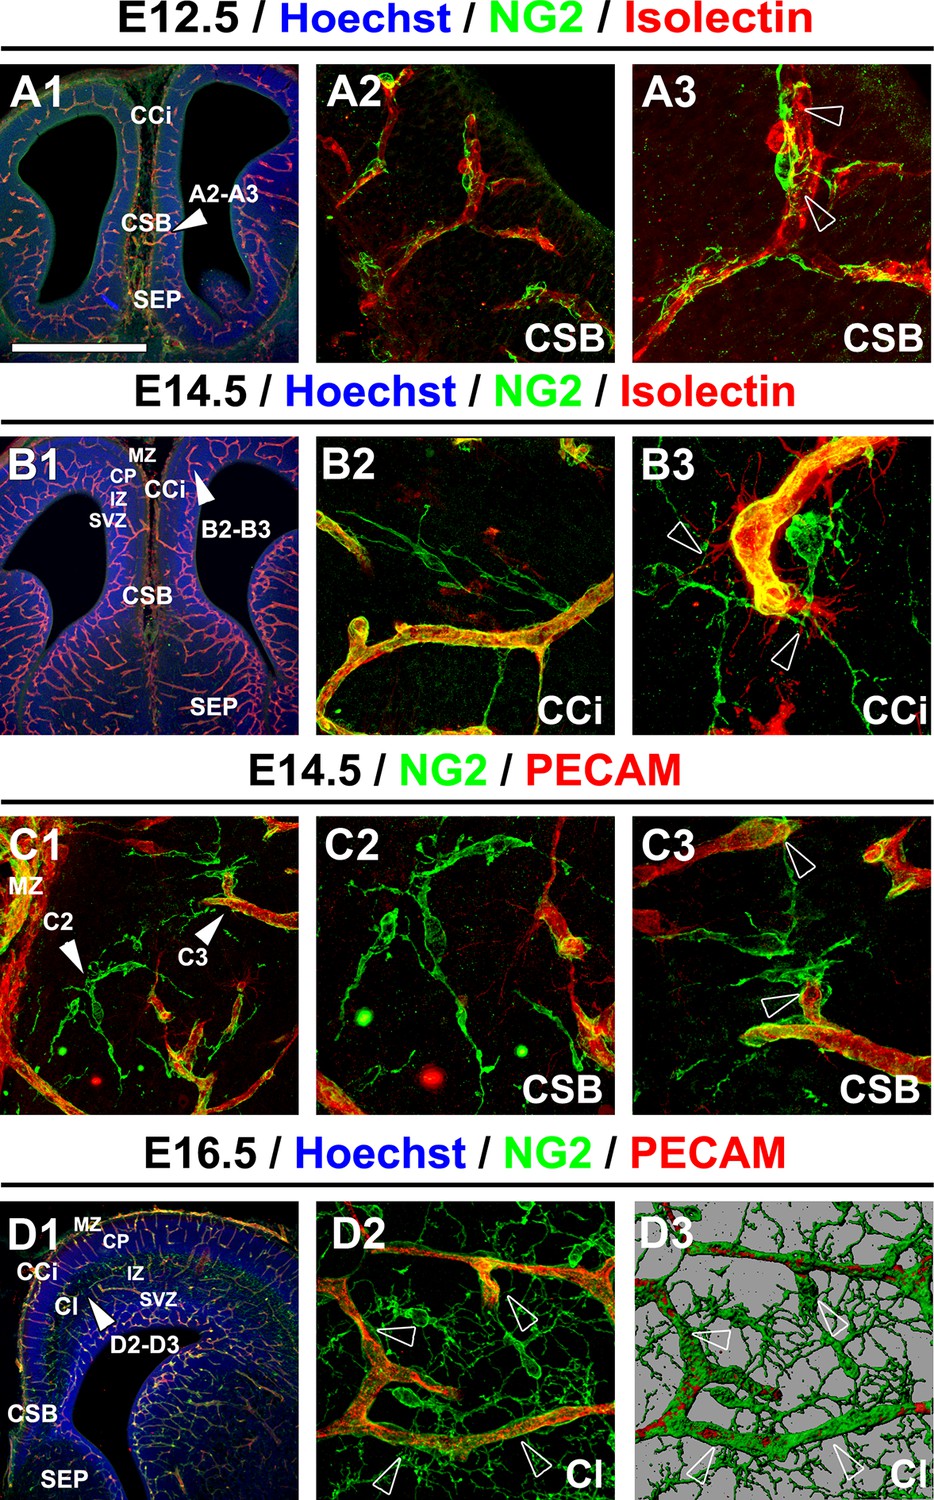
NG2+ glia are in close contact with blood vessels.
(A–D) Double immunohistochemistry for NG2 and Isolectin (A1–A3, B1–B3) and for NG2 and PECAM (C1–C3, D1–D2) on coronal cingulate cortex (CCi) and cingulate bundle (CI) sections of wild-type mice (n=3 each) at E12.5 (A1–A3), at E14.5 (B1–B3 and C1–C3), and at E16.5 (D1–D2). A3, A2, B2, B3, C2, C3,and D2 are higher power views of the region in A1, B1, C1, and D1, respectively (white arrowheads). D3 is an isosurface reconstruction of the labeling seen in D2. The processes of the NG2+ glia are in close contact with adjacent blood vessels (open arrowheads in A3, B3, and C3). Bar = 675 μm in A1, B1, and D1; 50 μm in A2, B2, C1, and D2; 40 μm in A3, B3, C2, and C3. CSB, corticoseptal boundary at the midline where the corpus callosum will form.
Figure 2 with 2 supplements
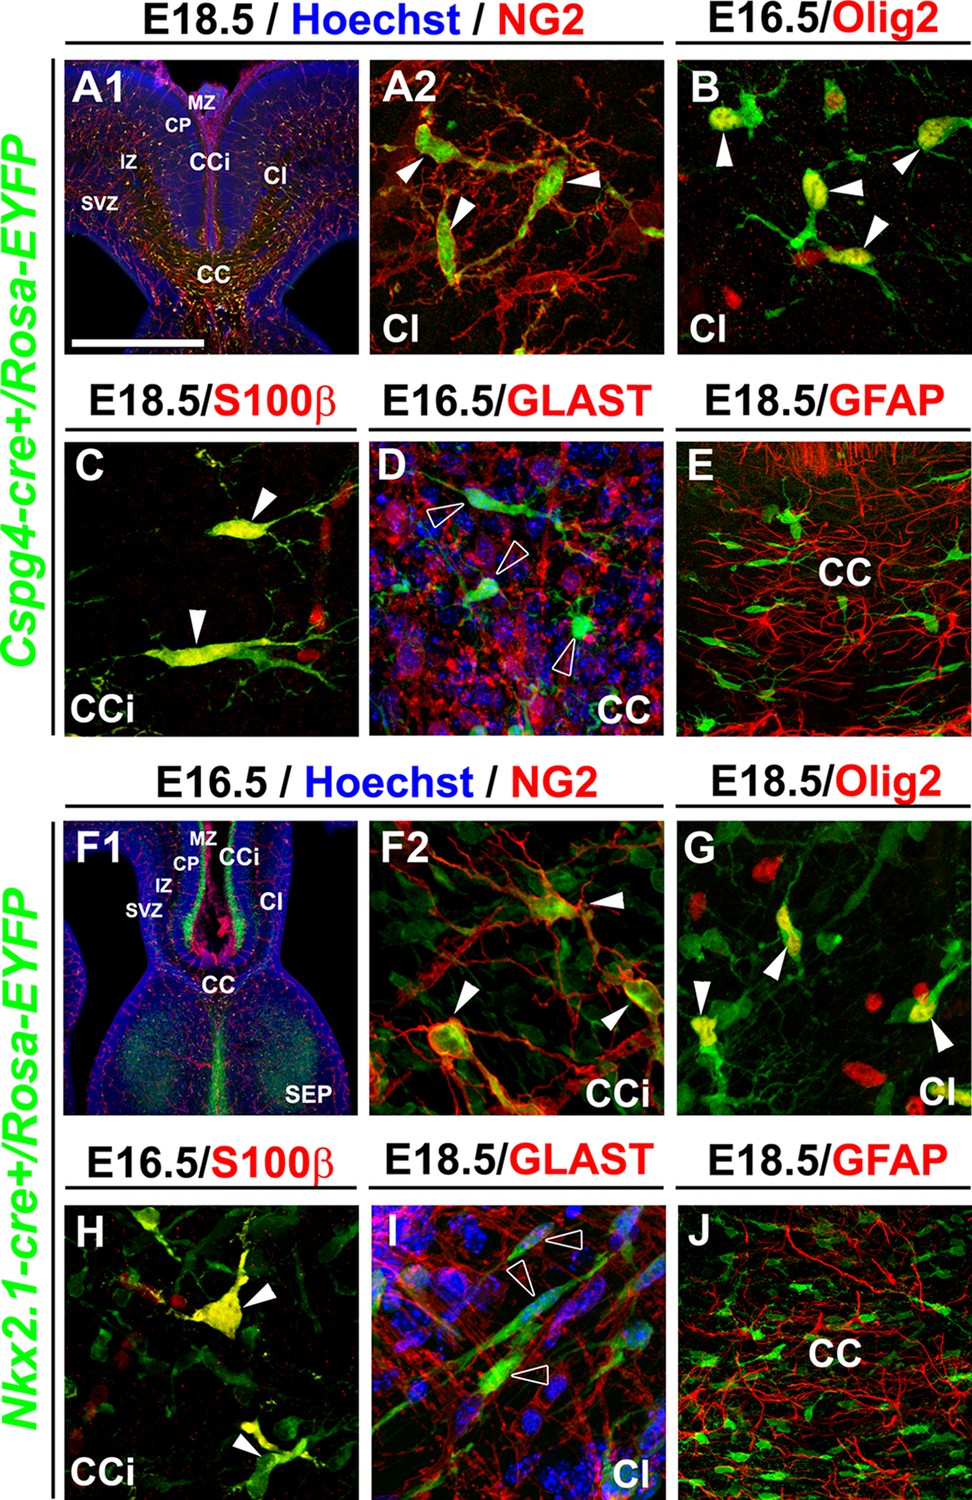
NG2+ glia of the dorsal telencephalon are derived from Nkx2.1+ progenitors of the subpallium.
(A–E) Double immunohistochemistry for the YFP and NG2 (A1–A2) (n=3), the YFP and Olig2 (B) (n=3), the YFP and S100β (C) (n=3), the YFP and GLAST (D) (n=3), and the YFP and GFAP (E) (n=3) on telencephalic coronal slices of Cspg4-cre+/Rosa-EYFP mice at E16.5 (B and D) and E18.5 (A1, A2, C, and E). (F–J) Double immunohistochemistry for the YFP and NG2 (F1–F2) (n=5), the YFP and Olig2 (G) (n=5), the YFP and S100β (H) (n=4), the YFP and GLAST (I) (n=4), and the YFP and GFAP (J) (n=3) on telencephalic coronal slices of Nkx2.1-cre+/Rosa-EYFP mice at E16.5 (F1, F2, and H) and E18.5 (G, I, and J). A2 and F2 are higher power views of the cingulate region in A1 and F1, respectively. The NG2-derived and the Nkx2.1-derived YFP+ cells co-express polydendroglial markers, NG2 and Olig2, together with S100β (white arrowheads) but lack expression of GLAST and GFAP (open arrowheads in D and I). Bar=675 μm in A1, F1; 100 μm in E, J; 50 μm in A2, B, C, D, F2, G, H, I.
Figure 2—figure supplement 1
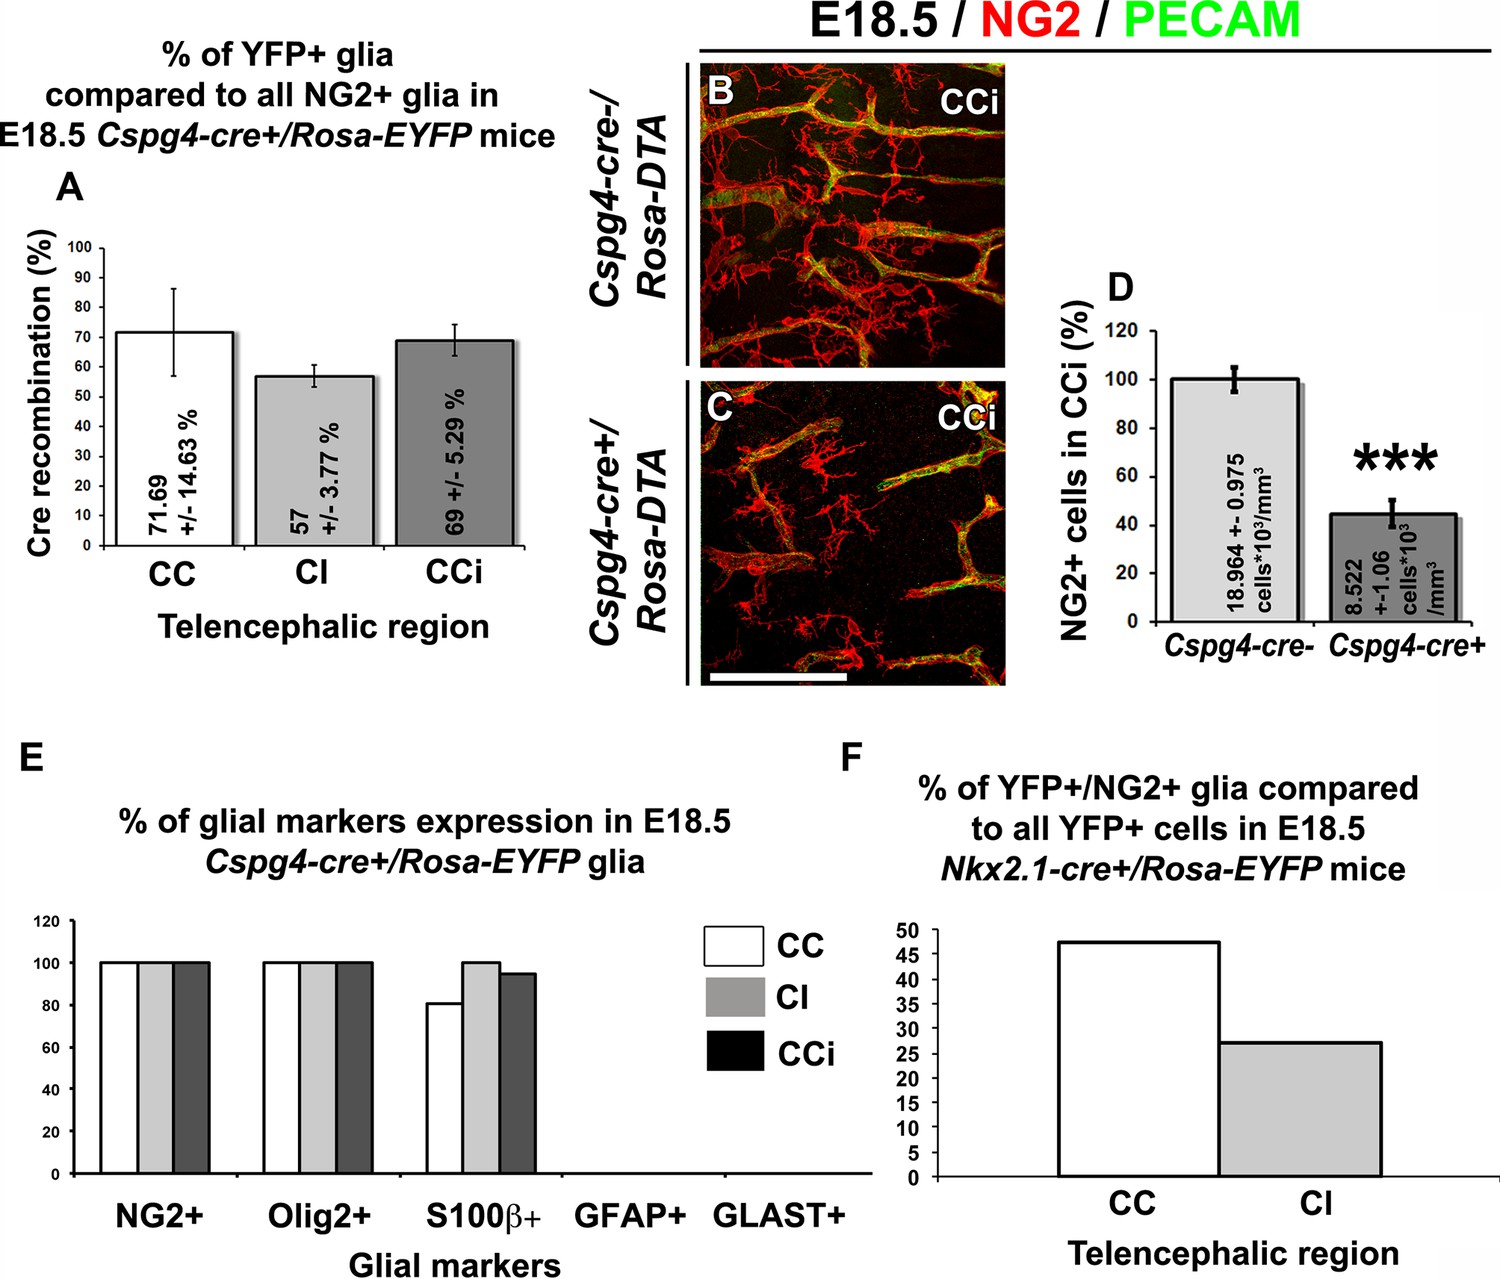
YFP signal in Nkx2.1-cre+/Rosa-EYFP and Cspg4-cre+/Rosa-EYFP mice is present in NG2 glia.
(A) Bars (means ± SEM) represent the percentage of YFP-labeled NG2 glia in corpus callosum (CC), cingulate bundle (CI), and cingulate cortex (CCi) sections of E18.5 Cspg4-cre+/Rosa-EYFP mice (n=3). The YFP signal in Cspg4-cre+/Rosa-EYFP mice was detected in a majority of NG2+ embryonic glia of the dorsal telencephalon (71.7 ± 14.6% in the CC, 57 ± 3.8% in the CI and 69 ± 5.3% in the CCi at E16.5, n=3). (B–C) Double immunohistochemistry for NG2 and PECAM in CCi coronal sections of Cspg4-cre-/Rosa-DTA (n=3) (B) and Cspg4-cre+/Rosa-DTA (n=3) (C) mutant mice at E18.5. Scale bar = 50 µm in B and C. (D) Bars (means ± SEM; unpaired Student’s t-test) represent the percentage of remaining NG2 glia in the telencephalon of E18.5 Cspg4-cre+/Rosa-DTA mice compared to control mice. A drastic loss of NG2+ glia followed by severe vascular defects was observed in Cspg4-cre+/Rosa-DTA mice compared to Cspg4-cre-/Rosa-DTA. (E) Bars (means) represent the percentage of glial markers expression by YFP-labeled NG2 glia in the CC, Cl, and CCi of E18.5 Cspg4-cre+/Rosa-EYFP mice. In Cspg4-cre+/Rosa-EYFP mice, all YFP-labeled NG2 glia of the dorsal telencephalon expressed NG2+/Olig2+ (n=2), many S100β+ (n=2) but no GLAST+ (n=3) or GFAP+ (n=2). (F) Bars (means)represent the percentage of NG2 markers expression by YFP-labeled cells in the telencephalon of E18.5 Nkx2.1-cre+/Rosa-EYFP mice (n=4) (47.24% in the CC and 27.2% in the Cl). CC, corpus callosum; CCi, cingulate cortex; Cl, cingulate bundle.
Figure 2—figure supplement 2
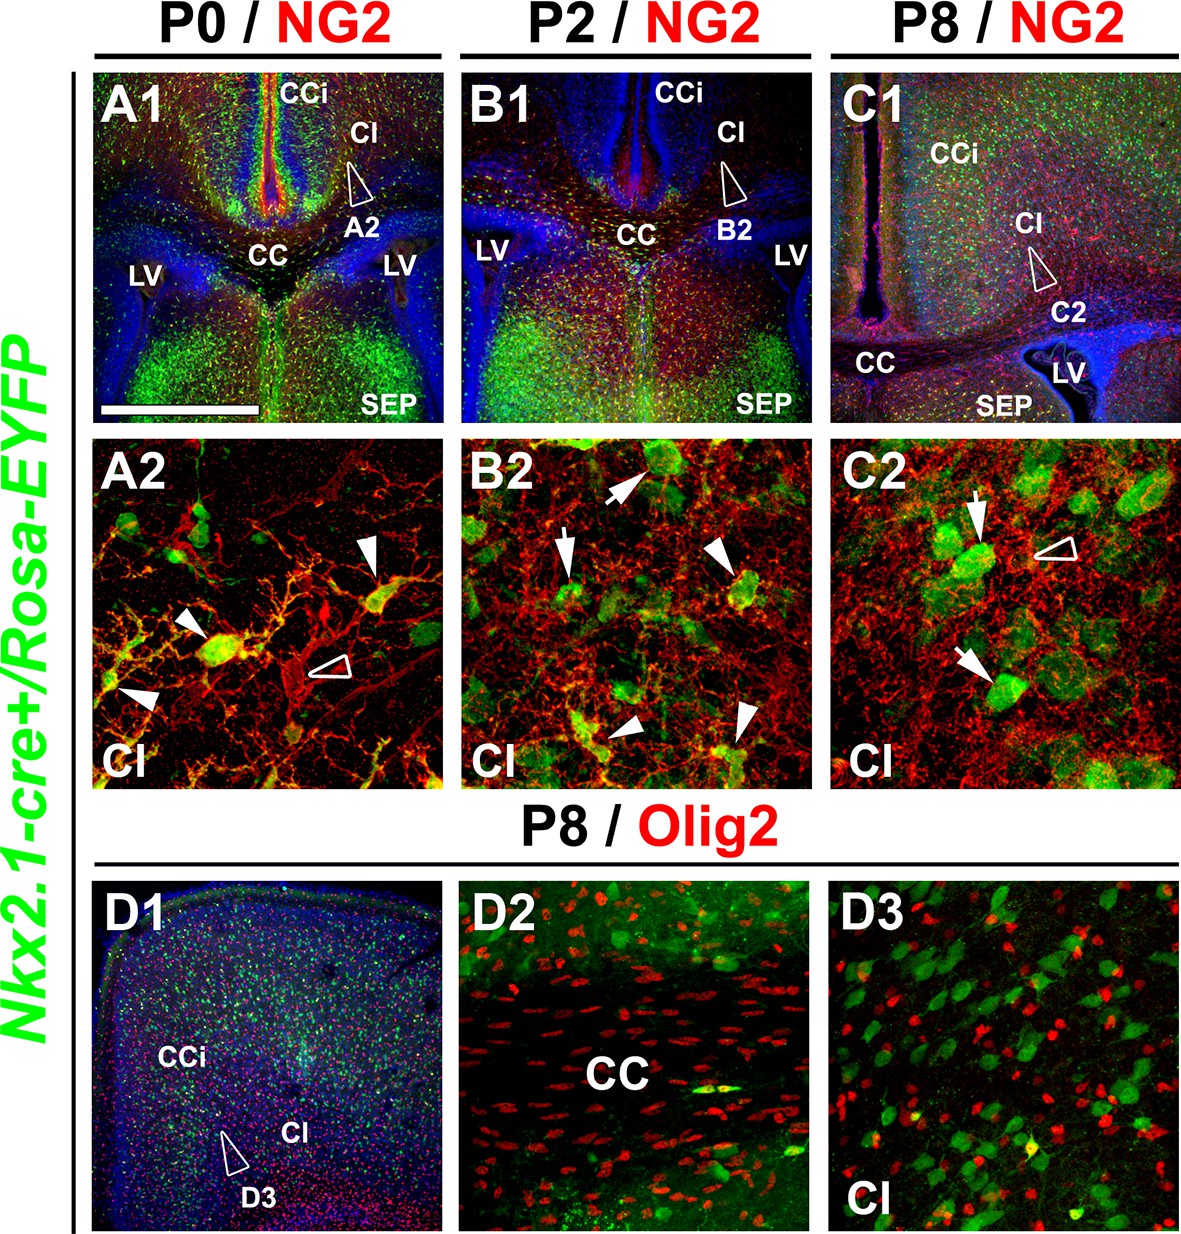
Nkx2.1-derived NG2 and Olig2 glia are transient and gradually disappear from the dorsal pallium at postnatal ages.
(A–C) Double immunohistochemistry for GFP and NG2 on coronal telencephalicsections from Nkx2.1-cre+/Rosa-EYFP mice at P0 (n=3) (A1–A2), P2 (n=3) (B1–B2), and P8 (n=2) (C1–C2). (D) Double immunohistochemistry for GFP and Olig2 on coronal telencephalicsections from Nkx2.1-cre+/Rosa-EYFP mice at P8 (n=2) (D1–D3). Cell nuclei were counterstained in blue with Hoechst (A1, B1, and C1). A2, B2, C2, and D3 are high-power views of the cingulate bundle (Cl) seen in A1, B1, C1, and D1, respectively. In the Cl of Nkx2.1-cre+/Rosa-EYFP mice brains at P2, only very few Nkx2.1-derived NG2 glia remained (arrowheads B2). At P8, Nkx2.1-derived NG2 and Olig2 glia disappeared completely and were replaced by NG2 and Olig2 glia that did not expressed the YFP and were not derived from Nkx2.1 germinal domains (open arrowheads in A2 and C2). At all postnatal ages many Nkx2.1-derived GABAergic interneurons found in this region were not labeled for NG2 (arrows in B2 and C2).Scale bar = 675 µm in A1, B1, C1 and D1; 40 µm in A2, B2 and C2; 100 µm in D2 and D3. CC, corpus callosum; CCi, cingulate cortex; LV, lateral ventricles; SEP, septum.
Figure 3 with 2 supplements
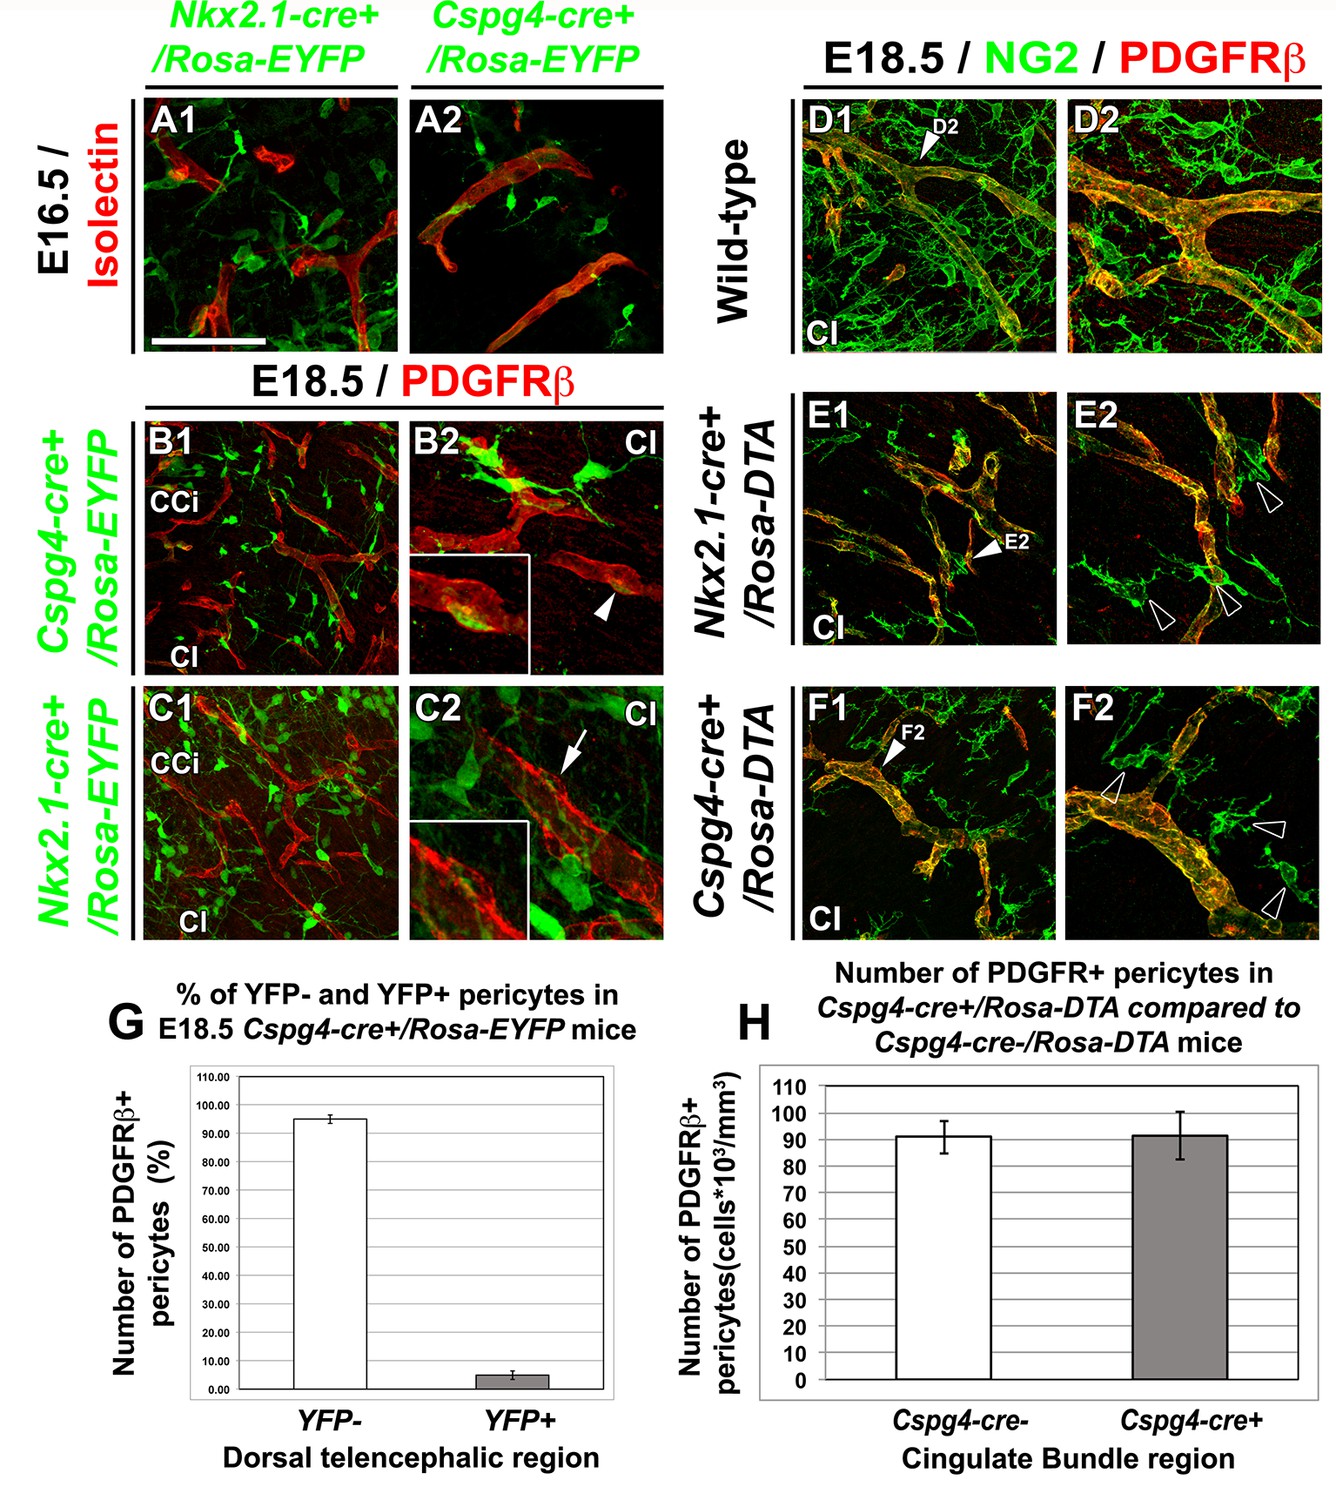
NG2+ glia, but not pericytes, control blood vessels formation.
(A–C) Double immunohistochemistry for the YFP and Isolectin (A1–A2) or PDGFRβ (B1–B2, C1–C2) on coronal cingulate cortex (CCi) and cingulate bundle (CI) sections of Nkx2.1-cre+/Rosa-EYFP (A1, C1–C2) and Cspg4-cre+/Rosa-EYFP (A2, B1–B2) mice (n=3) at E16.5 (A1–A2) and E18.5 (B1–B2 and C1–C2). (A–C) From E16.5 to E18.5, numerous YFP+ NG2 glia are surrounding cortical blood vessels. (B–C) The Cre-mediated recombination, visualized by the YFP signal, can be observed in only very few pericytes surrounding blood vessels in Cspg4-cre+/Rosa-EYFP mice (B2, boxed region showing high magnification of region marked with white arrowhead), but not in Nkx2.1-cre+/Rosa-EYFP mice (C2, boxed region showing high magnification of region marked with arrow). (D–F) Double immunohistochemistry for NG2 and PDGFRβ on coronal CI sections in wild-type (D1–D2), Nkx2.1-cre+/Rosa-DTA (E1–E2) (n=3) and Cspg4-cre+/Rosa-DTA (F1–F2) (n=3) mice at E18.5. (D–F) The NG2+ glia form a complex cellular network around the cortico-cerebral blood vessels outlined by NG2 and PDGFRβ staining. The DTA under the control of Nkx2.1 (E) and Cspg or NG2 (F) promoters selectively depletes NG2+ glia but not pericytes. D2, E2, and F2 are higher power views of the cingulate region in D1, E1, and F1, respectively (white arrowheads). (G) Bars (means ± SEM) represent the percentage of YFP-negative and YFP-positive PDGFRβ labeled pericytes in dorsal telencephalon sections of E18.5 Cspg4-cre+/Rosa-EYFP mice (n=10). The YFP signal in Cspg4-cre+/Rosa-EYFP mice was not detected in PDGFRβ+ embryonic pericytes of the dorsal telencephalon (95.05 ± 1.54% of pericytes are YFP-negative in the CI at E18.5, n=10). (H) Bars (means ± SEM; unpaired Student’s t-test) represent the percentage of remaining PDGFRβ+ pericytes in cingulate bundle (Cl) sections of E18.5 Cspg4-cre+/Rosa-DTA mice (n=11) compared to control mice (n=11). No loss of PDGFRβ+ pericytes was observed in Cspg4-cre+/Rosa-DTA mice compared to Cspg4-cre-/Rosa-DTA. Bar = 100 μm in B1, C1; 50 μm in A1, A2, D1, E1, F1; 40 μmin B2, C2, D2, E2, F2.
Figure 3—figure supplement 1
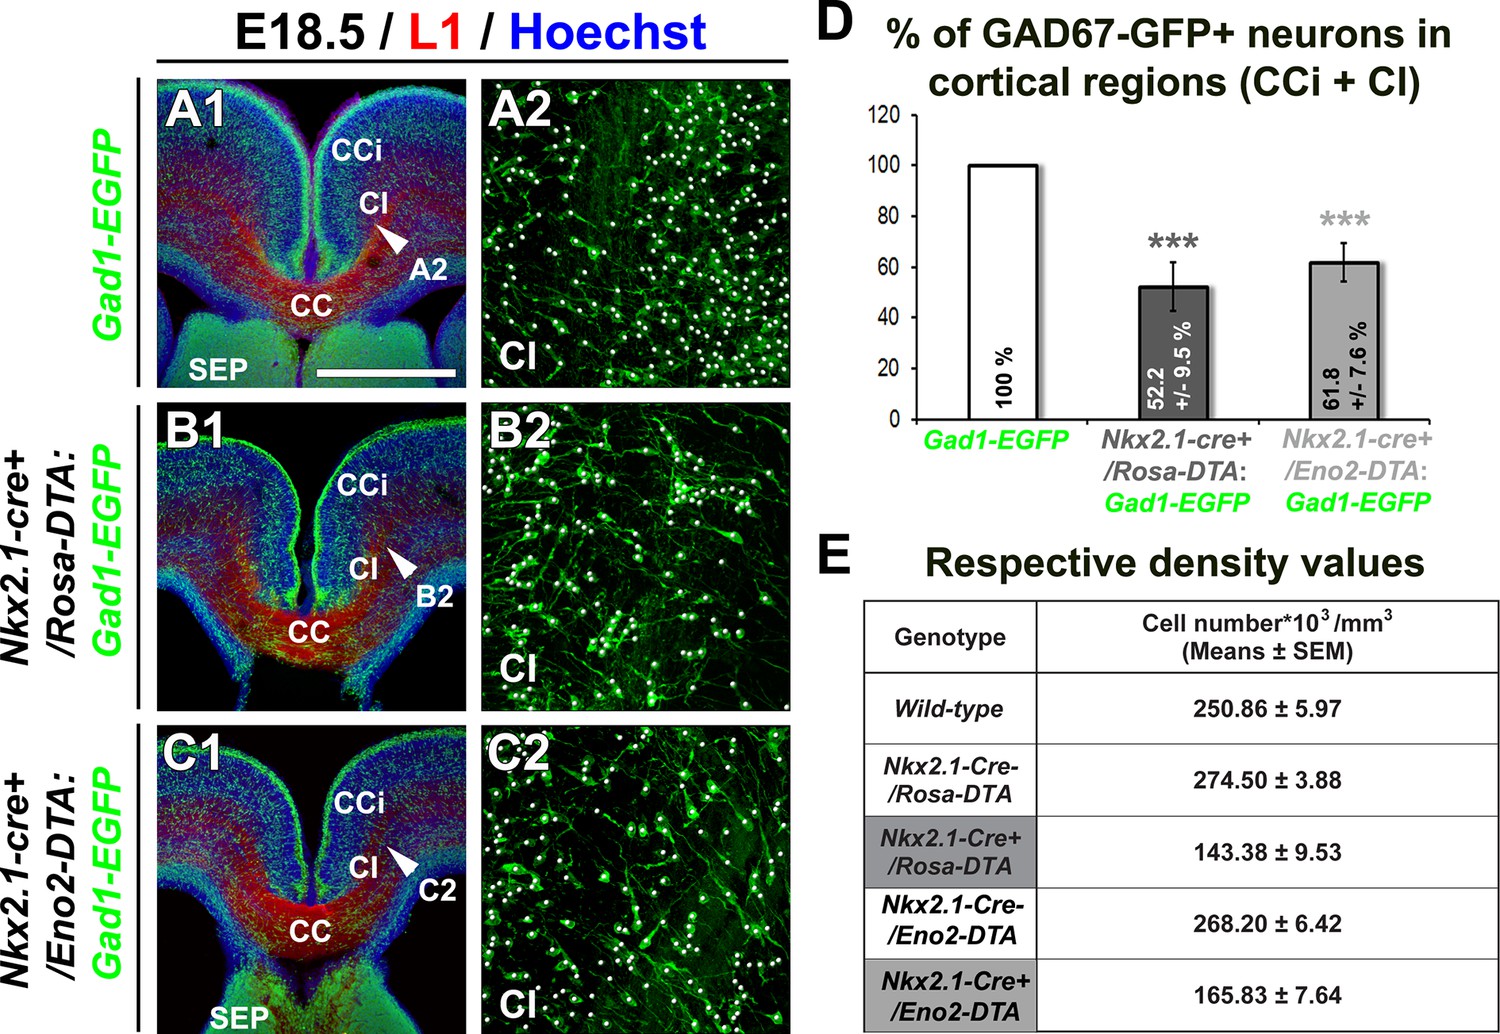
Drastic depletion of GAD67-GFP+ neurons in Nkx2.1-/-, Nkx2.1-cre+/Rosa-DTA and Nkx2.1-cre+/Eno2-DTA cortices.
(A–D) Double immunohistochemistry for the GFP and L1 on coronal CI sections in Gad1-EGFP (n=8) (A1–A2), Nkx2.1-cre+/Rosa-DTA:Gad1-EGFP (n=5) (B1–B2) and Nkx2.1-cre+/Eno2-DTA:Gad1-EGFP (n= 6) (C1–C2) mice at E18.5. A2, B2, and C2 are higher power views showing the quantification of the GAD67-GFP+ interneurons (white spots) within the CI region pointed with a white arrowhead in A1, B1, and C1, respectively. (D) Bars (means ± SEM; unpaired Student’s t-test) represent the percentage of remaining GAD67-GFP+ interneurons in the CI of E18.5 Nkx2.1-cre+/Rosa-DTA:Gad1-EGFP and Nkx2.1-cre+/Eno2-DTA:Gad1-EGFP mice compared to Gad1-EGFP mice. Both the mutant mice exhibited equivalent loss of neurons when compared to wild-type mice. (E) Table of the corresponding cell density values (cell number*103/mm3) (unpaired Student’s t-test). Scale bar = 675 µm in A1, B1, and C1; 100 µm in A2, B2, and C2. CC, corpus callosum; CCi, cingulate cortex; Cl, cingulate bundle; SEP, septum.
Figure 3—figure supplement 2
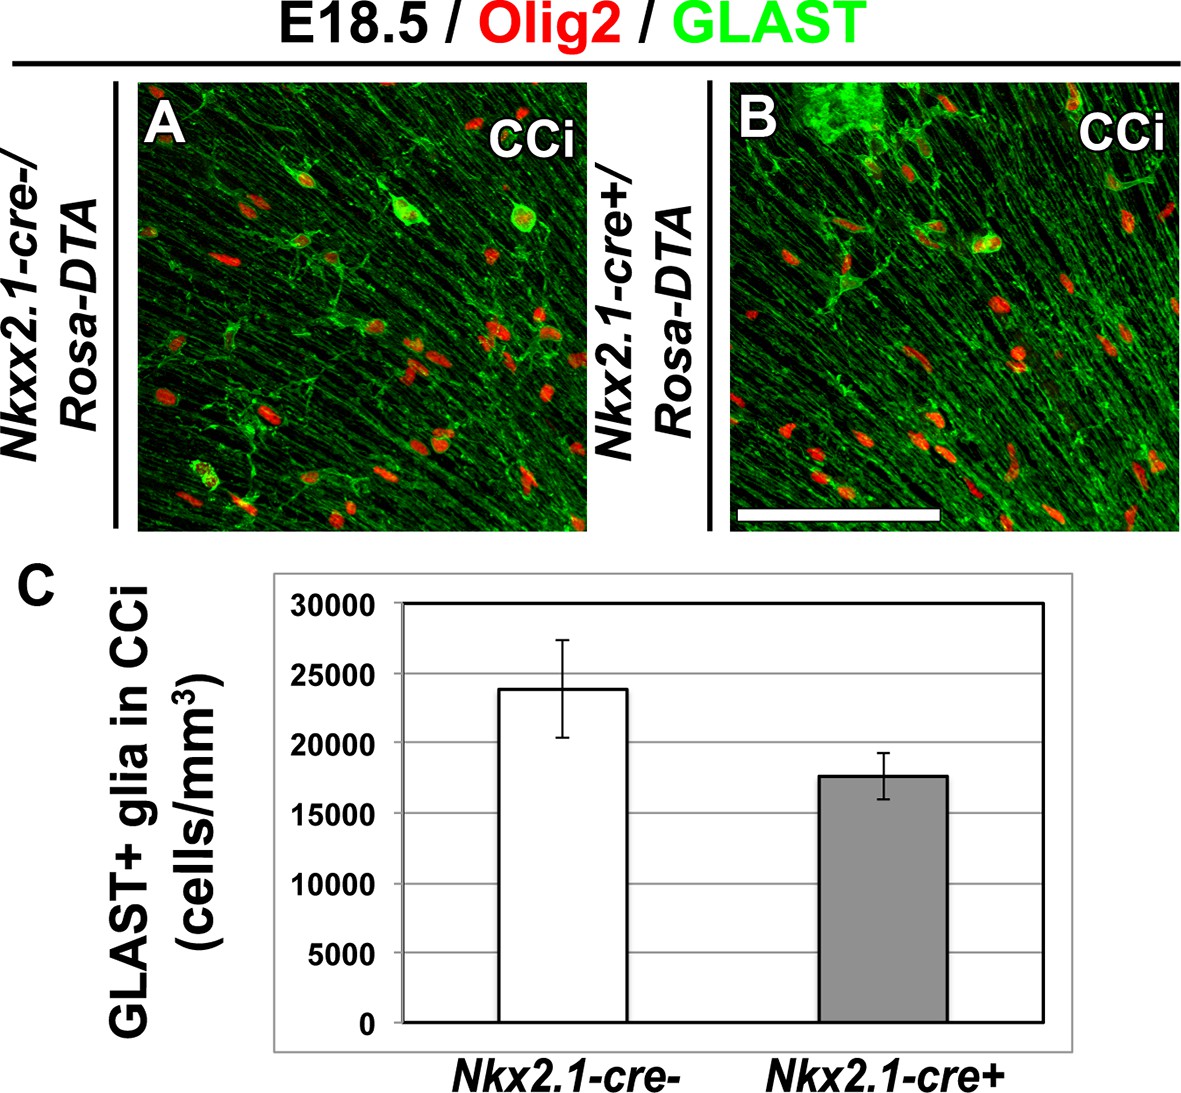
GLAST+ astrocytes are not affected in Nkx2.1-cre+/Rosa-DTA cingulate cortex at E18.5.
(A–B) Double immunohistochemistry for Olig2 and GLAST in cingulate cortex (CCi) coronal sections of Nkx2.1-cre-/Rosa-DTA mutant mice (n=4) (A) and Nkx2.1-cre+/Rosa-DTA control mice (n=4) (B) at E18.5. Scale bar = 50 µm in A and B. (C) Bars (means ± SEM; unpaired Student’s t-test) represent the density number of remaining GLAST+ astroglia in the CCi of E18.5 Nkx2.1-cre+/Rosa-DTA mice compared to control mice. No significant loss of GLAST+ astroglia was observed in Nkx2.1-cre+/Rosa-DTA CCi compared to control mice.
Figure 4 with 1 supplement
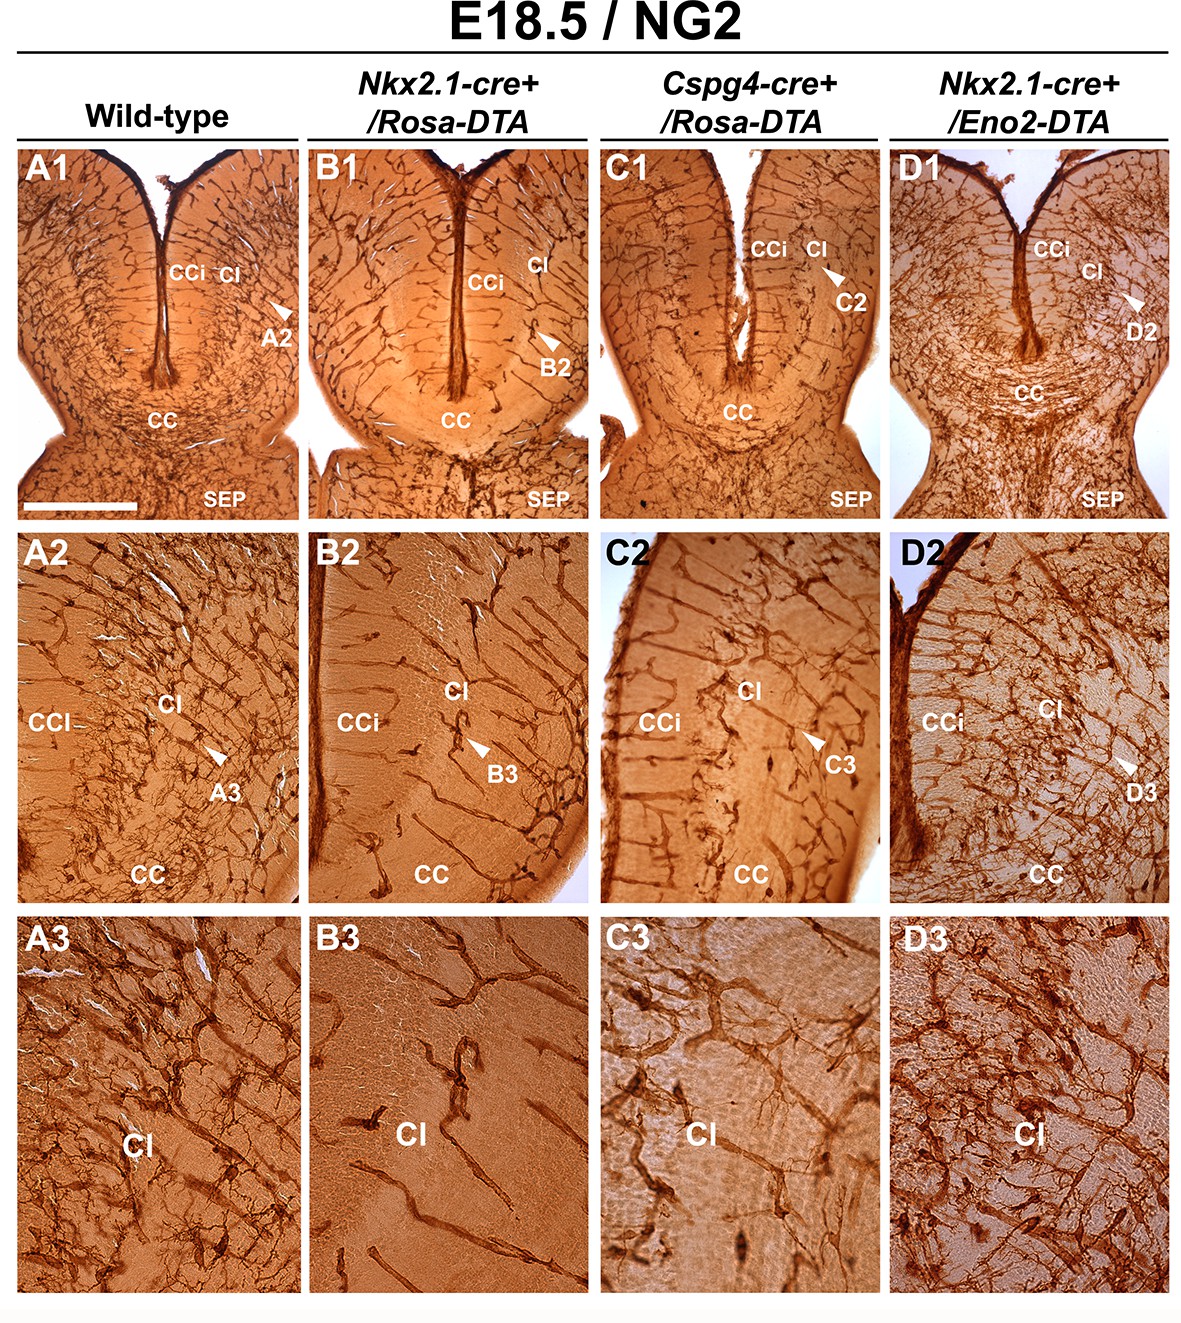
Drastic depletion of embryonic NG2+ glia in Nkx2.1-cre+/Rosa-DTA and Cspg4-cre+/Rosa-DTA midline dorsal telencephalon.
DAB staining for NG2 in wild-type (A1–A3) (n=6), Nkx2.1-Cre+/Rosa-DTA (B1–B3) (n=3), Cspg4-cre+/Rosa-DTA (C1–C3) (n=3), and Nkx2.1-cre+/Eno2-DTA (D1–D3) (n=3) telencephalic coronal slices at E18.5. NG2+ glia were completely depleted from the corpus callosum (CC), the cingulate cortex (CCi), and cingulate bundle (Cl) of Nkx2.1-cre+/Rosa-DTA (B1–B3) mutant mice compared to wild-type mice (A1–A3). In Cspg4-cre+/Rosa-DTA mutant mice (C1–C3), there was also a drastic loss of NG2+ cells in medial cortical areas of the dorsal telencephalon with only few remaining cells. In Nkx2.1-cre+/Eno2-DTA (D1–D3) mutant mice, there was no loss of NG2+ glia in all the observed regions. A2–A3, B2–B3, C2–C3, and D2–D3 are higher power views of the Cl regions in A1, B1, C1, and D1, respectively (white arrowheads). Bar = 500 μm in A1, B1, C1, and D1; 250 μm in A2, B2, C2, and D2; 125 μm in A3, B3, C3, and D3.
Figure 4—figure supplement 1
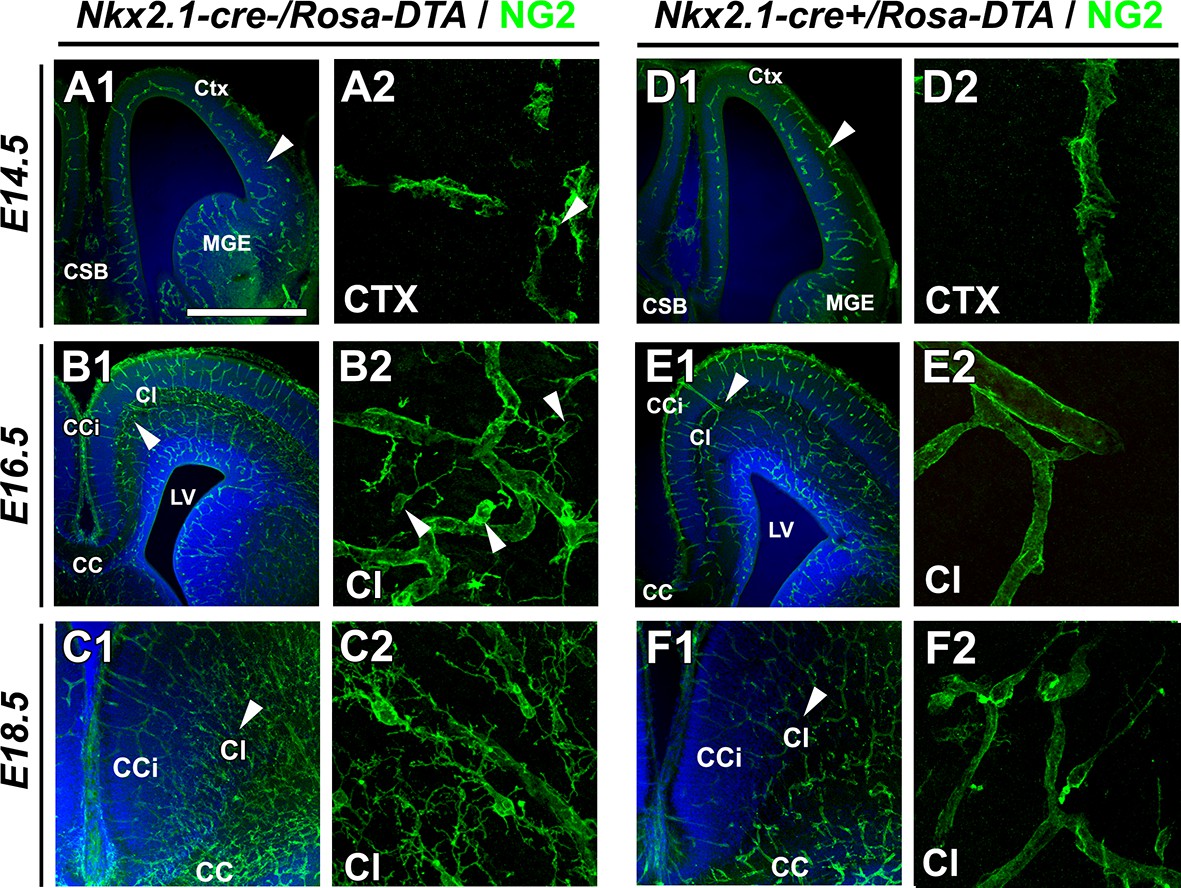
Drastic depletion of embryonic NG2+ glia in Nkx2.1-cre+/Rosa-DTA midline dorsal telencephalon starts at E16.5.
(A–D) Immunostaining for NG2 in Nkx2.1-cre-/Rosa-DTA (A1–A2 to C1–C2) and Nkx2.1-cre+/Rosa-DTA (D1–D2 to F1–F2) telencephalic coronal slices at E14.5 (A1–A2, D1–D2), E16.5 (B1–B2, E1–E2) and E18.5 (C1–C2, F1–F2). A2, B2, C2, D2, E2, and D2 are higher power views of the region in A1, B1, C1, D1, E1, and F1, respectively (white arrowheads). At E14.5, there were no significant differences in NG2+ glia observed in the cingulate regionof Nkx2.1-cre+/Rosa-DTA mutant mice (n=3) compared to wild-type mice (n=3) (A1–A2, D1–D2). By contrast, later at E16.5, there was already a drastic loss of NG2+ glia populating the medio-dorsal telencephalon regionsin the Nkx2.1-cre+/Rosa-DTA (n=3) mutant mice compared to control mice (n=3) (B1–B2, E1–E2). This loss was maintained at E18.5 in the Nkx2.1-cre+/Rosa-DTA (n=3) mutant mice compared to control mice (n=3) (C1–C2, F1–F2). Scale bar = 675 µm in A1, B1, C1, D1, E1, and F1; 40 μmin A2, B2, C2, D2, E2, and F2.
Figure 5 with 4 supplements
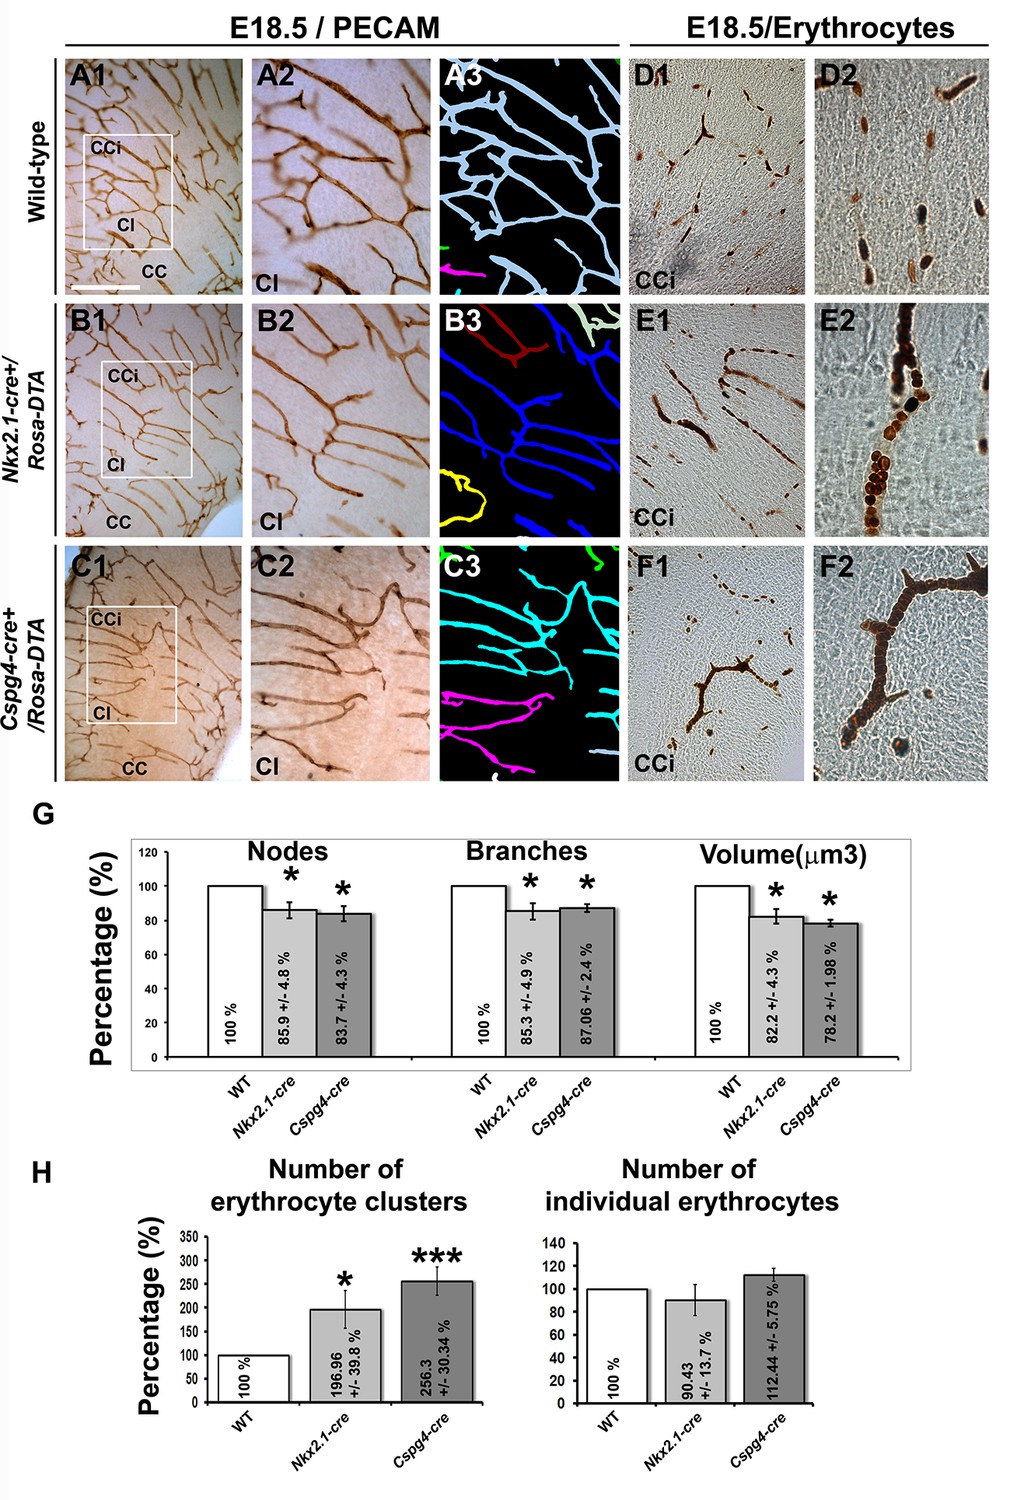
Blood vessel branching is similarly impaired in Nkx2.1Cre+/Rosa-DTA and Cspg4-cre+/Rosa-DTA mice.
(A–C) DAB staining for PECAM and reconstitution of the vascular network using the Neurolucida tracing tool in wild-type (A1–A3) (n=8), Nkx2.1-cre+/Rosa-DTA (B1–B3) (n=4) and Cspg4-cre+/Rosa-DTA (C1–C3) (n=4) cortical coronal sections at E18.5. A2, B2, and C2 are higher magnified views of the boxed regions seen in A1, B1, and C1, respectively. (D–F) DAB staining for erythrocytes in wild-type (D1–D2) (n=10), Nkx2.1-cre+/Rosa-DTA (E1–E2) (n=5), and Cspg4-cre+/Rosa-DTA (F1–F2) (n=5) cortical coronal sections at E18.5. (G) Bars (means ± SEM) represent the percentages of vessel nodes, vessel branches and volume of the vascular network in mutants compared to wild-type (n=4; unpaired Student’s t-test). The respective absolute values per CCi section are given in Table 1. All the quantified parameters were significantly decreased in mutant mice. (H) Bars (means ± SEM) represent the percentage of erythrocyte clusters and individual erythrocytes in mutants compared to wild-type. The respective absolute values per CCi section are given in Table 2 (n=5; unpaired Student’s t-test).The number of erythrocyte clusters showed a significant increase in all mutants. The total number of individual erythrocytes remained unchanged. Bar = A1, B1, C1: 250 μm; D1, E1, F1: 125 μm; A2, A3, B2, B3, C2, C3: 62.5 μm; D2, E2, F2: 50 μm. CCi, cingulate cortex.
Figure 5—figure supplement 1
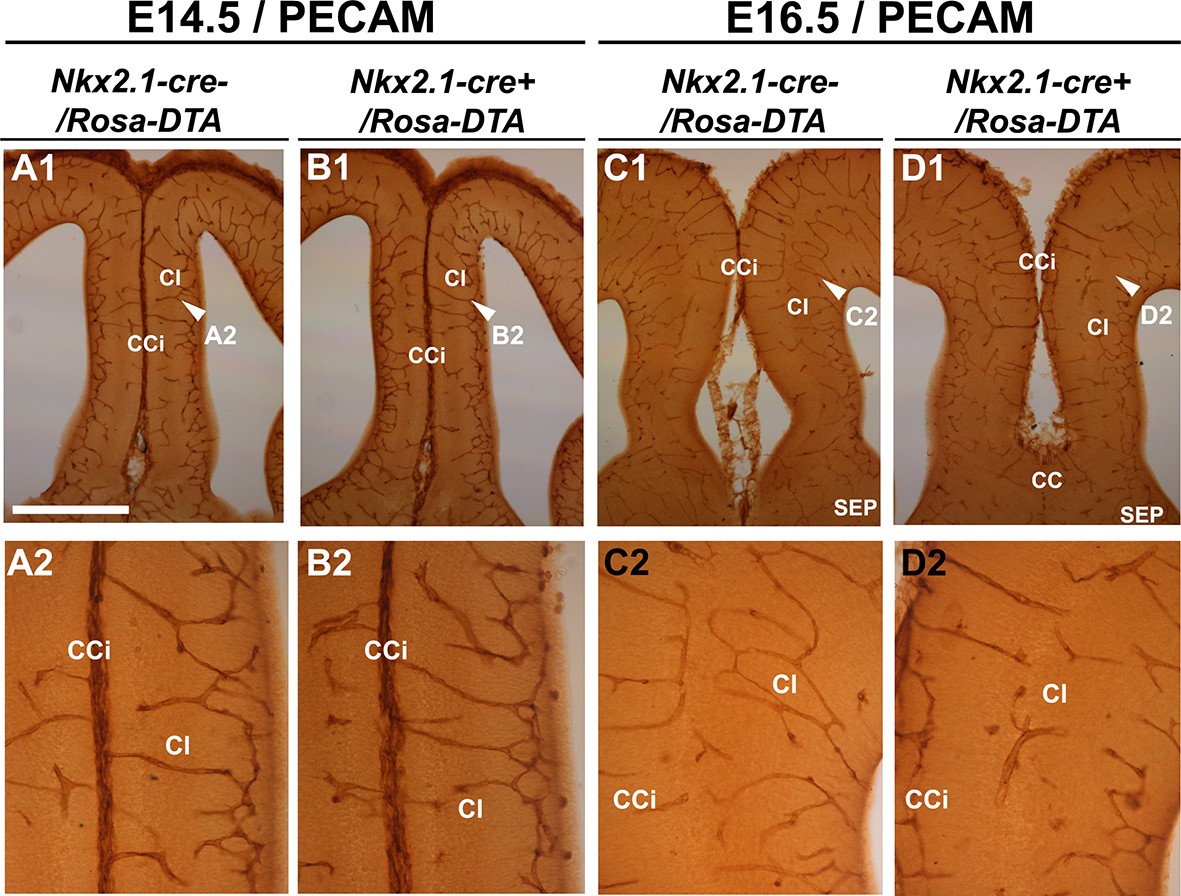
Embryonic Nkx2.1-derived NG2 glia do not control cortical blood vessels outgrowth before E16.5.
(A–D) DAB staining for PECAM in Nkx2.1-cre-/Rosa-DTA (n=4) (A1-A2, C1–C2) and Nkx2.1-cre+/Rosa-DTA (n=4) (B1–B2, D1–D2) telencephalic coronal slices at E14.5 (A1–A2, B1–B2) and E16.5 (C1–C2, D1–D2). At E14.5, there was no significant blood vessel network defect observed in the cingulate region of Nkx2.1-cre+/Rosa-DTA (B1–B2) mutant mice compared to wild-type mice (A1–A2). By contrast, later at E16.5, the blood vessel network is less developed in the Nkx2.1-cre+/Rosa-DTA (D1–D2) mutant mice (D1–D2) compared to control mice (C1–C2). Scale bar = 250 µm in A1, B1, C1, and D1; 125 µm in A2, B2, C2, and D2.
Figure 5—figure supplement 2
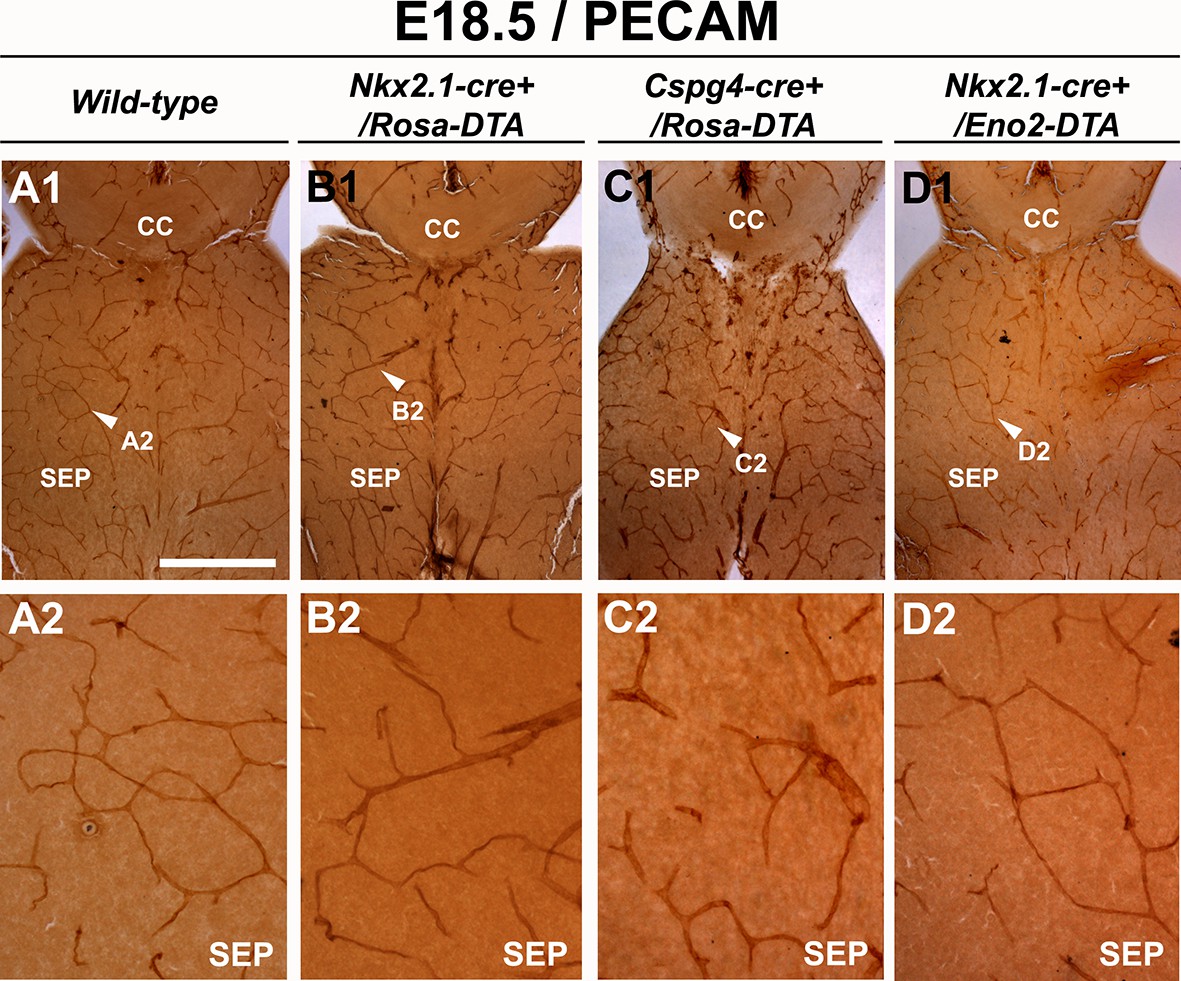
Blood vessel structure is impaired in the septum of Nkx2.1-cre+/Rosa-DTA and Cspg4-cre+/Rosa-DTA mice at E18.5.
(A–D) DAB staining for PECAM in wild-type (n=12) (A1–A2), Nkx2.1Cre+/Rosa-DTA (n=4) (B1–B2), Cspg4-cre+/Rosa-DTA (n=4) (C1–C2) and Nkx2.1-cre+/Eno2-DTA (n=4) (D1–D2) telencephalic coronal slices at E18.5. The blood vessel network was significantly impaired in the septal region (SEP) of Nkx2.1-cre+/Rosa-DTA (B1–B2) and Cspg4-cre+/Rosa-DTA (C1–C2) mutant mice compared to wild-type mice (A1–A2). In Nkx2.1-cre+/Eno2-DTA (D1–D2) mutant mice, there was no significant blood vessel network defect observed in the septal region. Scale bar = 500 µm in A1, B1, C1, and D1; 125 µm in A2, B2, C2, and D2.
Figure 5—figure supplement 3

Embryonic Nkx2.1-derived GABAergic neurons do not control the development and function of cortical blood vessels.
DAB staining for PECAM (A1–A2, B1–B2) and for erythrocytes (C1–C2, D1–D2) in coronal slices of the dorsal telencephalon of E18.5 wild-type (n=3) (A1–A2, C1–C2) and Nkx2.1-cre+/Eno2-DTA (n=3) (B1–B2, D1–D2) mutant mice. (A2, B2, C2, and D2) are higher magnified views of the cingulate bundle (CI) region pointed with a black arrowhead in (A1, B1, C1, and D1), respectively. PECAM and erythrocyte staining revealed that the loss of GABAergic neurons in Nkx2.1-cre+/Eno2-DTA mutant mice did not cause any vascular anomalies (B2 and D2) compared to control mice (A2 and C2). Scale bar = 500 µm in A1, B1, C1, and D1; 125 µm in A2, B2, C2 ,and D2. CC, corpus callosum; CCi, cingulate cortex.
Figure 5—figure supplement 4
No significant blood vessel network defects are observed in Cspg4-cre+/Rosa-DTA postnatal brains.
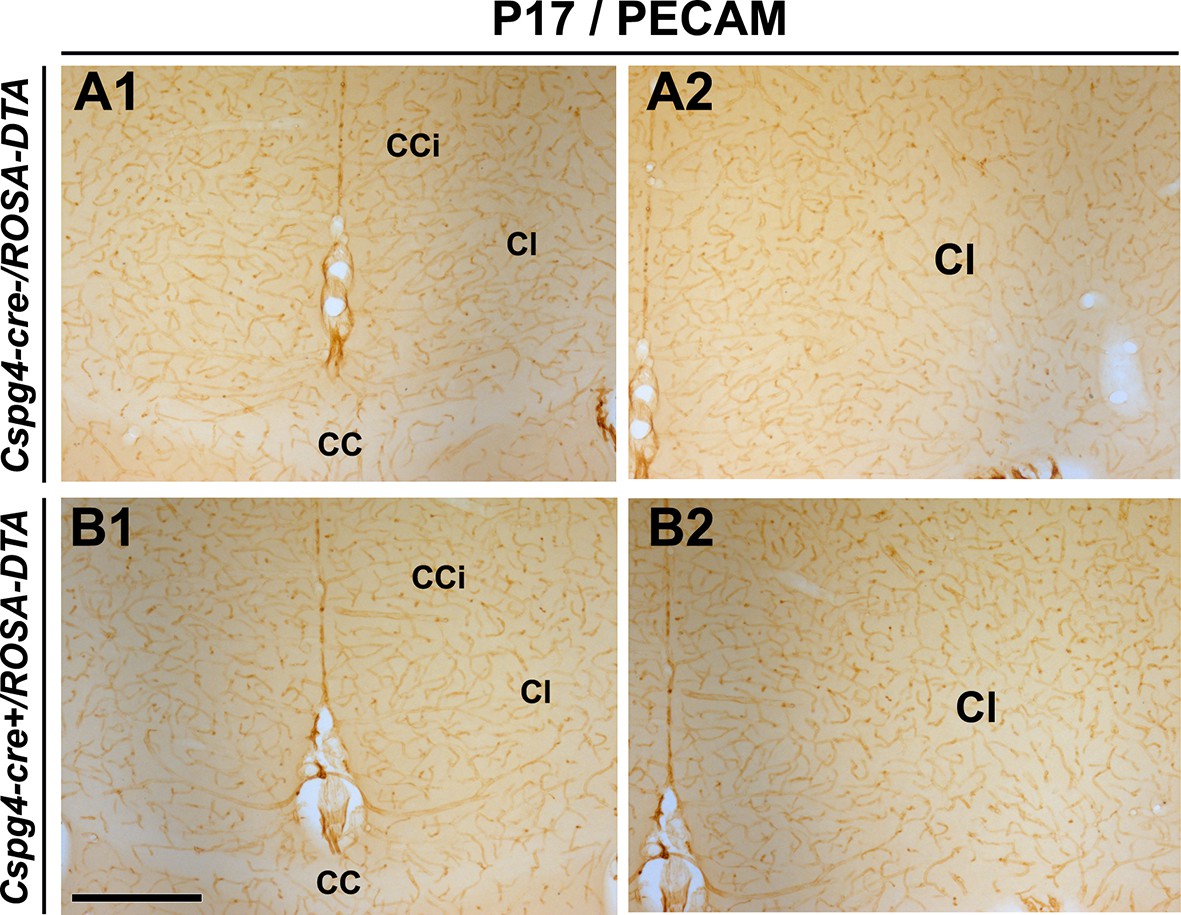
(A–D) DAB staining for PECAM in Cspg4-cre-/Rosa-DTA (n=3) (A1–A2) and Cspg4-cre+/Rosa-DTA (n=3) (B1–B2) telencephalic coronal slices at P17-P19 (A1–A2, B1–B2). At all postnatal ages, there was no significant blood vessel network defect observed in the cingulate region and corpus callosum of Cspg4-cre+/Rosa-DTA (B1–B2) mutant mice compared to control Cspg4-cre-/Rosa-DTA (A1–A2) mice. Scale bar = 500 μm in A1–A2 and B1–B2.
Figure 6
Macrophages and tip cells are not affected in Nkx2-1Cre+/Rosa-DTA mice.
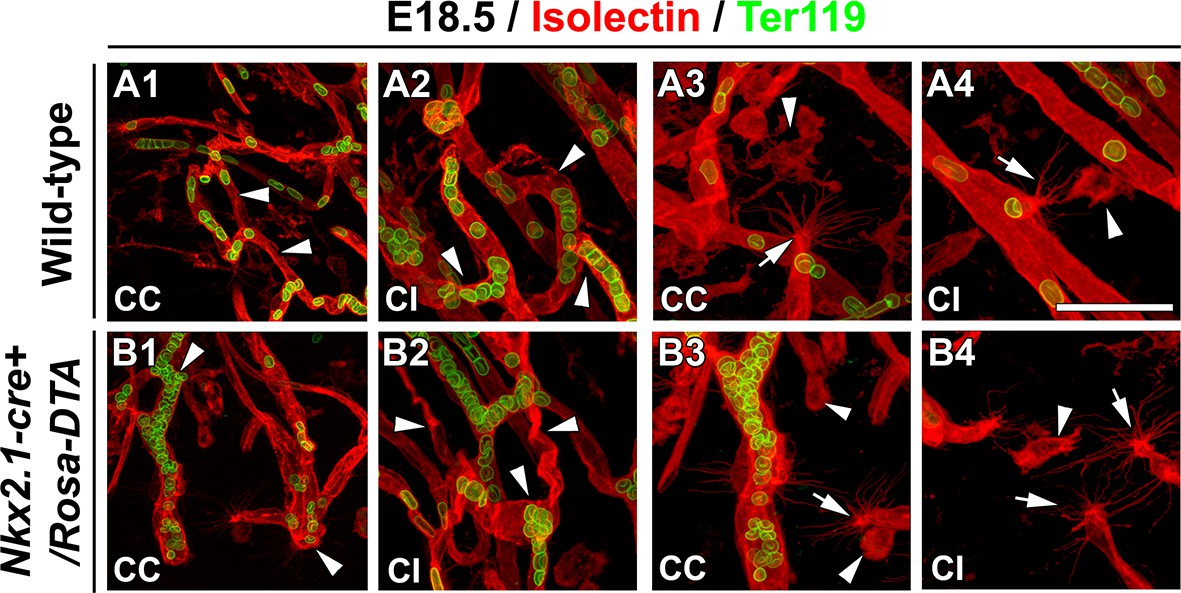
(A–B) Double immunohistochemistry for Isolectin and Ter119, to visualize erythrocytes, on 250-μm-thick coronal of corpus callosum (CC) and cingulate bundle (CI) sections in wild-type (A1–A4) (n=5) and Nkx2.1-cre+/Rosa-DTA (B1–B4) (n=5) mice at E18.5. In the CC and the CI (B1–B2) of Nkx2.1-cre+/Rosa-DTA mice, the blood vessels have a twisted shape and the erythrocytes are clustered (white arrowheads in B1 and B2) compared to the wild-type vessels that formed a regular network (white arrowheads in A1 and A2). In the CC and the CI of both wild-type (A3–A4) and Nkx2.1-cre+/Rosa-DTA mice (B3–B4), guidepost macrophages labeled by the isolectin (white arrowheads in A3–A4 and B3–B4) are found in the close vicinity of the tip cells (white arrows in A3–A4 and B3–B4). The tip cells exhibit the same morphology and the same number of filopodia with similar length in both circumstances. Bar = 60 μm in A1, B1; 40 μm in A2, B2, A3, A4, B3, B4.
Tables
Table 1
Nodes, branches and volume of the vascular network visualized per CCi section in control and transgenic mice used to ablate Nkx2.1-derived or only NG2+ cells. The values (mean ± SEM) corresponding to the number of nodes, the number of branches and the volume of the vascular network per CCi section are given for: (1) Nkx2.1-cre+/Rosa-DTA mice and their corresponding control Nkx2.1-cre-/Rosa-DTA mice, and (2) Cspg4-cre+/Rosa-DTA mice and their corresponding control Cspg4-cre-/Rosa-DTA mice (n=4 each; unpaired Student’s t-test).
| Values (mean ± SEM) for the vascular network per CCi section | |||
|---|---|---|---|
| Genotype | Nodes number | Branches number | Vascular volume * 103 (µm³) |
| Nkx2.1-cre-/Rosa-DTA | 103.44 ± 7.60 | 241.77 ± 14.65 | 20302.06 ± 1290.76 |
| Nkx2.1-cre+/Rosa-DTA | 84.63 ± 6.65 | 207.75 ± 11.56 | 16692.46 ± 879.03 |
| Cspg4-cre-/Rosa-DTA | 135.50 ± 8.60 | 299.50 ± 16.89 | 20361.28 ± 1429.69 |
| Cspg4-cre+/Rosa-DTA | 109.25 ± 6.20 | 250.87 ± 13 | 15921.88 ± 403.44 |
Table 2
Number of erythrocyte clusters and of individual erythrocytes visualized per CCi section in control and transgenic mice used to ablate Nkx2.1-derived or only NG2+ cells. The values (mean ± SEM) corresponding to the number of erythrocyte clusters and the number of individual erythrocytes per CCi are given for: (1) Nkx2.1-cre+/Rosa-DTA mice and their corresponding control Nkx2.1-cre-/Rosa-DTA mice, and (2) Cspg4-cre+/Rosa-DTA mice and their corresponding control Cspg4-cre-/Rosa-DTA mice (n=5 each; unpaired Student’s t-test).
| Values (mean ± SEM) per CCi section | ||
|---|---|---|
| Genotype | Number of erythrocyte clusters per CCi section | Number of individual erythrocytes per CCi section |
| Nkx2.1-cre-/Rosa-DTA | 6.60 ± 0.88 | 302.33 ± 19.12 |
| Nkx2.1-cre+/RosaDTA | 13.00 ± 2.62 | 273.42 ± 41.44 |
| Cspg4-cre-/Rosa-DTA | 5.83 ± 0.62 | 397.80 ± 18.96 |
| Cspg4-cre+/Rosa-DTA | 14.95 ± 1.77 | 447.30 ± 22.91 |
Download links
A two-part list of links to download the article, or parts of the article, in various formats.
Downloads (link to download the article as PDF)
Open citations (links to open the citations from this article in various online reference manager services)
Cite this article (links to download the citations from this article in formats compatible with various reference manager tools)
NG2 glia are required for vessel network formation during embryonic development
eLife 4:e09102.
https://doi.org/10.7554/eLife.09102


