Snf1/AMPK promotes the formation of Kog1/Raptor-bodies to increase the activation threshold of TORC1 in budding yeast
- University of Arizona, United States
Figures
Figure 1 with 5 supplements
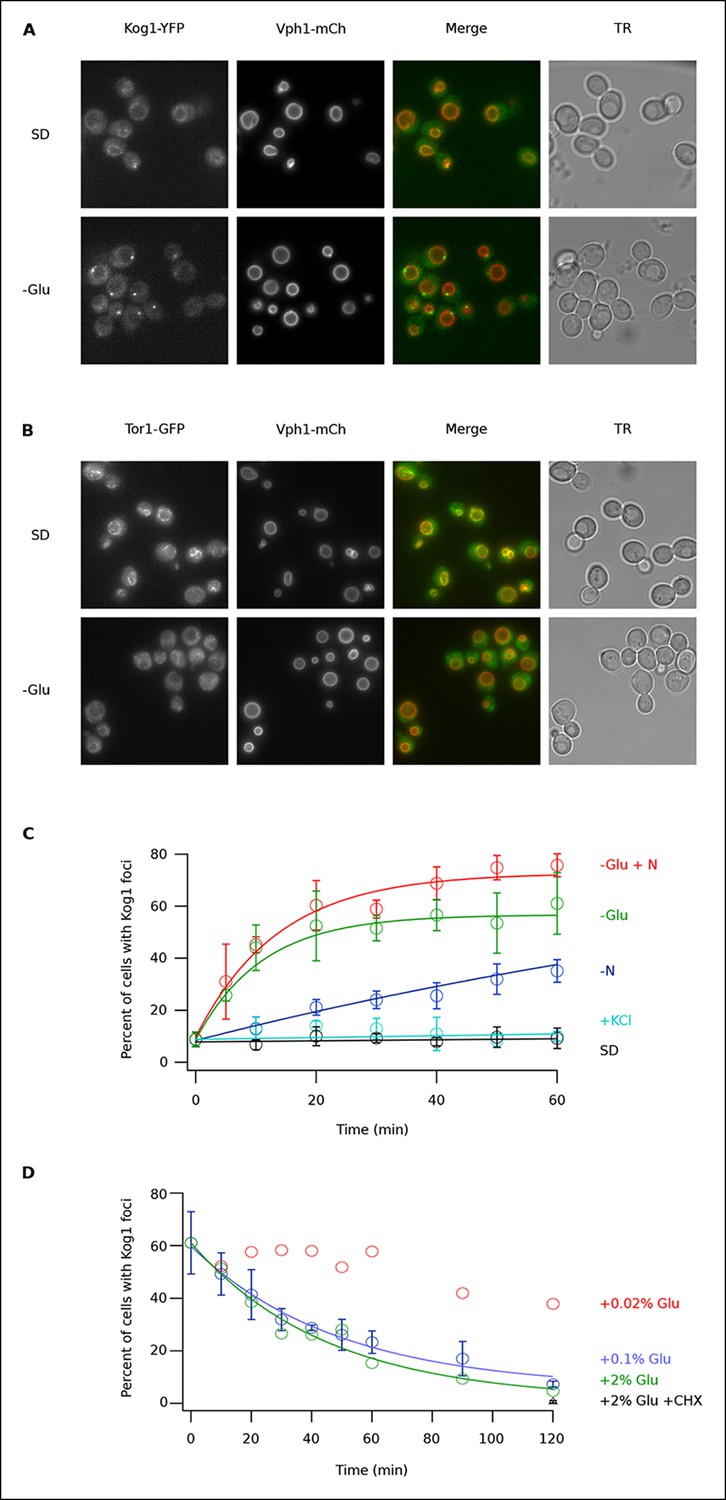
Kog1-YFP moves from the vacuolar membrane to a single body during glucose and nitrogen starvation.
(A) Localization of Kog1-YFP and Vph1-mCherry, before (SD) and after (-Glu) glucose withdrawal (60 min). (B) Localization of Tor1-3xGFP and Vph1-mCherry before (SD) and after (-Glu) glucose withdrawal (60 min). (C) Time-course data showing the fraction of cells that contain Kog1-bodies after transfer to synthetic medium with 2% glucose (SD), SD + 0.4 M KCl (+ KCl), SD -glucose (-Glu), SD-glucose and nitrogen (-Glu + N), and SD-nitrogen (-N) medium. Each time-point shows the average and standard deviation from three independent experiments (performed on different days with >200 cells per time-point, per replicate). Solid lines show the best fit to a single exponential equation (-Glu, -N, and –Glu + N) or a line (SD and + KCl). (D) Time-course data showing the fraction of cells that contain Kog1-bodies after adding glucose, or glucose and cycloheximide (0.02% Glu, 0.1% Glu, 2% Glu or 2% Glu + 100 ug/ml cycloheximide) back to cells that have been in SD–glucose for 60 min. Each datapoint in 0.1% glucose and 2% + 100 ug/ml cycloheximide shows the average and standard deviation from three independent experiments (performed on different days with >200 cells per time-point, per replicate). The solid lines show the best fit to a single exponential equation.
Figure 1—figure supplement 1
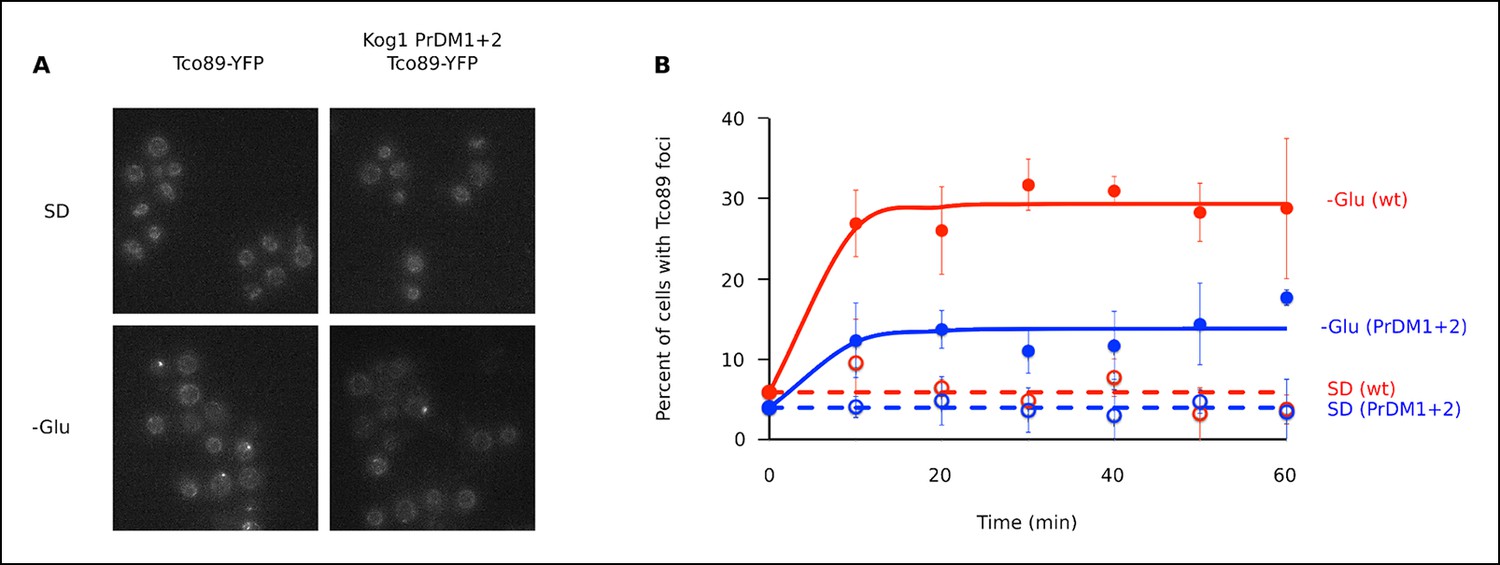
The TORC1 component Tco89 associates with Kog1-bodies.
(A) Localization of Tco89-YFP in wild type and Kog1 PrDM1 + 2 backgrounds before (SD) and after (-Glu) glucose withdrawal (60 min). (B) Time-course data showing the fraction of cells with Tco89 foci after transfer to synthetic medium with 2% glucose (SD) and SD -glucose (-Glu). Each time-point shows the average and standard deviation from three independent experiments (performed on different days with >200 cells per time-point, per replicate). Solid lines show the best fit to a single exponential equation (-Glu) or a line (SD).
Figure 1—figure supplement 2
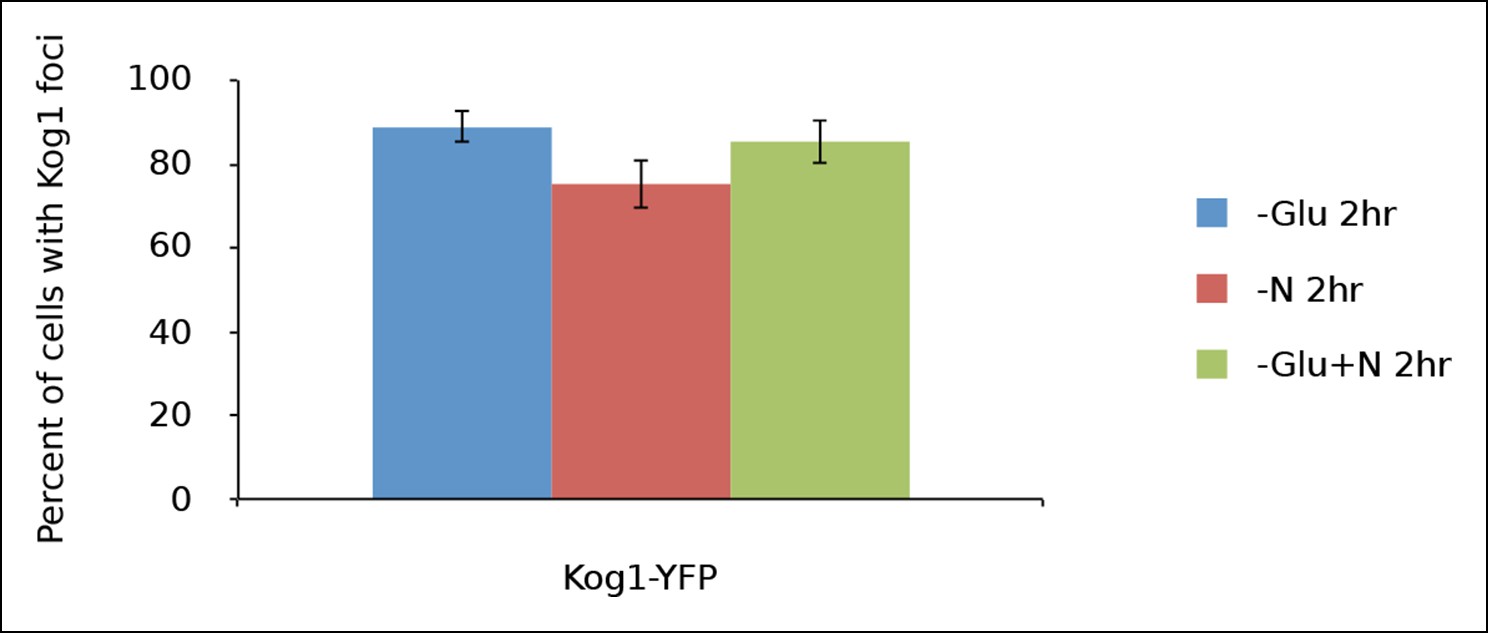
Kog1-body formation is pervasive during extended periods of nutrient starvation.
Mean and standard deviation of two independent experiments is shown.
Figure 1—figure supplement 3
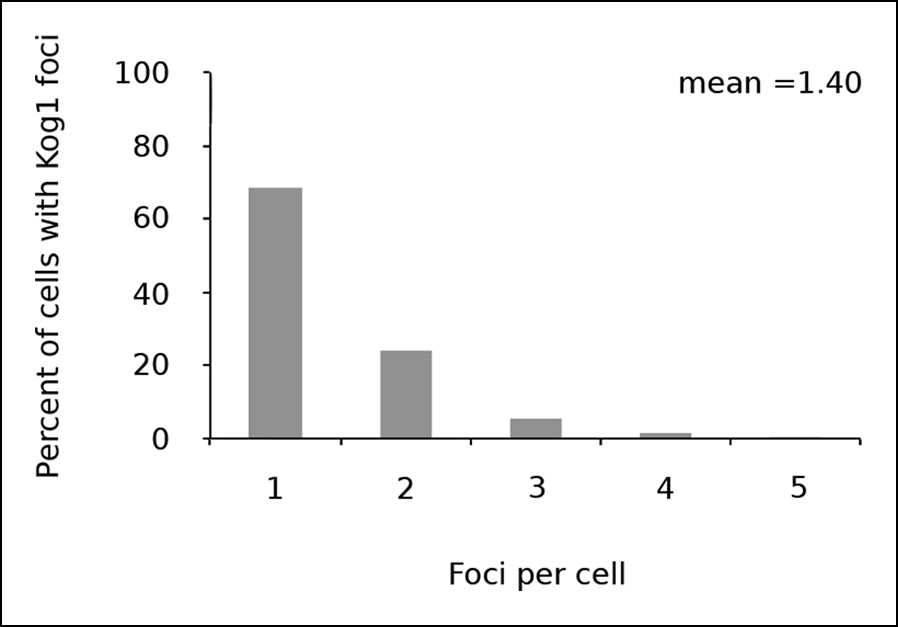
Kog1 forms one body per cell.
Frequency distribution of Kog1-YFP foci, among cells containing bodies, after 60 min glucose starvation.
Figure 1—figure supplement 4
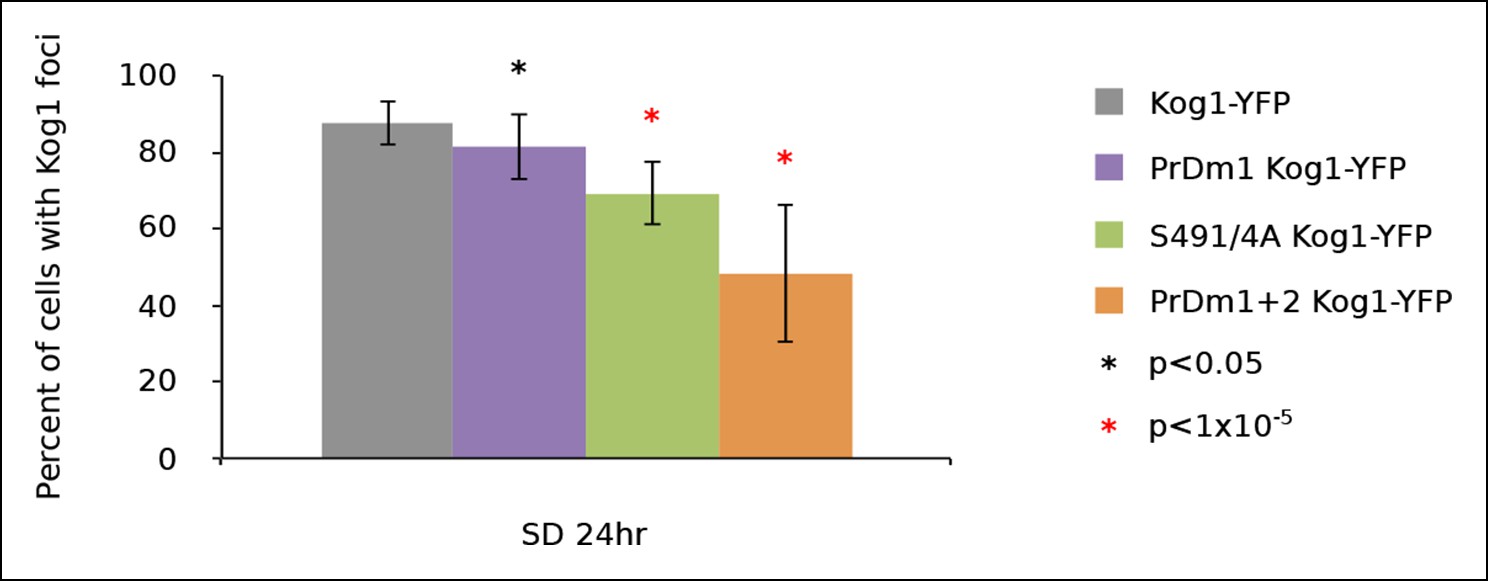
Kog1-body formation is pervasive following exit of exponential growth.
Cultures of Kog1-YFP wildtype, Kog1S491/4A PrDm1 mutant, and PrDm1 + 2 mutant were grown for 24hrs to saturation in synthetic media containing 2% glucose (SD). Mean and standard deviation of three independent experiments is shown.
Figure 1—figure supplement 5
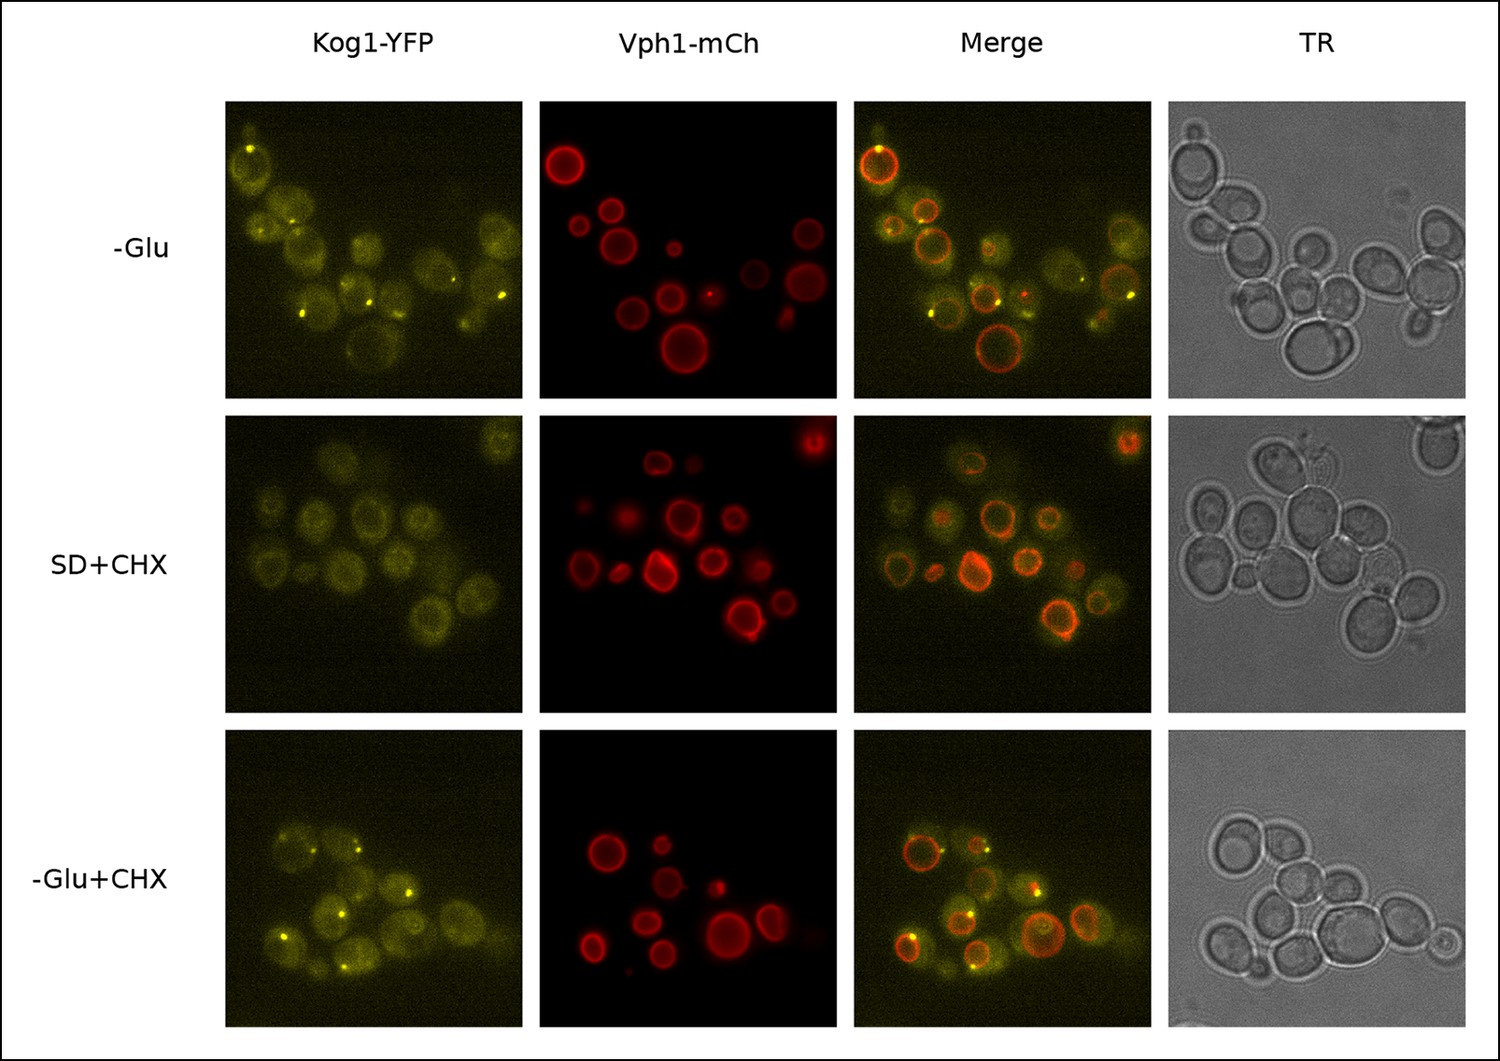
Kog1-YFP dissociates from perivacuolar bodies and relocalizes to the vacuolar membrane upon glucose repletion.
Localization of Kog1-YFP in cells co-expressing the vacuolar membrane marker Vph1-mCherry after 60 min of glucose starvation followed by; 60 min of glucose starvation (-Glu); 60 min of glucose repletion and 100 ug/ml cycloheximide treatment (SD + CHX); 60 min of glucose starvation and 100 ug/ml cycloheximide treatment (-Glu + CHX). Addition of cycloheximide alone, a TORC1 activator, does not restore Kog1 localization to the vacuolar membrane indicating glucose specific signals are required for the dissociation of glucose starvation induced Kog1 bodies (-Glu + CHX).
Figure 2
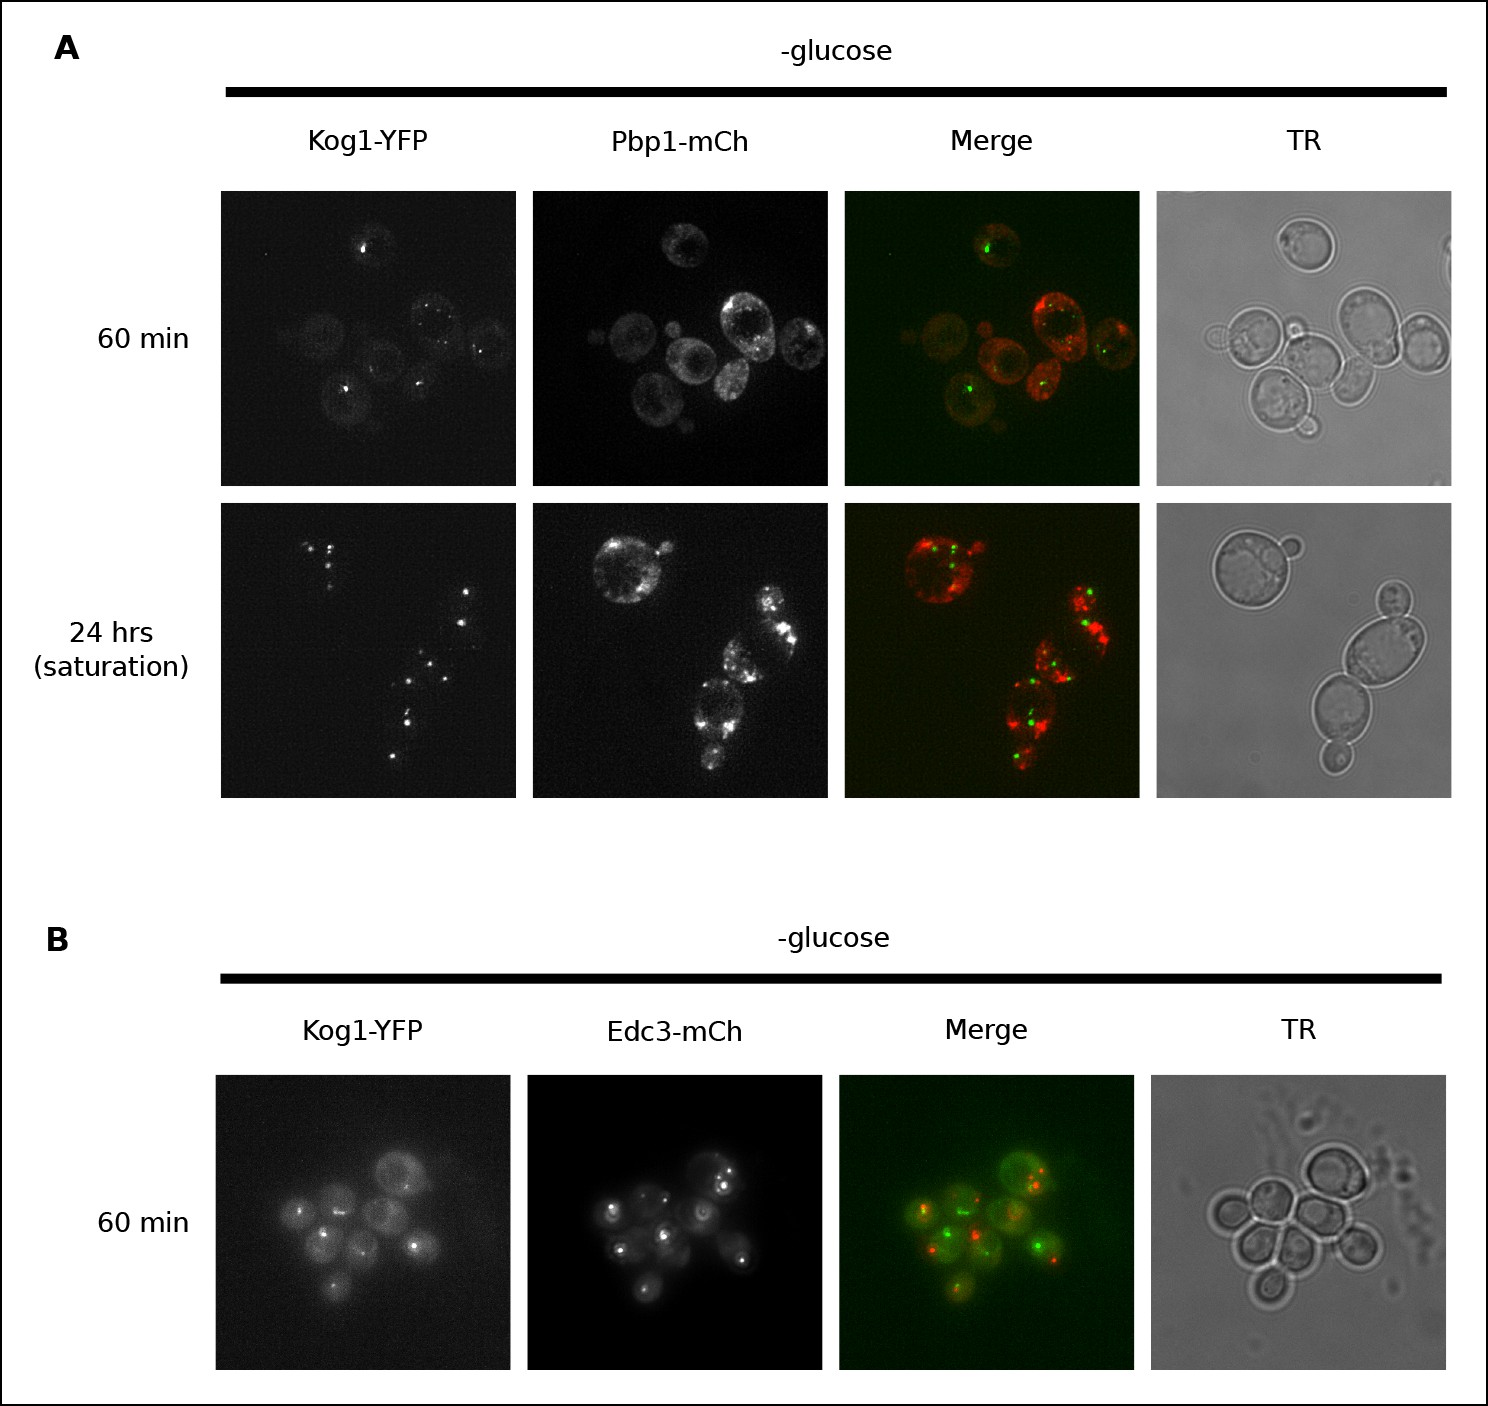
Kog1-YFP does not associate with stress granules or P-bodies in glucose starvation conditions.
(A) Localization of Kog1-YFP after 60 min or 24 hrs of glucose starvation in cells expressing the stress granule marker Pbp1-mCherry. (B) Localization of Kog1-YFP after 60 min of glucose starvation in cells expressing the P-Body marker Edc3-mCherry. The images in (A) were deconvolved using Deltavision software to ensure we could distinguish Pbp1 granules from cytoplasmic Pbp1.
Figure 3 with 3 supplements

Snf1 Dependent Phosphorylation of Kog1 drives Kog1-body formation.
(A-––B) Time-course data showing the fraction of (A) snf1Δ and (B) Kog1S491A/S494A cells that contain Kog1-bodies in SD medium (2% Glu) and at various time-points after glucose withdrawal (0% Glu). The blue points show the average and standard deviation from three independent experiments (performed on different days with >200 cells per time-point, per replicate), while the blue lines show the best fit to a single exponential equation (0% Glu) or a line (2% Glu). The green and orange lines show the best fit to the wild-type data (from Figure 1C) for comparison.
Figure 3—figure supplement 1
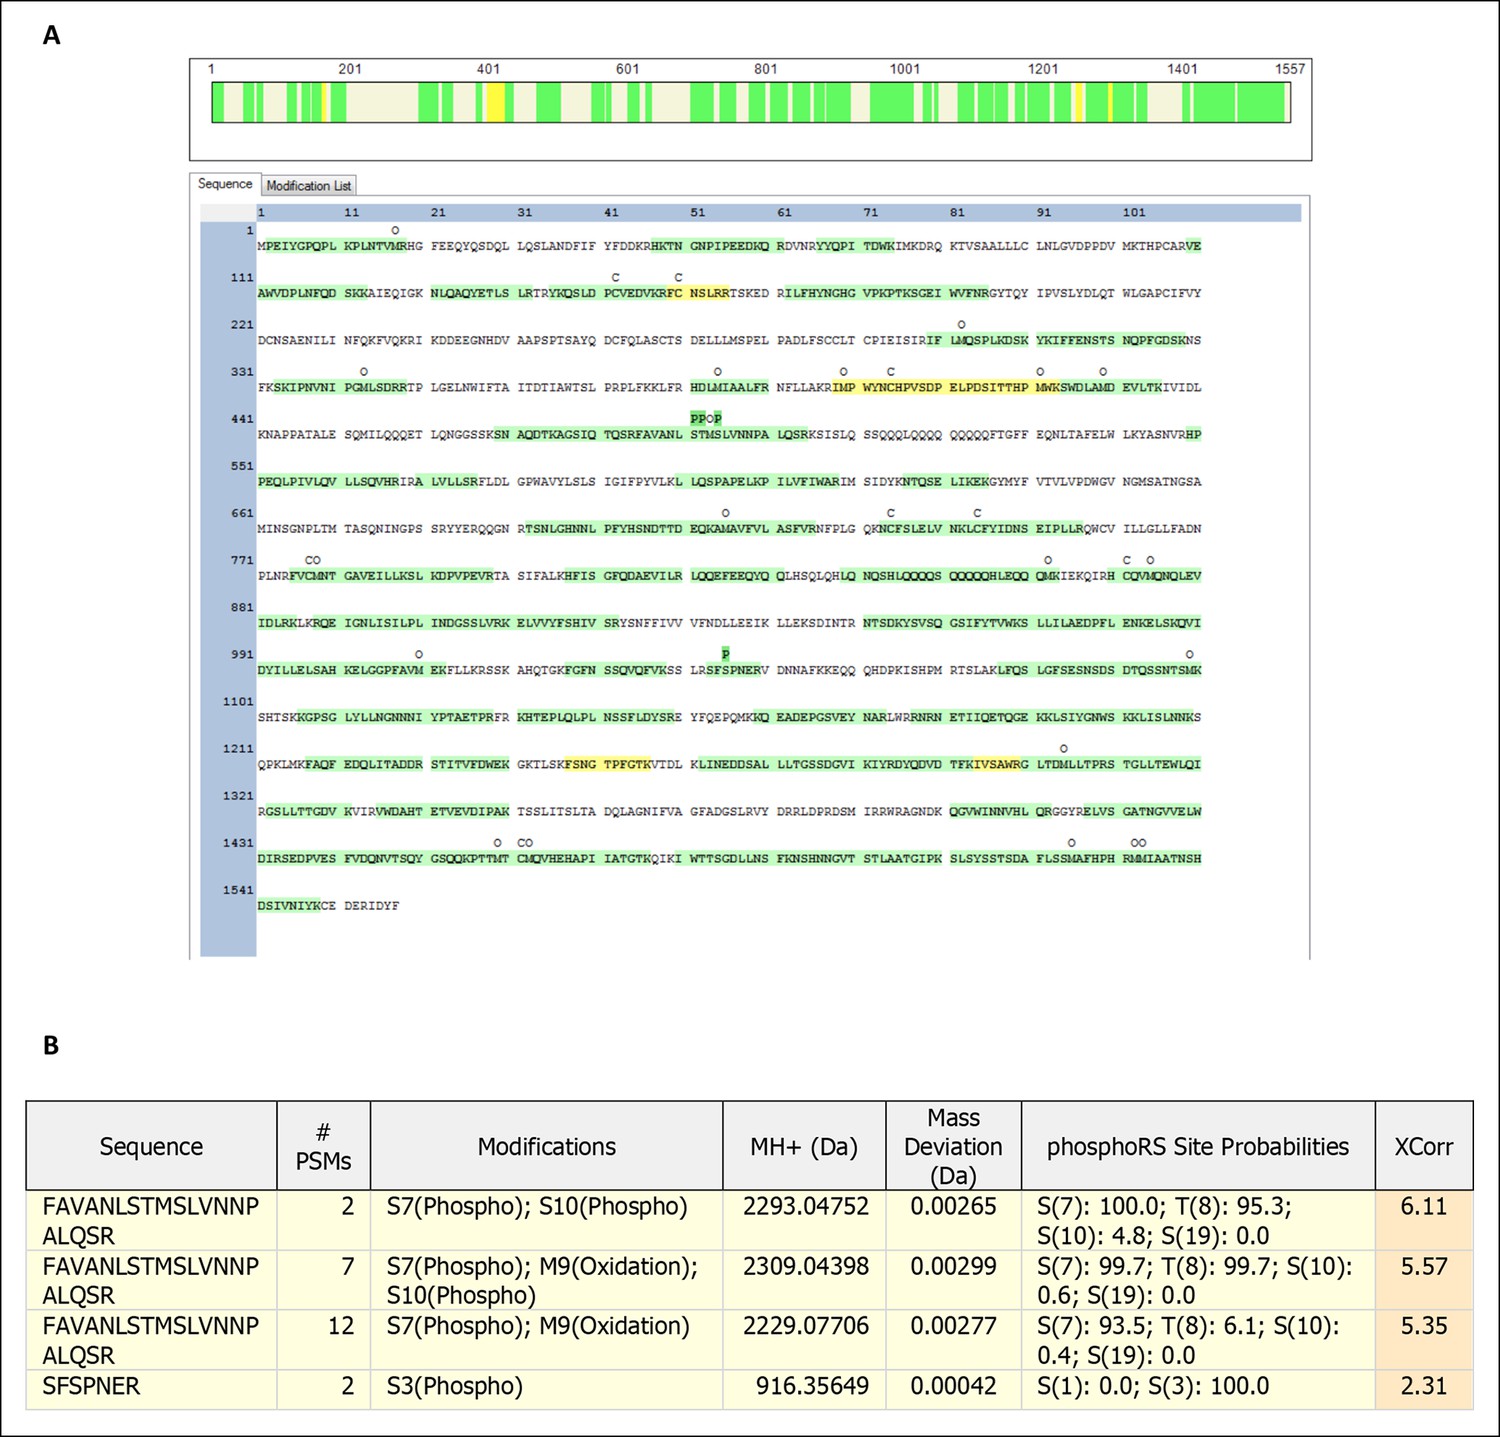
Mass spectrometry generated peptide map for Kog1.
Trypsin digested and trypsin-thermolysin digested Kog1 purified from glucose staved cells were subjected to mass spectrometry-based peptide mapping. (A) Amino acid sequence colored in green have a FDR of 1% or less, sequence colored in yellow have a FDR of 5% or less, and uncolored sequence were not identified in the experiment. Labels of “‘C’ above the amino acid sequence show locations of carbamidomethyl modification (a result of chemical alkylation directed at cysteines during sample preparation), ‘O’ above the amino acid sequence show locations of oxidation (spontaneous oxidation of methionine), and ‘P’ above the amino acid sequence show locations of phosphorylation. The green coloring of the ‘P’ labels represents the site localization probability for phosphorylation at the site, as determined by PhosphoRS, as greater than 99%. (B) Filtered protein identification results indicating amino acids S491, T492, S494 and S1045 of Kog1 are potentially phosphorylated. Filtering was performed to a 5% false discovery rate.
Figure 3—figure supplement 2

Protein identification result identifying S491 and S494 as sites of phosphorylation.
Liquid chromatography coupled to tandem mass spectrometry (LC-MS/MS) was used to analyze proteolytic digestion products of immunoprecipitation-purified Kog1 from glucose staved cells. The resulting mass spectrometry data were analyzed by the protein database search algorithm SEQUEST-HT to identify mass spectra to peptides. (A) Kog1 peptide 485-FAVANL(pS)TM(pS)LVNNPALQSR-504 showing all theoretical fragment ions for a triply-charged ion species for the peptide. Fragment masses in red and blue indicate b-series ions and y-series ions, respectively, detected in the tandem mass spectrum (shown in panel B). (B) Tandem mass spectrum identifying Kog1 peptide 485-FAVANL(pS)TM(pS)LVNNPALQSR-504. Peaks in red and blue indicate b-series and y-series ions that were matched to the theoretical peptide fragment masses in panel A.
Figure 3—figure supplement 3
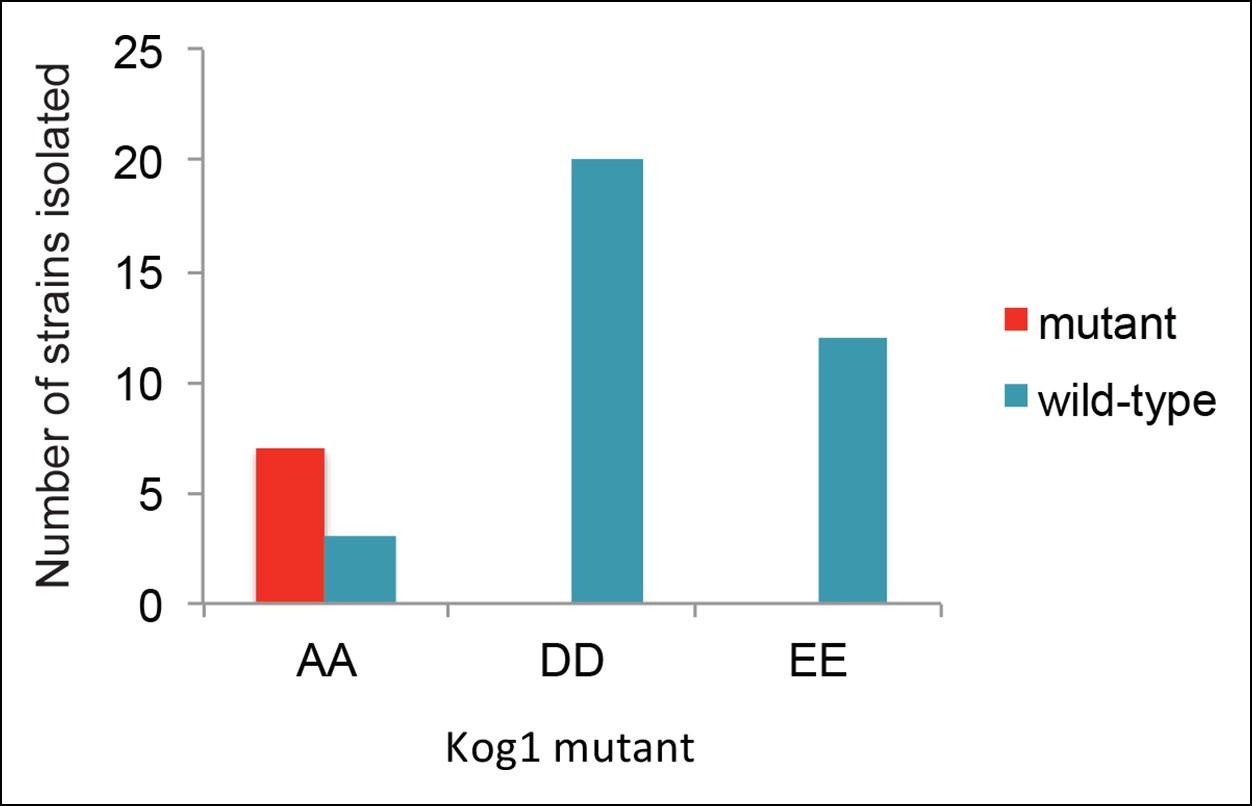
Strains carrying Kog1S491D/S494D and Kog1S491E/S494E at the native loci are inviable.
To create the Kog1 variants Kog1S491A/S494A, Kog1S491D/S494D, and Kog1S491E/S494E we cloned Kog1 (with Ser 491 and 494 mutated to Ala, Asp, or Glu) into a plasmid carrying URA3 under an ADH1 promoter (pRS306). The plasmids were then cut using PflF1, and transformed into a wild type train (ACY044). In all cases this led to insertion of the plasmid at the Kog1 locus, creating a wild-type copy of Kog1, followed by the URA3 gene, followed by a mutant copy of Kog1 (AA, DD, or EE; as confirmed by sequencing). We then isolated colonies that excised the plasmid by selection on 5FOA. In this final step, we expected to find colonies that retain the wild-type copy of Kog1 as well as colonies that retain the mutated copy of Kog1 (depending on the site of recombination during the loop out event). In line with our expectations, we found 7/10 of the colonies created by looping in, and looping out, Kog1S491A/S494A had the AA mutation (the other 3 were wild-type). In contrast, we found 0/20 colonies had the DD mutation and 0/12 strains had the EE mutation. Specifically, we can calculate the probability of finding 0/20 DD and 0/12 EE mutations by chance, given that we found 7/10 AA mutations, at p<0.0001 and p<0.001, respectively, using Fisher’s exact test. The probability of finding 0/32 DD and EE mutants by chance, given that we found 7/10 AA mutants, is less than 1 x 10-–5. This strongly suggests that strains carrying Kog1 with phosphomimetic substitutions at Ser 491 and 494 are inviable.
Figure 4
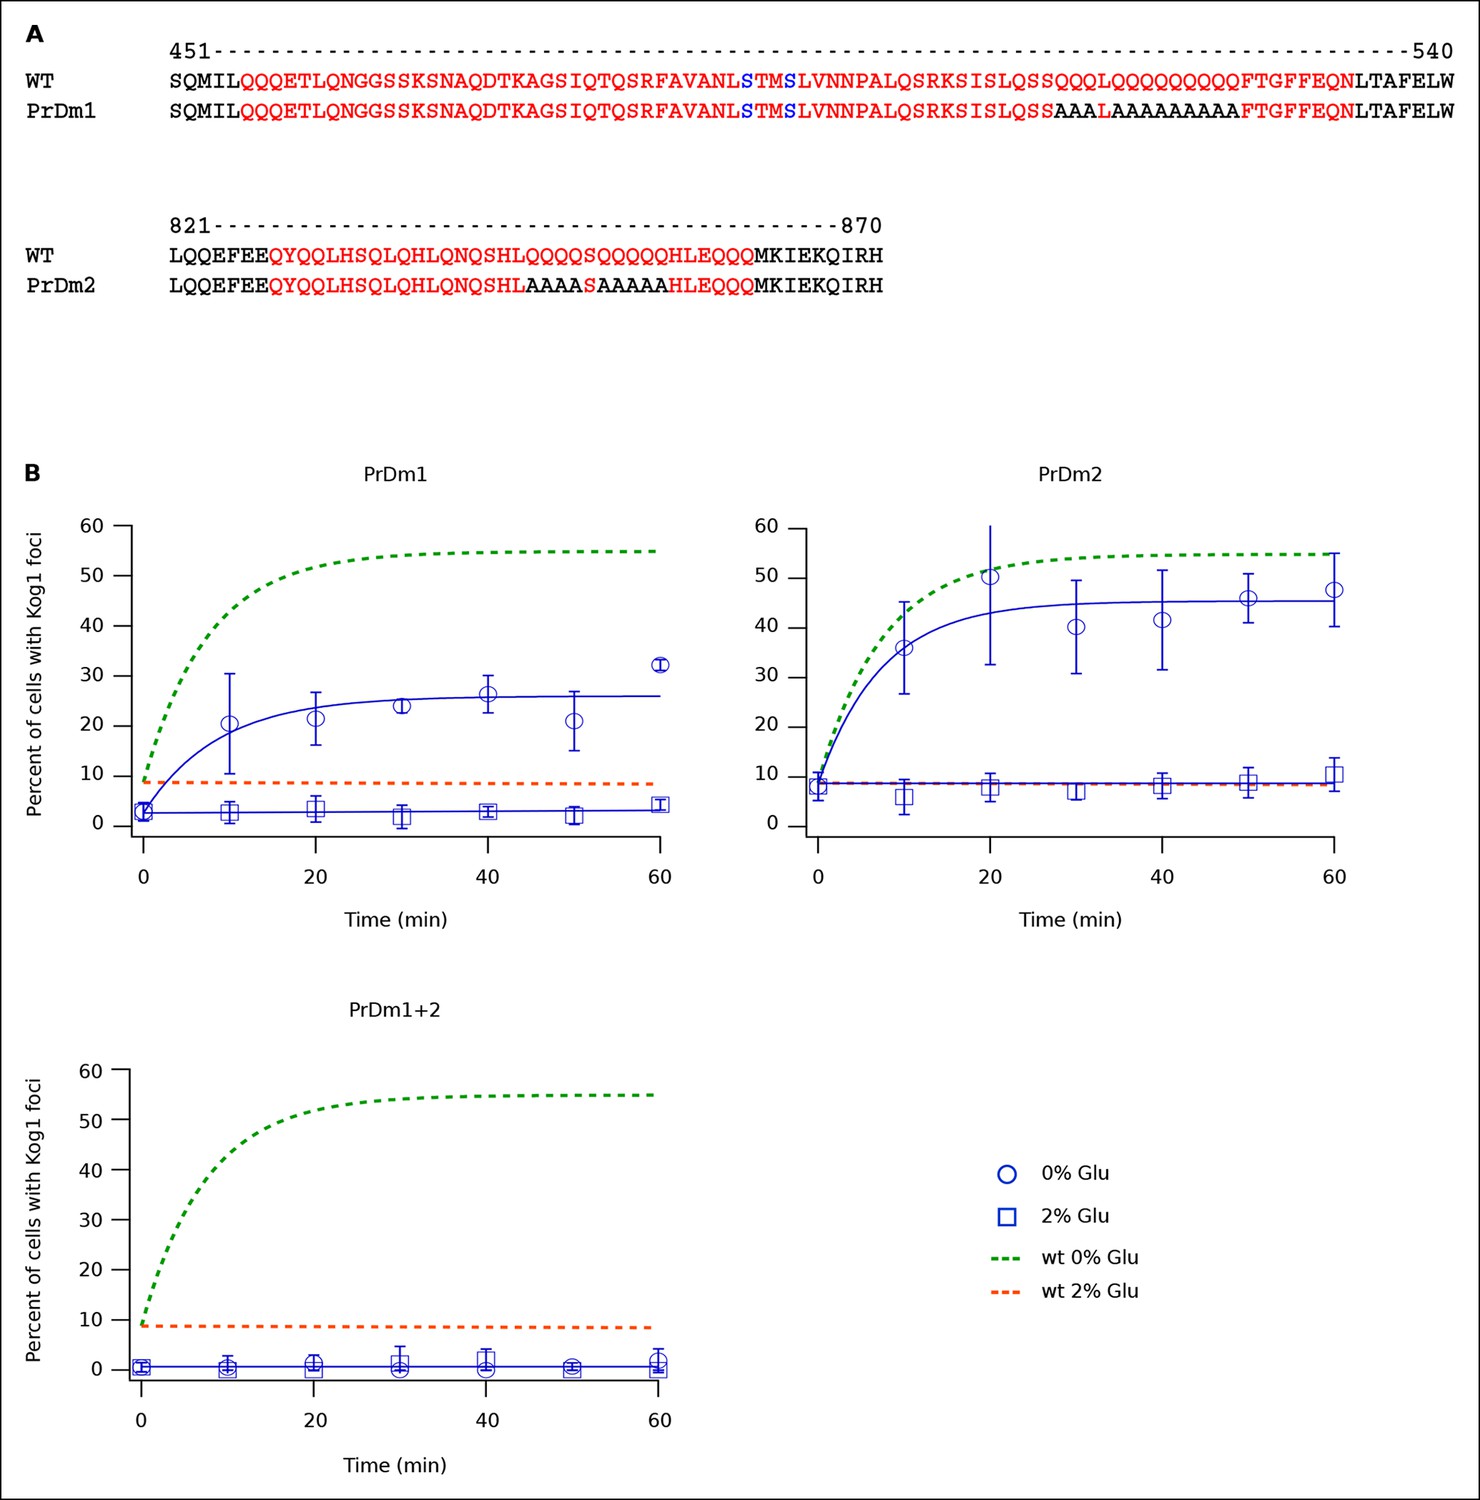
Kog1-body Formation Depends on Prion-Like Domains in Kog1.
(A) Sequence of two prion-like motifs in Kog1 (red letters) as defined by Alberti and coworkers (Alberti et al., 2009). The Snf1 dependent phosphorylation sites at Ser 491 and Ser 494 are shown in blue. (B) Time-course data showing the fraction of cells carrying Prion Domain mutation 1 (PrDm1), Prion Domain mutation 2 (PrDm2), or both mutations (PrDm1 + 2), that have Kog1-bodies in SD medium (0% Glu), and after glucose withdrawal (2% Glu). The blue points show the average and standard deviation from three independent experiments (performed on different days with >200 cells per time-point, per replicate) while the blue lines show the best fit of each dataset to a single exponential equation (0% Glu for PrDm1 and PrDm2) or a line. The green and orange lines show the best fit to the wild-type data (from Figure 1C) for comparison.
Figure 5 with 2 supplements
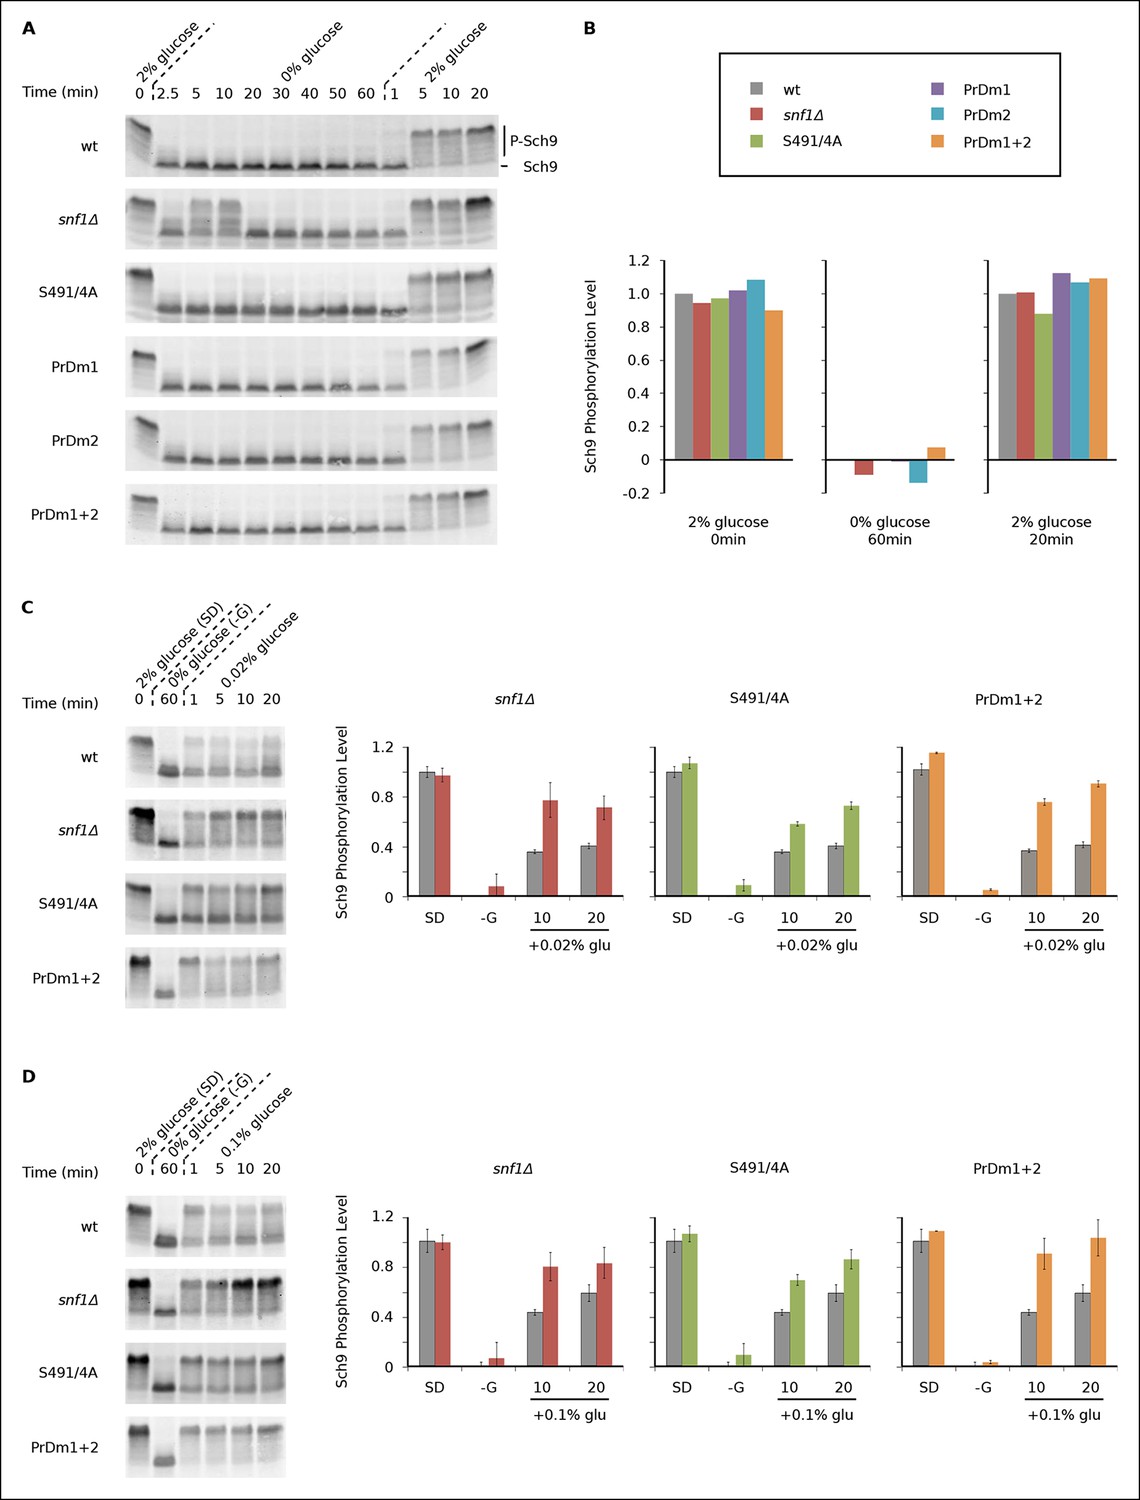
Impact of Kog1-bodies on TORC1 Signaling.
(A) Bandshift assays measuring Sch9 phosphorylation in SD medium (0 min; 2% glucose), at various time-points after glucose withdrawal (2.5-–60min; 0% glucose), and then at various time-points after adding 2% glucose back to the cultures (1, 5, 10, and 20 min; 2% glucose). (B) Quantitation of the band-shift data from (A). The data are normalized to set the wild-type value to 1.0 in 2% glucose, and 0.0 in 0% glucose (see Methods). (C-–D) Sch9 phosphorylation data for wild-type, snf1Δ, Kog1S491A/S494A, and PrDm1 + 2 cells, grown in SD medium (2% glucose), after transfer into synthetic medium - glucose for 60 min (0% glucose), and then at various time-points after adding 0.02% (C) or 0.1% glucose (D) back to the culture. Quantitation in (C) and (D) was performed as described in (B) but here the graphs show the average and standard deviation from three separate experiments. Data for PrDm1 and PrDm2 are shown in Figure 5—figure supplement 1.
Figure 5—figure supplement 1
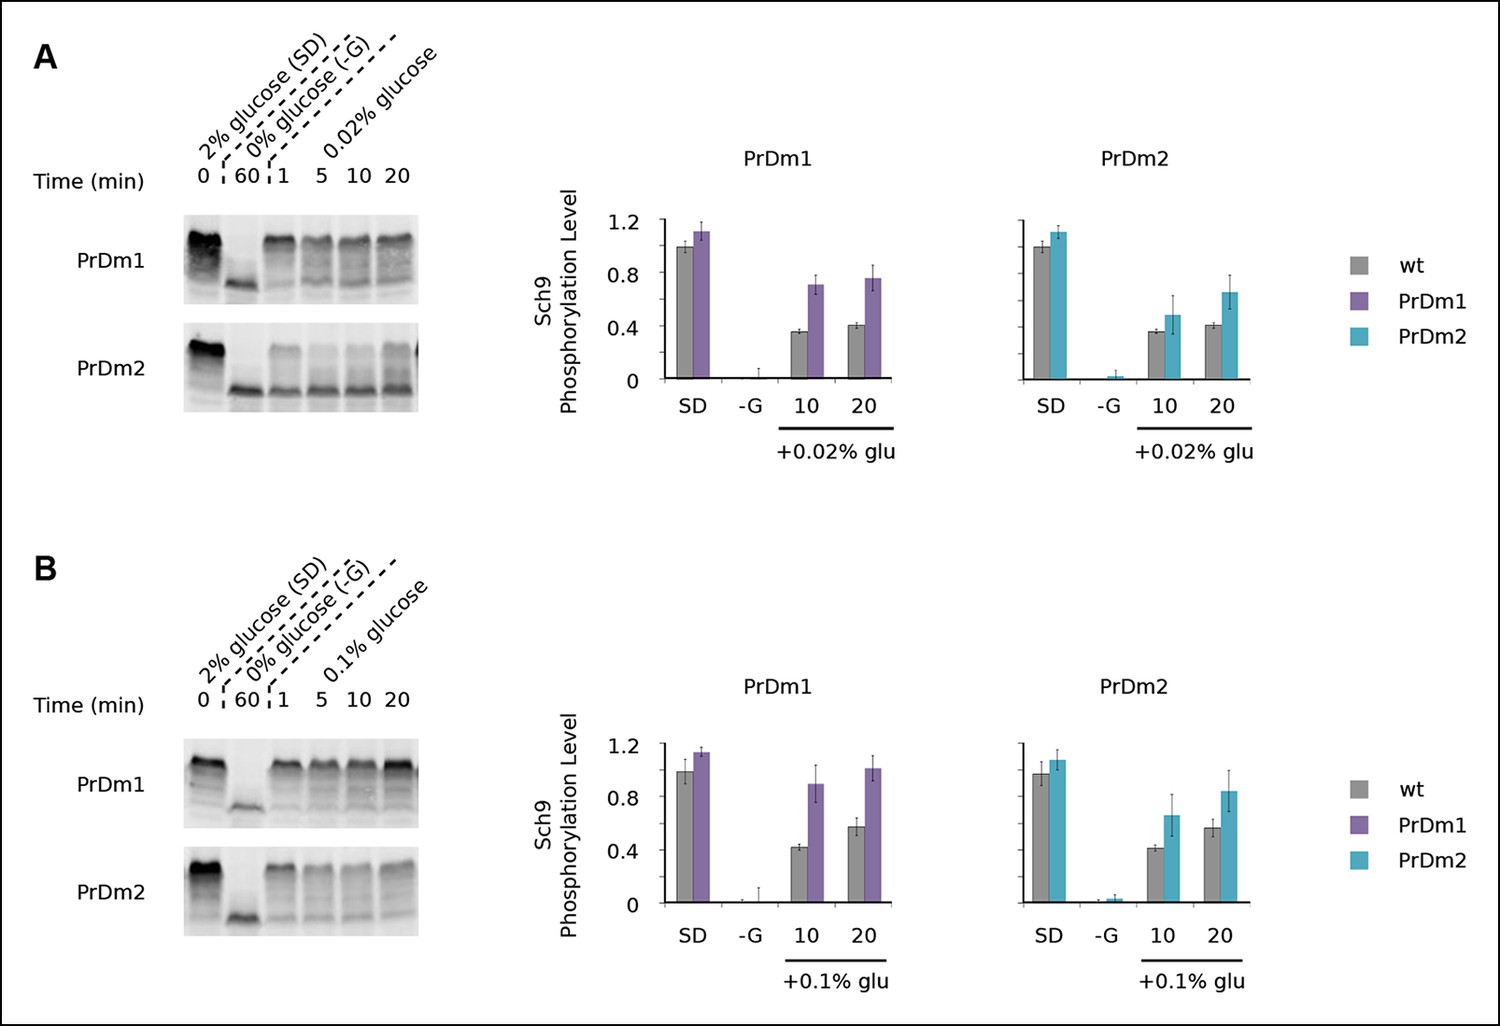
Impact of Kog1-bodies on TORC1 signaling.
Sch9 phosphorylation data for PrDm1 and PrDm2 cells grown in synthetic medium containing 2% glucose (SD; 0min), after transfer into synthetic medium lacking glucose (-G; 60 min), and then at 1, 5, 10, and 20 min time-points after adding back 0.02% (A) or 0.1% (B) glucose. Quantitation of bandshift data, as described in Figure 5, showing the mean and standard deviation from three separate experiments is displayed in the histograms.
Figure 5—figure supplement 2
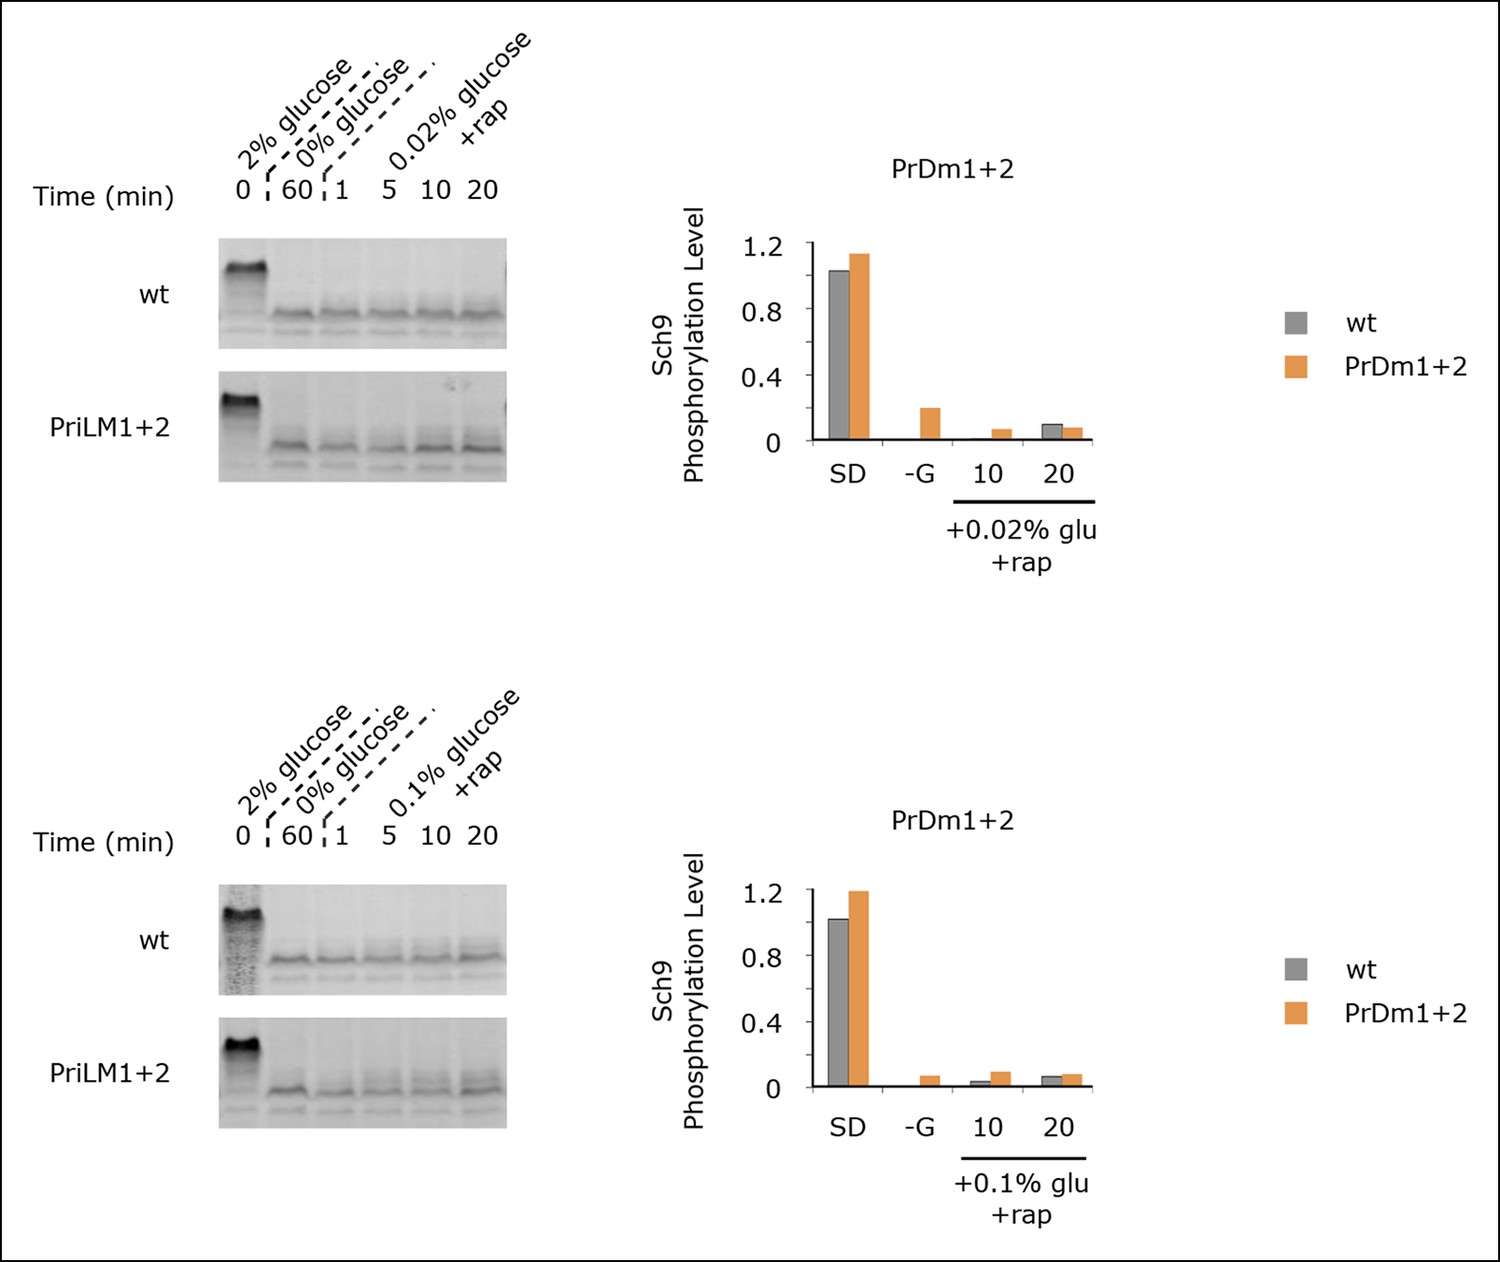
Sch9 reactivation depends upon TORC1 activity.
Sch9 phosphorylation data for wt and PrDm1 + 2 cells grown in synthetic medium containing 2% glucose (SD; 0min), after transfer into synthetic medium lacking glucose (-G; 60 min), and then at 1, 5, 10, and 20 min time-points after adding back 0.02% (A) or 0.1% (B) glucose in the presence of rapamycin (200 ng/ml). Quantitation of bandshift data, as described in Figure 5 is displayed in the histograms.
Figure 6 with 1 supplement

Partial alignment of Kog1 sequences from S. cerevisiae and 22 fungal orthologs.
(A) PriLM1 and (B) PriLM2 (shown in bold) were defined using a hidden Markov Model trained on known yeast prion domains (Alberti et al., 2009). The Glutamine (Q) and Asparagine (N) residues in each PriLM are highlighted in red, while the Snf1 targets sites (Ser 491 and 494) are highlighted in blue. PriLMs 1 and 2 are both insertions between highly conserved domains in Kog1.
Figure 6—figure supplement 1
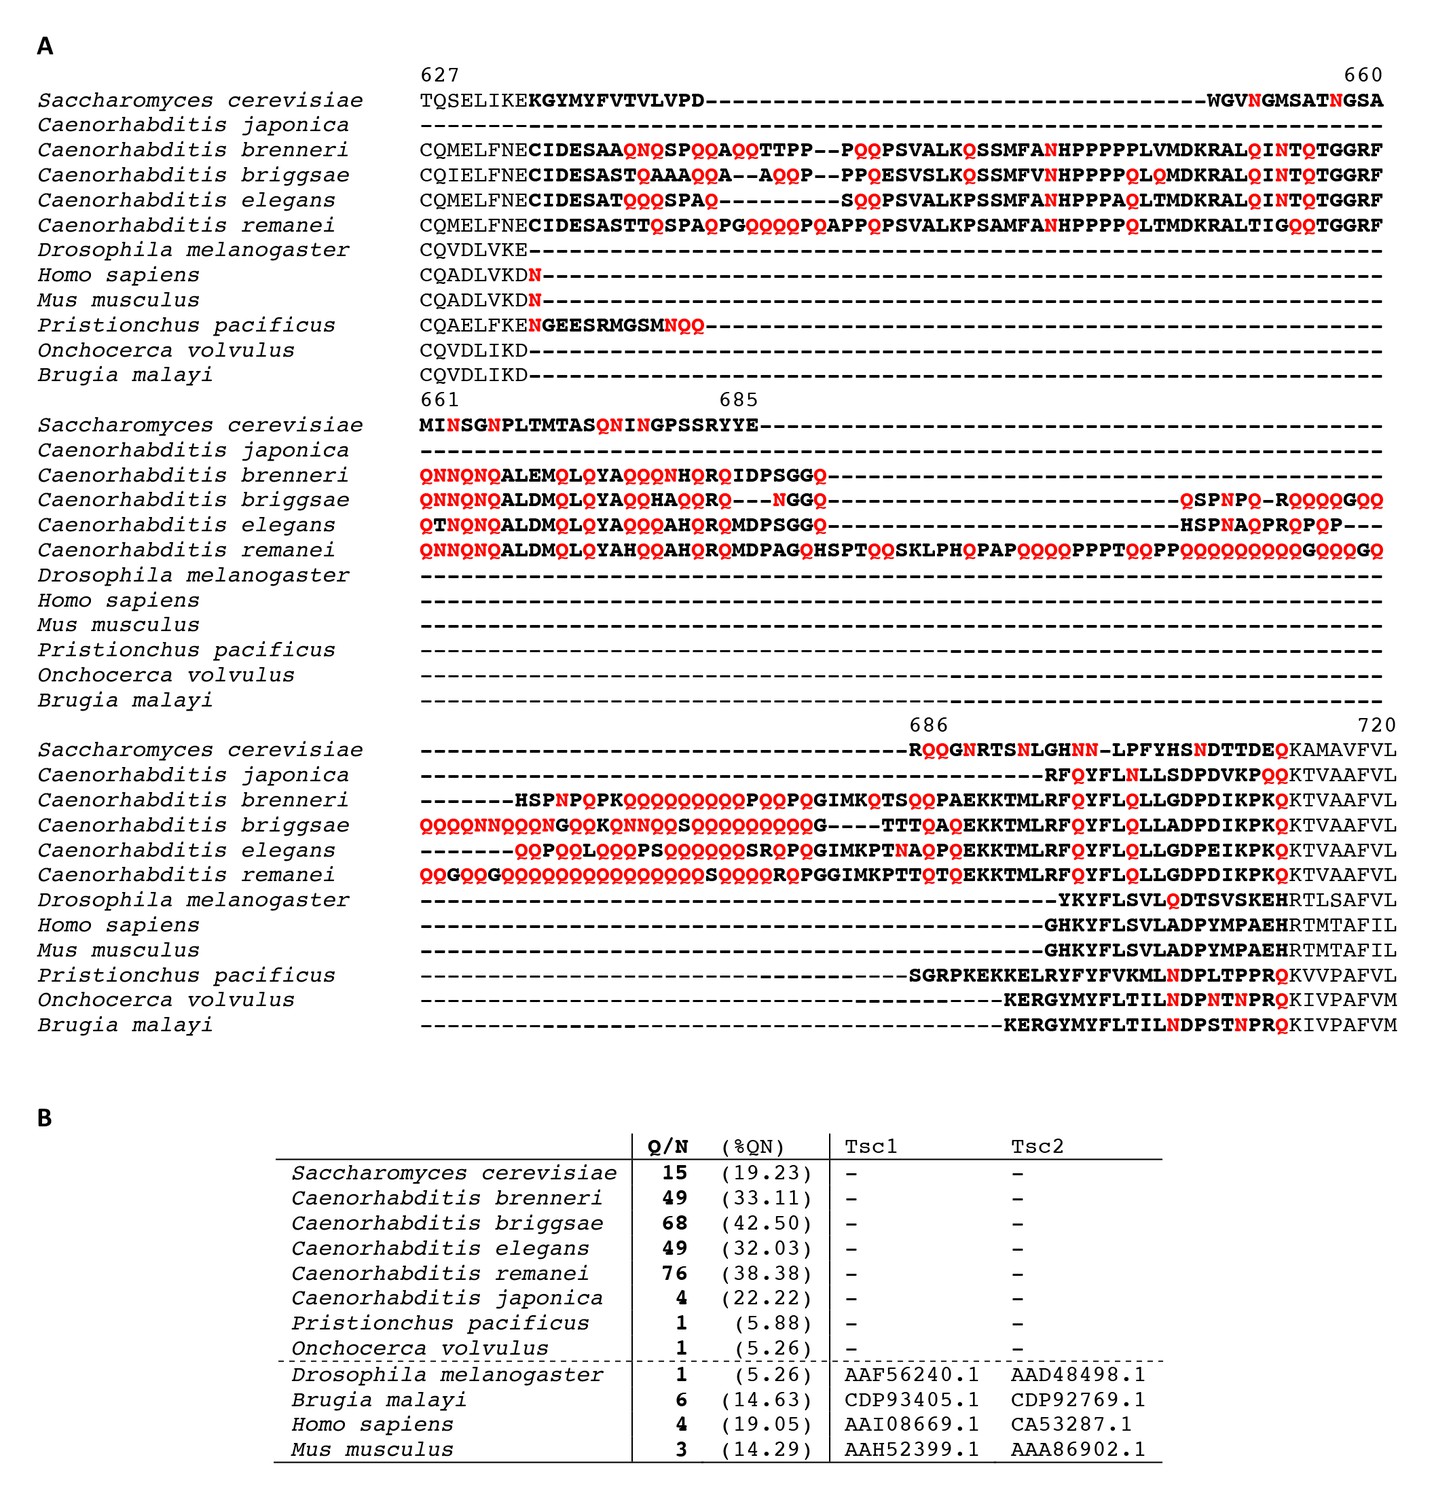
Partial alignment of Kog1 from S. cerevisiae with orthologous genes in higher eukaryotes.
(A) Elegans group nematodes show a loosely conserved expansion of Glutamine (Q) and Asparagine (N) residues in-between conserved domains of Kog1/Raptor. Q and N residues within this region are highlighted in red text. (B) A Glutamine and Asparagine rich domain in Kog1/Raptor is anti-correlated with the presence of Tsc1 and Tsc2 genes (TSC complex) in higher eukaryotes. The table shows the number, and (percent) of Q and N residues within a loosely conserved Q/N rich domain in Kog1/Raptor. Elegans group nematodes, lacking Tsc1 and Tsc2 genes, and the tuberous sclerosis complex (TSC) signaling pathway, carry a Q/N rich domain within the Kog1/Raptor ortholog daf-15. Genebank references to Tsc1 and Tsc2 orthologs are provided.
Tables
Table 1
PriLM1 and PriLM2 are anti-correlated with the presence of Tsc1 and Tsc2 genes in fungal genomes. Quantitation, number and (percentage), of Glutamine (Q) and Asparagine (N) residues within PriLM1 and PriLM2 domains of Kog1 and othologs (Figure 6) reveals three clusters of hosts. (1) Species carrying Q/N rich PriLM1 and PriLM2 domains lack both Tsc1 and Tsc2 genes and the tuberous sclerosis complex (TSC) signaling pathway but show conservation of S491/494 phosphorylation motif. (2) Species carrying PriLM1 of intermediate Q/N richness lack Tsc1 but carry the Tsc2 gene. The influence on TSC pathway signaling is unclear. (3) Species lacking PriLM1 and PriLM2 carry both Tsc1 and Tsc2 genes and an operational TSC signaling pathway. Genbank references to Tsc1 and Tsc2 orthologs are provided.
| PriLM1 | PriLM2 | ||||||
| Q/N | (%QN) | Q/N | (%QN) | Tsc1 | Tsc2 | S491/494 | |
| S. cerevisiae | 28 | (35.90) | 20 | (58.82) | + | ||
| S. kluyveri | 49 | (55.68) | 17 | (65.38) | + | ||
| S. paradoxus | 29 | (36.71) | 20 | (58.82) | + | ||
| S. mikatae | 28 | (36.36) | 20 | (58.82) | + | ||
| S. castellii | 32 | (37.21) | 15 | (55.56) | + | ||
| S. bayanus | 24 | (32.43) | 21 | (60.00) | + | ||
| C. glabrata | 21 | (26.92) | 17 | (50.00) | + | ||
| A. gossypii | 19 | (26.39) | 18 | (56.25) | + | ||
| K. waltii | 24 | (34.29) | 11 | (52.38) | + | ||
| L. elongosporus | 31 | (40.26) | 1 | (16.67) | |||
| K. lactis | 17 | (27.42) | 24 | (63.16) | CAH03101.1 | + | |
| C. parapsilosis | 17 | (27.42) | 0 | (0.00) | CCE43871.1 | ||
| C. lusitaniae | 1 5 | (28.30) | 0 | (0.00) | EEQ40372 | ||
| D. hansenii | 14 | (23.73) | 1 | (50.00) | CAG86052.2 | ||
| C. albicans | 14 | (28.00) | 0 | (0.00) | EAK92235.1 | ||
| C. guilliermondii | 11 | (24.44) | 0 | (0.00) | EDK41275.2 | ||
| C. tropicalis | 11 | (16.42) | 0 | (0.00) | EER32197.1 | ||
| A. nidulans | 3 | (20.00) | 0 | (0.00) | EAA58119.1 | ||
| Y. lipolytica | 3 | (21.43) | 0 | (0.00) | CAG79453.1 | CAG79234.1 | |
| N. crassa | 2 | (13.33) | 0 | (0.00) | ESA42867.1 | ESA42646.1 | |
| S. japonicus | 1 | (6.67) | 0 | (0.00) | EEB05964.1 | EEB09703.2 | |
| S. octosporus | 1 | (6.67) | 0 | (0.00) | EPX4426.1 | EPX71342.1 | |
| S. pombe | 1 | (6.67) | 0 | (0.00) | CAA91078.1 | CAB52735.1 | |
Table 2
S. cerevisiae strains used in this study.
| Strain | Catalogue Number | Description | Source |
| wt | ACY044 | W303 MATa trp1-1 can1-100 leu2-3,112 his3-11,15 ura3 GAL + | Capaldi et al. 2008 |
| Kog1-YFP Vph1-mCh | ACY731 | [ACY044] KOG1-YFP (HIS3) VPH1-mCherry (NAT +) MATa | This Study |
| Tor1-GFP Vph1-mCh | ACY939 | [ACY044] TOR1-D330 3xGFP VPH1-mCherry (NAT +) MATa | This Study |
| Kog1-YFP | ACY173 | [ACY044] KOG1-YFP (HIS3) MATa | This Study |
| Kog1-YFP Pbp1-mCh | ACY959 | [ACY044] KOG1-YFP (HIS3) pPBP1mCH (URA3) MATa | This Study |
| Kog1-YFP Edc3-mCh | ACY856 | [ACY044] KOG1-YFP (HIS3) pEDC3mCH (URA3) MATa | This Study |
| snf1Δ Kog1-YFP | ACY743 | [ACY044] SNF1::URA3 KOG1-YFP (HIS3) MATa | This Study |
| Kog1-3xFlag | ACY161 | [ACY044] KOG1-3xFLAG (HIS3) MATa | This Study |
| S491A S494A Kog1-YFP | ACY871 | [ACY044] KOG1S491A S494A-YFP (HIS3) MATa | This Study |
| PrDm1 Kog1-YFP | ACY844 | [ACY044] KOG1Q513-525A-YFP (HIS3) MATa | This Study |
| PrDm2 Kog1-YFP | ACY768 | [ACY044] KOG1Q846-855A-YFP (HIS3) MATa | This Study |
| PrDm1 + 2 Kog1-YFP | ACY878 | [ACY044] KOG1Q513-525A Q846-855A-YFP (HIS3) MATa | This Study |
| Sch9-3HA | ACY359 | [ACY044] SCH9-3HA (TRP1) MATa | Hughes Hallett et al. 2014 |
| snf1Δ Sch9-3HA | ACY537 | [ACY044] SNF1::URA3 SCH9-3HA (TRP1) MATa | Hughes Hallett et al. 2014 |
| S491A S494A Sch9-3HA | ACY869 | [ACY044] KOG1S491A S494ASCH9-3HA (TRP1) MATa | This Study |
| PrDm1 Sch9-3HA | ACY766 | [ACY044] KOG1Q513-525ASCH9-3HA (TRP1) MATa | This Study |
| PrDm2 Sch9-3HA | ACY840 | [ACY044] KOG1Q846-855ASCH9-3HA (TRP1) MATa | This Study |
| PrDm1 + 2 Sch9-3HA | ACY765 | [ACY044] KOG1Q513-525A Q846-855ASCH9-3HA (TRP1) MATa | This Study |
| Tco89-YFP | ACY171 | [ACY044] Tco89-YFP (HIS3) MATa | This Study |
| PrDM1 + 2 Tco89-YFP | ACY783 | [ACY044] KOG1Q513-525A Q846-855A Tco89-YFP (HIS3) MATa | This Study |
| Plasmid | Catalogue Number | Description | Source |
| pEDC3mCH | ACB252 | [CEN] EDC3-mCherry (URA3) | Buchan et al. 2008 |
| pPBP1mCH | ACB282 | [CEN] PBP1-mCherry (URA3) | Shah et al. 2014 |
Additional files
-
Source code 1
Bandshift Analysis.txt includes the MATLAB script used to quantify the bandshift data in Figure 5.
- https://doi.org/10.7554/eLife.09181.022
Download links
A two-part list of links to download the article, or parts of the article, in various formats.
Downloads (link to download the article as PDF)
Open citations (links to open the citations from this article in various online reference manager services)
Cite this article (links to download the citations from this article in formats compatible with various reference manager tools)
Snf1/AMPK promotes the formation of Kog1/Raptor-bodies to increase the activation threshold of TORC1 in budding yeast
eLife 4:e09181.
https://doi.org/10.7554/eLife.09181


