The splicing regulator PTBP1 controls the activity of the transcription factor Pbx1 during neuronal differentiation
- University of California, Los Angeles, United States
Figures
Figure 1 with 2 supplements
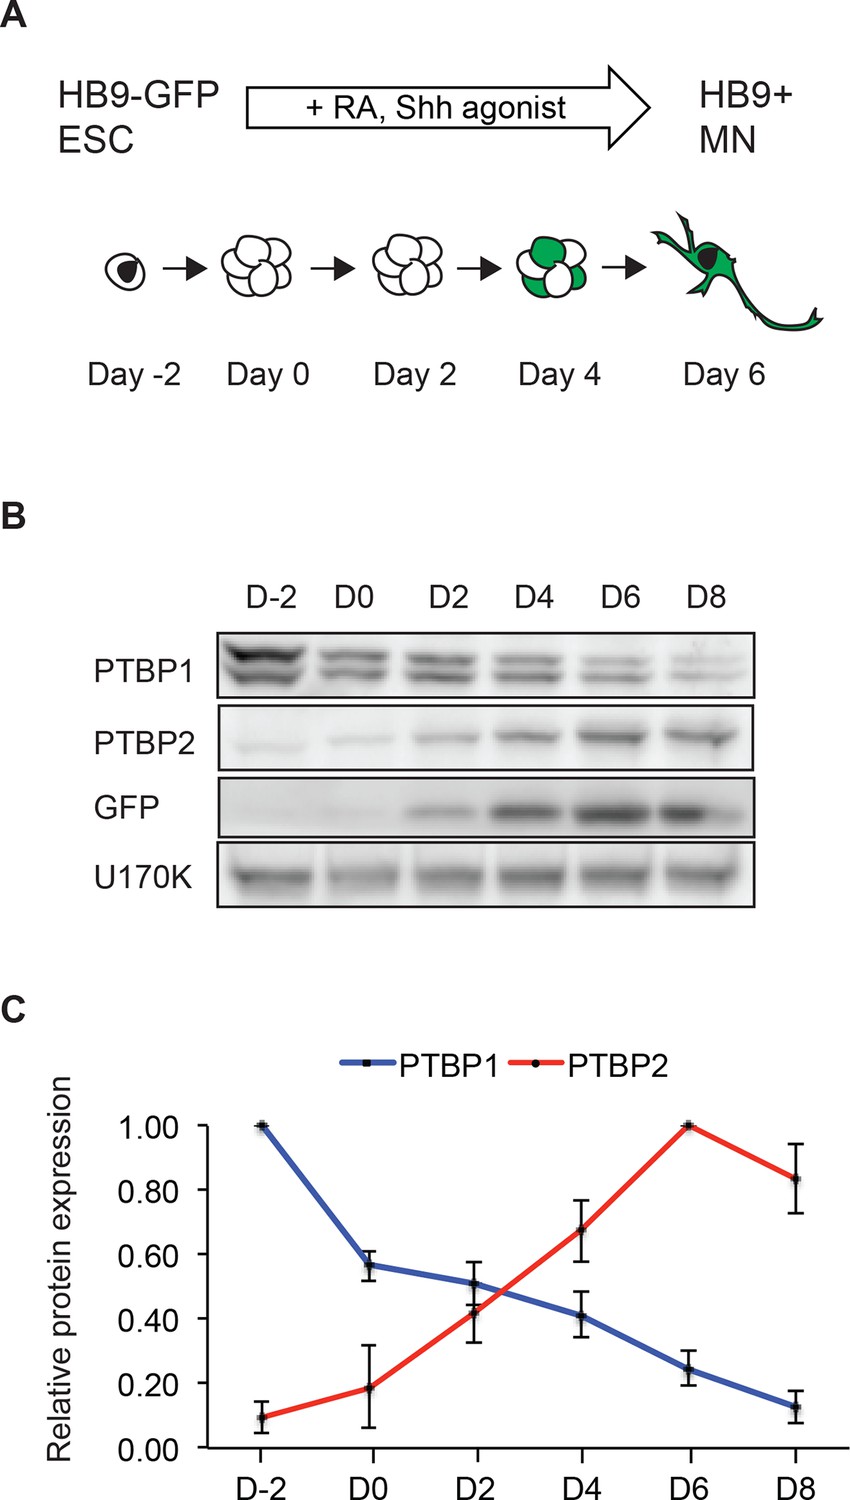
The transition in PTB protein expression occurs during in vitro neuronal differentiation.
(A) HB9-GFP ESCs express eGFP under the MN-specific promoter HB9. The addition of retinoic acid (RA) and a Sonic hedgehog (Shh) agonist drives MN differentiation. (B) Western blot shows the loss of PTBP1 protein and gain of PTBP2 and GFP proteins as ESCs differentiate into HB9+ MNs. U170K served as a loading control. (C) Quantification of relative PTBP1 and PTBP2 protein expression across MN differentiation. Error bars represent standard error of the mean (SEM, n=2).
-
Figure 1—source data 1
Splicing changes identified by RNA-seq during ESC neuronal differentiation.
- https://doi.org/10.7554/eLife.09268.004
Figure 1—figure supplement 1
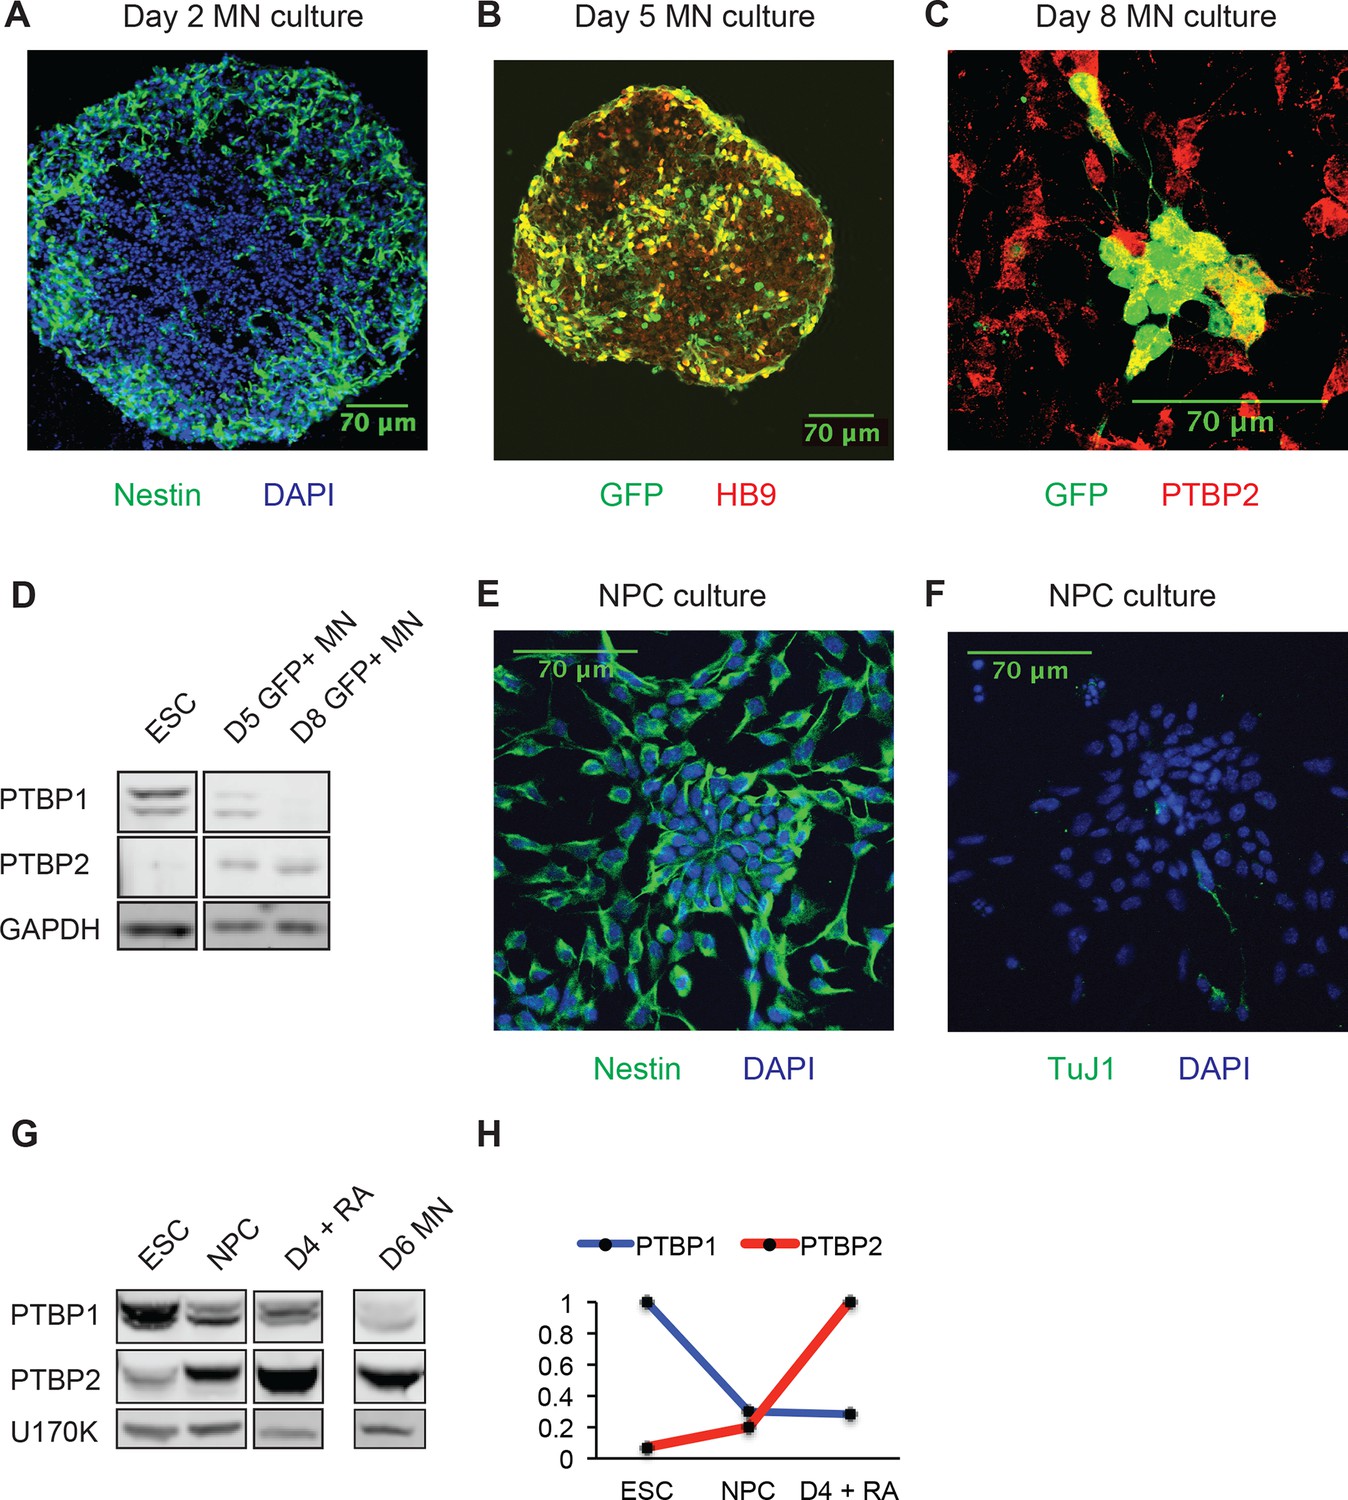
Transitions in PTB protein expression as ESCs differentiate into MNs, NPCs, and neurons.
(A) Day 2 MN cultures express Nestin. (B) Day 5 MN cultures co-express GFP and HB9. (C) Day 8 MN cultures co-express GFP and PTBP2. (D) Western blot of PTBP1 and PTBP2 protein expression in ESCs, sorted Day 5 GFP+ MNs, and sorted Day 8 GFP+ MNs. GAPDH served as a loading control. (E) NPC cultures homogenously express the progenitor marker Nestin, (F) while very few cells express the neuronal marker TuJ1. (G) Western blot and (H) quantification of PTBP1 and PTBP2 as ESCs differentiate into NPCs, Day 4 RA-derived neurons, and Day 6 MN cultures. U170K served as a loading control. Borders of western blots indicate different lanes within the same gel.
Figure 1—figure supplement 2
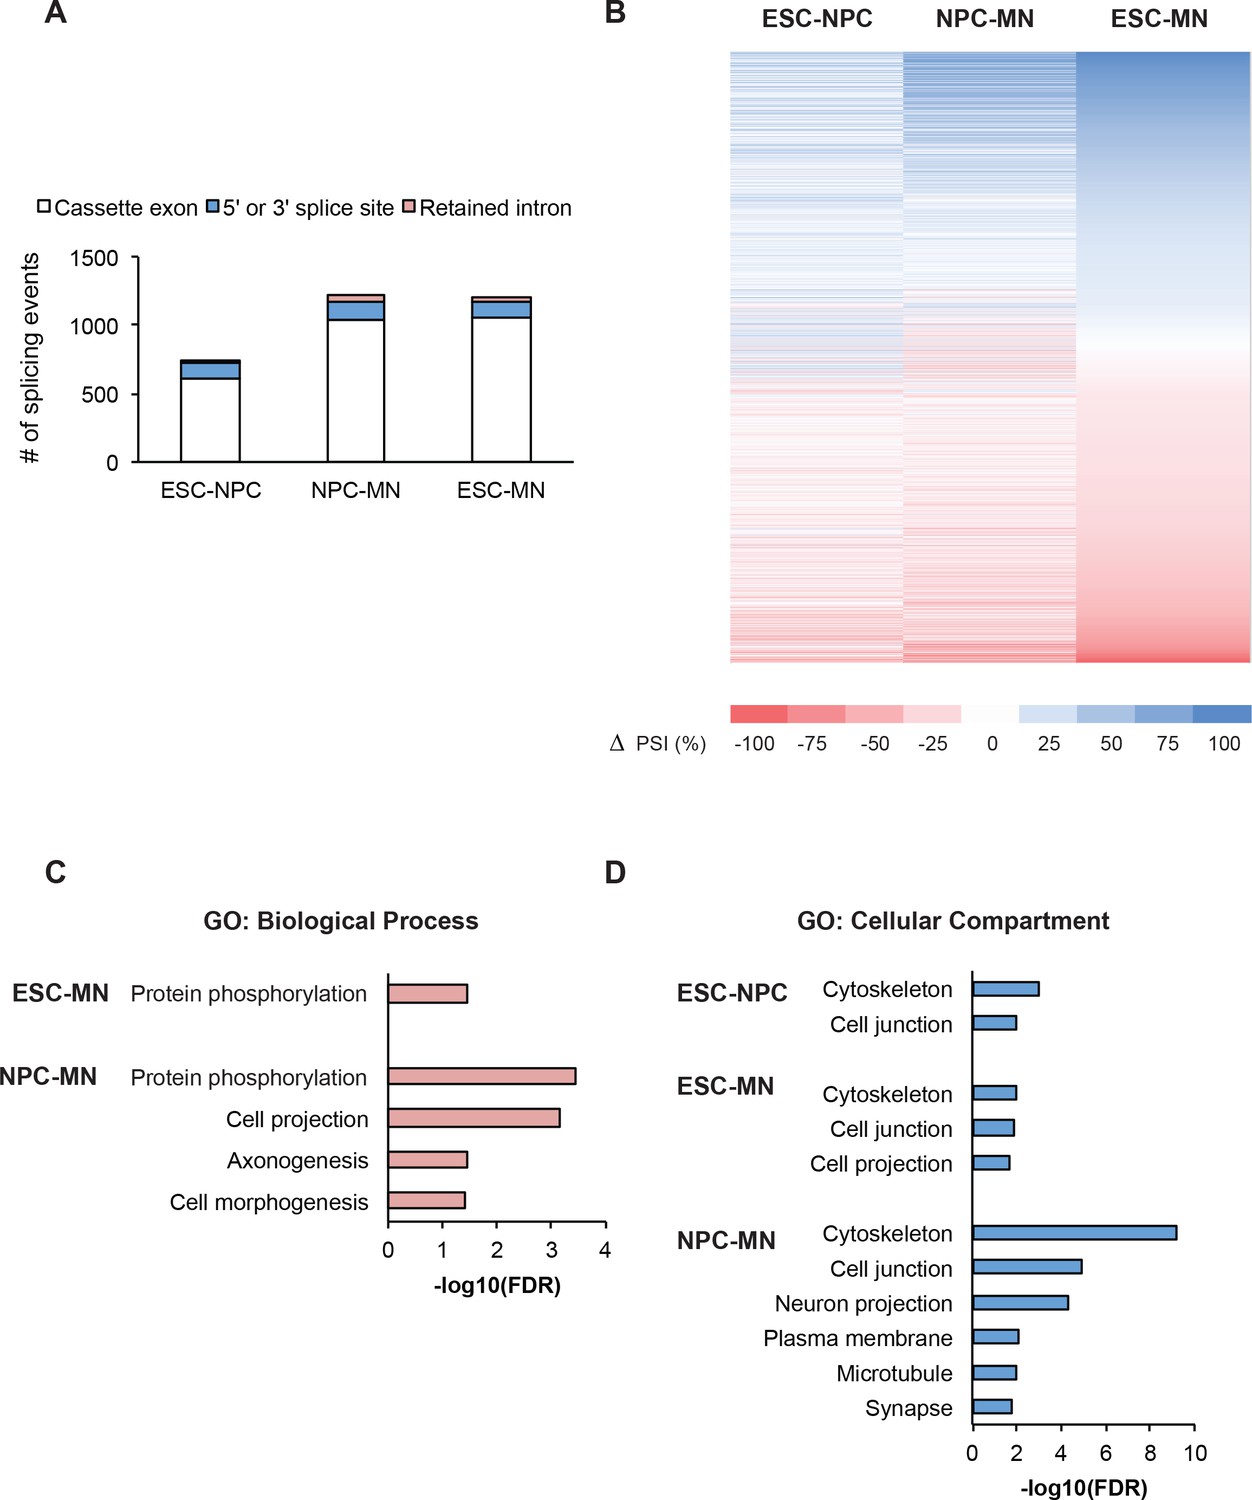
Transitions in alternative splicing occur during neuronal differentiation.
(A) Alternative splicing events in ESCs, NPCs, and GFP+ MNs were quantified using SpliceTrap (Wu et al., 2011). Bar graph and (B) heat map of cassette exons, 5’ and 3’ splice sites, and retained introns whose splicing differs between each sample pair (ΔPSI ≥ 15%) (Figure 1—source data 1). (C, D) Gene ontology analyses of genes showing the differential splice events compared to all expressed genes were performed using DAVID (FDR<0.05) (Huang et al., 2009a).
Figure 2 with 1 supplement
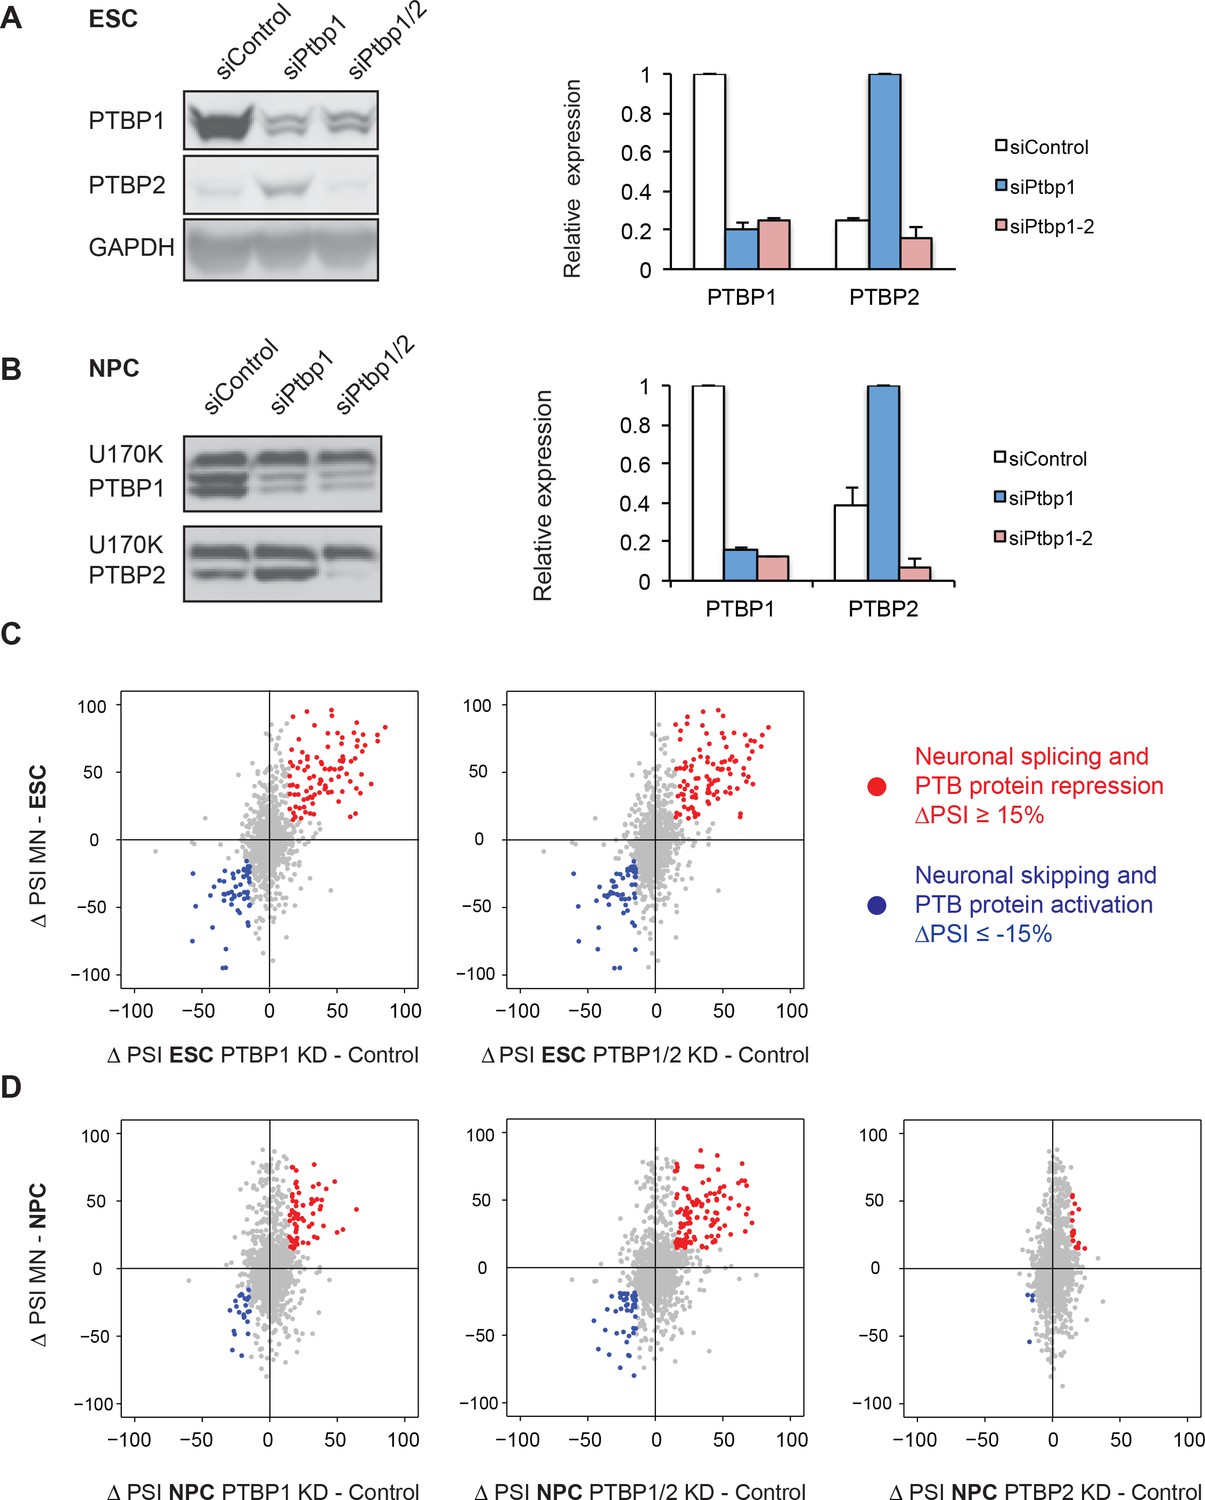
PTBP1 regulates a large set of neuronal exons in ESCs and NPCs.
(A, B) Left: Western blots of ESCs and NPCs treated with siControl, siPtbp1, or both siPtbp1 and siPtbp2. Similar results were obtained with an independent set of siRNAs. Right: Bar graphs showing the relative PTBP1 and PTBP2 protein expression ± SEM following siRNA treatment in ESCs (n=3) and NPCs (n=2). Cells with the highest level of either protein are normalized to 1. (C) Scatter plots compare the splicing changes in individual exons resulting from PTB protein depletion in ESCs (X-axis) with splicing changes between ESCs and MNs (Y-axis) ( Figure 2—source data 2). (D) Scatter plots compare the splicing changes resulting from PTB protein depletion in NPCs (X-axis) with splicing changes between NPCs and MNs (Y-axis) ( Figure 2—source data 4). (C, D) Data points in red correspond to neuronally spliced exons that are PTB protein repressed (ΔPSI ≥ 15%). Data points in blue correspond to neuronally skipped exons that are PTB protein activated (ΔPSI ≤ -15%). Data points in grey correspond to the other cassette exons measured by SpliceTrap.
-
Figure 2—source data 1
Splicing changes identified by RNA-seq following PTB protein depletion in ESCs.
- https://doi.org/10.7554/eLife.09268.008
-
Figure 2—source data 2
Neuronal cassette exons regulated by the PTB proteins in ESCs.
- https://doi.org/10.7554/eLife.09268.009
-
Figure 2—source data 3
Splicing changes identified by RNA-seq following PTB protein depletion in NPCs.
- https://doi.org/10.7554/eLife.09268.010
-
Figure 2—source data 4
Neuronal cassette exons regulated by the PTB proteins in NPCs.
- https://doi.org/10.7554/eLife.09268.011
-
Figure 2—source data 5
Cassette exons co-regulated by PTBP1 and PTBP2 in NPCs.
- https://doi.org/10.7554/eLife.09268.012
Figure 2—figure supplement 1
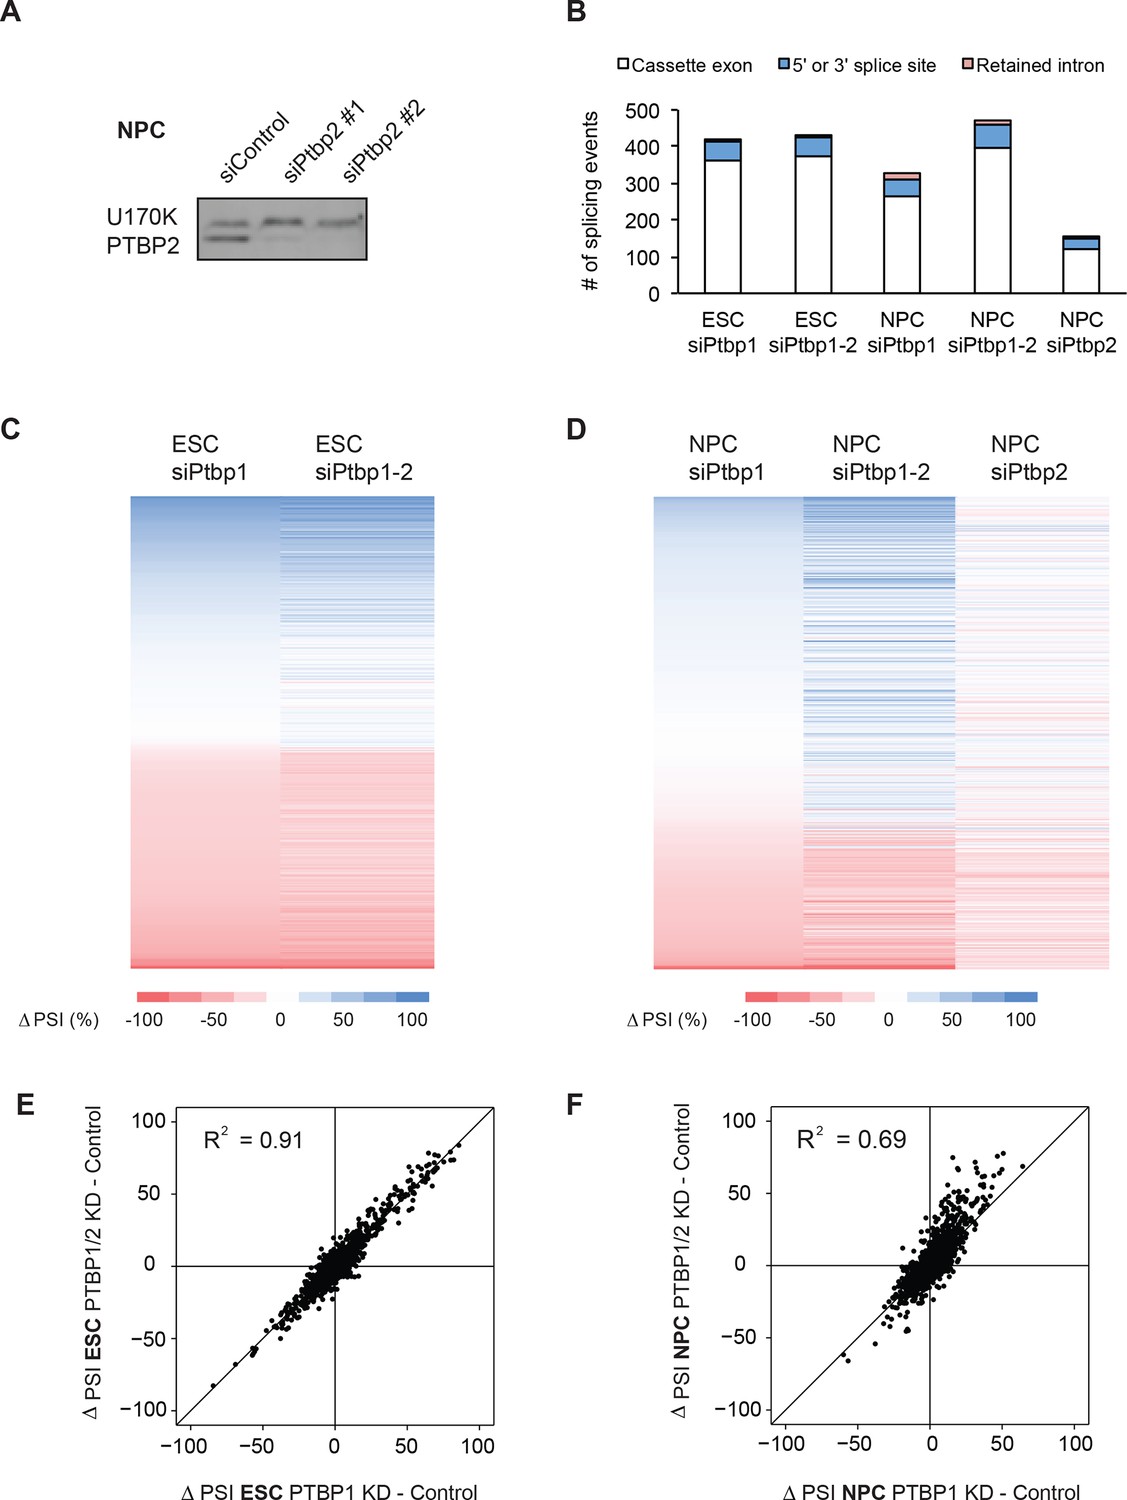
The PTB proteins regulate a large set of exons in ESCs and NPCs.
(A) PTBP2 protein is depleted from NPCs using two independent siRNAs. (B) Bar chart and (C, D) heat maps of differentially spliced events between Control samples and PTB protein knockdown samples in ESCs and NPCs (ΔPSI ≥ 15%) (Figure 2—source data 1 and 3). (E, F) Scatter plots compare the splicing changes from PTBP1 depletion with splicing changes from PTBP1 and PTBP2 dual depletion in (C) ESCs (D) and NPCs.
Figure 3 with 1 supplement
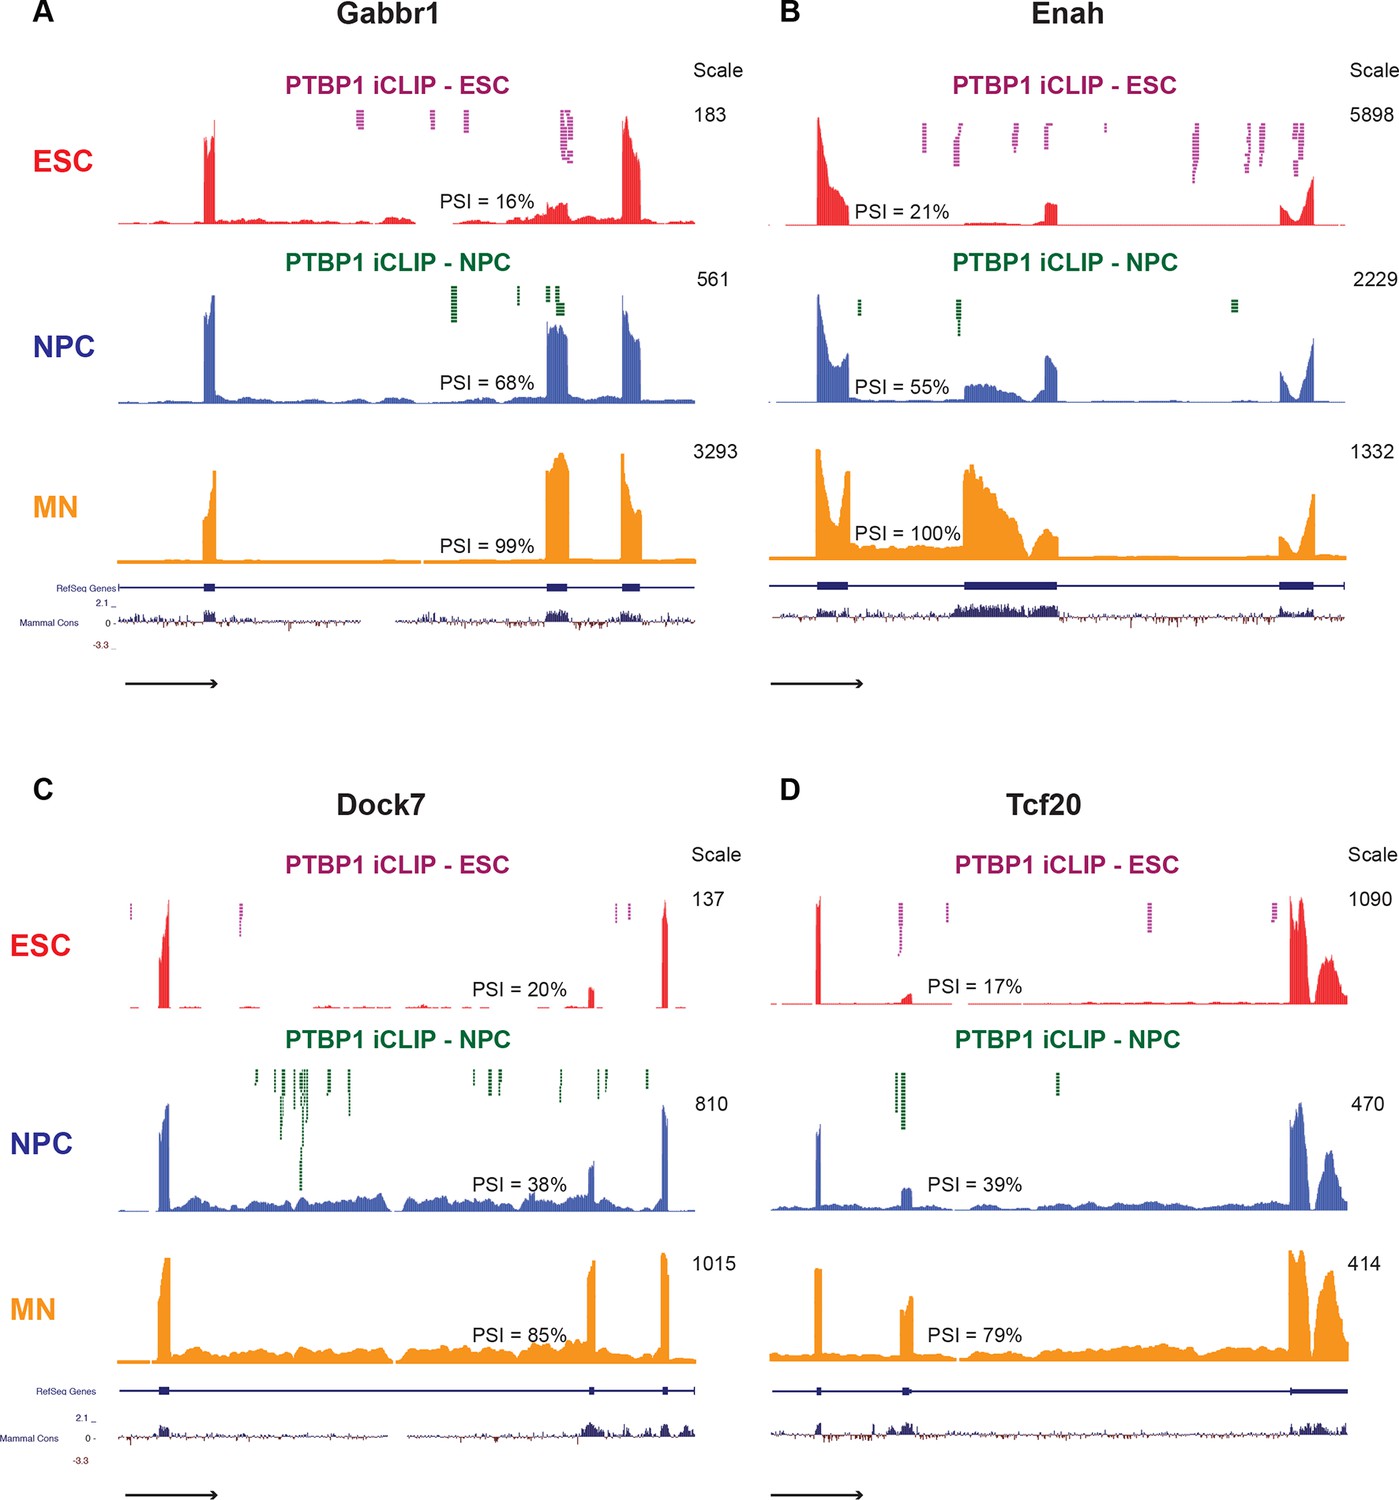
Examples of neuronally spliced cassette exons that are PTBP1 repressed.
(A-D) Genome Browser tracks show aligned RNA-seq reads from ESCs (red), NPCs (blue), and GFP+ MNs (yellow). The scale indicates the number of mapped reads in the highest peak. PSI values for the cassette exons were calculated with SpliceTrap (Wu et al., 2011). Significant PTBP1 iCLIP sequencing reads from ESCs (magenta) and NPCs (green) are overlaid on the Genome Browser tracks.
-
Figure 3—source data 1
PTBP1-regulated cassette exons with PTBP1 binding.
- https://doi.org/10.7554/eLife.09268.015
-
Figure 3—source data 2
Direct PTBP1 target exons during neuronal differentiation.
- https://doi.org/10.7554/eLife.09268.016
Figure 3—figure supplement 1
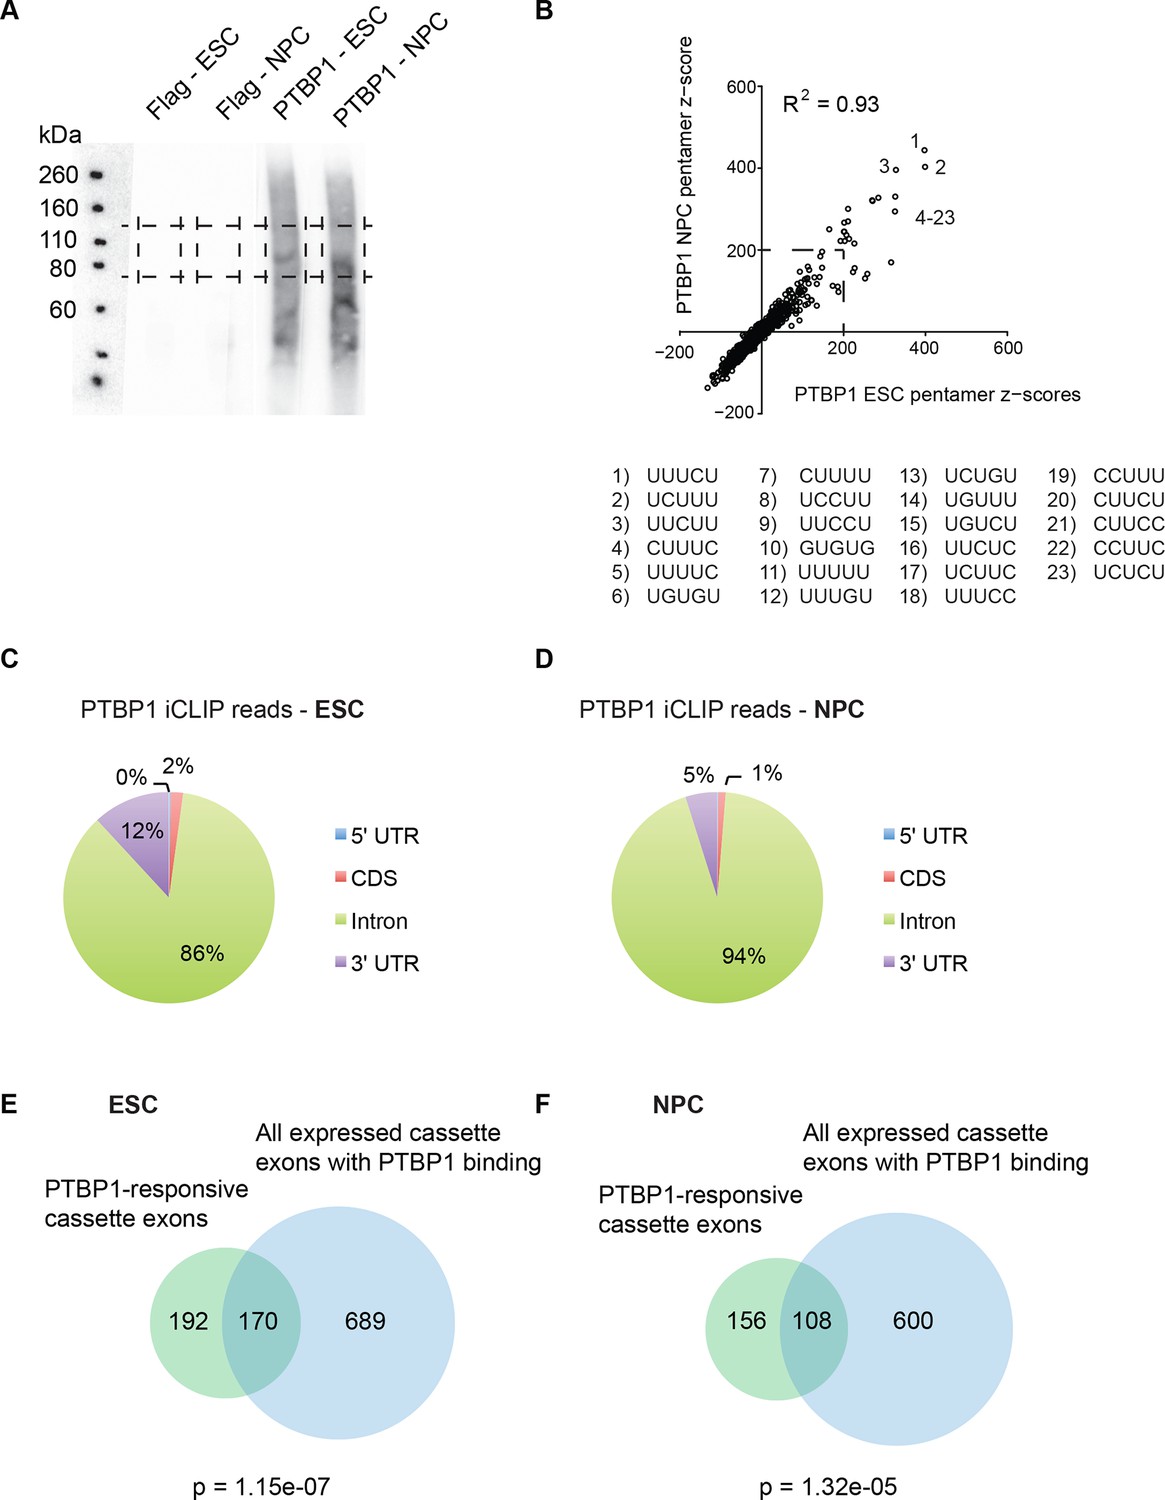
The base content and location of PTBP1 iCLIP-sequencing reads are consistent with known PTBP1 binding properties.
(A) Autoradiograph of the nitrocellulose membrane containing protein-RNA complexes isolated from ESCs and NPCs using either Flag or PTBP1 antibodies. Boxes indicate the region of the membrane used for iCLIP library preparation. (B) Scatter plot compares the calculated pentamer Z-scores from ESCs with scores from NPCs. The top 23 pentamer motifs, which had Z scores >200, are listed. (C, D) Pie charts showing the percent of the significant PTBP1 iCLIP reads that were found in 5’ UTR (blue), coding sequence (CDS) (red), intron (green), and 3’ UTR (purple) regions. (E, F) All expressed cassette exons with nearby PTBP1 iCLIP clusters (within 500 nt, blue circles) are overlapped with PTBP1-responsive cassette exons (green circles, ΔPSI ≥ 15%) (Figure 3—source data 1). P-values were calculated using the hypergeometric test.
Figure 4
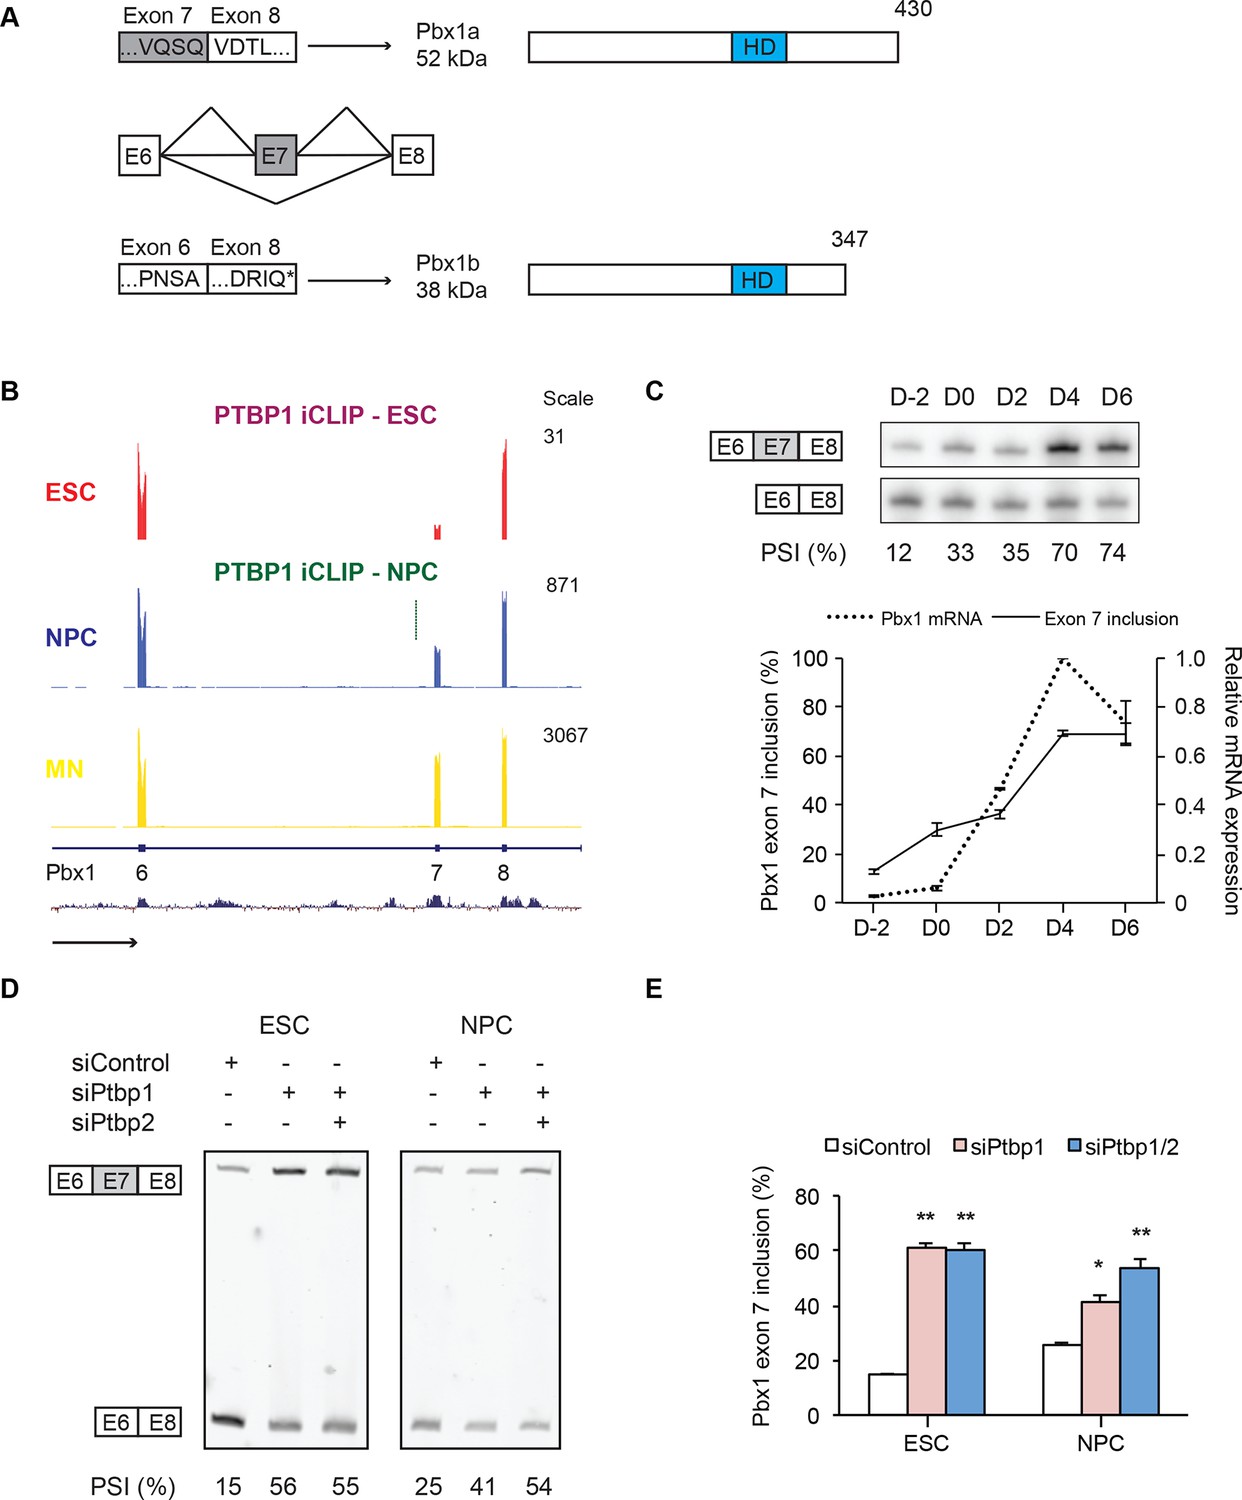
PTBP1 regulates a switch in Pbx1 isoform expression.
(A) Exons are represented as boxes, while horizontal lines represent introns. Inclusion of exon 7 results in the longer Pbx1a protein (top). Skipping of exon 7 results in a frameshift and translation termination at a stop codon (*) in exon 8 to yield the shorter Pbx1b protein isoform (bottom). The DNA-binding homeodomain (HD) is indicated by a blue box. (B) Genome Browser tracks of aligned RNA-seq reads show exon 7 inclusion as ESCs (red) differentiate into NPCs (blue) and GFP+ MNs (yellow). A significant PTBP1 iCLIP cluster is present upstream of exon 7 in NPCs (green). (C) Both Pbx1 exon 7 (top panel, solid line bottom panel, n=3) and Pbx1 mRNA expression (dashed line bottom panel, n=2) are induced with MN differentiation. (D, E) ESCs and NPCs were treated with siControl, siPtbp1, or both siPtbp1 and siPtbp2. (D) RT-PCR of Pbx1 exon 7 splicing following siRNA treatment in ESCs (24 PCR cycles) and NPCs (19 PCR cycles). (E) Bar chart of Pbx1 exon 7 splicing (Mean ± SEM, n=3). Statistical analyses were performed using paired one-tailed Student’s t-test (P-value<0.01**, 0.05*).
Figure 5 with 1 supplement
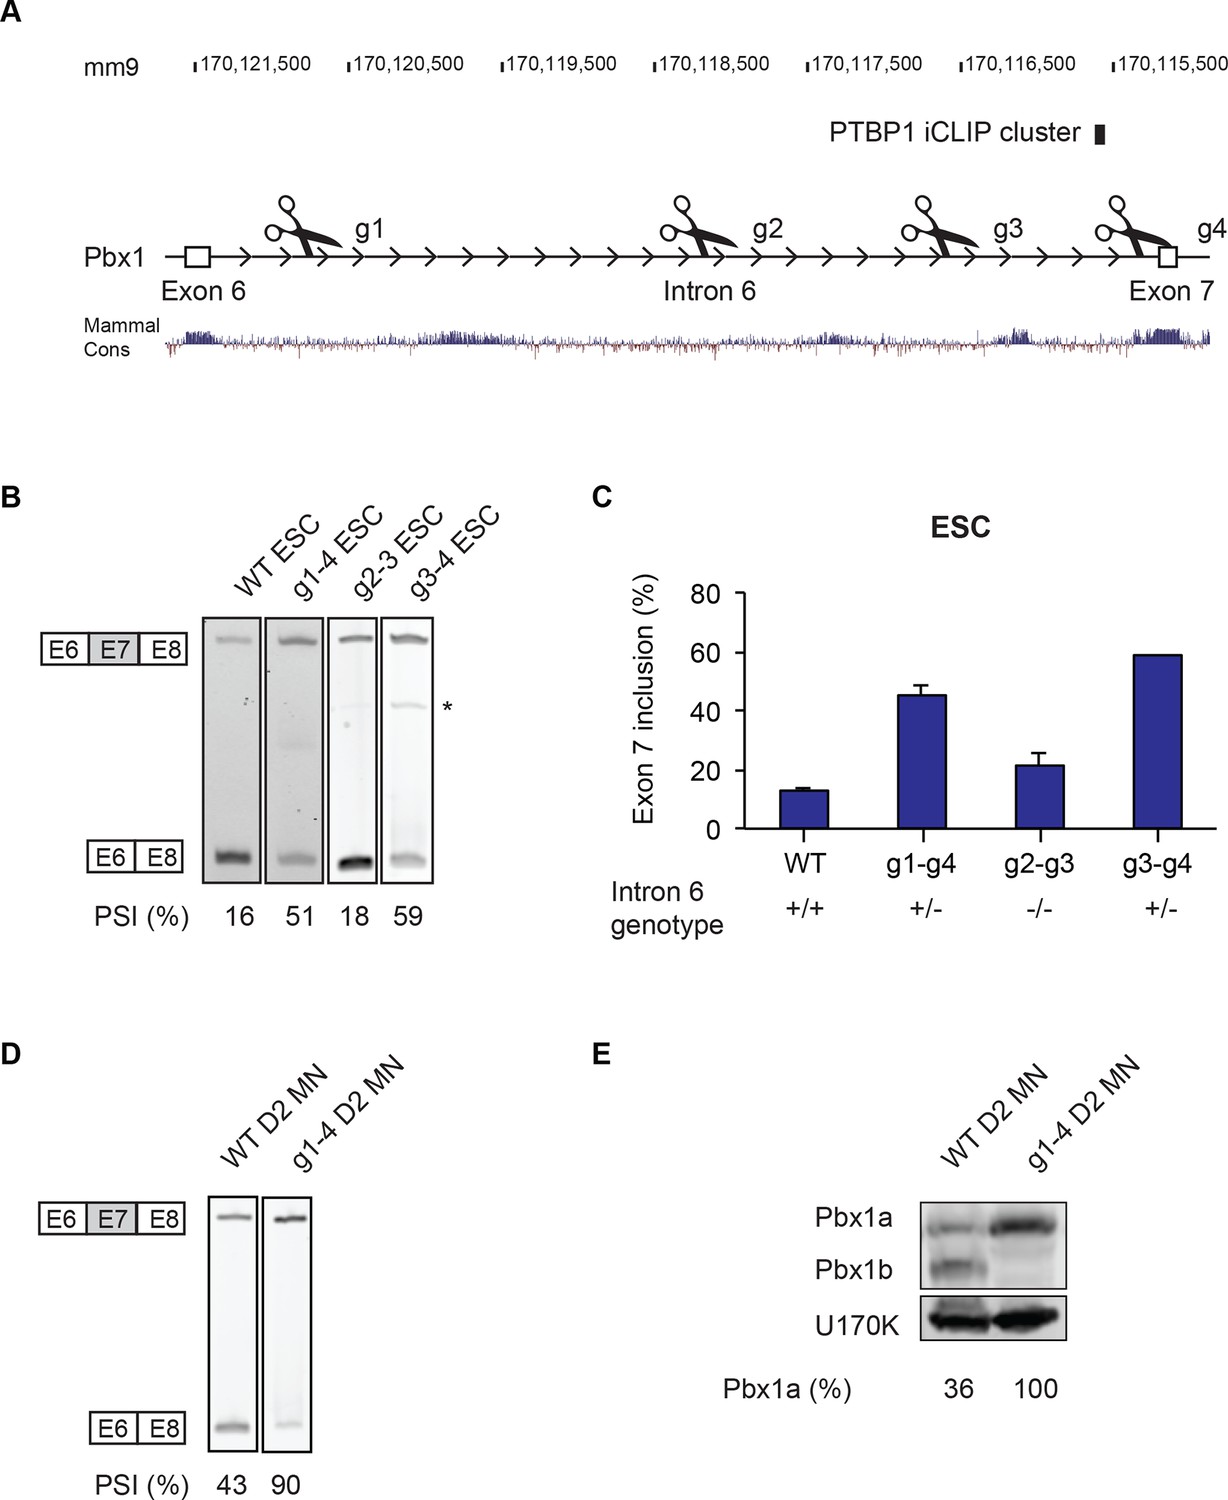
Intron 6 deletions in Pbx1 induce exon 7 splicing.
(A) Guide RNAs were designed to target regions along Pbx1 intron 6. The location of the PTBP1 iCLIP cluster is indicated by the black box. (B) RT-PCR of Pbx1 exon 7 splicing in ESC clones carrying Cas9-mediated deletions. The asterisk (*) indicates a sporadic non-specific band. (C) Bar chart of Pbx1 exon 7 splicing in ESC clones with intron 6 deletions. Error bars indicate the SEM for three independent clones, except for g3-4 where only one clone was isolated. (D) RT-PCR of Pbx1 exon 7 splicing and (E) western blot of Pbx1 in D2 MN cultures show that Pbx1a is the predominant isoform in the I6 +/- cell line at day 2. Solid borders of RT-PCR gels indicate non-adjacent gel lanes.
Figure 5—figure supplement 1
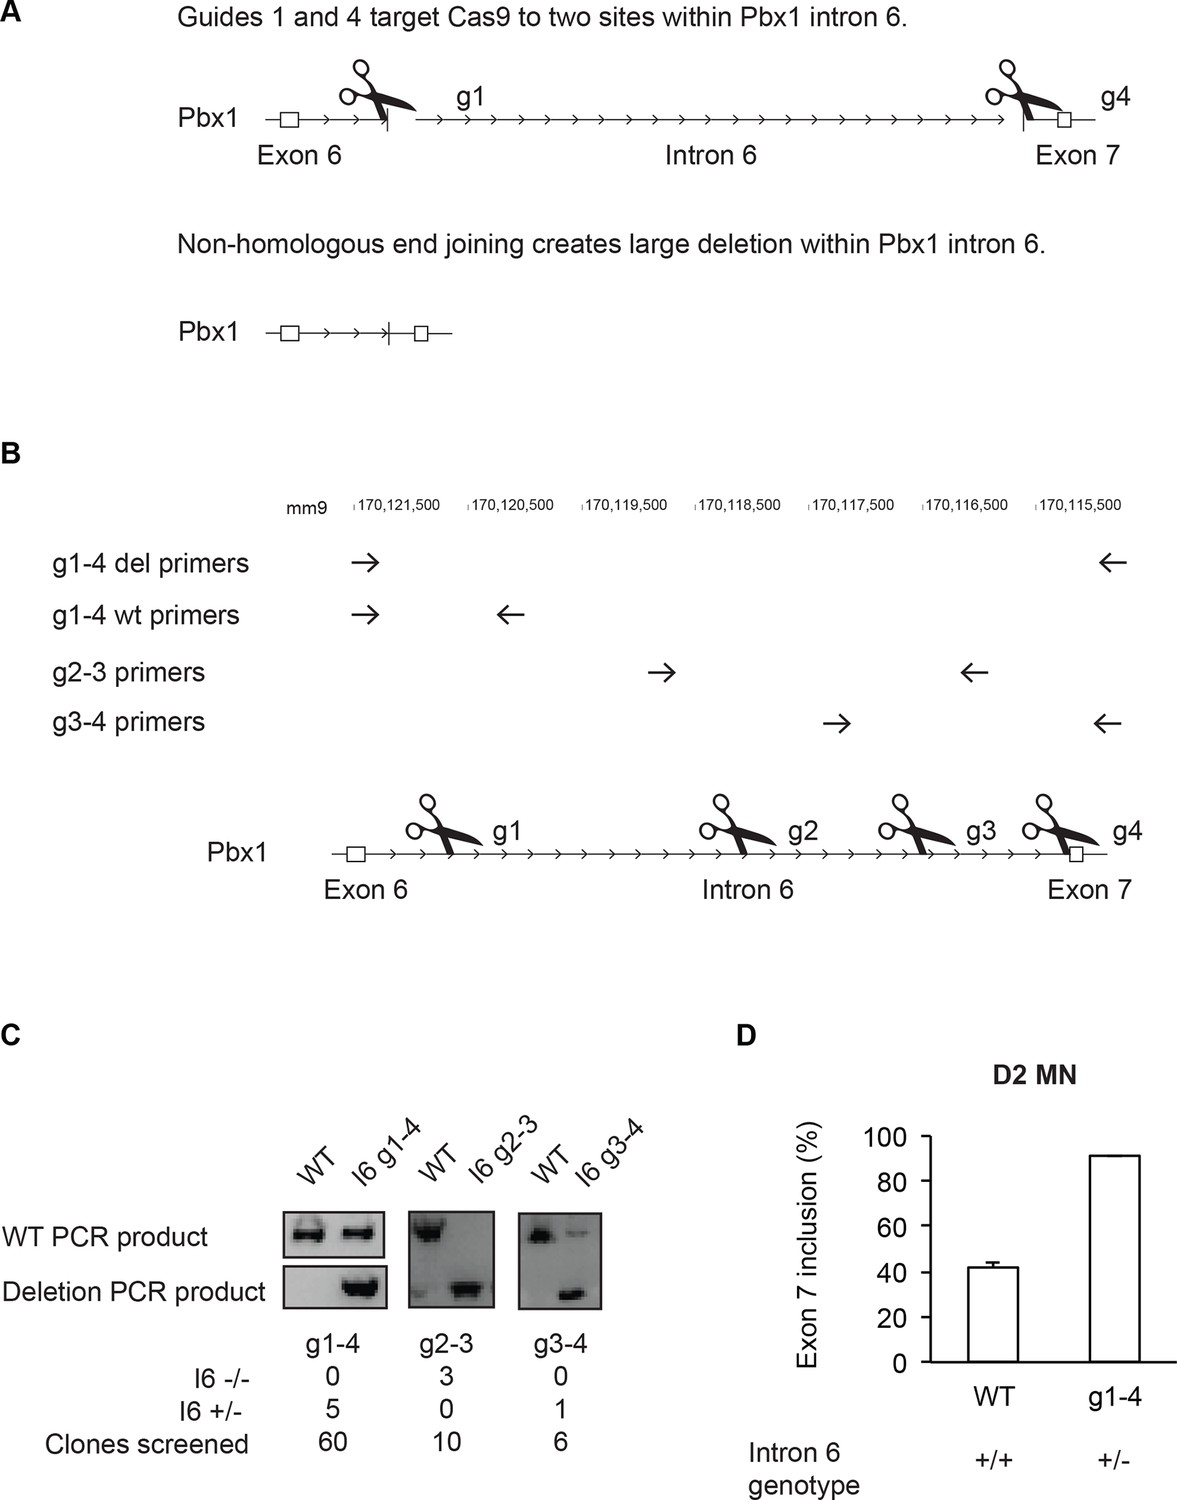
Cas9-targeted deletions of Pbx1 intron 6 switch Pbx1 isoform expression.
(A) Schematic of Cas9-targeted deletion of Pbx1 intron 6. (B) Location of primers used for intron 6 genotyping PCRs. A list of primer sequences is provided in Supplementary file 1 (C) Genotyping PCR of the wild type and the intron 6 deletion cell lines. Table showing the number of clones screened and number of edited cell lines isolated. (D) Bar graph of Pbx1 exon 7 splicing in D2 MN wild type (n=3 clones) and I6 +/- (n=5 clones) cultures. Error bars indicate SEM.
Figure 6 with 1 supplement
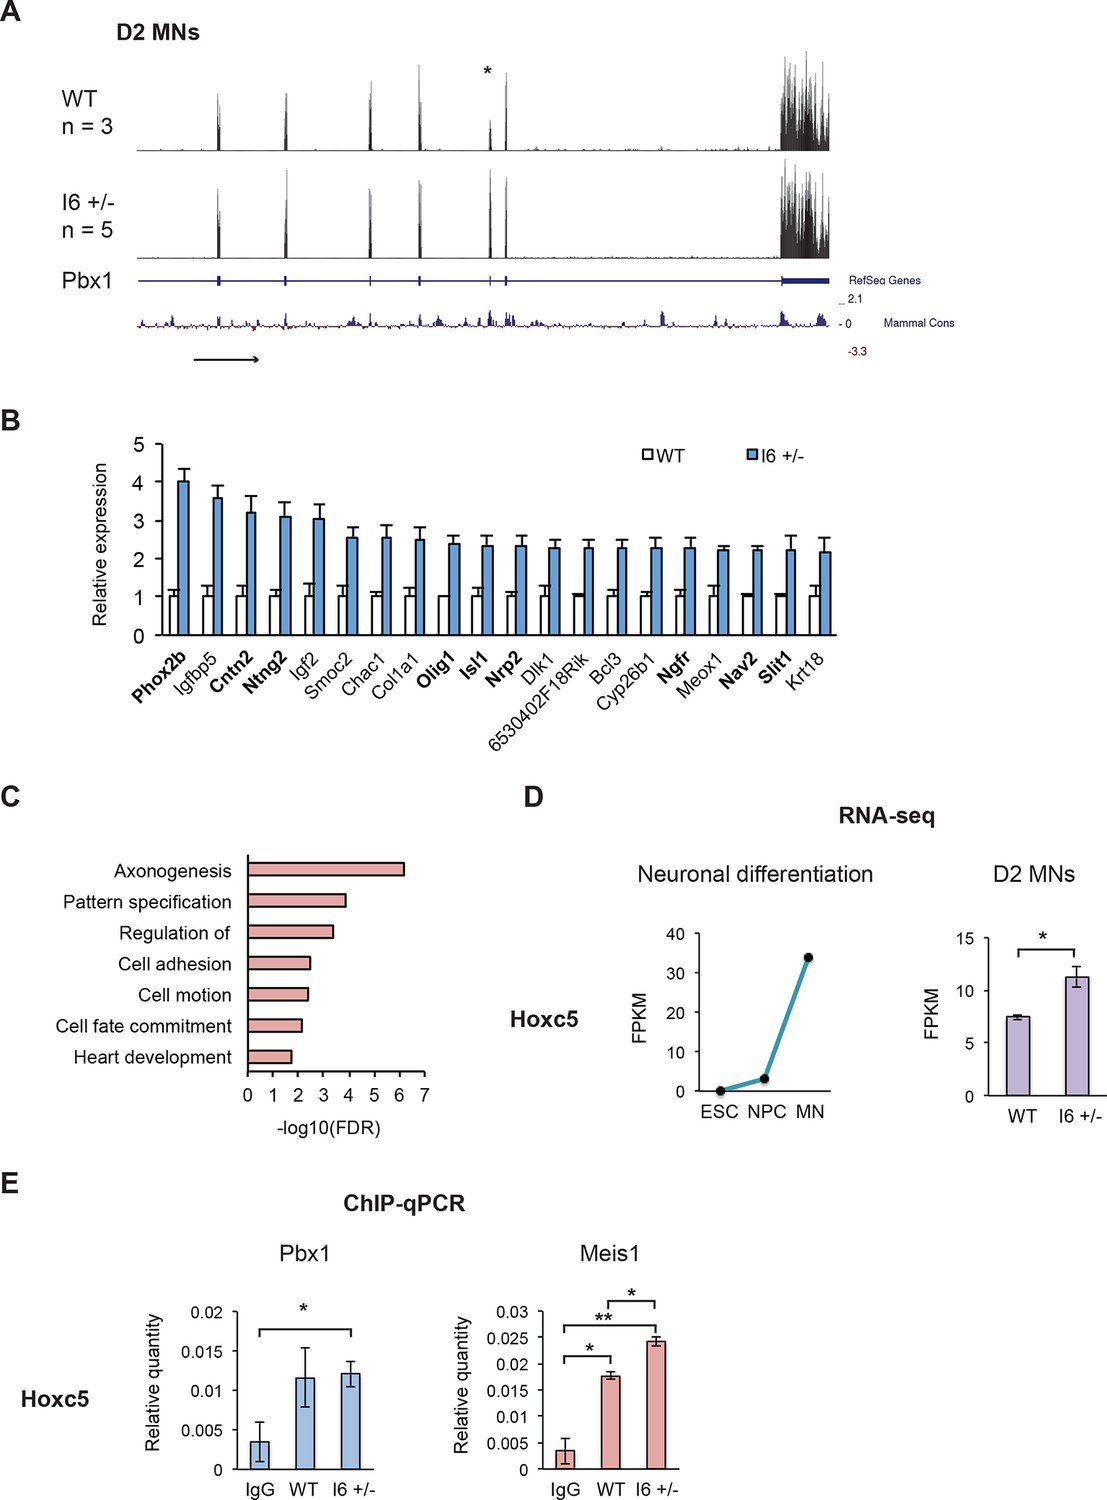
The early expression of Pbx1a promotes neuronal gene expression.
(A) Genome Browser tracks of aligned RNA-seq reads from wild type (top) and I6 +/- (bottom) Day 2 MN cultures. The asterisk (*) indicates Pbx1 exon 7, which is induced in the mutant. (B) Bar charts of the top 20 induced genes in the I6 +/- cell lines compared to expression in wild type cells (Figure 6—source data 1). Genes highlighted in bold have known roles in neuronal differentiation. Error bars indicate SEM. (C) Gene ontology analysis of the 196 genes induced by 1.5 fold in the I6 +/- cultures. (D) Hoxc5 expression increases during neuronal differentiation (left panel, Figure 6—source data 2) and the induction of Pbx1a. (E) Relative Pbx1 (left panel) and Meis1 (right panel) binding in D2 MN cultures (n=3). Statistical analyses were performed using Welch’s t-test (P-value<0.05*, <0.01**).
-
Figure 6—source data 1
Expression changes in I6 +/- Day 2 MN cultures.
- https://doi.org/10.7554/eLife.09268.022
-
Figure 6—source data 2
Expression values in ESCs, NPCs, and GFP+ MNs.
- https://doi.org/10.7554/eLife.09268.023
Figure 6—figure supplement 1
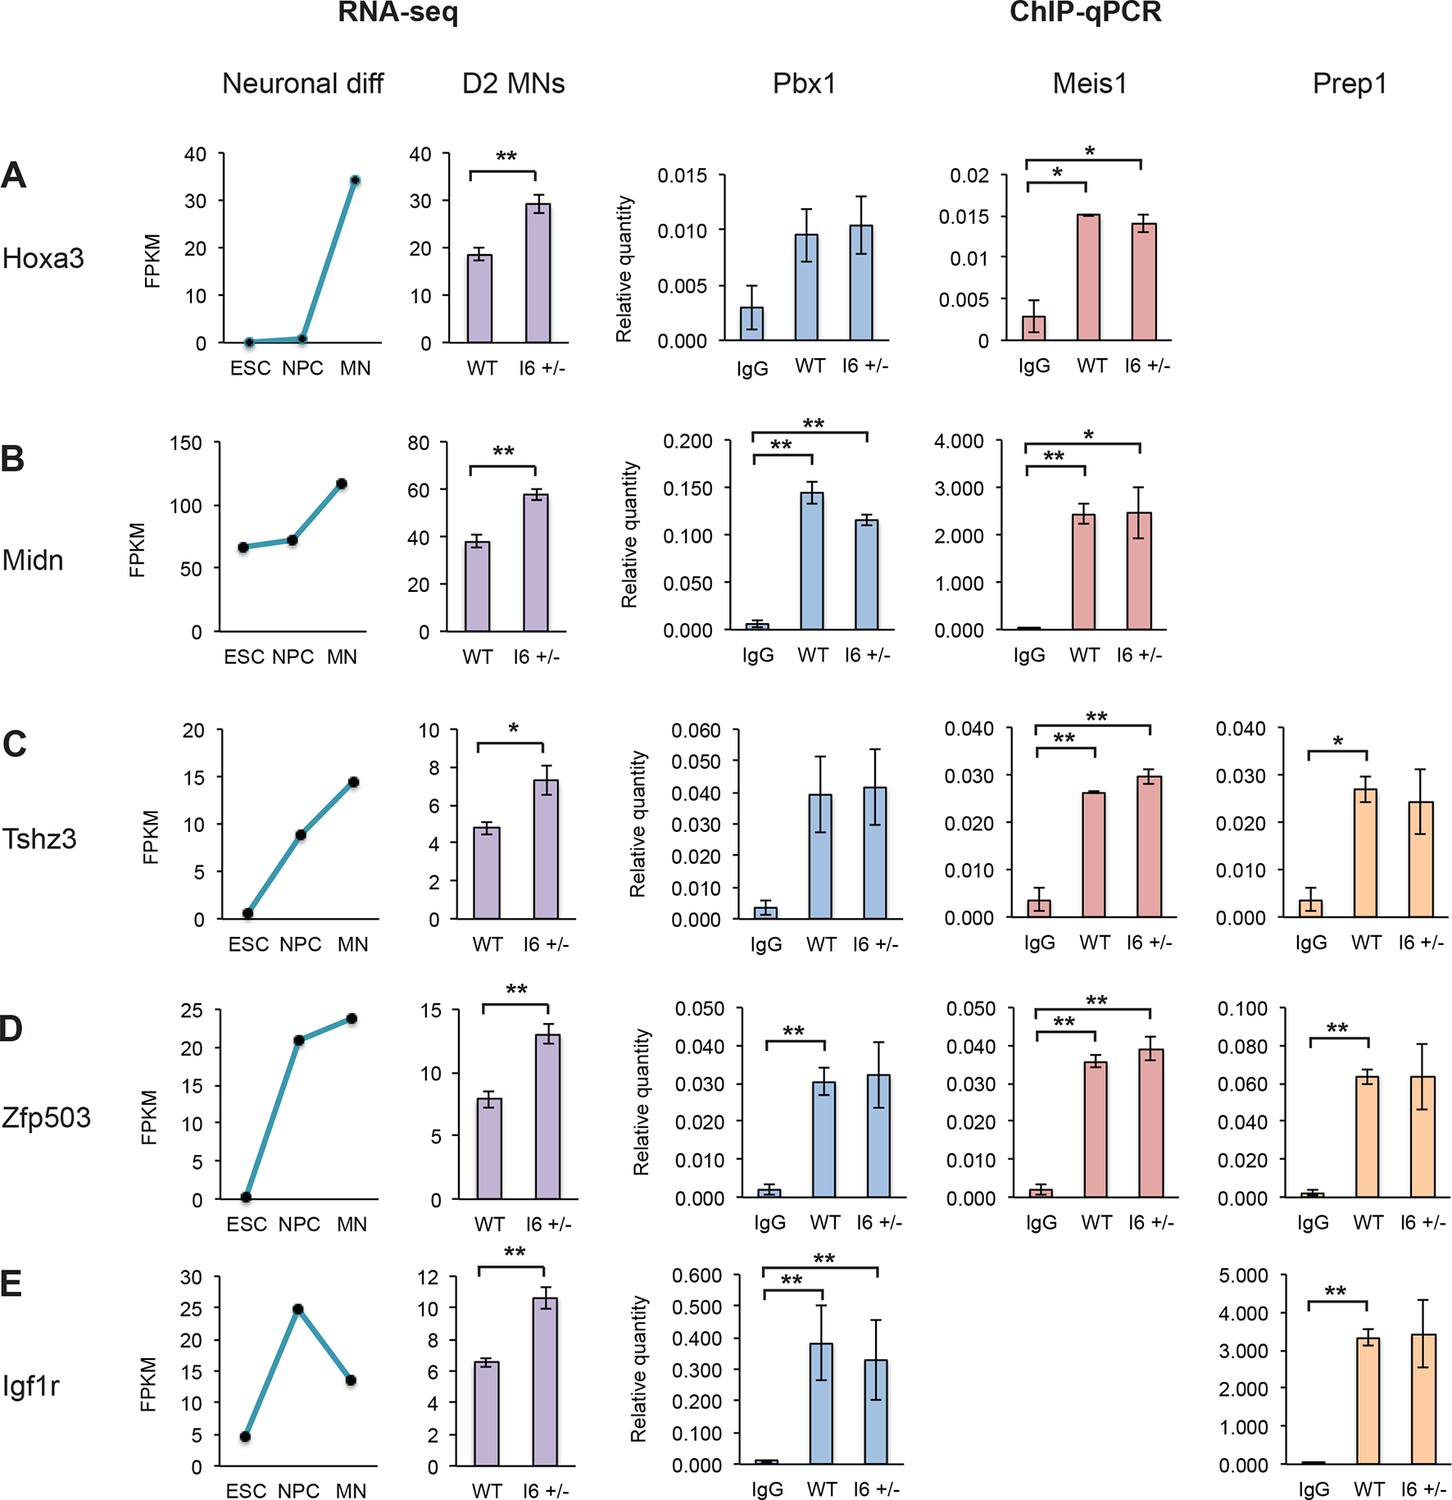
Pbx1 binds target neuronal genes.
(A-E) Gene expression of several Pbx1 targets increases during neuronal differentiation (left panels, Figure 6—source data 2). Inducing Pbx1a expression increases the expression of these genes (middle left panel, purple bars). ChIP-qPCR demonstrates that Pbx1 (middle panel, blue bars), Meis1 (middle right panel, red bars), and Prep1 (right panel, orange bars) bind neuronal target genes in D2 MN cultures. Statistical analyses were performed using Welch’s t-test (P-value<0.05*, <0.01**).
Additional files
-
Supplementary File 1
Primer and guide RNA sequences.
- https://doi.org/10.7554/eLife.09268.025
-
Supplementary File 2
iCLIP protocol.
- https://doi.org/10.7554/eLife.09268.026
-
Supplementary File 3
Primer sequences for ChIP-qPCR.
- https://doi.org/10.7554/eLife.09268.027
-
Supplementary File 4
RNA-seq and iCLIP genome browser sessions.
- https://doi.org/10.7554/eLife.09268.028
Download links
A two-part list of links to download the article, or parts of the article, in various formats.
Downloads (link to download the article as PDF)
Open citations (links to open the citations from this article in various online reference manager services)
Cite this article (links to download the citations from this article in formats compatible with various reference manager tools)
The splicing regulator PTBP1 controls the activity of the transcription factor Pbx1 during neuronal differentiation
eLife 4:e09268.
https://doi.org/10.7554/eLife.09268


