Stress induced gene expression drives transient DNA methylation changes at adjacent repetitive elements
- The University of Western Australia, Australia
- Zhejiang University, China
- Salk Institute for Biological Studies, United States
- Université d'Aix-Marseille, France
- La Trobe University, Australia
Figures
Figure 1 with 1 supplement
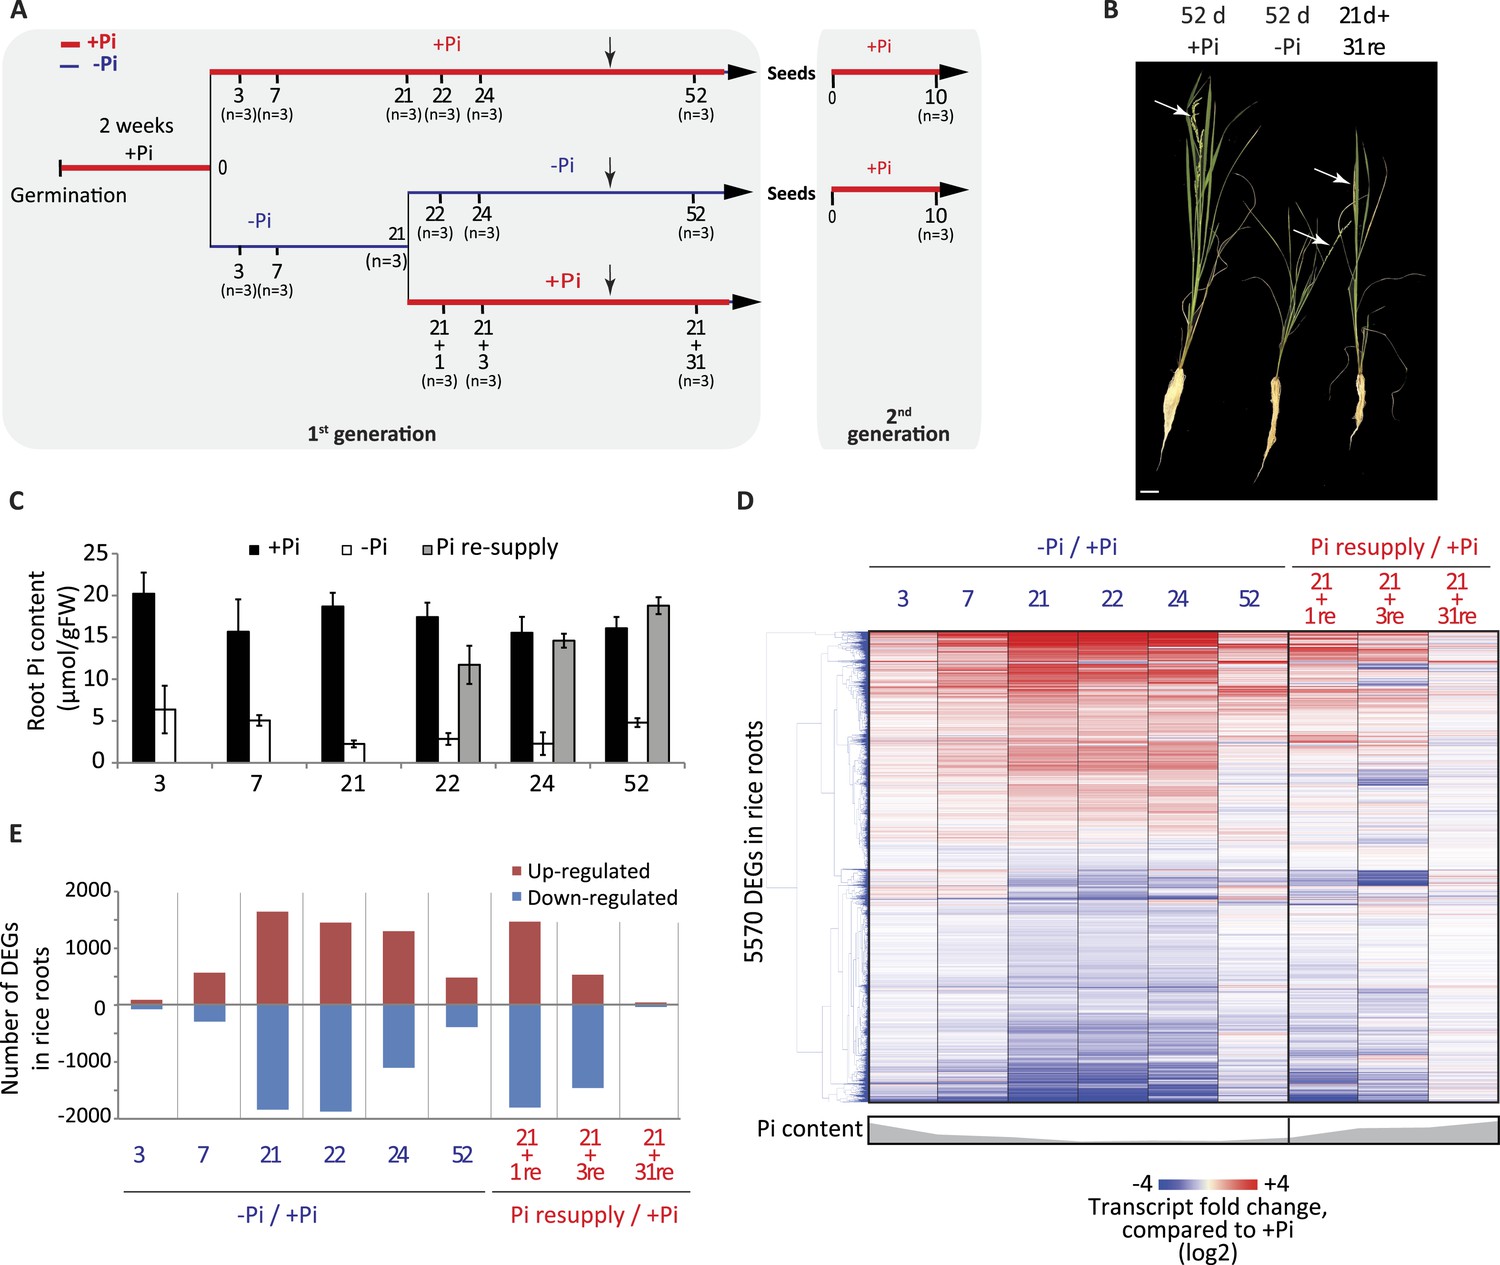
Effects of Pi starvation and resupply in rice.
(A) Schematic representation of the experimental design. Seeds were germinated in water for 2 days and then transferred to a Pi-sufficient hydroponic (0.32 mM) solution for 2 weeks before being either transferred to Pi-deficient media (0 mM) or maintained in Pi-sufficient solution. After 21 days of treatment, half of the Pi-starved plants were resupplied with Pi-sufficient media for up to 31 additional days. Seeds from plants continually grown in + and −Pi were harvested and grown in Pi sufficient conditions for 10 days. Black arrows indicate the time of emergence of panicles. (B) Morphological appearance of rice seedlings after 52 days of treatment. White arrows indicate panicles. (C) Pi concentration in the roots. (D) Hierarchical clustering of significantly (Cuffdiff, FDR < 0.05) differentially expressed genes (DEGs) in response to Pi starvation as determined by mRNA-seq. (E) Number of significantly differentially expressed genes in the roots for each time point. Source data for Figure 1 is available at Dryad (Secco et al., 2015).
Figure 1—figure supplement 1

Responses of rice to Pi starvation.
https://doi.org/10.7554/eLife.09343.005
Figure 2 with 5 supplements
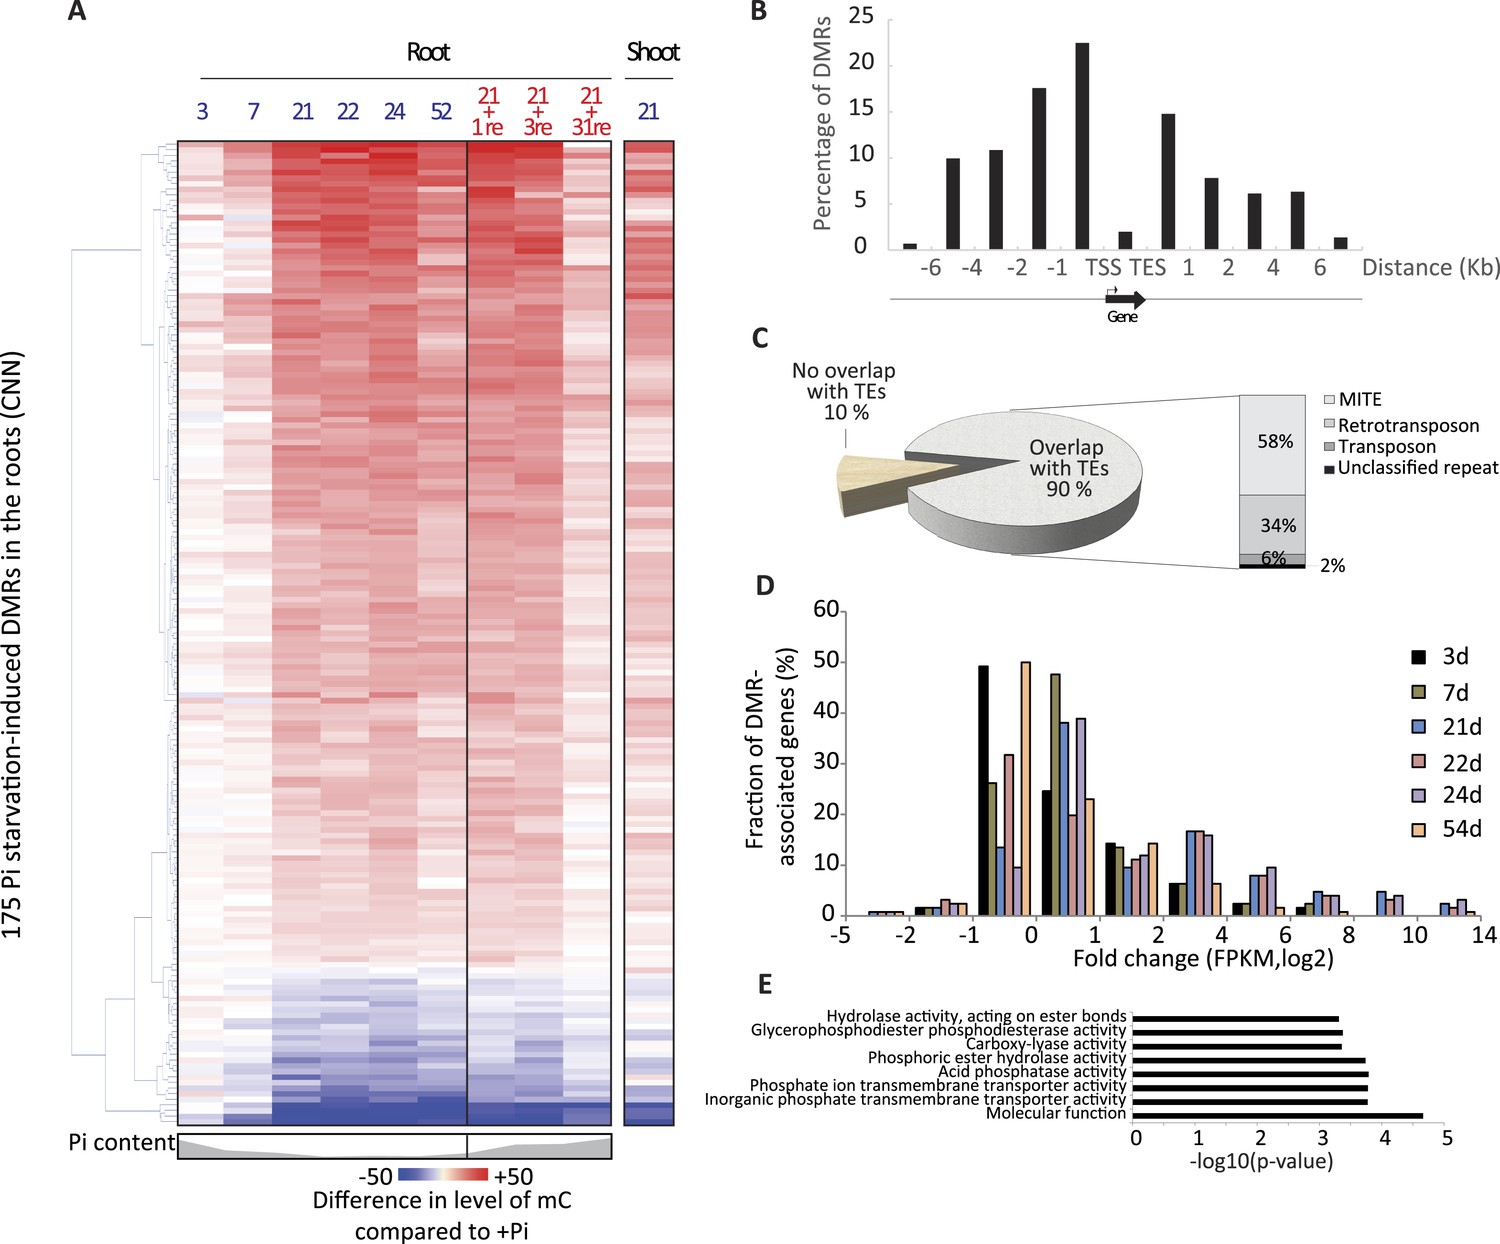
Pi starvation triggers widespread changes in DNA methylation in rice roots.
(A) Hierarchical clustering of the average difference in CNN methylation levels of the 175 PSI DMRs (FDR < 0.01) identified upon long term Pi starvation (21 days, 22 days and 24 days) in the roots in response to Pi starvation. (B) Normalised distribution of the distance of the DMRs to the nearest gene. The position of each DMR was calculated with respect to the nearest gene. DMRs were categorized in bins (within gene body, 0–1 kb, 1–2 kb, 2–4 kb, 4–6 kb, and >6 kb from the TSS or TES), and the number of DMRs in each bin was normalised by the total number of regions present in that bin category in the genome. TSS, Transcription Start Site; TES, Transcription End Site. (C) Proportion of DMRs overlapping with transposable elements (TEs), and their corresponding classes. (D) Distribution of non-redundant DMR-associated gene transcription levels identified by RNA-seq upon Pi deprivation. (E) Gene ontology enrichment analysis of non-redundant DMR-associated genes (p-value < 0.05). Source data for Figure 2 is available at Dryad (Secco et al., 2015).
Figure 2—figure supplement 1

Hierarchical clustering of the 45 root methylomes based on their CNN methylation levels in the 175 root PSI DMRs.
https://doi.org/10.7554/eLife.09343.010
Figure 2—figure supplement 2
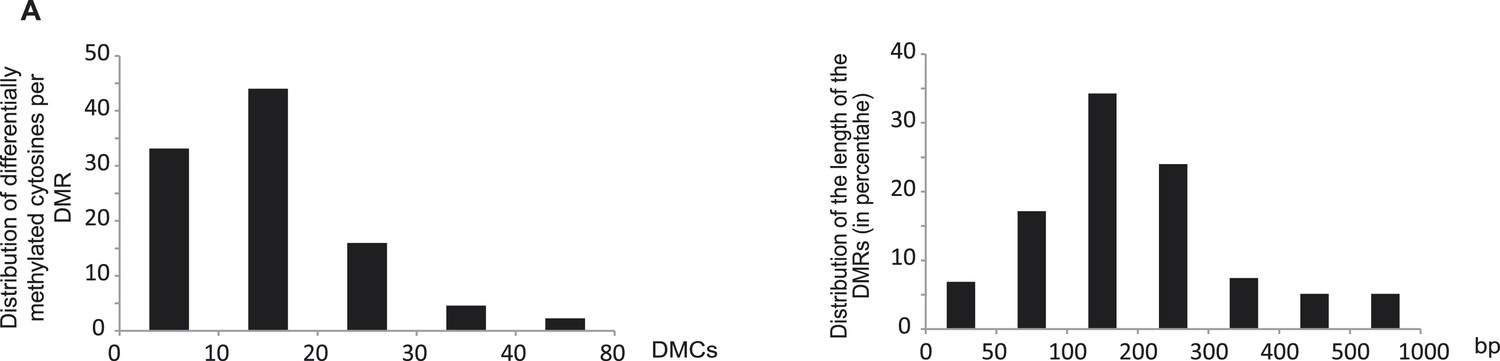
Characteristics of the root PSI DMRs.
https://doi.org/10.7554/eLife.09343.011
Figure 2—figure supplement 3
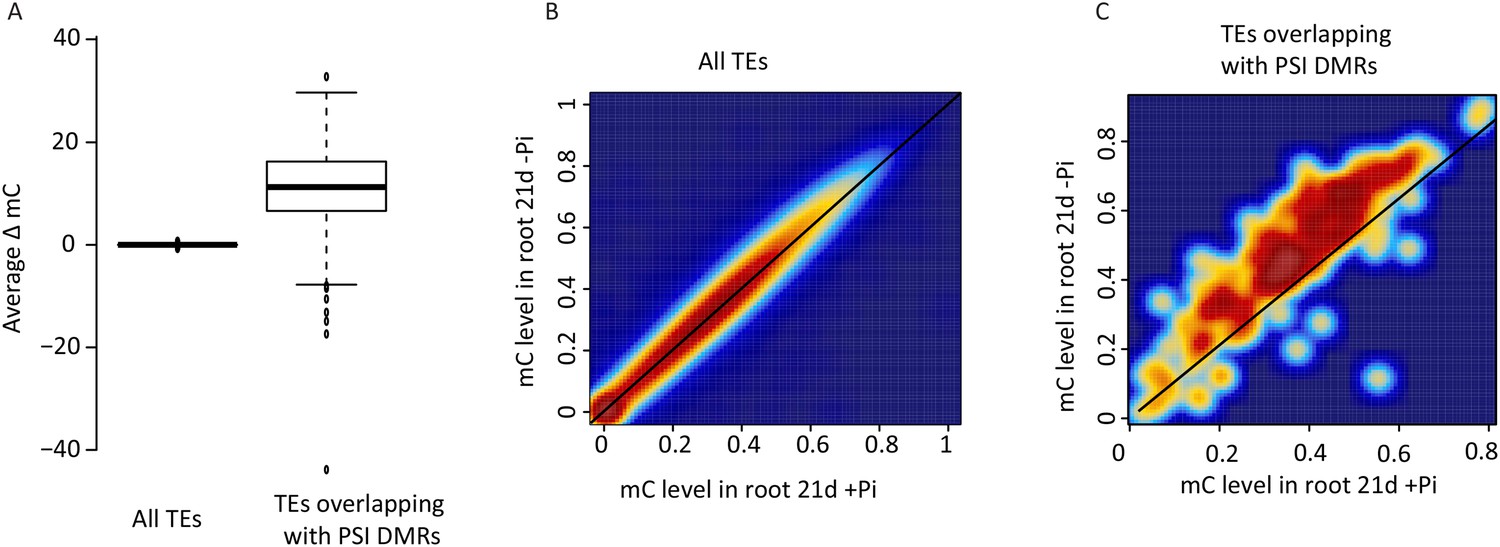
DNA methylation in transposable elements.
https://doi.org/10.7554/eLife.09343.012
Figure 2—figure supplement 4
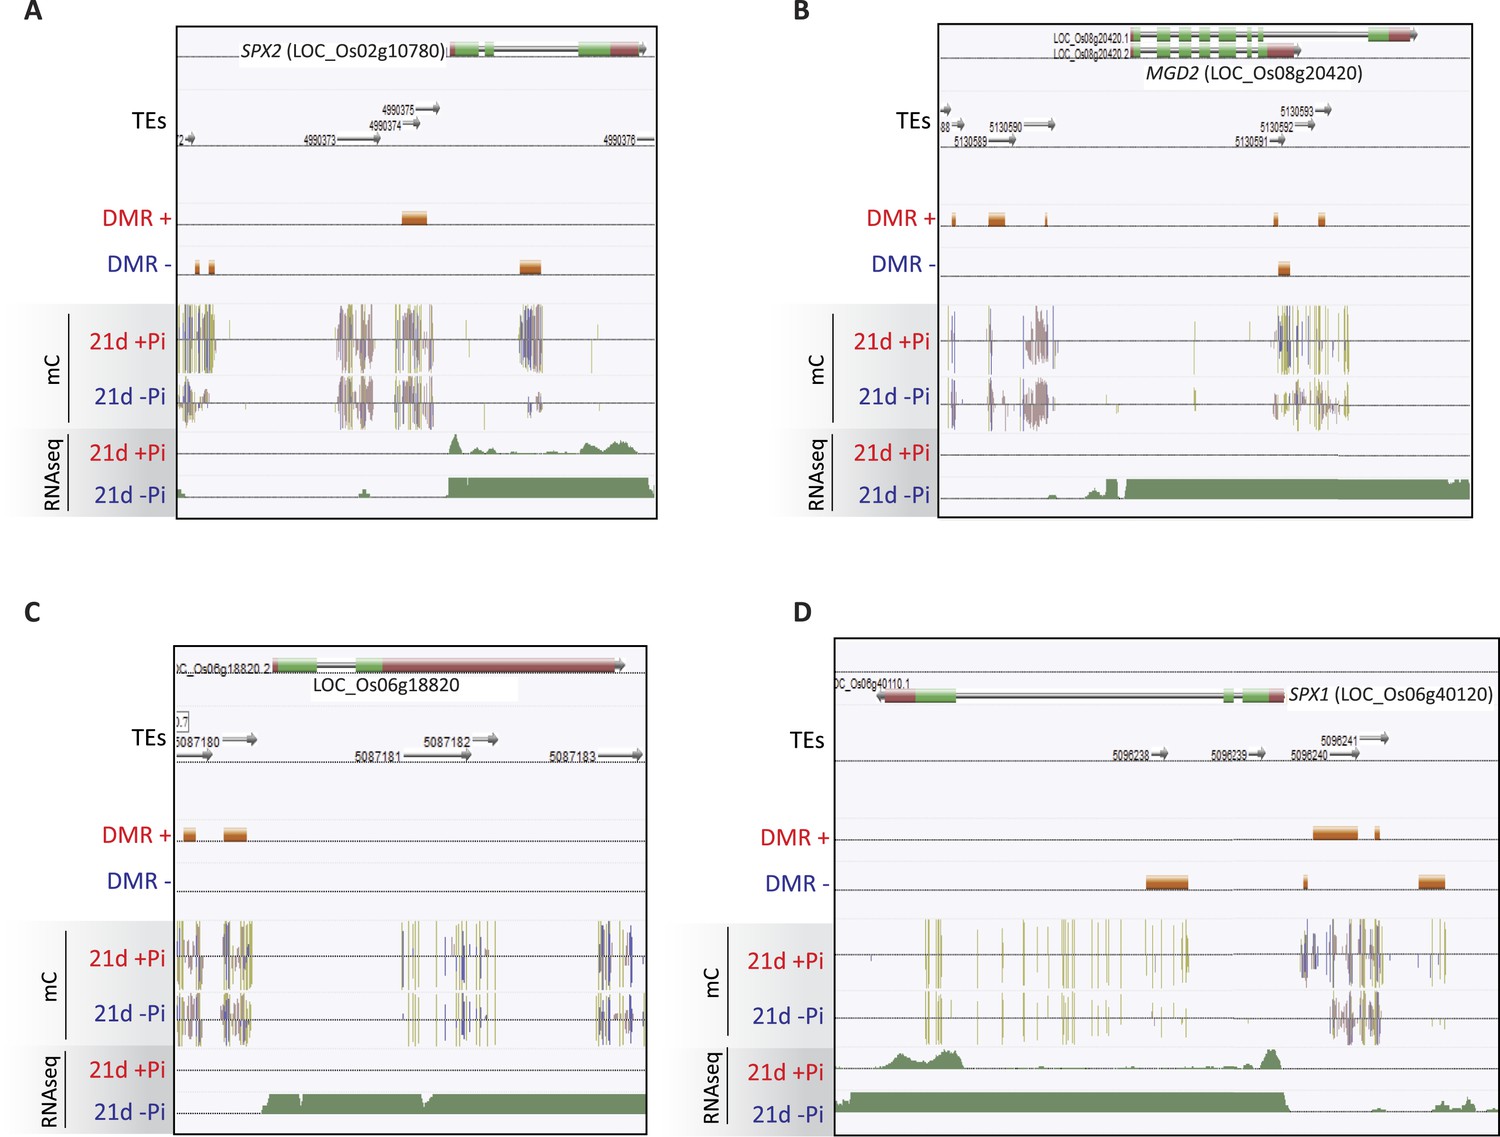
Examples of PSI DMRs.
https://doi.org/10.7554/eLife.09343.013
Figure 2—figure supplement 5
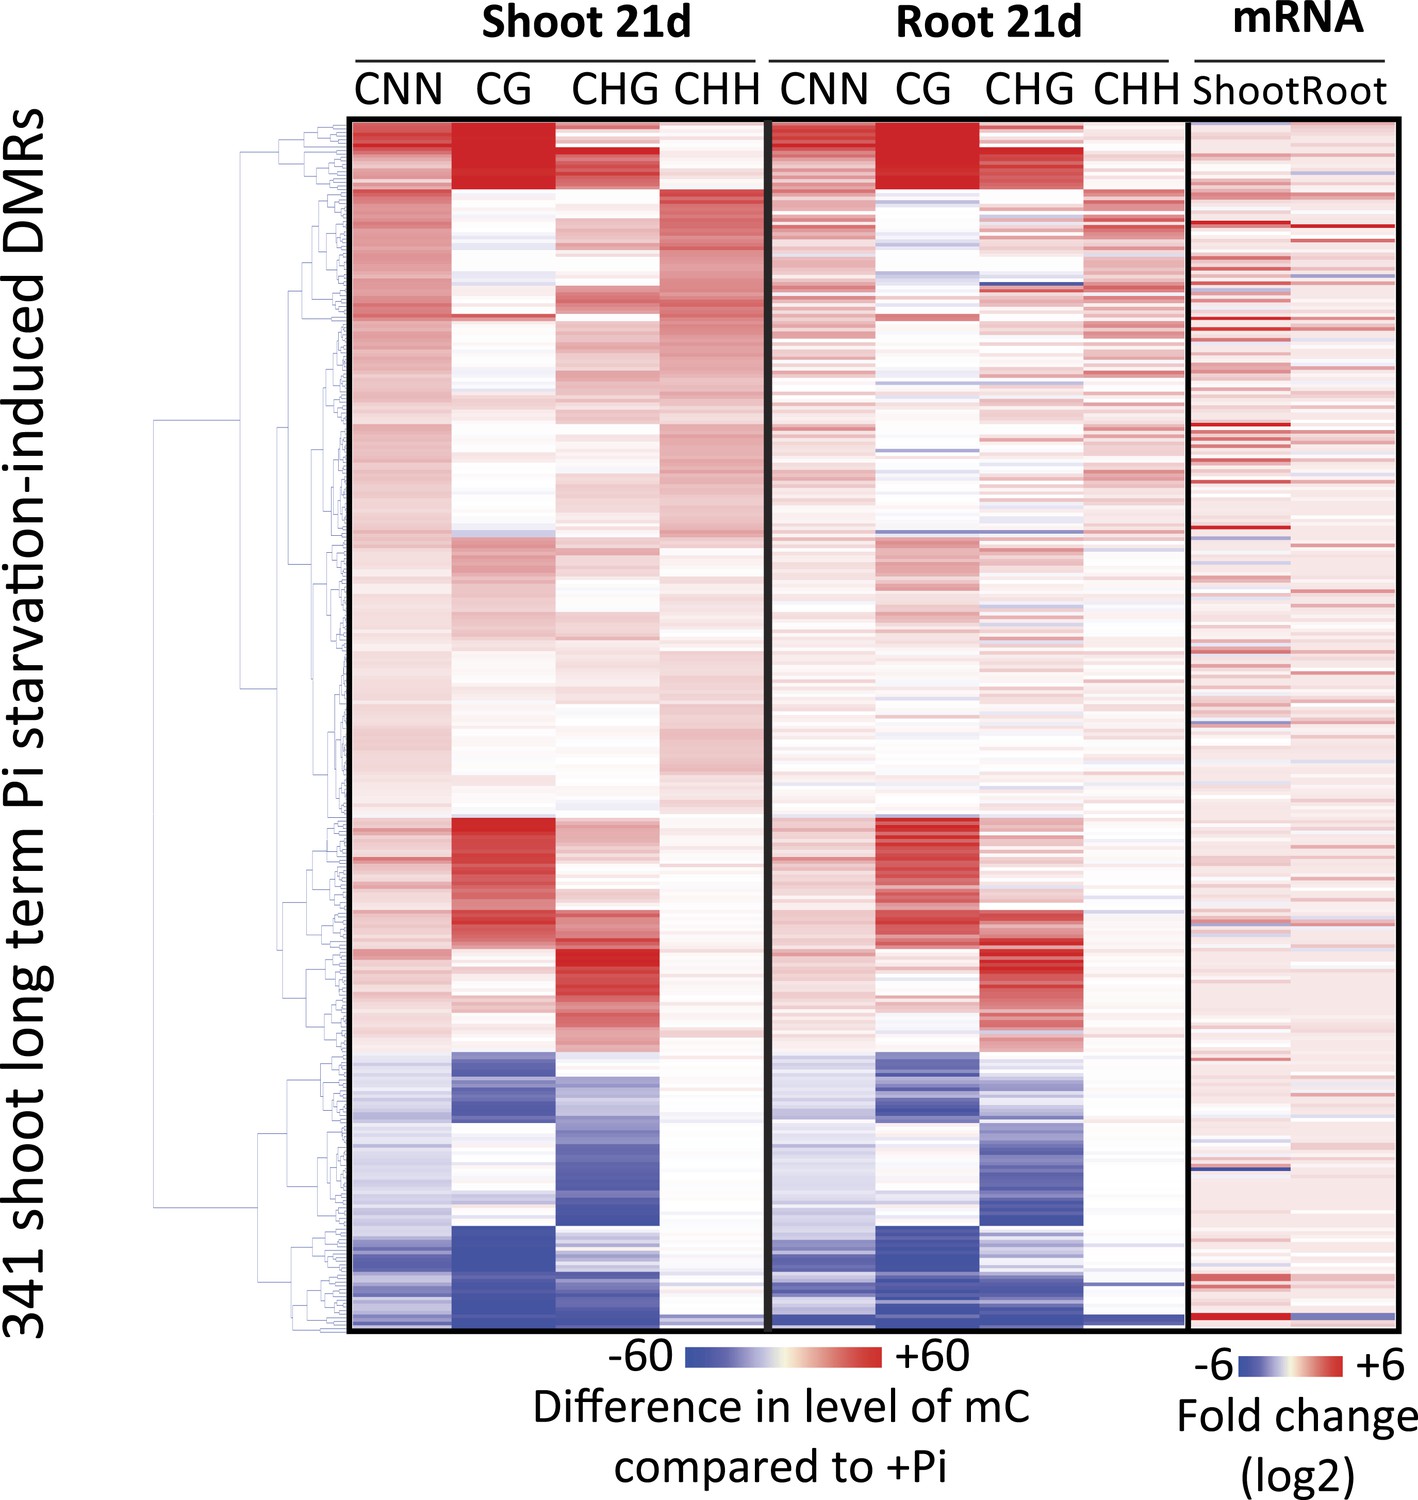
Hierarchical clustering of the 341 shoot PSI DMRs.
https://doi.org/10.7554/eLife.09343.014
Figure 3 with 1 supplement
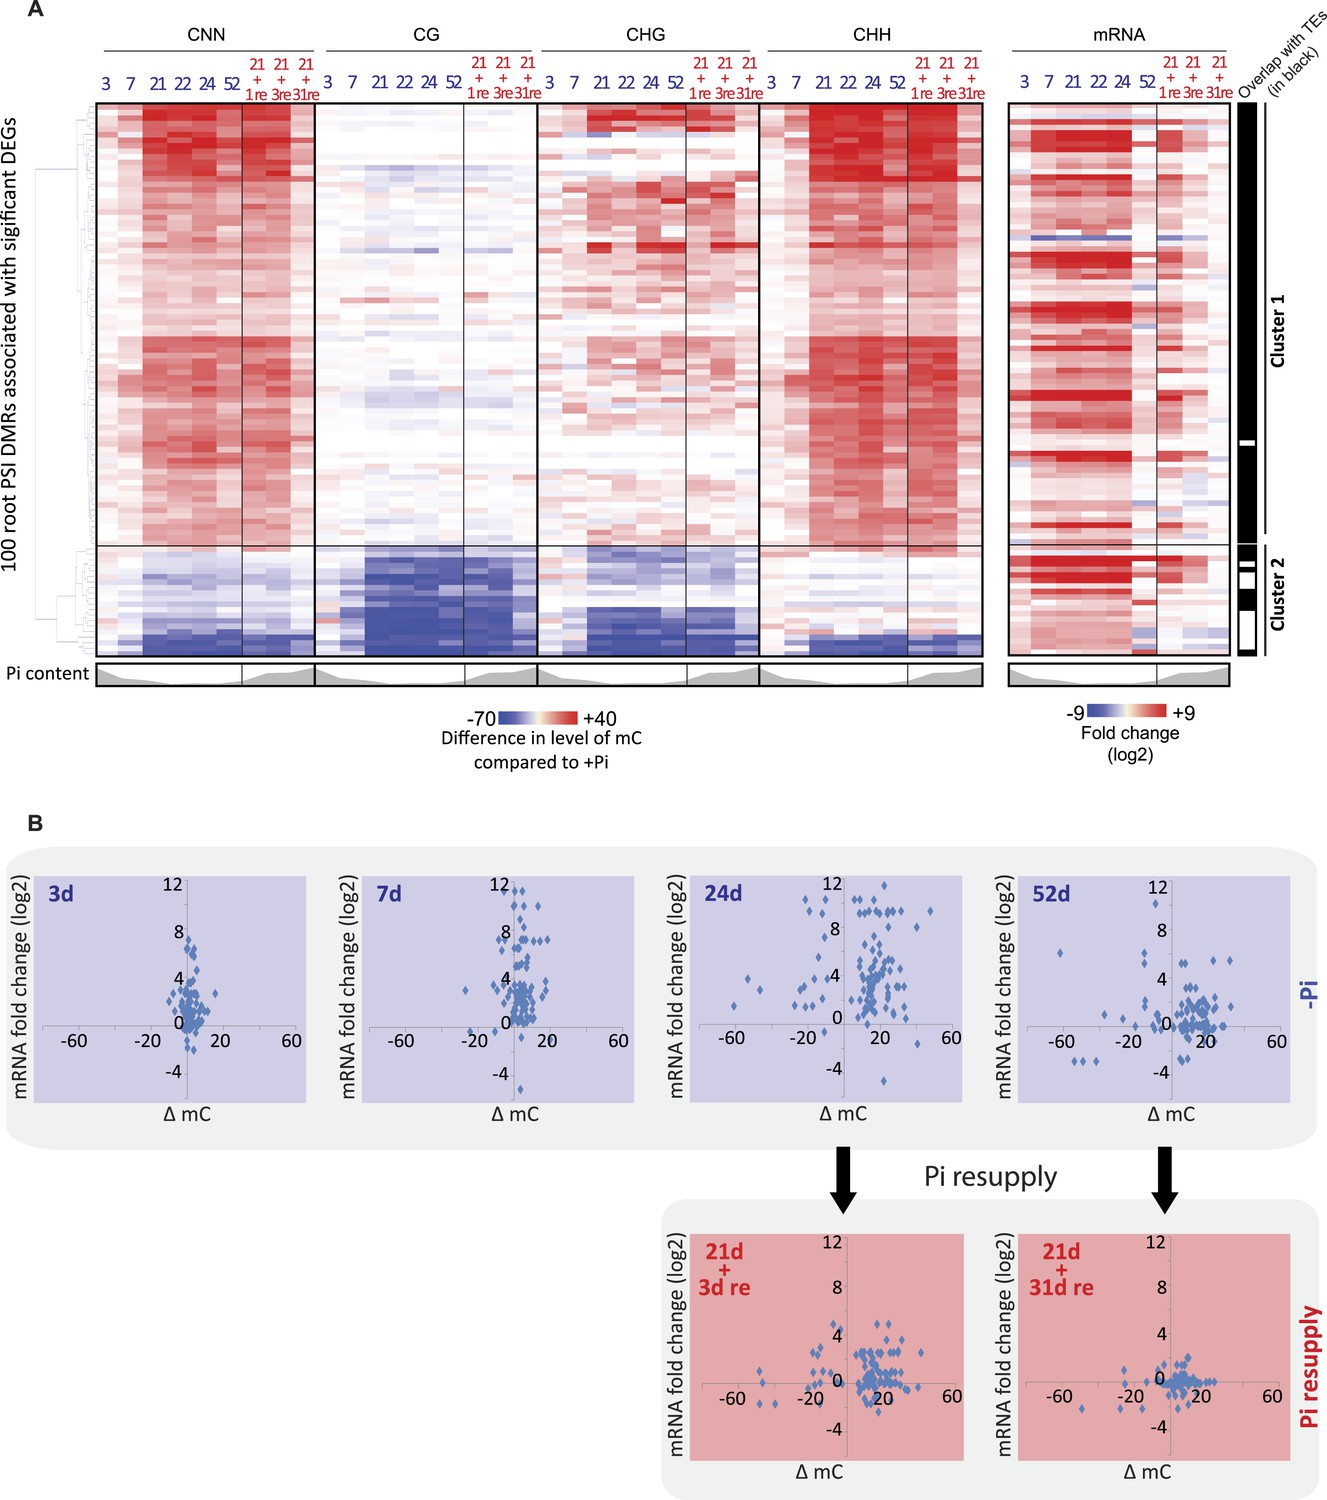
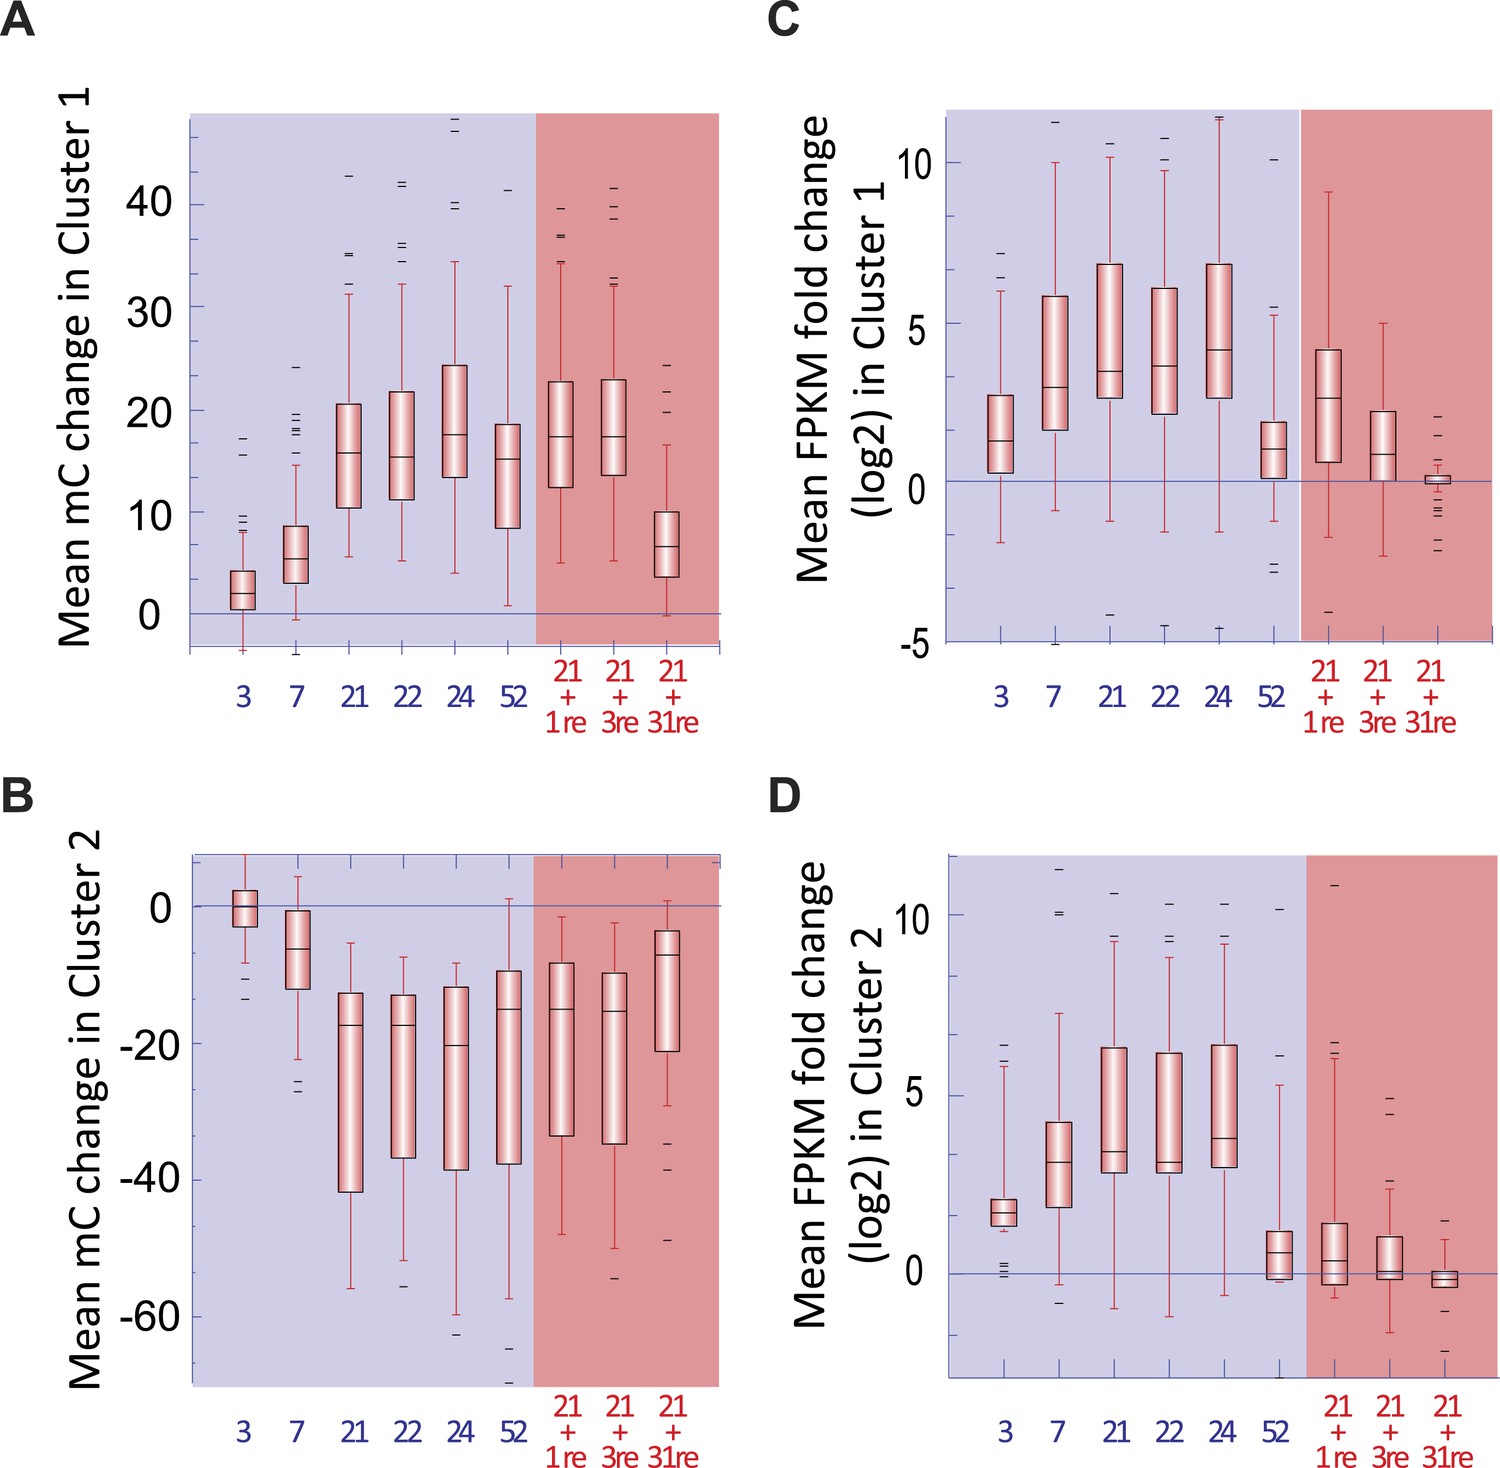
Pi starvation-induced DMRs are enriched at key regulators of Pi homeostasis.
(A) Hierarchical clustering of the differential methylation levels of the 100 root PSI DMRs associated with a significant change in nearby gene expression (DEGs) in response to Pi stress (left panel). Middle panel represents the DMR-associated gene transcript abundance fold change (log2) in response to Pi stresses, while right panel indicates DMRs that overlap with TEs (coloured in black). (B) Scatter plots of the changes in DNA methylation (compared to +Pi) (X) against the changes in gene transcript abundance of the nearby associated gene (FPKM, log2) (Y) for each of the 100 PSI DMRs, at various time points. Blue coloured plots represent Pi starvation [(−Pi) − (+Pi)] while red coloured plots represent Pi resupply [(Pi resupply) − (+Pi)]. Source data for Figure 3 is available at Dryad (Secco et al., 2015).
Figure 3—figure supplement 1
Changes in DNA methylation and gene transcription.
https://doi.org/10.7554/eLife.09343.017
Figure 4 with 2 supplements
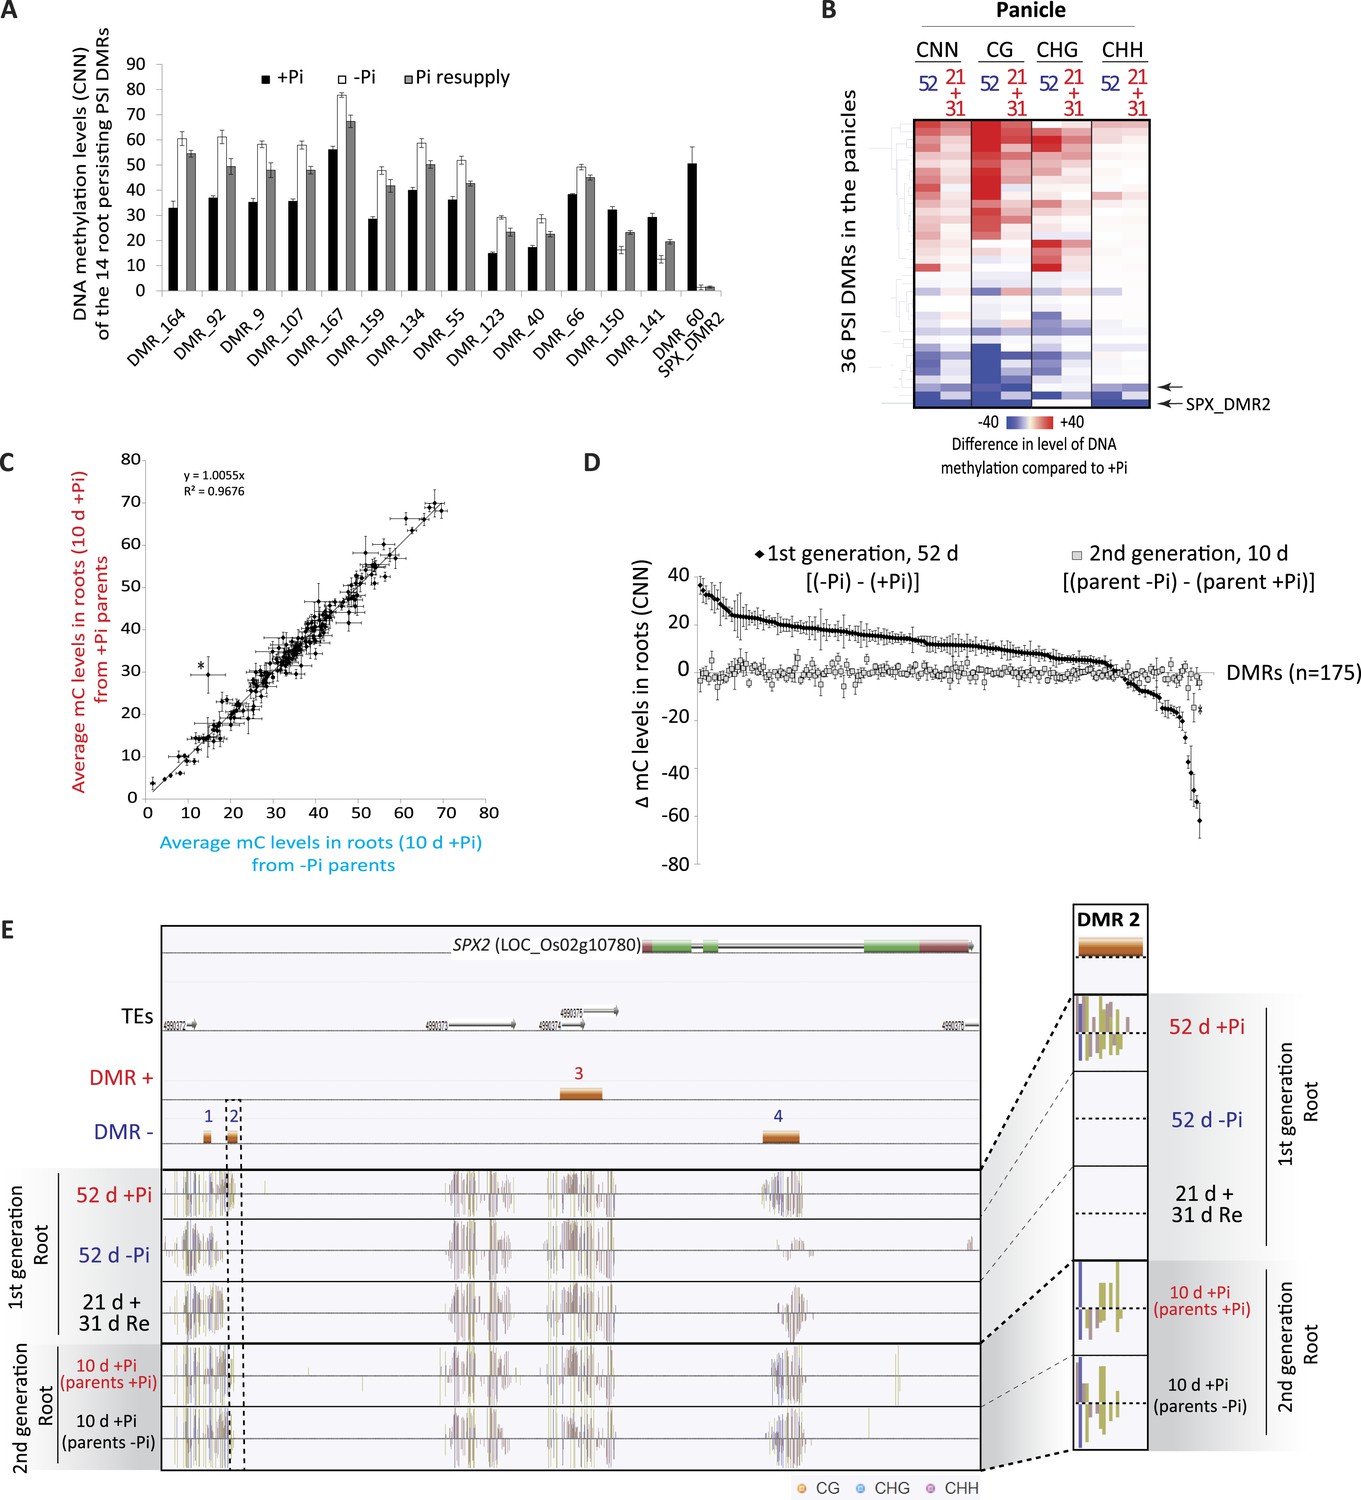
Phosphate starvation induced DMRs are mainly transient.
(A) Methylation levels (CNN) of the 14 regions showing persisting changes in DNA methylation despite 31 days of Pi resupply. Error bars indicates standard error. (B) Hierarchical clustering of the difference in methylation level of the 36 DMRs induced by 52 days of Pi deprivation in the panicles. Arrows indicate significant persisting changes in DNA methylation (t-test, FDR < 0.1). (C) Scatter plots representing the DNA methylation levels of the 175 PSI DMRs in the progeny of Pi deprived and non-stressed parents. Errors bars indicate standard error (n = 5). A linear trendline as well as its equation is shown. (D) Graphical representation of the changes in DNA methylation (CNN) of the 175 PSI DMRs between the first generation after 52 days of Pi treatment [(52d −Pi) − (52d +Pi)] and the offspring of stressed and non-stressed parents grown for 10 days in +Pi. PSI DMRs are sorted based on the change in DNA methylation levels at 52 days, in the first generation. Asterisks represent SPX_DMR2, and error bars indicate standard error. (E) Genome browser screenshot of the SPX2 locus, showing the methylation levels in the first generation at 52 days, as well as in the second generation at 10 days. Source data for Figure 4 is available at Dryad (Secco et al., 2015).
Figure 4—figure supplement 1
Mitotic transmission of Pi starvation-induced changes in DNA methylation.
https://doi.org/10.7554/eLife.09343.022
Figure 4—figure supplement 2
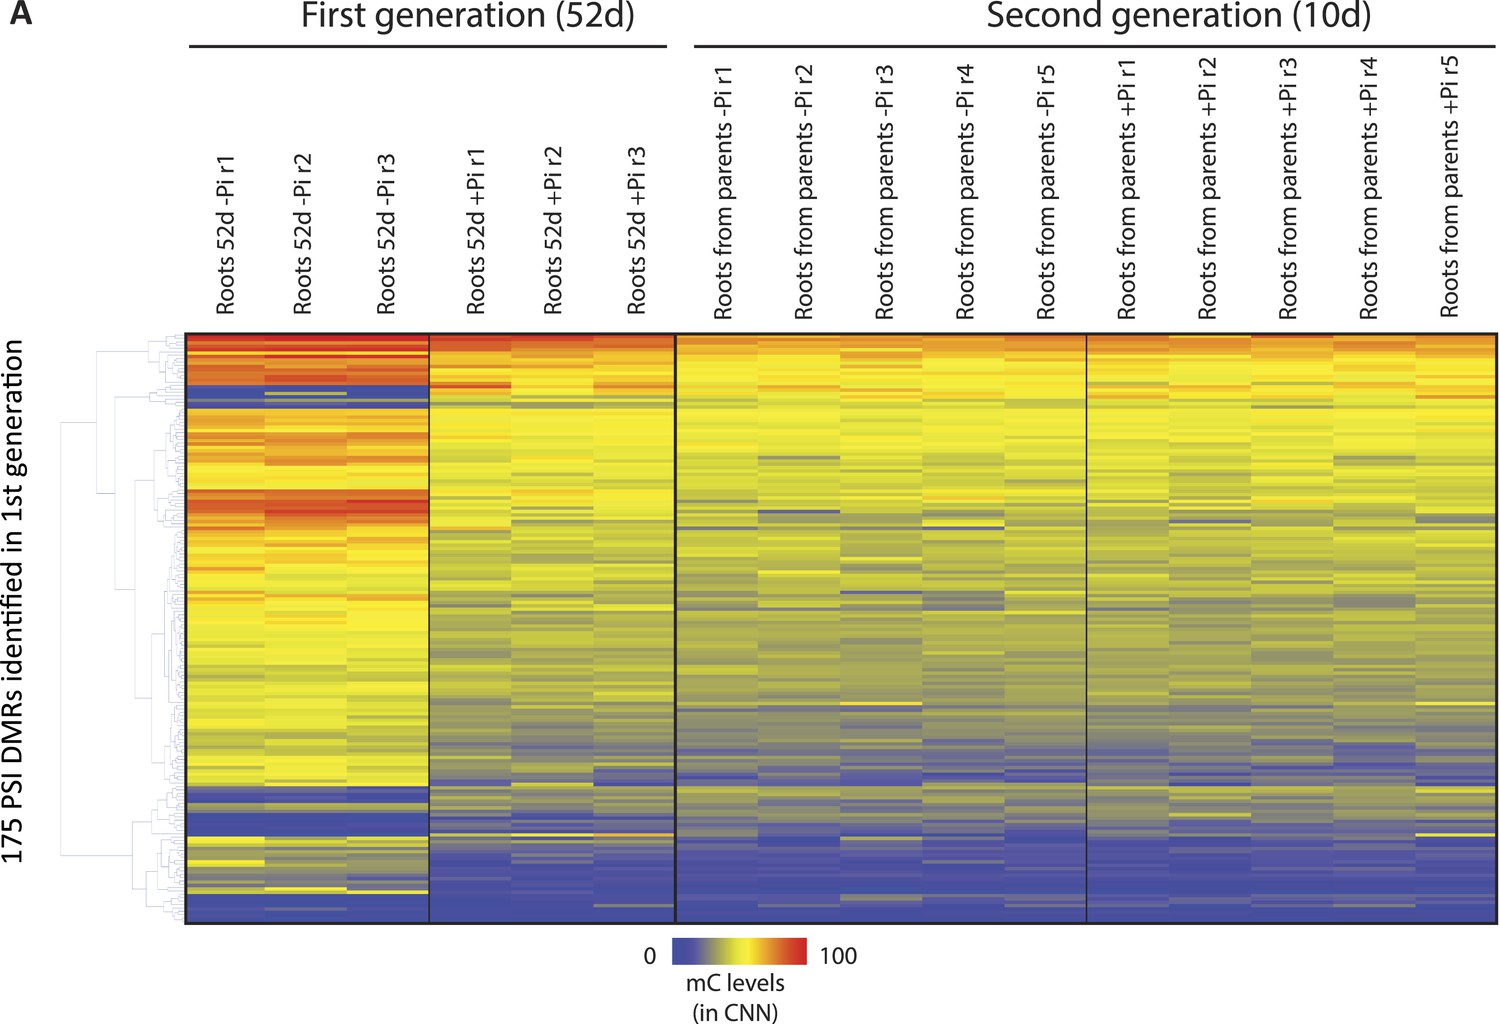
Hierarchical clustering of the methylation levels (CNN context) of the 175 PSI DMRs in the progeny of stressed and non-stressed parents.
https://doi.org/10.7554/eLife.09343.023
Figure 5 with 2 supplements
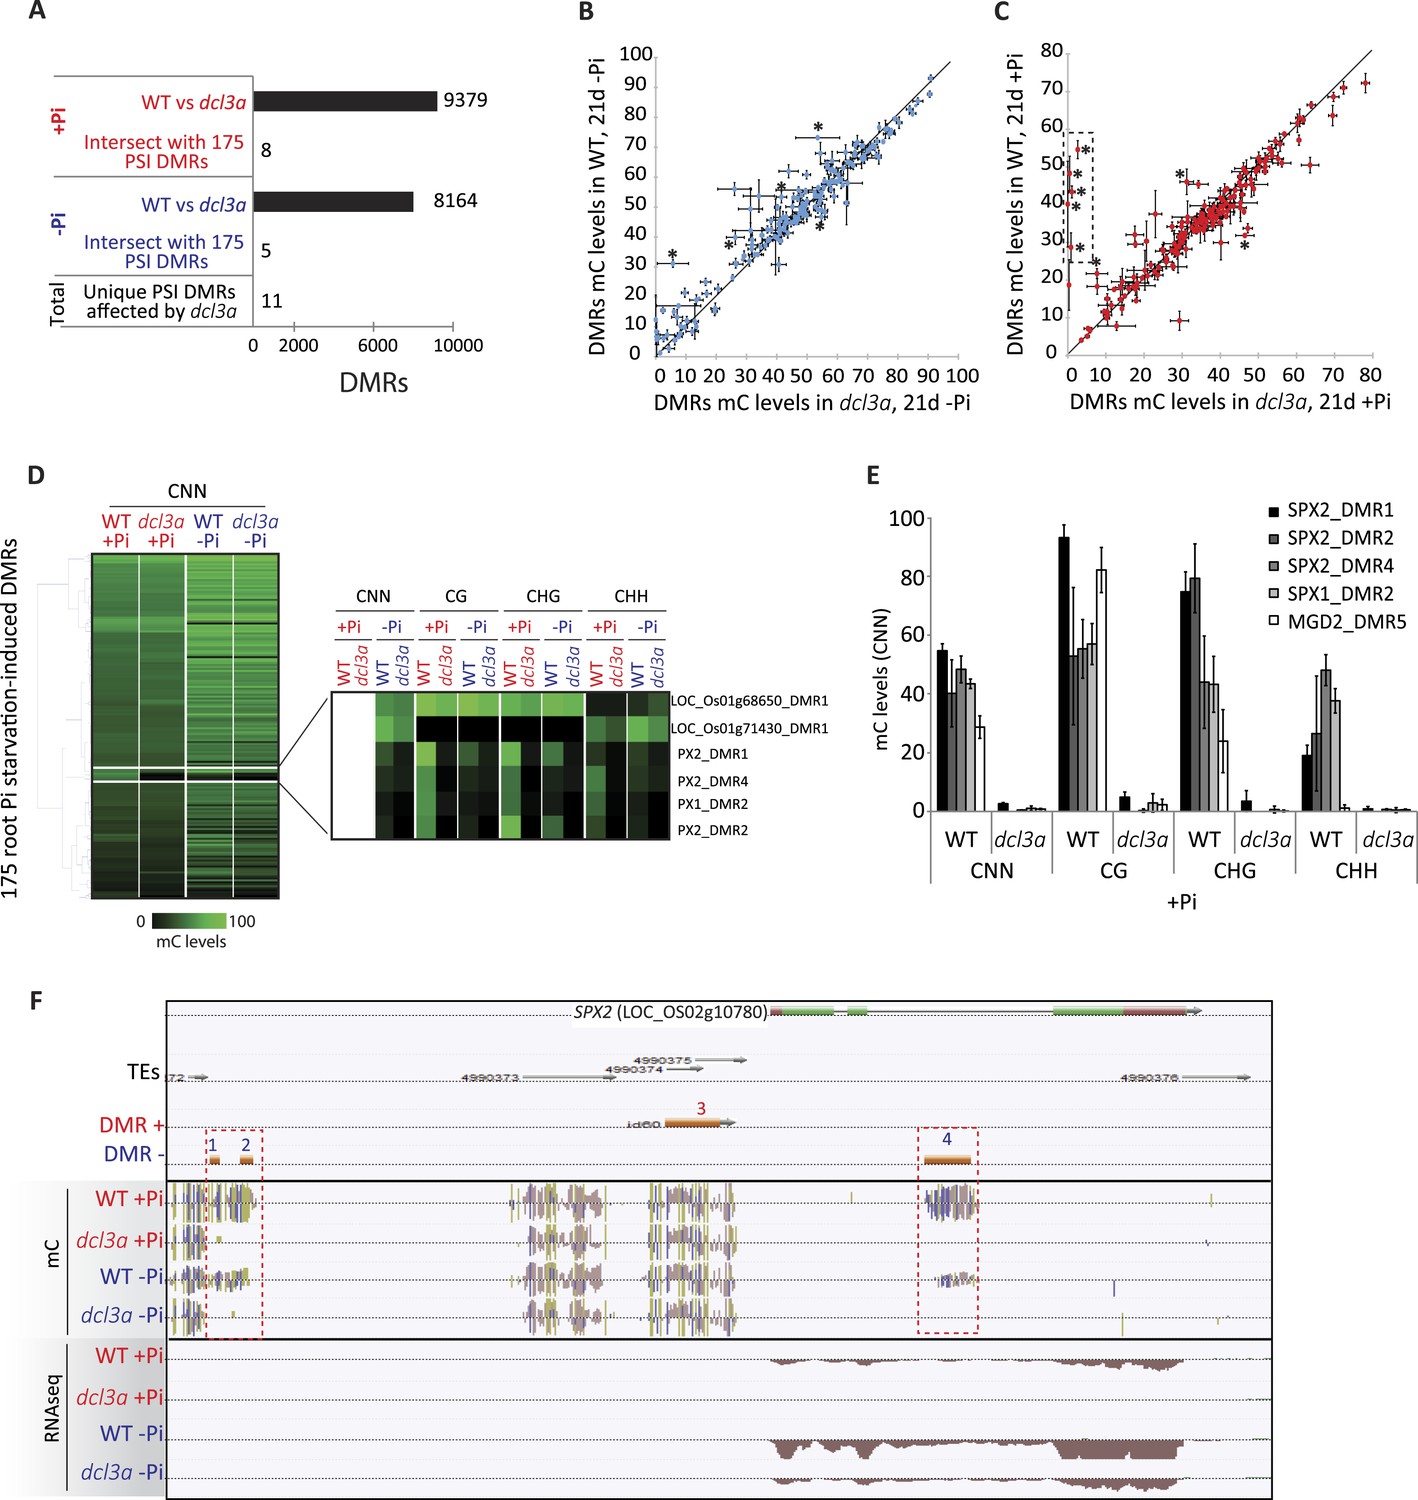
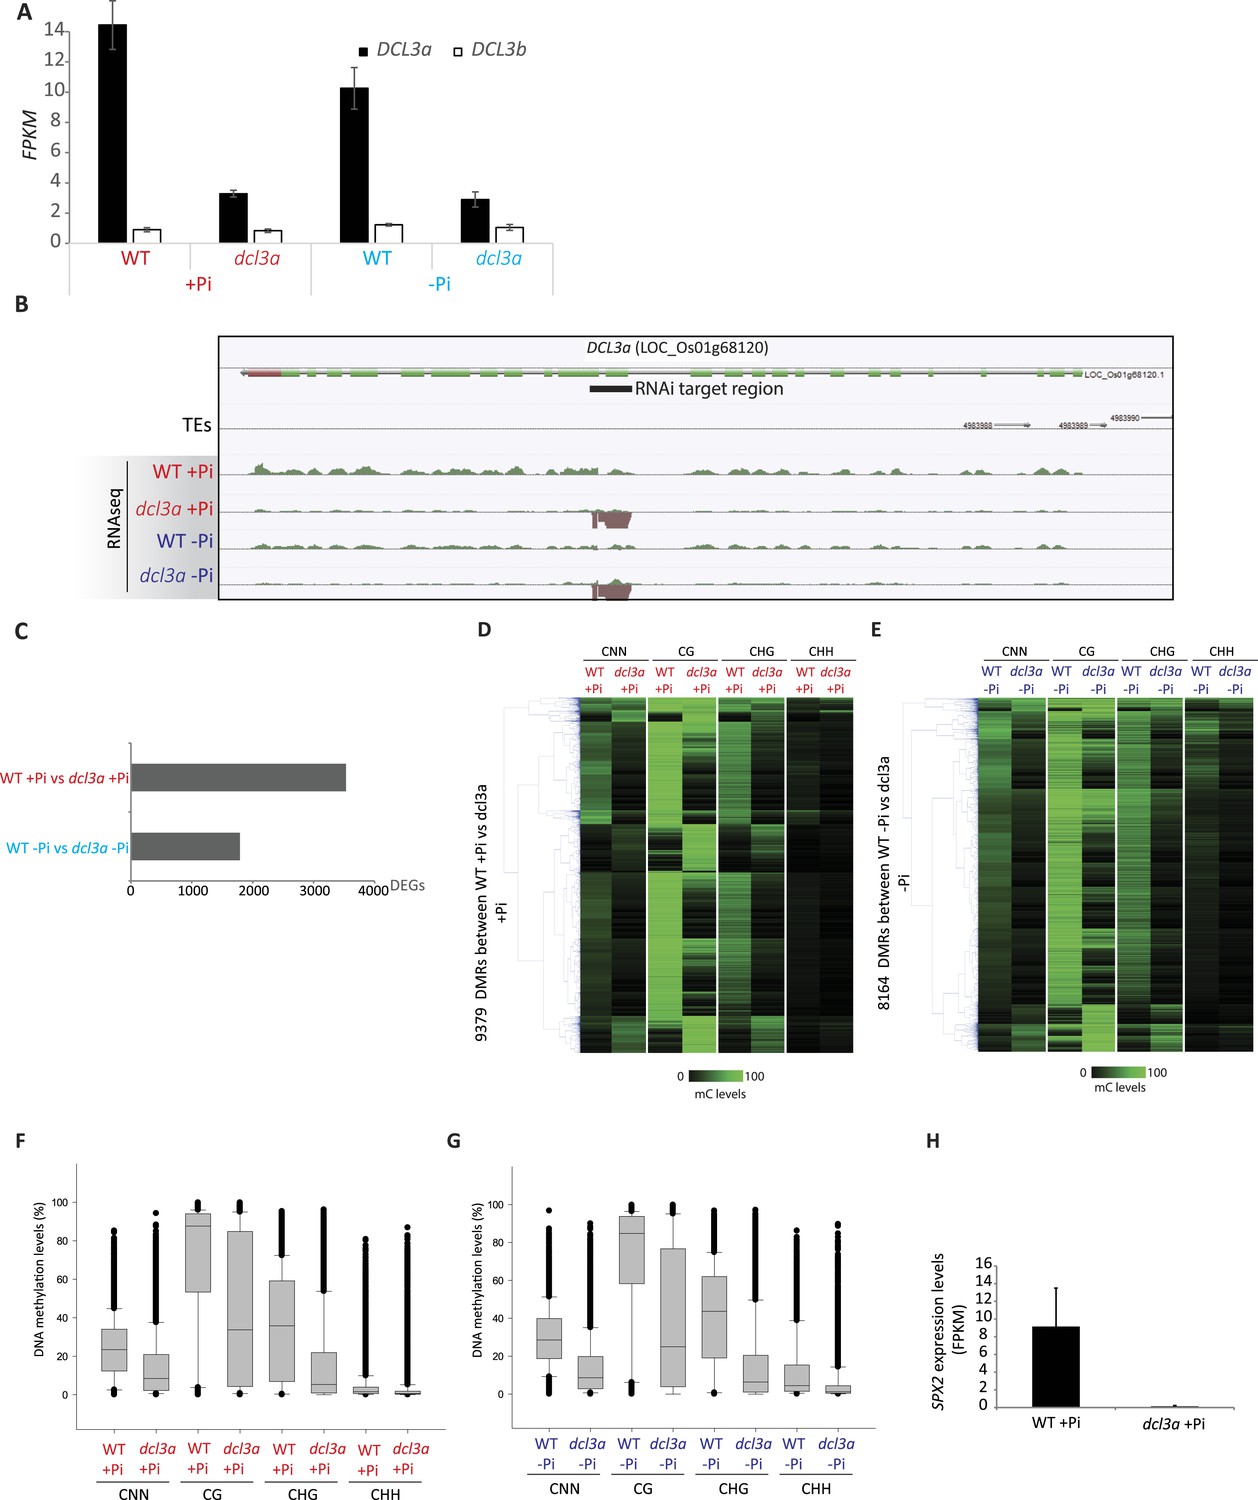
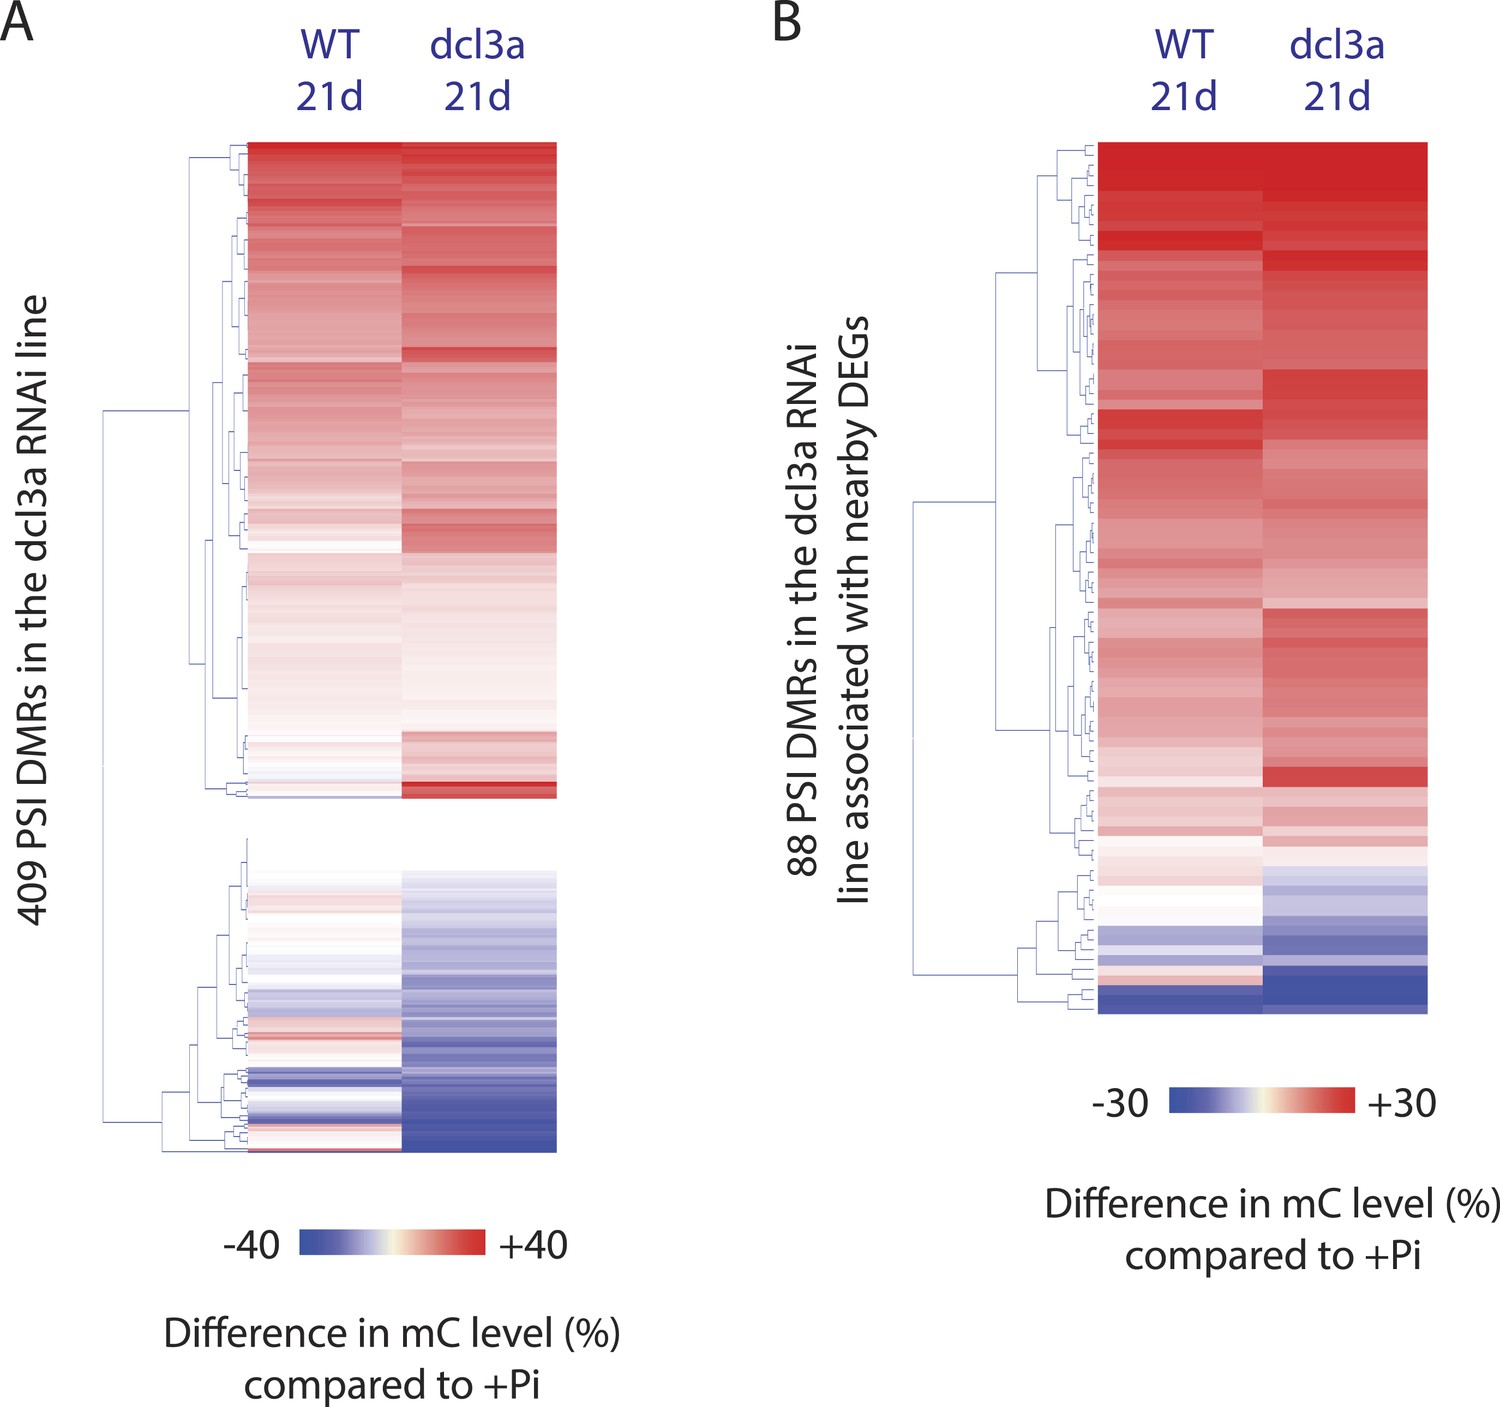
DCL3a knockdown has limited effects on Pi starvation-induced DMRs.
(A) Summary of the number of DMRs identified by comparing WT and DCL3a RNAi line (referred to as dcl3a) root methylomes (21 days) under + and −Pi conditions. For each condition, the DCL3a RNAi line-induced DMRs were intersected with the 175 root PSI DMRs, revealing a total of 11 unique PSI DMRs that are significantly altered in DCL3a RNAi plants. (B and C) DNA methylation levels in the 175 PSI DMRs in the DCL3a RNAi line vs WT under −Pi and +Pi conditions, respectively. Asterisks represent the significant changes (FDR < 0.05) in DNA methylation levels between WT and the DCL3a RNAi line. Black box indicates regions for which the DCL3a RNAi line almost completely abolishes DNA methylation, compared to WT. (D) Hierarchical clustering of the DNA methylation levels in the 175 PSI DMRs in the DCL3a RNAi line vs WT under −Pi (blue) and +Pi (red) conditions. (E) DNA methylation levels in 5 regions significantly affected in the DCL3a RNAi line. (F) Genome browser representation of the SPX2 locus, showing three DCL3a-dependant methylation regions, also responsive to Pi starvation, indicated by red boxes. Source data for Figure 5 is available at Dryad (Secco et al., 2015).
Figure 5—figure supplement 1
Down-regulation of DCL3a.
https://doi.org/10.7554/eLife.09343.028
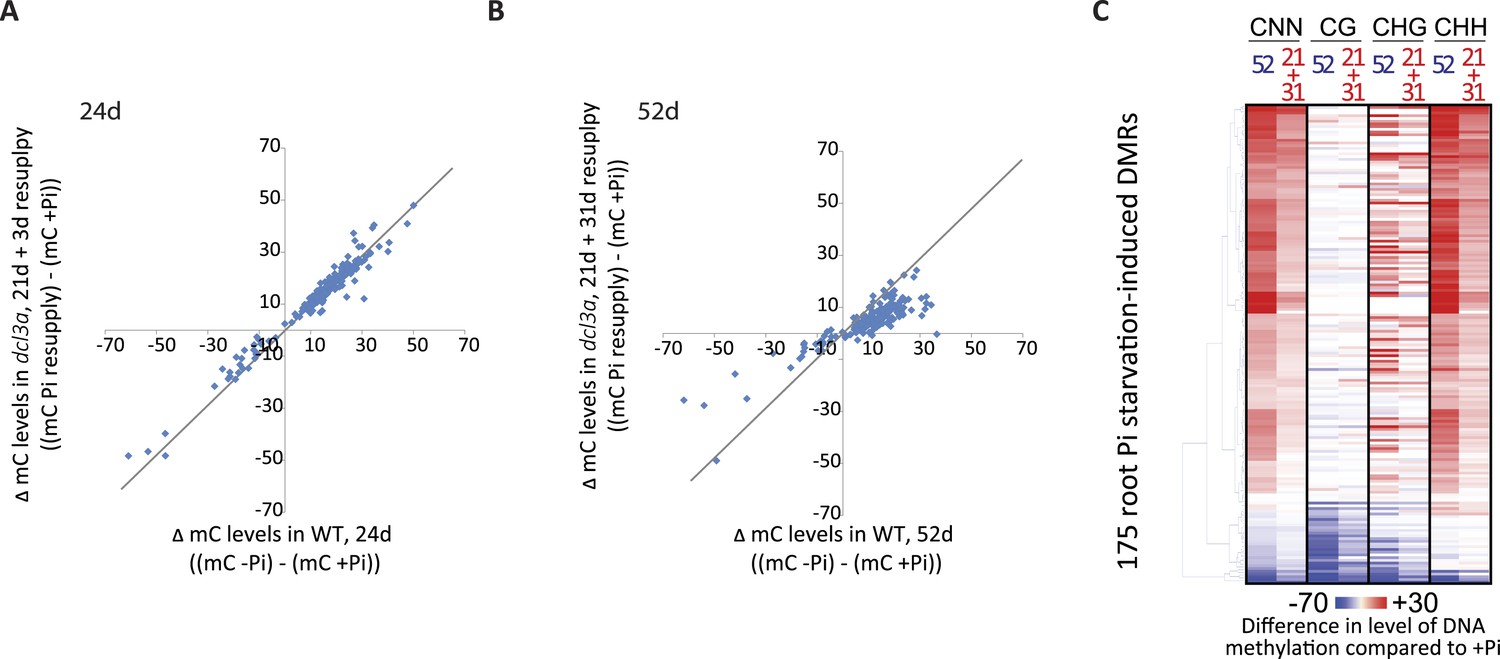
Figure 5—figure supplement 2
Identification of PSI DMRs in the DCL3a RNAi line.
https://doi.org/10.7554/eLife.09343.029
Figure 6

Pi starvation in Arabidopsis results in a limited number of changes in DNA methylation.
(A) Hierarchical clustering of significantly differentially regulated genes upon 10 days of Pi starvation and resupply. Arabidopsis seeds were germinated and grown in either Pi sufficient (500 µM Pi) or deficient (13 µM Pi) for 10 days. After 7 days of treatment, half of the Pi starved plants were re-supplied with 500 µM Pi for 3 days. (B and C) Genome browser representation of the two Arabidopsis PSI DMRs identified in this study (FDR < 0.2). AtCopeg1 (Copia evolved gene 1) is a Copia like transposon previously shown to be induced by Pi starvation (Duan et al., 2008), while MGD3 (monogalactosyl diacylglycerol synthase 3) encodes the major enzyme for galactolipid metabolism during Pi starvation. (C and E) DNA methylation levels in the CNN, CG, CHG and CHH contexts in the three Pi treatments (+Pi, −Pi and Pi resupply) in the DMRs associated with Atcopeg1 and MGD3, respectively. Asterisks represents significant differences in the methylation level (t-test < 0.05). Source data for Figure 6 is available at Dryad (Secco et al., 2015).
Figure 7
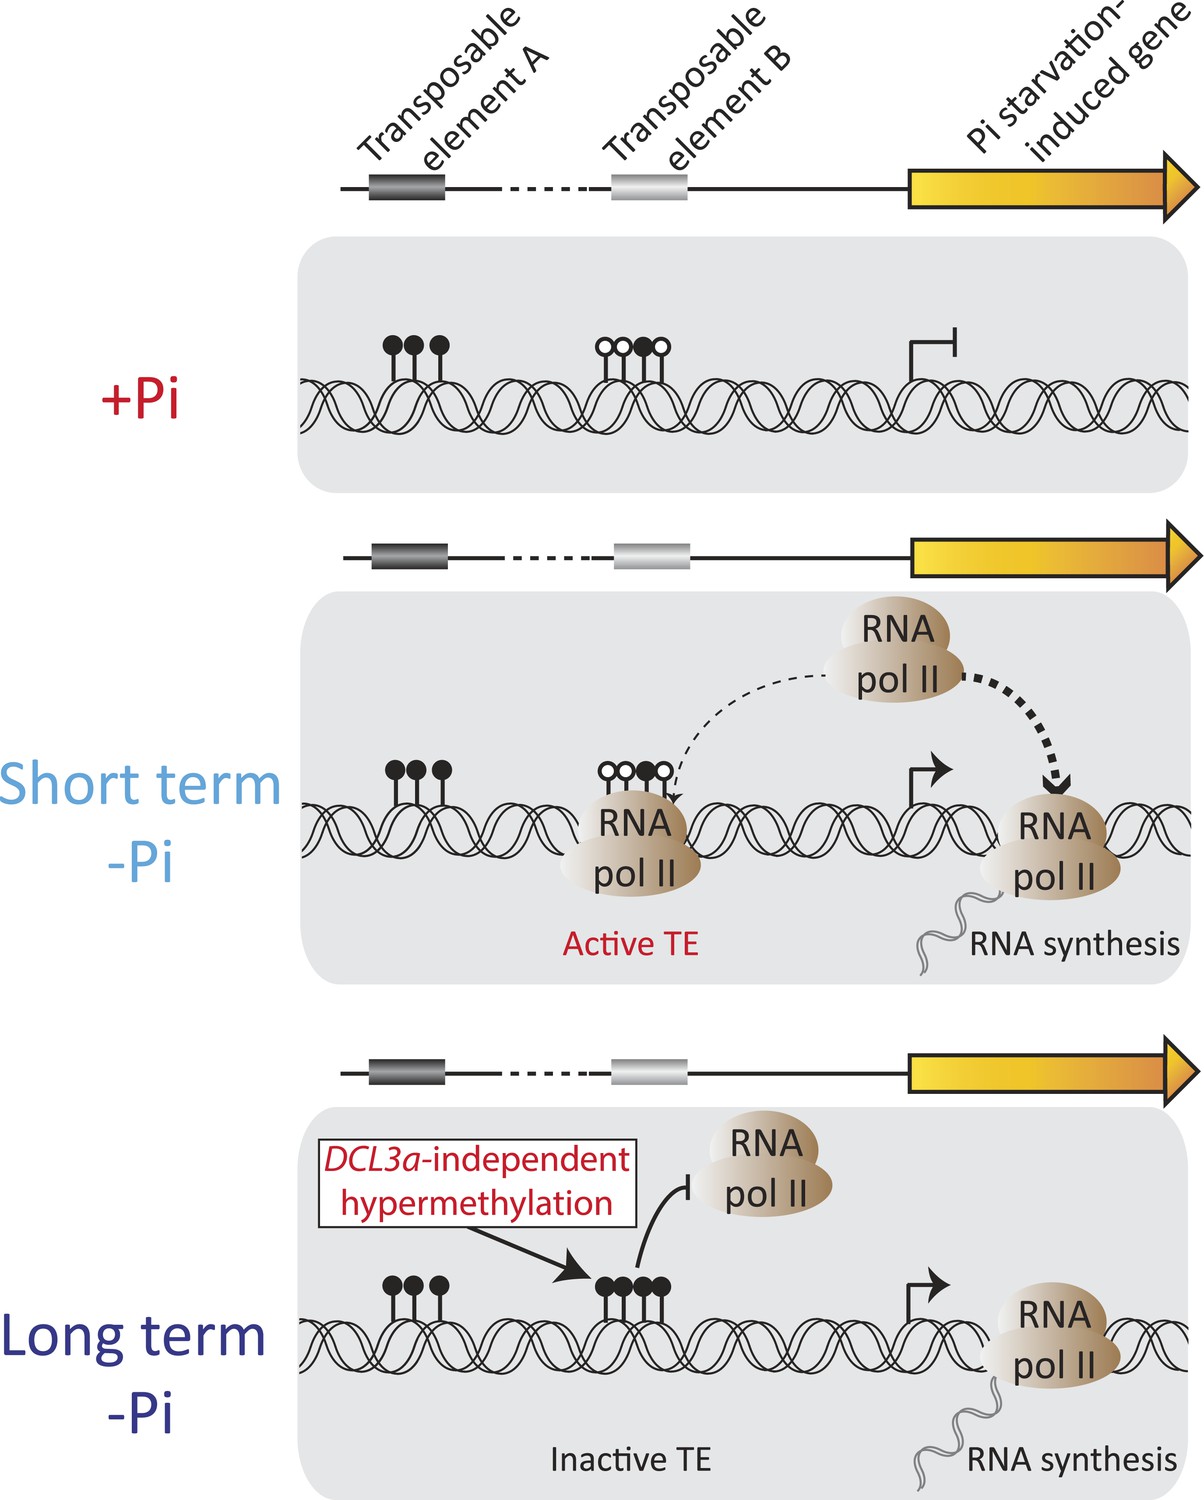
Model of the role of DNA methylation in response to Pi starvation.
Schematic of a PSI gene associated with two TEs. TE A represents TEs that are located distant from genes and are highly methylated, while TE B represents TEs that are close to genes and lowly methylated. Upon short term Pi deprivation, RNA polymerase II is recruited to Pi starvation-induced (PSI) genes, resulting in increased PSI gene expression. These high levels of RNA polymerase II could induce transcription of nearby and poorly methylated TEs, such as TE B, which could have deleterious effects upon the plant. As a consequence, upon prolonged Pi deprivation, TEs that are close to highly expressed stress-induced genes are hypermethylated, via a DCL3a-independent mechanism, thus preventing their transcription via RNA polymerase II. Black and white circles represent methylated and unmethylated cytosines, respectively. Thickness of the dashed lines represents the proportion of RNA polymerase II recruited to PSI genes or TEs.
Author response image 1
Additional files
-
Supplementary file 1
Summary statistics of MethylC-seq reads.
- https://doi.org/10.7554/eLife.09343.033
Download links
A two-part list of links to download the article, or parts of the article, in various formats.
Downloads (link to download the article as PDF)
Open citations (links to open the citations from this article in various online reference manager services)
Cite this article (links to download the citations from this article in formats compatible with various reference manager tools)
Stress induced gene expression drives transient DNA methylation changes at adjacent repetitive elements
eLife 4:e09343.
https://doi.org/10.7554/eLife.09343


