Functional genomic screening reveals asparagine dependence as a metabolic vulnerability in sarcoma
- Harvard University, United States
- Dana-Farber Cancer Institute, United States
- Charité, University Hospital Berlin, Germany
- University of Freiburg, Germany
- Harvard Medical School, United States
- Broad Institute of Harvard and MIT, United States
- University of Maryland, Baltimore County, United States
- Tufts University Veterinary School, United States
- Indiana University - Purdue University Indianapolis, United States
Figures
Figure 1 with 1 supplement
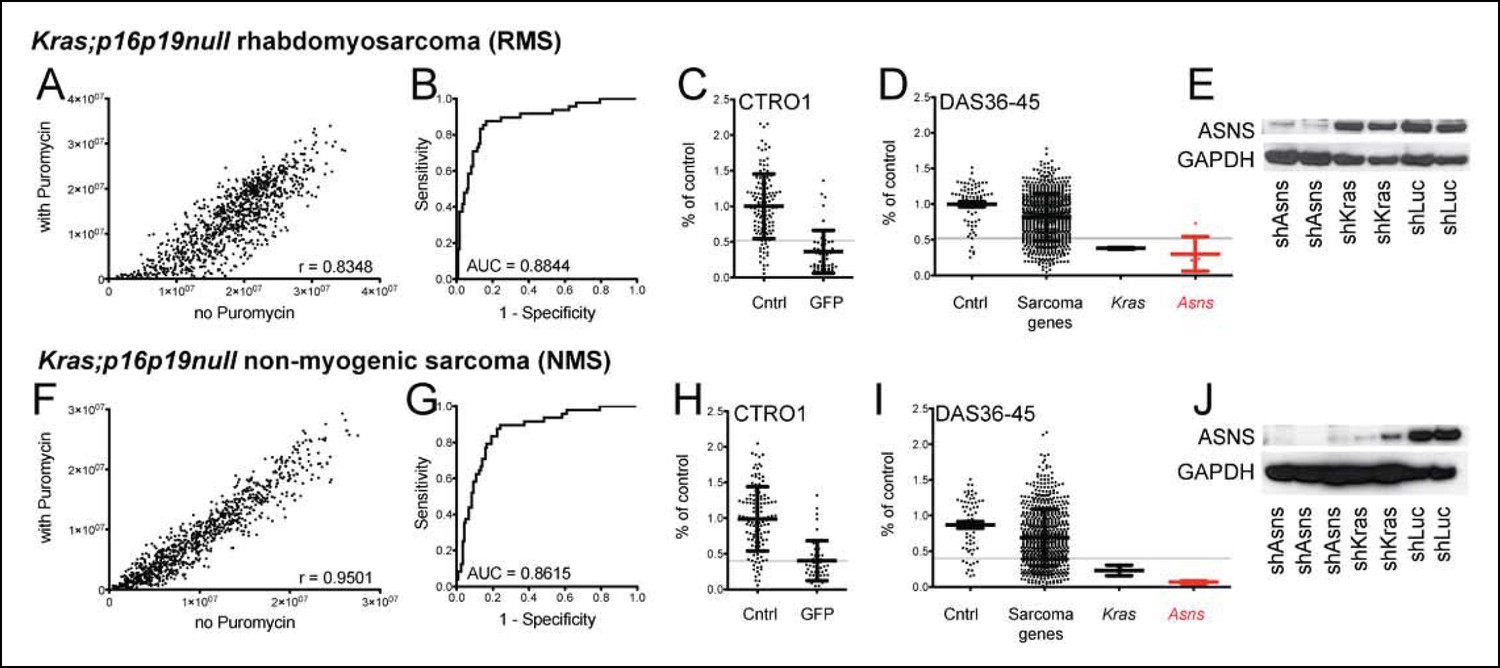
Functional genomic screening identified asparagine synthetase (ASNS) as a high-priority sarcoma target.
141 sarcoma-relevant genes were identified by prior transcriptional profiling of genetically engineered Kras;p16p19null mouse rhabdomyosarcomas (RMS) and non-myogenic sarcomas (NMS) (Hettmer et al., 2011). (A–D, F–I) The contributions of each of the 141 sarcoma-relevant genes to sarcoma cell proliferation were determined by customized shRNA screening. (B–D, G–I). The screen contained a control set, including cells exposed to shLUC, shRFP, shLACZ (cntrl; predicted to have no effect on cell proliferation) and cells exposed to shGFP (GFP; predicted to silence Kras (G12V)-IRES-GFP and reduce cell proliferation). (B,G) Receiver operator curve analysis using cntrl-shRNA-infected cells as negative and shGFP-infected cells as positive controls determined a false discovery rate of <30% for shRNAs associated with a reduction in proliferation to <52% of the average of cntrl-shRNA-infected RMS cells (grey line in panel C) and to <40% of cntrl-shRNA-infected NMS cells (grey line in panel H). (D, I) The shRNA screen included cells exposed to shLUC, shRFP, shLACZ (cntrl), shKRAS and shRNAs directed against each of the 141 candidate genes (5 shRNAs per gene). ShRNAs directed against the gene encoding Asparagine Synthetase (Asns) showed the strongest effect on NMS and RMS proliferation (p<0.0001, q<0.01, 4–5 of 5 shRNAs with FDR<30%). (E–J) Effective ASNS knockdown by the shRNAs used in the screen was confirmed by Western blot. See Supplementary files 1–4 for raw data from the shRNA screen, and Supplementary files 5–6 for scores for each of the 141 candidate genes. Significance levels were defined as follows: 1, 5 shRNAs with FDR<30%; 2, 4 shRNAs with FDR<30%; 3, 3 shRNAs with FDR<30%.
Figure 1—figure supplement 1
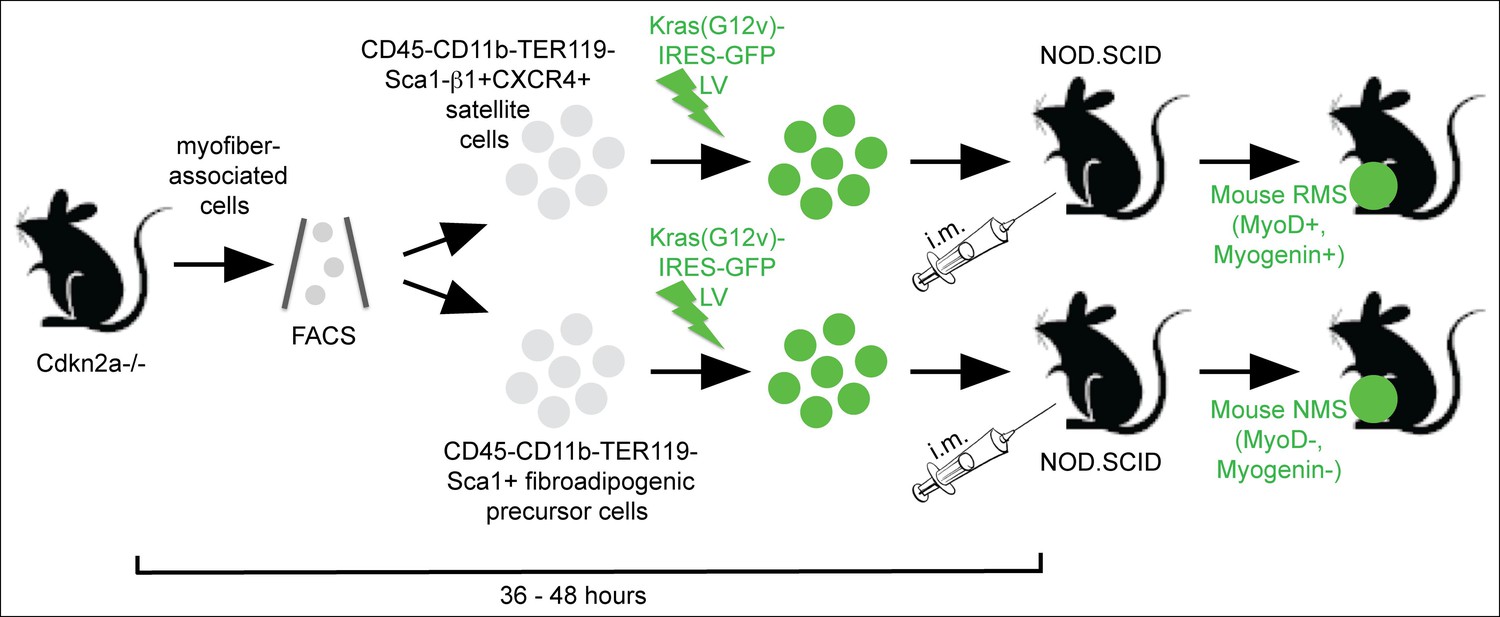
Sarcoma induction strategy.
Muscle satellite cells and fibroadipogenic precursor cells were isolated by FACS according to the indicated cell surface markers from mouse skeletal muscle freshly dissected from Cdkn2a-/-(p16p19null) mice. Freshly sorted cells were transduced with oncogenic Kras using a Kras (G12v)-IRES-GFP lentivirus, and transduced cells were implanted into the cardiotoxin pre-injured extremity muscles of NOD. SCID mice by intramuscular (i.m.) injection within 36–48 h from cell isolation. The myogenic differentiation status of the resulting Ras-driven sarcomas generated in this system was largely dependent on the cell type transduced: satellite cells typically gave rise to rhabdomyosarcoma (RMS; MyoD +, Myogenin + ), whereas the identical oncogenetic lesions introduced into fibroadipogenic precursors within the MFA cell pool almost always produced sarcomas lacking myogenic differentiation features (MyoD-, Myogenin-; non-myogenic sarcomas, NMS) (Hettmer et al., 2011).
Figure 2 with 3 supplements
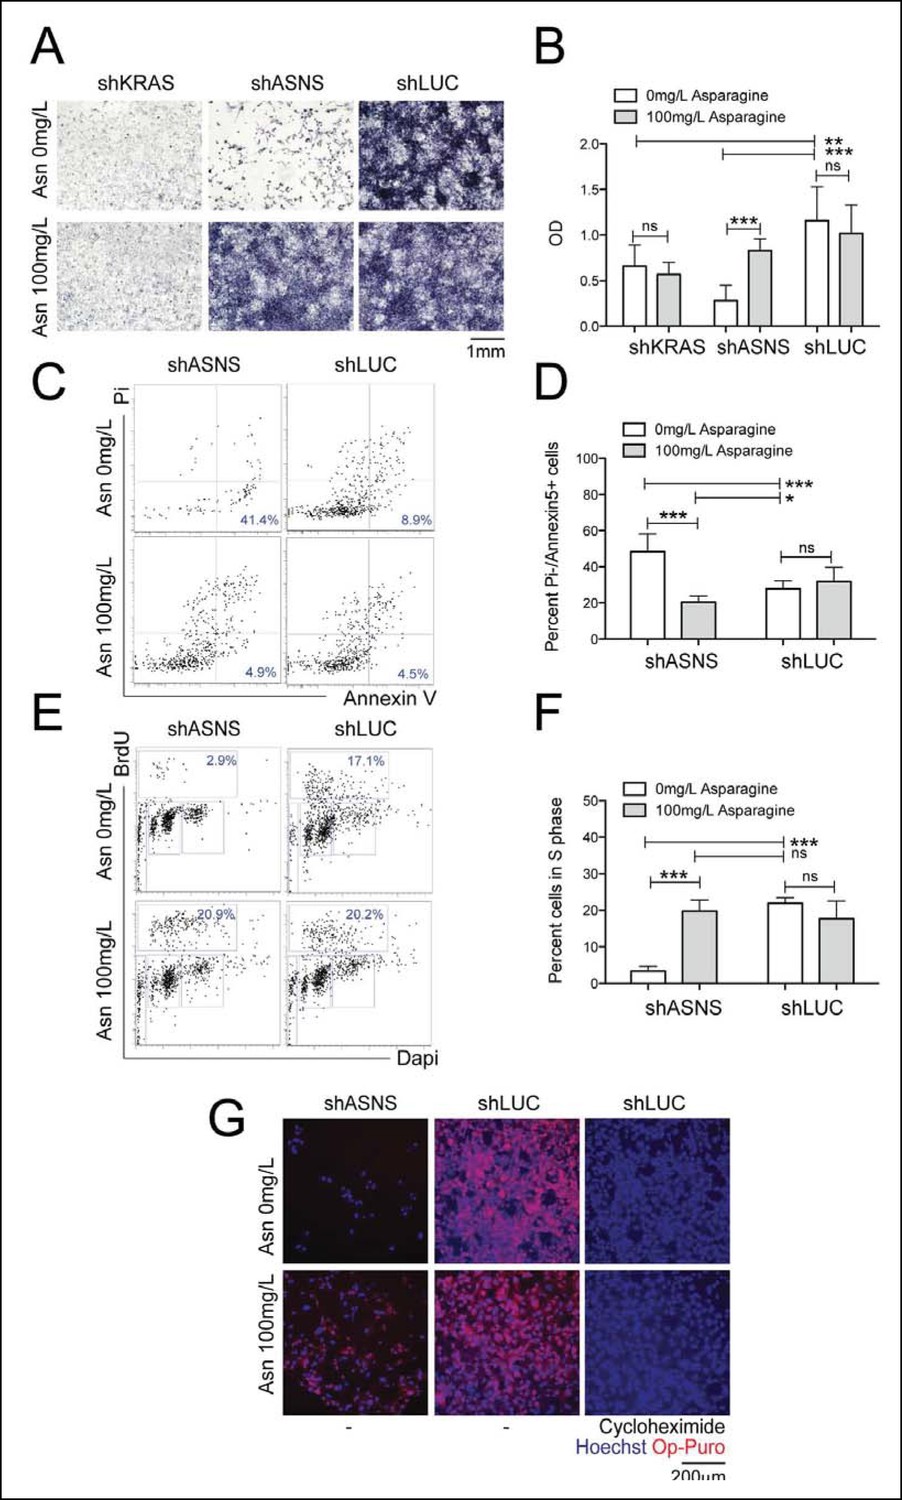
Reduced growth of mouse Kras;p16p19null RMS cells after Asns silencing is associated with inhibition of polypeptide synthesis.
(A–B) ShRNA-mediated silencing of Asns and Kras in a mouse Kras;p16p19null RMS cell line reduced proliferation activity compared to shLUC-infected control cells as measured by MTT uptake. Asparagine supplementation (100 mg/L) in the tissue culture medium reversed the anti-proliferative effects of shASNS but not shKRAS. (C–F) Asns silencing increased the (C–D) percentage of apoptotoc (PI-/Annexin5+) cells and reduced the (E–F) percentage of S phase cells as determined by BrdU staining, compared to shLUC-infected control cells. Both effects were reversed by exogenous Asparagine supplementation (100 mg/L). (G) Polypeptide synthetic activity was determined by OP-puromycin staining. Absent OP-puromycin staining in cells treated with cycloheximide (right panels), an inhibitor of protein translation, validated the experimental approach. Asns silencing reduced polypeptide synthesis in Kras;p16p19null RMS cells (top left panel), and polypeptide synthesis was restored in shASNS RMS cells by Asparagine supplementation (bottom left panel). (A–F) Data were evaluated for statistical significance by T-tests (ns p≥0.05, *p<0.05, **p<0.01, ***p <0.001). See Figure 2—figure supplement 1 for similar effects of Asns silencing in mouse Kras;p16p19null NMS cells.
Figure 2—figure supplement 1
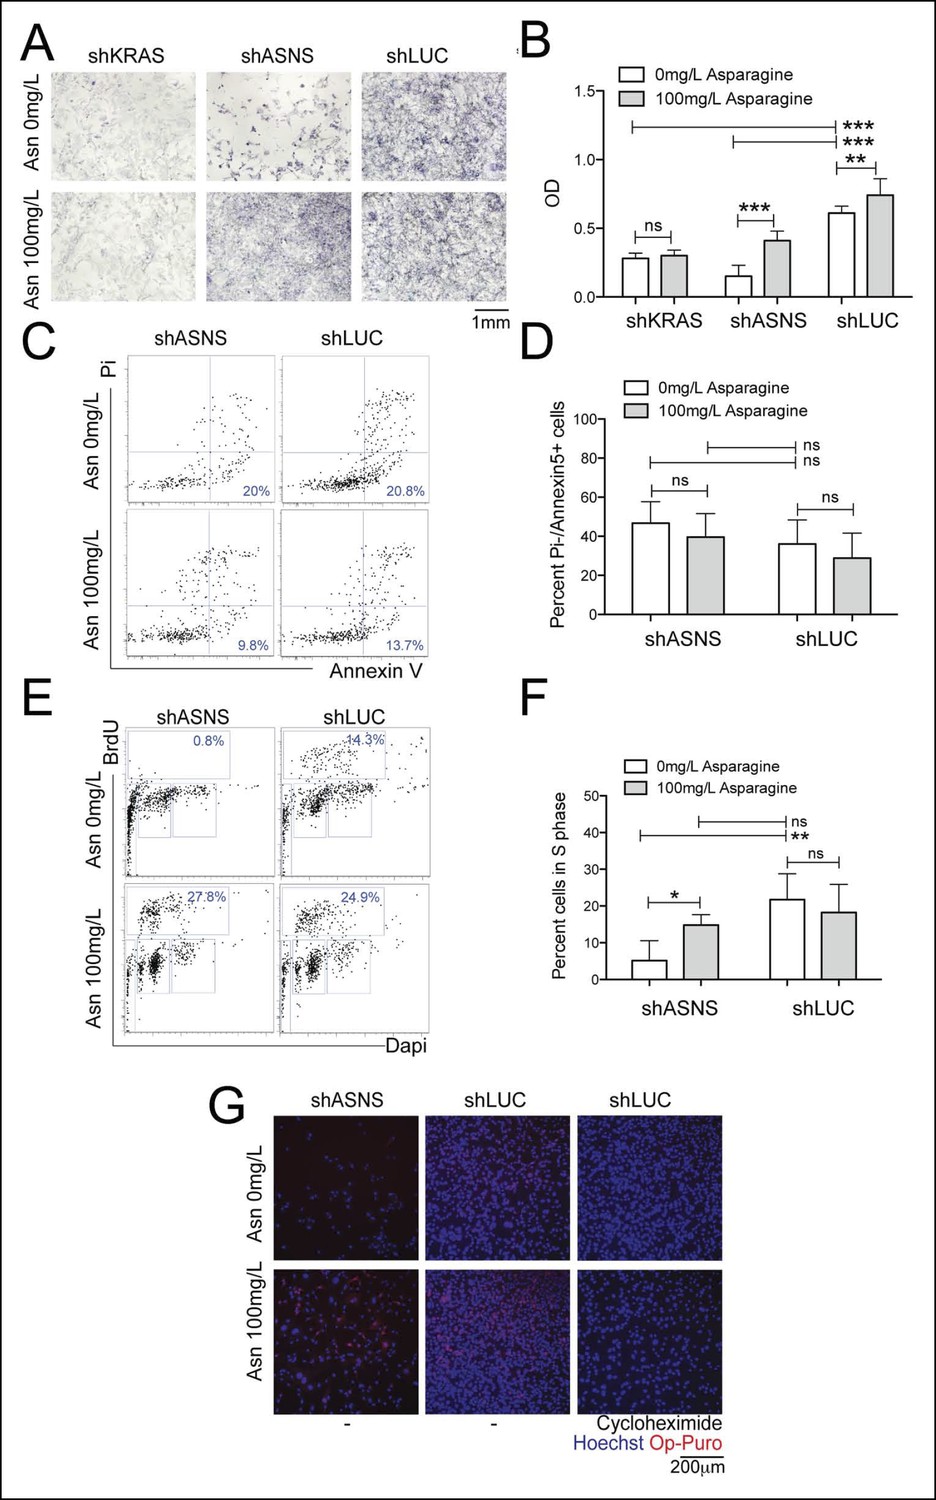
Reduced mouse Kras;p16p19null NMS cell growth after Asns silencing was associated with reduced polypeptide synthesis.
(A–B) ShRNA-mediated silencing of Asns and Kras in a mouse Kras;p16p19null NMS cell line reduced proliferation activity compared to shLUC-infected control cells as measured by MTT uptake. Asparagine supplementation (100 mg/L) in the tissue culture medium reversed the anti-proliferative effects of shASNS, but not shKRAS. (C–D) Asns silencing did not change the percentage of PI-/Annexin5+ apoptotic cells. (E–F) Asns silencing reduced the percentage of cells in S phase as determined by BrdU staining, compared to shLUC-infected control cells. This effect was reversed by exogenous Asparagine supplementation. (G) Polypeptide synthetic activity was determined by OP-puromycin staining. Absent OP-puromycin staining in cells treated with cycloheximide (right panels) validated the experimental approach. Asns silencing reduced polypeptide synthesis in Kras;p16p19null NMS cells (top left panel), and polypeptide synthesis was restored in shASNS RMS cells by Asparagine supplementation (bottom left panel) (ns p≥0.05, * p<0.05, ** p<0.01, *** p <0.001; as determined by T-tests).
Figure 2—figure supplement 2
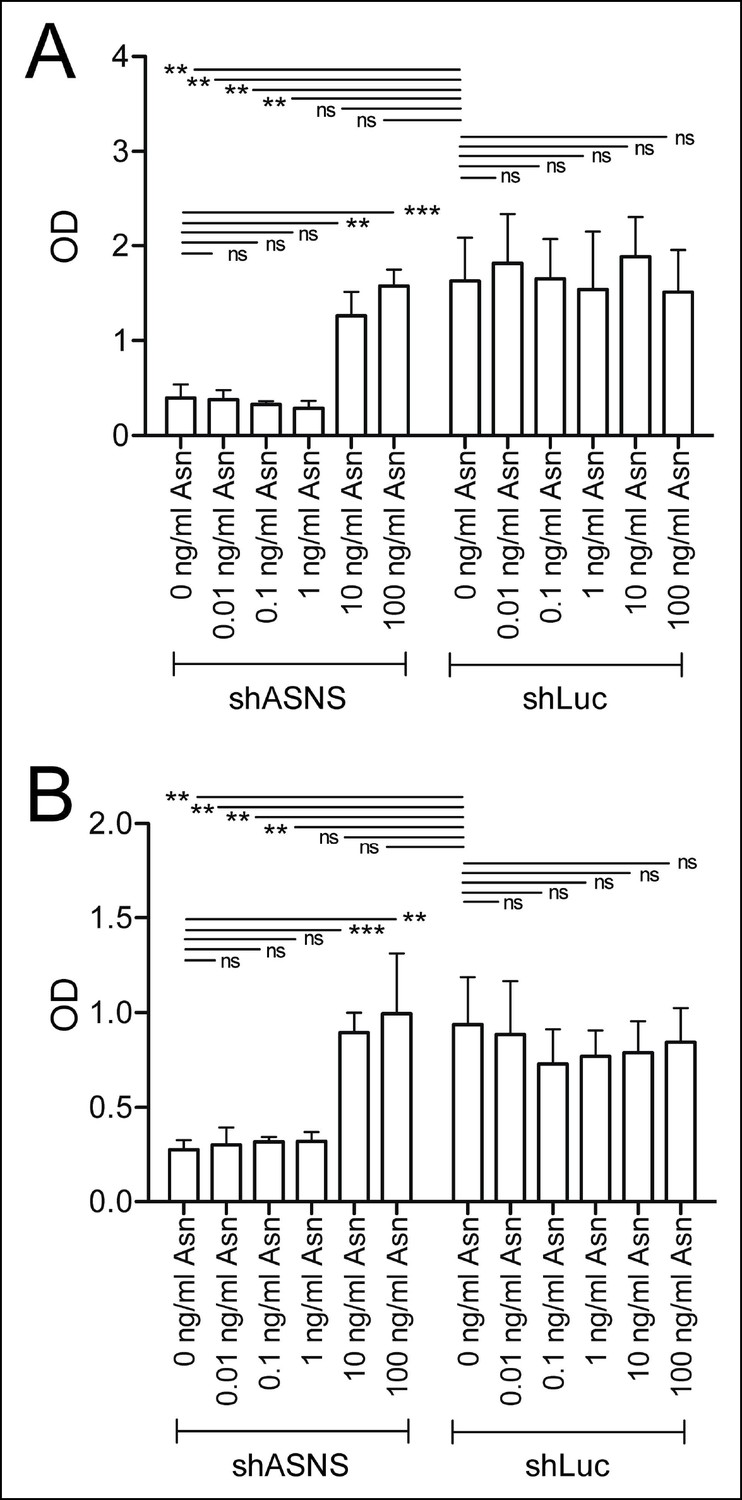
Asparagine concentrations of 10 or 100 mg/L reverse the effects of ASNS silencing on sarcoma growth.
Kras;p16p19null RMS and NMS cells were transduced with shASNS- and shLUC-lentivirus. Transduced cells were cultured in the presence of increasing concentrations of asparagine (0.01 – 100 mg/L). Asparagine at 10 or 100 mg/L reversed the growth-inhibitory effects of ASNS silencing on Kras;p16p19null RMS (A) and NMS cells (B; ns p≥0.05, * p<0.05, ** p<0.01, *** p <0.001; as determined by T-tests).
Figure 2—figure supplement 3
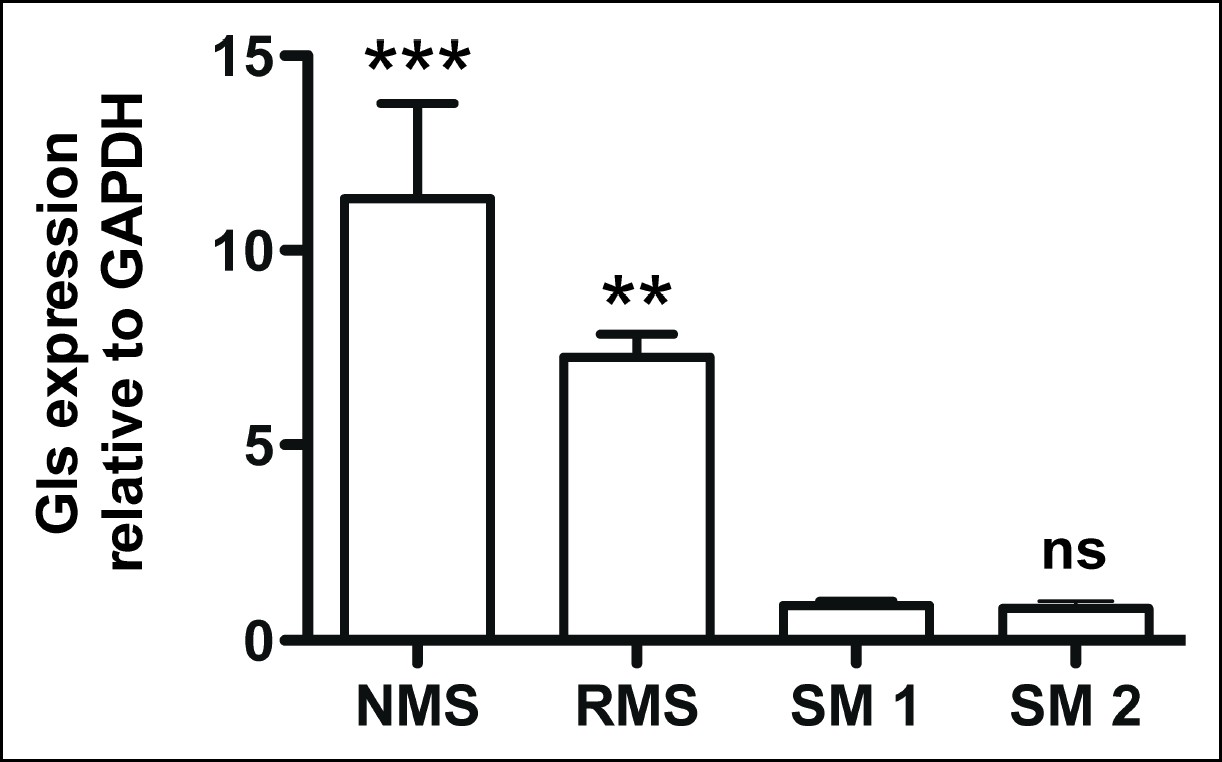
Glutaminase expression in mouse Kras;p16p19null sarcoma cells.
Mouse Kras;p16p19null RMS and NMS cells express 7- to 11-fold higher Glutaminase levels compared to mouse skeletal muscle (SM; ns p≥0.05, * p<0.05, ** p<0.01, *** p <0.001; as determined by T-tests compared to normal muscle sample SM1).
Figure 3
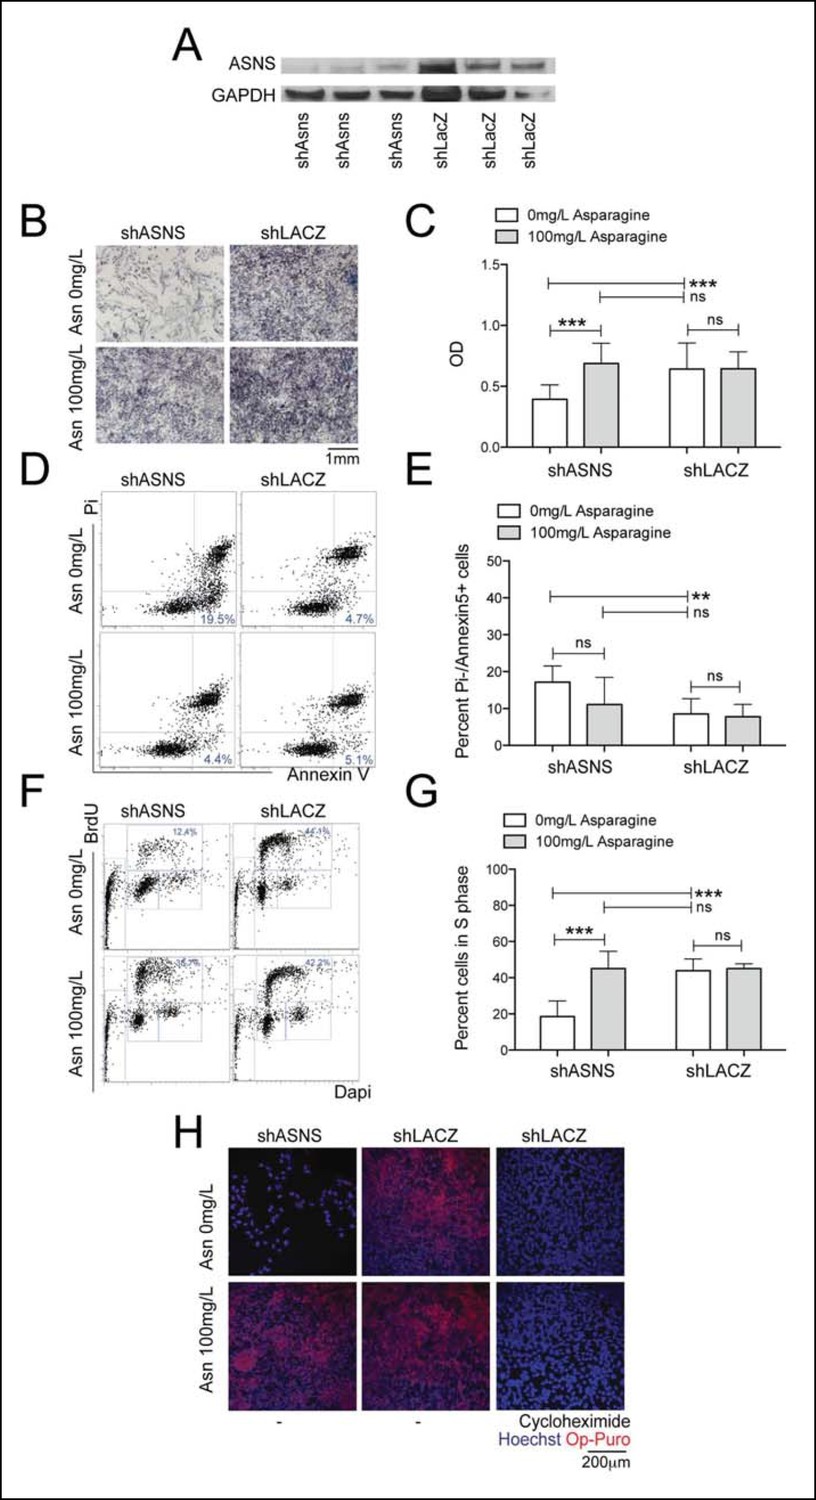
Reduced growth of human Rh30 RMS cells after ASNS silencing is associated with reduced polypeptide synthesis.
(A) ShRNA-mediated silencing of ASNS in Rh30 cells was validated by Western Blot. (B–C) ASNS silencing reduced proliferation compared to shLACZ-infected control cells as measured by MTT uptake. Asparagine supplementation (100 mg/L) in the tissue culture medium reversed the anti-proliferative effects of shASNS. (D–G) ASNS silencing increased the (D–E) percentage of apoptotic (PI-/Annexin5+ ) cells and reduced the (F–G) percentage of S-phase cells , as compared to shLACZ-infected control cells. (F–G) Exogenous Asparagine supplementation reversed shASNS effects on cell cycle progression. (H) Polypeptide synthetic activity was determined by OP-puromycin staining. Absent OP-puromycin staining in Rh30 cells treated with cycloheximide (right panels) validated the experimental approach. ASNS silencing reduced polypeptide synthesis (top left panel), and polypeptide synthesis was restored in shASNS RMS cells by Asparagine supplementation (bottom left panel). (B–G) Data were evaluated for statistical significance by T-tests (ns p≥0.05, * p<0.05, ** p<0.01, *** p <0.001).
Figure 4 with 1 supplement
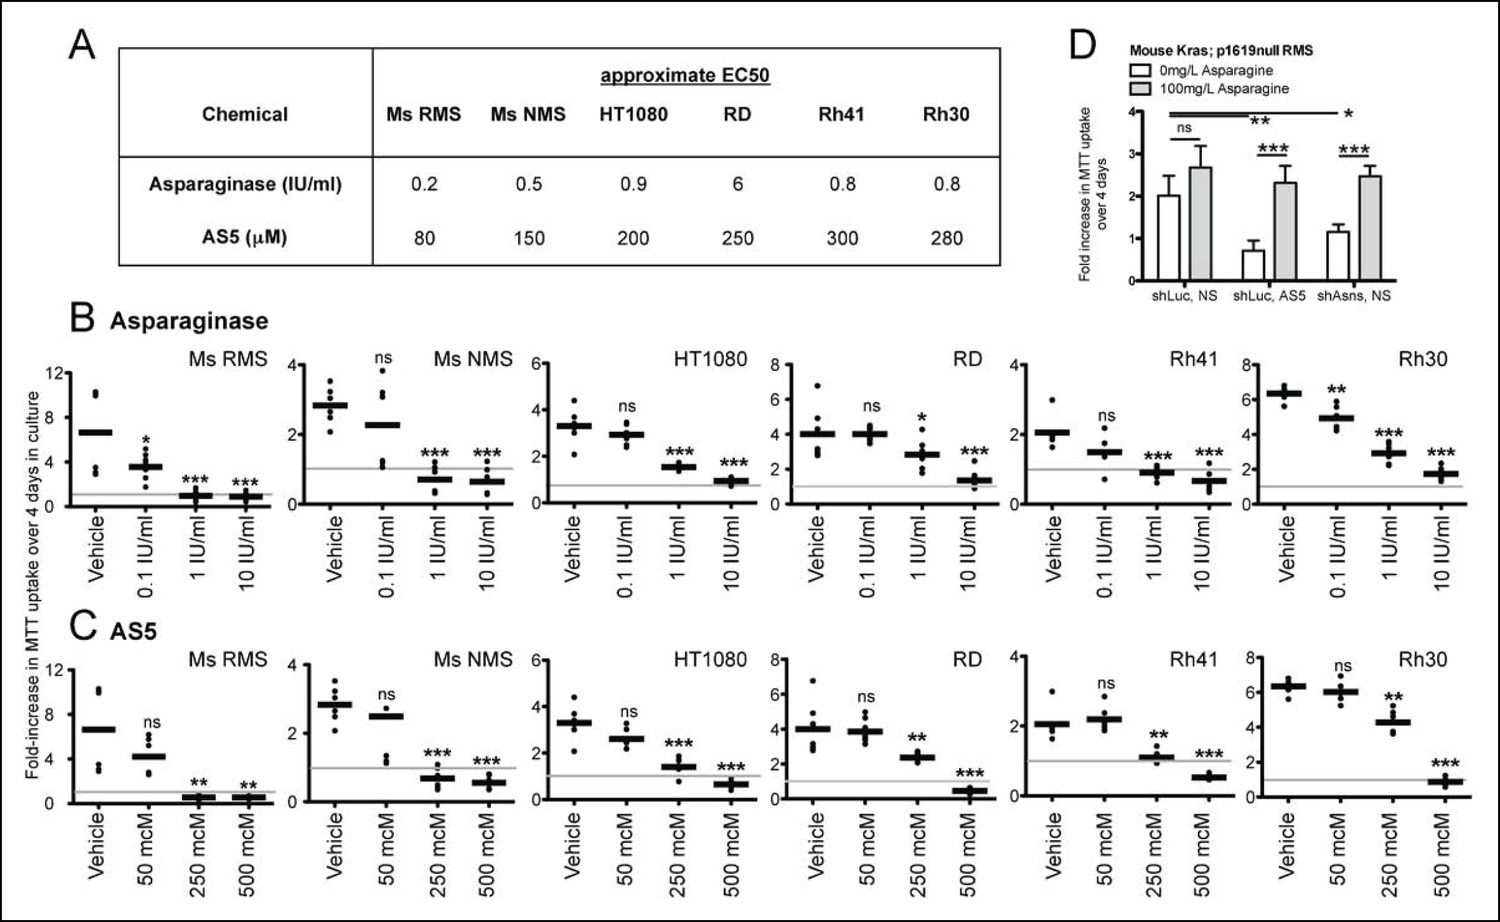
Inhibition of mouse and human sarcoma cell growth in vitro by chemical compounds interfering with Asparagine homeostasis.
(A–C) Proliferation assays of mouse (Ms RMS, Ms NMS) and human (HT1080, RD, Rh41, Rh30) sarcoma cell lines exposed to the indicated doses of chemical modulators of Asparagine homeostasis: (A–B) Asparaginase or (A,C) AS5. Both chemicals were diluted in 0.9% NaCl (Normal Saline (NS)) as vehicle. (D) Chemical and genetic ASNS inhibition was reversed by exogenous supplementation with 100 mg/L asparagine in the tissue culture medium (100 mg/L, which corresponds to 757 μM; compared to normal asparagine concentrations in mouse and human plasma of 29 μM and 55 μM, respectively (Cooney et al., 1970)). Data were evaluated for statistical significance by T-tests (ns p≥0.05, * p<0.05, ** p<0.01, *** p <0.001). See Figure 4—figure supplement 1 for ASNS expression in human sarcoma cells.
Figure 4—figure supplement 1
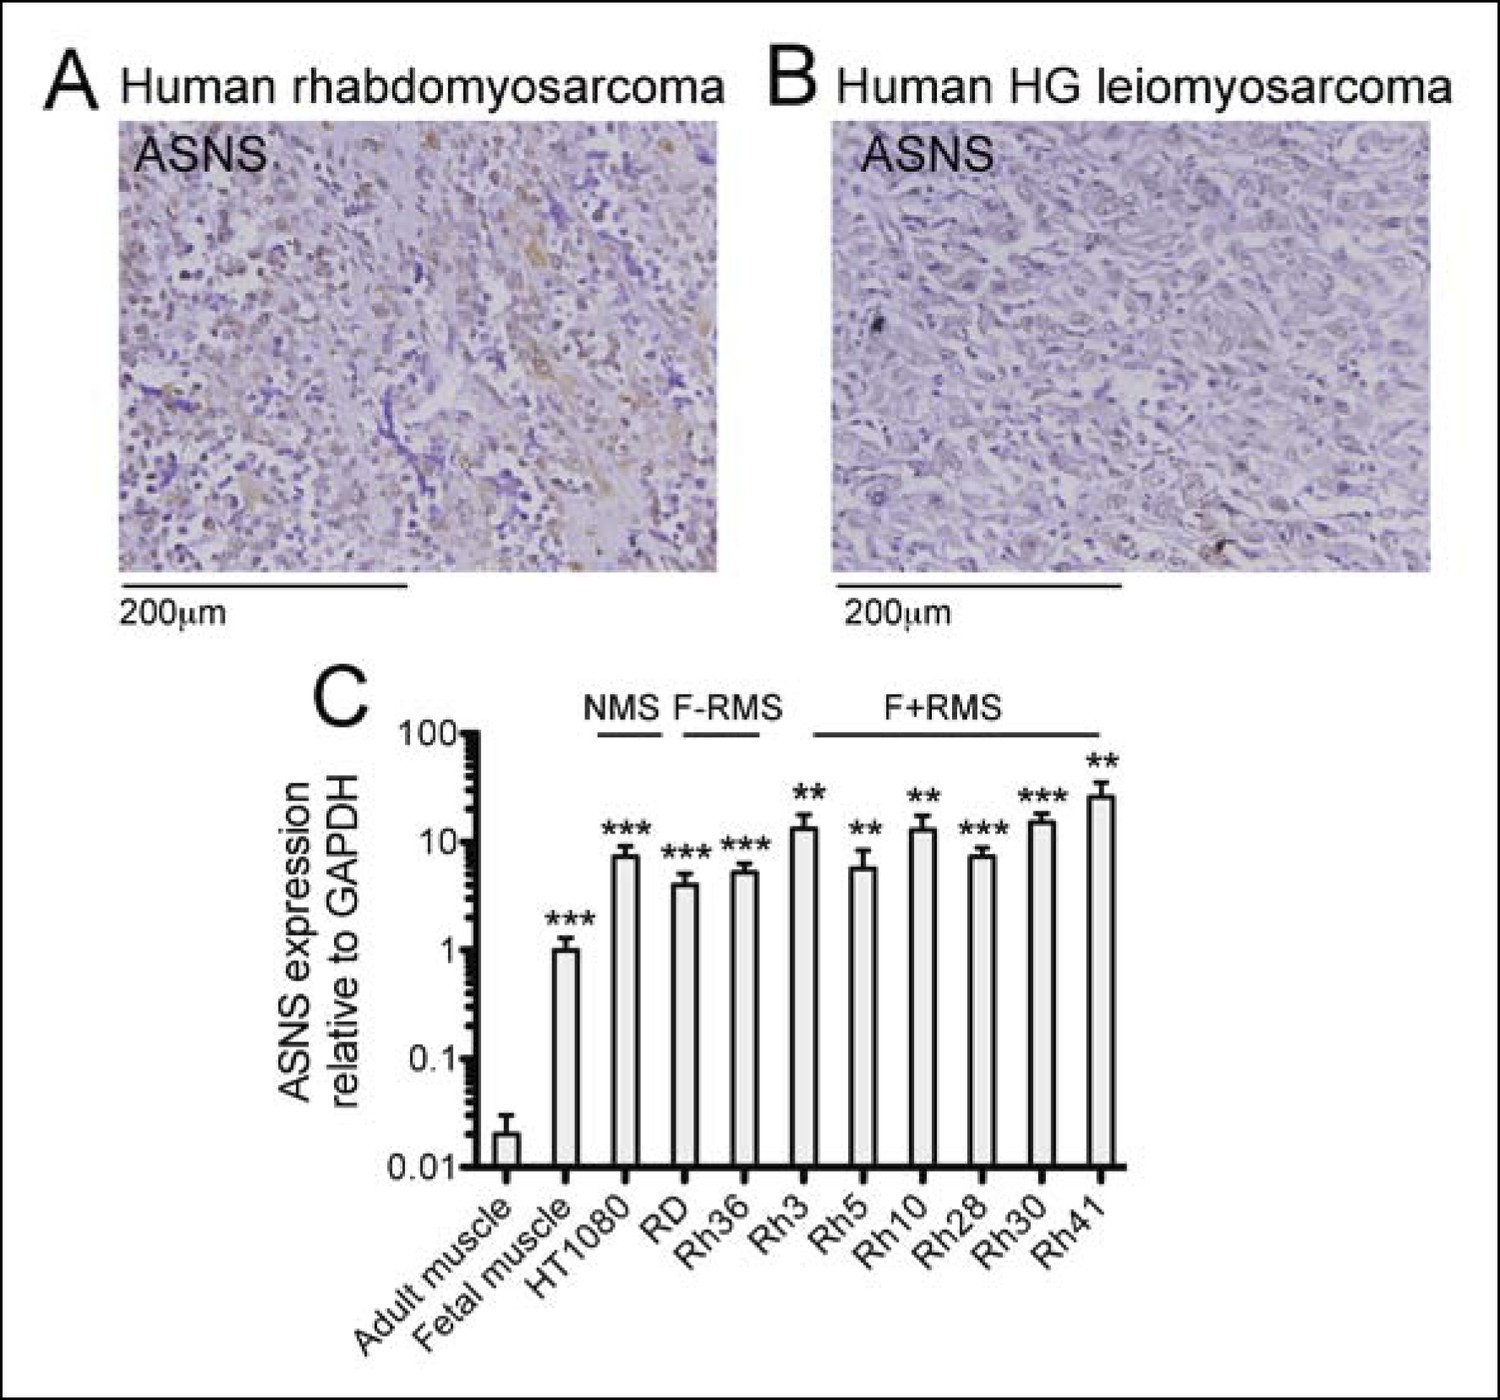
Expression of candidate sarcoma targets in human sarcoma tissue.
(A-B) Immunohistochemical (IHC) staining of commercially available sarcoma tissue arrays (US Biomax SO2081) detected ASNS expression in (A) 73% of human RMS cores (22 tumors evaluated) and in (B) 44% of human leiomyosarcoma (LMS) cores (27 tumors evaluated). Representative stains are shown. (C) ASNS expression was detected in human sarcoma cell lines by qRT-PCR (ns p≥0.05, * p<0.05, ** p<0.01, *** p <0.001; as determined by T-tests compared to target gene expression in adult muscle).
Figure 5 with 1 supplement
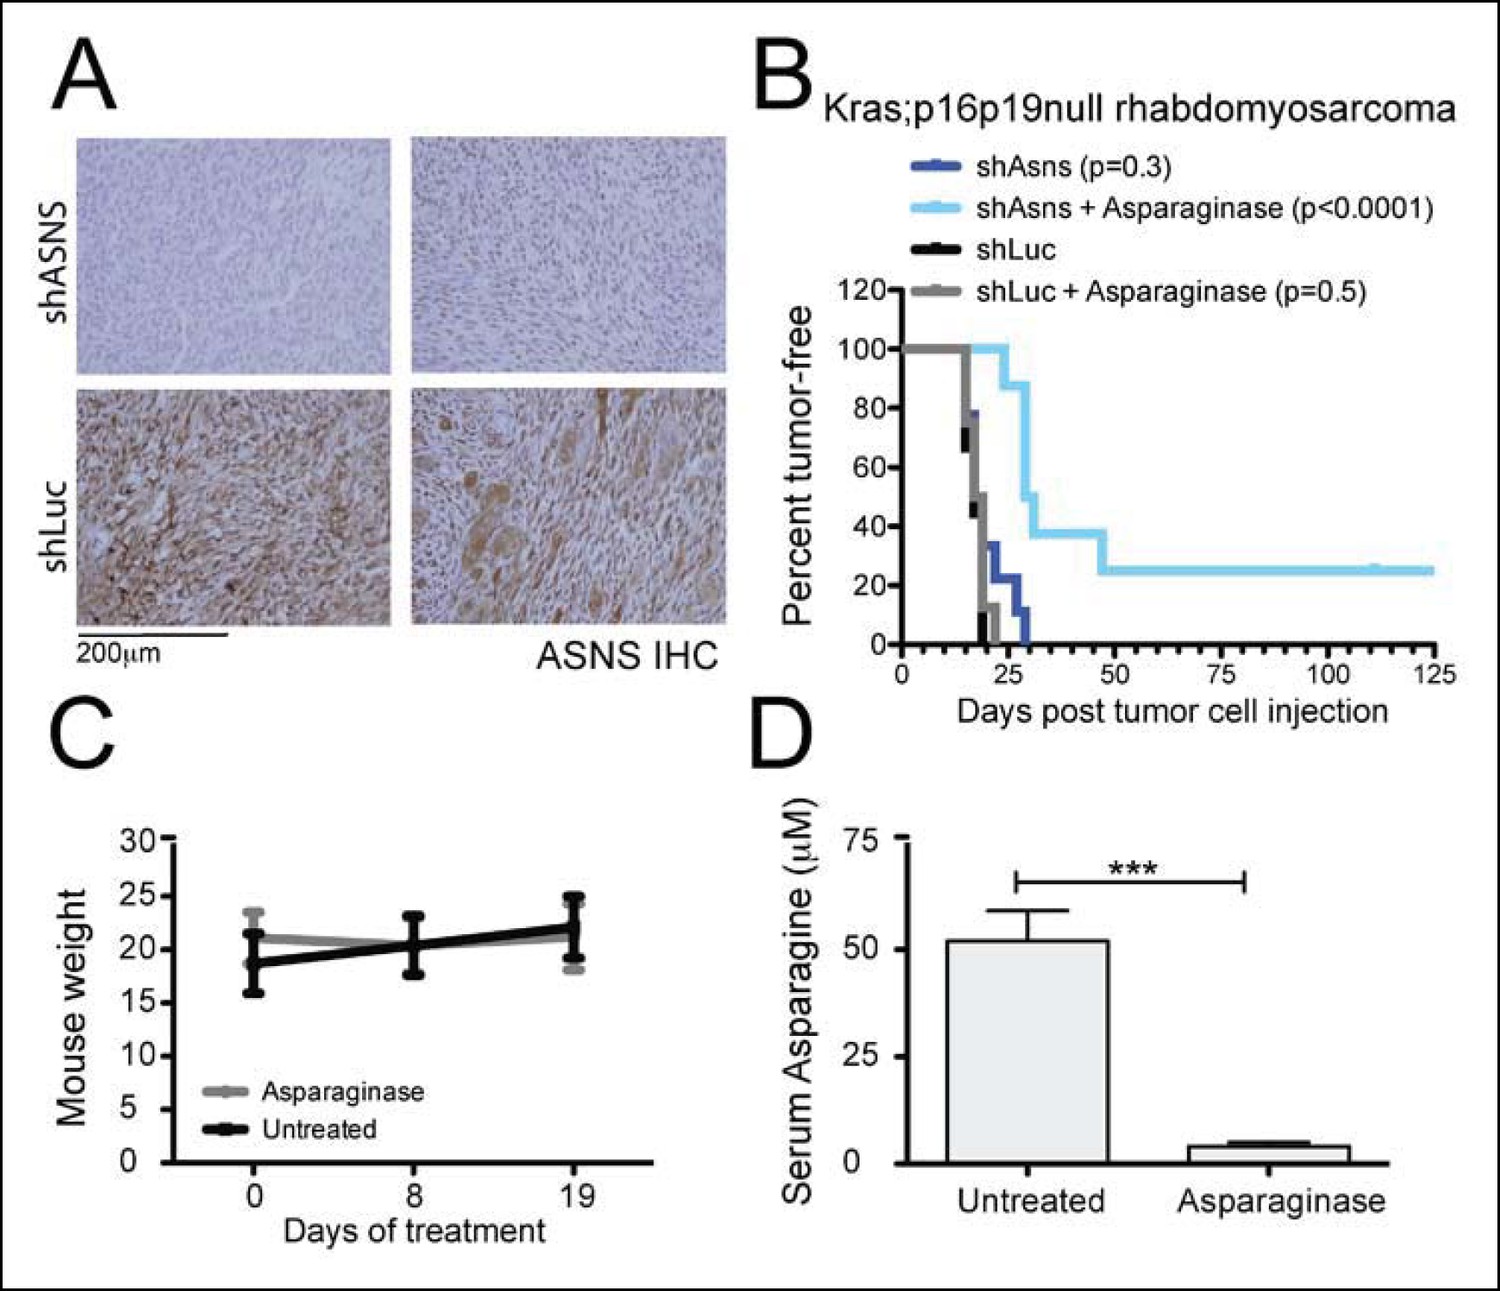
Asns silencing delayed Kras;p16p19null RMS growth in Asparagine-depleted mice.
(A) Tumors arising from shASNS RMS cells expressed less ASNS than tumors arising from shLUC cells as shown by IHC staining. Of 6 tumors arising from shASNS cells, cytoplasmic ASNS positivity was observed in 50–75% of cells in one tumor, in 25–50% of cells in 3 tumors and in <25% of cells in 2 tumors. Of 5 tumors arising from control shLUC-cells, cytoplasmic ASNS staining was detected in >75% of cells in 3 tumors and in 25–50% of cells in 2 tumors. Representative images are shown. (B) Effects of Asns silencing on tumor growth in vivo were evaluated by transplantation. One subgroup of recipient mice was treated with Asparaginase (Elspar) by daily intraperitoneal (IP) injections at a dose of 1500 IU/kg. ShASNS silencing delayed tumor onset in recipient mice treated with Asparaginase compared to shLUC-infected RMS cells (p<0.0001). (C) Asparaginase-treated mice maintained their weight over the course of a 19-day exposure. Each experimental group included 5 mice, and findings were replicated in 2 independent transplantation experiments. (D) Daily IP injection of Asparaginase results in a 13-fold reduction in serum Asparagine levels from 52 ± 7 to 4 ± 1 μmol/L. Differences in tumor latency were evaluated for statistical significance by logrank (Mantel-Cox) test. Differences in serum amino acid concentrations were determined by T-test (ns p≥0.05, *p<0.05, **p<0.01, ***p <0.001). See Figure 5—figure supplement 1 for similar effects of Asns silencing in Kras;p16p19null NMS cells on secondary tumor induction and Supplementary file 7 for changes in serum amino acid levels in Asparaginase-treated versus control mice.
Figure 5—figure supplement 1
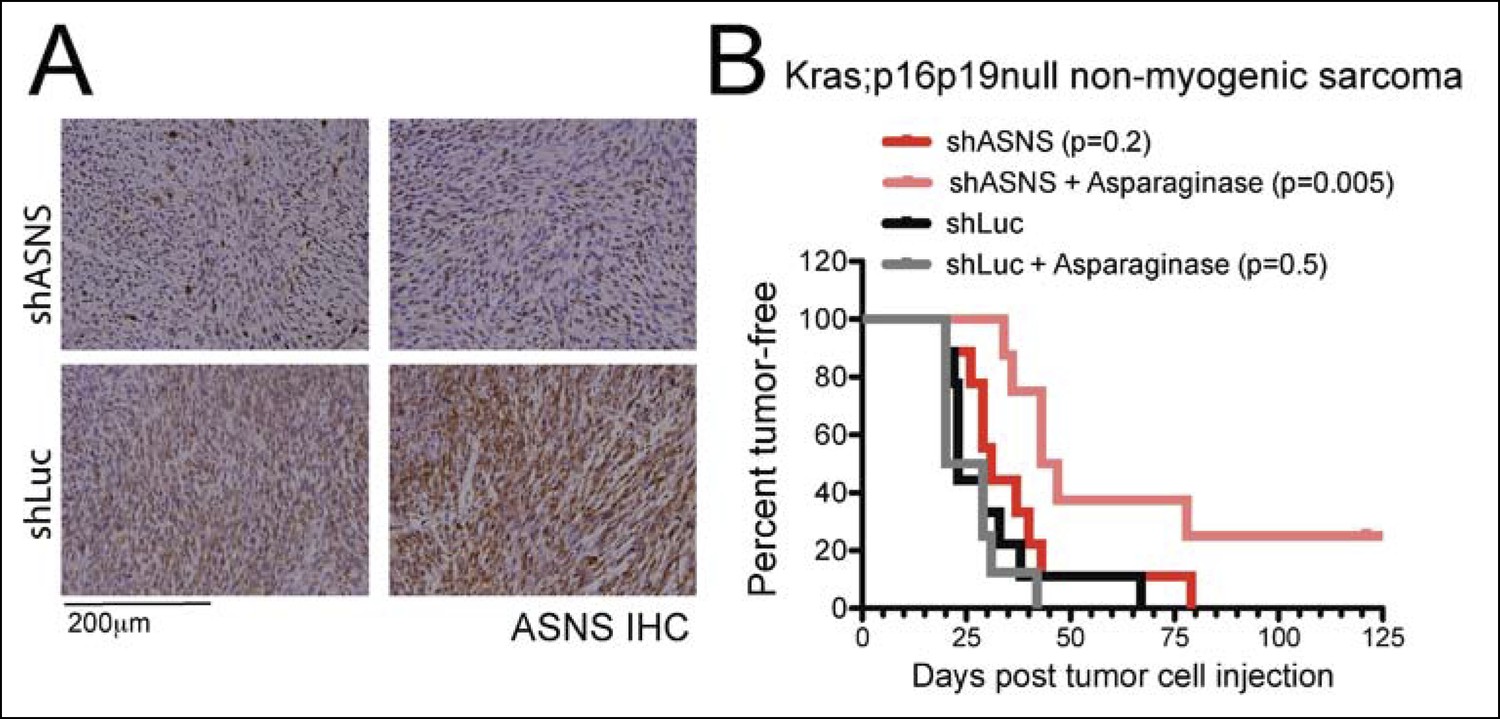
Asns silencing delayed Kras;p16p19null NMS growth in Asparagine-depleted mice.
Mouse Kras;p16p19null NMS cells were transplanted into 1- to 3-months old NOD. SCID recipient mice. (A) Tumors arising from shASNS NMS cells expressed less ASNS than tumors arising from shLUC cells as shown by IHC staining. (B) Effects of Asns silencing on tumor growth in vivo were evaluated by transplantation. One subgroup of recipient mice was treated with Asparaginase (Elspar) by daily intraperitoneal (IP) injections at a dose of 1500IU/kg. ShASNS silencing delayed tumor onset in recipient mice treated with asparaginase compared to shLUC-infected NMS cells (p = 0.005). Transplantation of shASNS cells into recipients that were not exposed to asparaginase, or transplantation of shLUC cells into asparaginase-treated recipients did not delay tumor onset. Each experimental group included 5 mice, and findings were replicated in 2 independent transplantation experiments. Differences in tumor latency were evaluated for statistical significance by logrank (Mantel-Cox) test.
Additional files
-
Supplementary file 1
Kras; p16p19null RMS cell line T14R: raw data from shRNA screen (plates DAS36-DAS45).
- https://doi.org/10.7554/eLife.09436.014
-
Supplementary file 2
Kras; p16p19null NMS cell line Sca1-01: raw data from shRNA screen (plates DAS36-DAS45).
- https://doi.org/10.7554/eLife.09436.015
-
Supplementary file 3
Kras; p16p19null RMS cell line T14R: raw data from shRNA screen (control plate CTR01).
- https://doi.org/10.7554/eLife.09436.016
-
Supplementary file 4
Kras; p16p19null NMS cell line Sca1-01: raw data from shRNA screen (control plate CTR01).
- https://doi.org/10.7554/eLife.09436.017
-
Supplementary file 5
Kras; p16p19null RMS cell line T14R: statistical evaluation (Significance levels: 1, 5 shRNAs with FDR<30%; 2, 4 shRNAs with FDR<30%; 3, 3 shRNAs with FDR<30%).
- https://doi.org/10.7554/eLife.09436.018
-
Supplementary file 6
Kras; p16p19null NMS cell line Sca1-01: statistical evaluation (Significance levels: 1, 5 shRNAs with FDR<30%; 2, 4 shRNAs with FDR<30%; 3, 3 shRNAs with FDR<30%).
- https://doi.org/10.7554/eLife.09436.019
-
Supplementary file 7
Amino acid levels (μM) in Asparaginase-treated and untreated mice.
- https://doi.org/10.7554/eLife.09436.020
Download links
A two-part list of links to download the article, or parts of the article, in various formats.
Downloads (link to download the article as PDF)
Open citations (links to open the citations from this article in various online reference manager services)
Cite this article (links to download the citations from this article in formats compatible with various reference manager tools)
Functional genomic screening reveals asparagine dependence as a metabolic vulnerability in sarcoma
eLife 4:e09436.
https://doi.org/10.7554/eLife.09436


