Overall energy conversion efficiency of a photosynthetic vesicle
- University of Illinois at Urbana-Champaign, United States
- University of Sheffield, United Kingdom
Figures
Figure 1
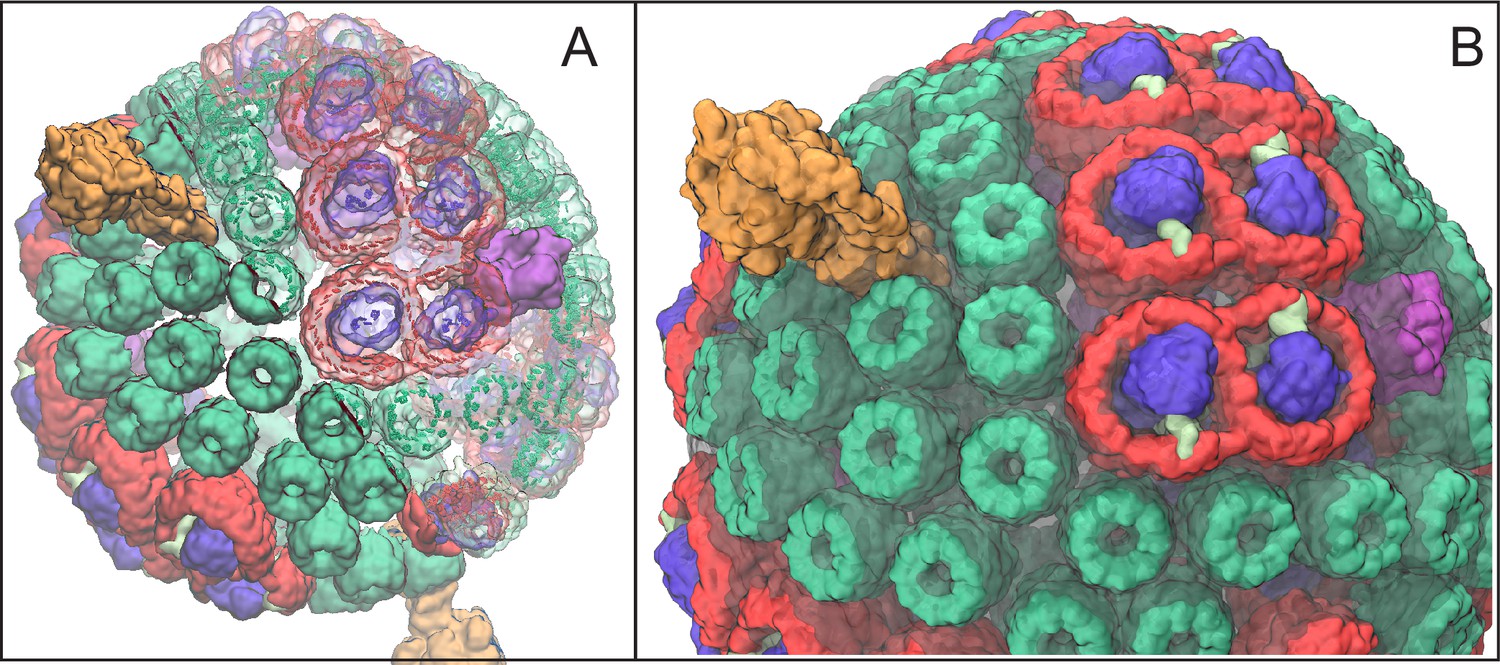
Atomic structural model of a low-light-adapted chromatophore vesicle from Rba. sphaeroides.
The model is based on AFM, EM, crystallography, mass spectroscopy, proteomics, and optical spectroscopy data (Cartron et al., 2014). The inner diameter of the vesicle is 50 nm. The model considered in this study is a variant of the one reported in (Cartron et al., 2014) , which features 63 LH2 complexes (green), 11 dimeric and 2 monomeric RC-LH1-PufX complexes (LH1:red; RC:blue; PufX:lime), 4 cyt (magenta), and 2 ATP synthases (orange), as well as 2469 BChls and 1542 carotenoids. Proteins are shown in surface representation. (A) Proteins and BChls of the chromatophore. Some of the light harvesting proteins are rendered transparent to reveal their BChl pigments. BChls are represented by their porphyrin rings only. See Video 1 presenting the vesicle. (B) Close-up of chromatophore showing its lipid membrane (transparent) along with its proteins colored as in (A). The membrane of 16,000 lipids contains the quinone/quinol pool of about 900 molecules. Energy conversion in the chromatophore proceeds in three stages: (I) light harvesting and electron transfer reducing the quinone pool; (II) quinone/quinol diffusion and exchange of quinols for quinones at cyt (thereby generating a proton gradient across the vesicle membrane) as well as diffusive motion of cytochrome inside the chromatophore shuttling single electrons from cyt to RC; (III) utilization of the proton gradient for ATP synthesis.
Figure 2
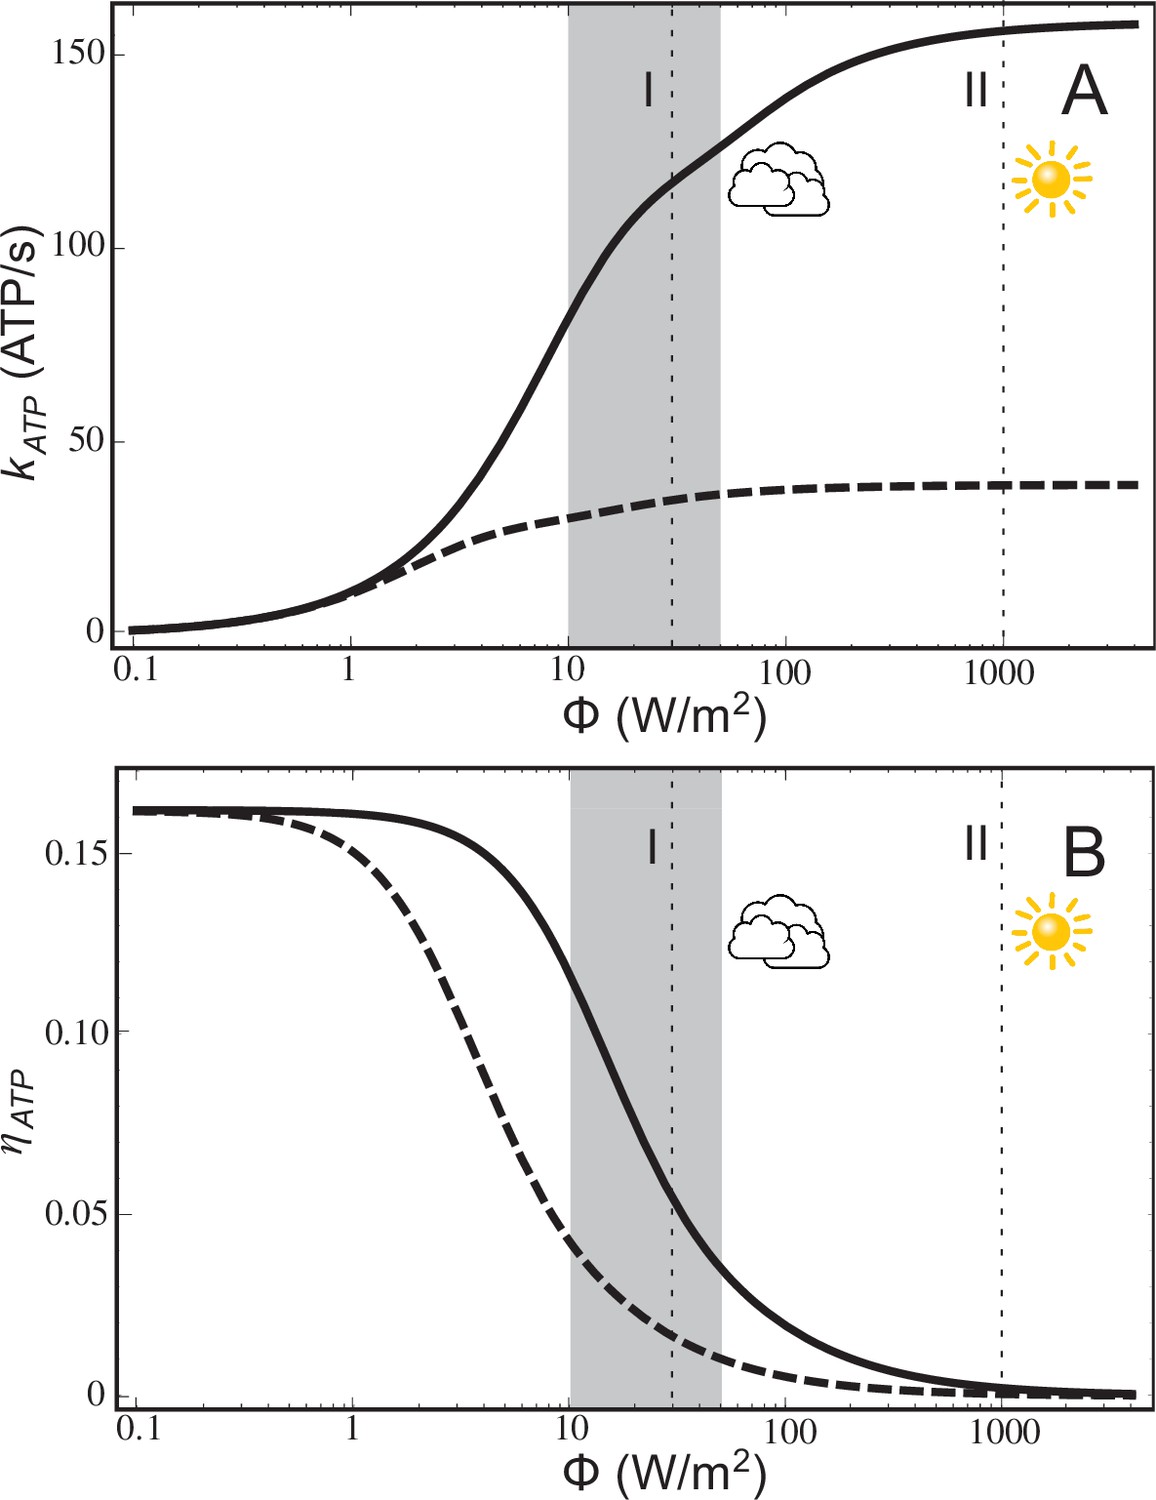
ATP production rate and energy conversion efficiency.
(A) Steady-state ATP production rate, , calculated according to Equation (20), and (B) energy conversion efficiency, , calculated according to Equation (21), of a chromatophore vesicle as a function of incident light intensity . Solid curves correspond to the vesicle shown in Figure 1; dashed curves represent a similar vesicle with only a single cyt. The vertical lines denote the light intensities corresponding to (I) 3% of full sunlight (30 W/m2), a typical growth condition for purple bacteria, and (II) full sunlight (1 kW/m2), respectively. Thus, for light intensities typical for the habitat of purple bacteria (1–5% of full sunlight; shaded area) the energy conversion efficiency of a chromatophore vesicle is between 0.12–0.04.
Figure 3
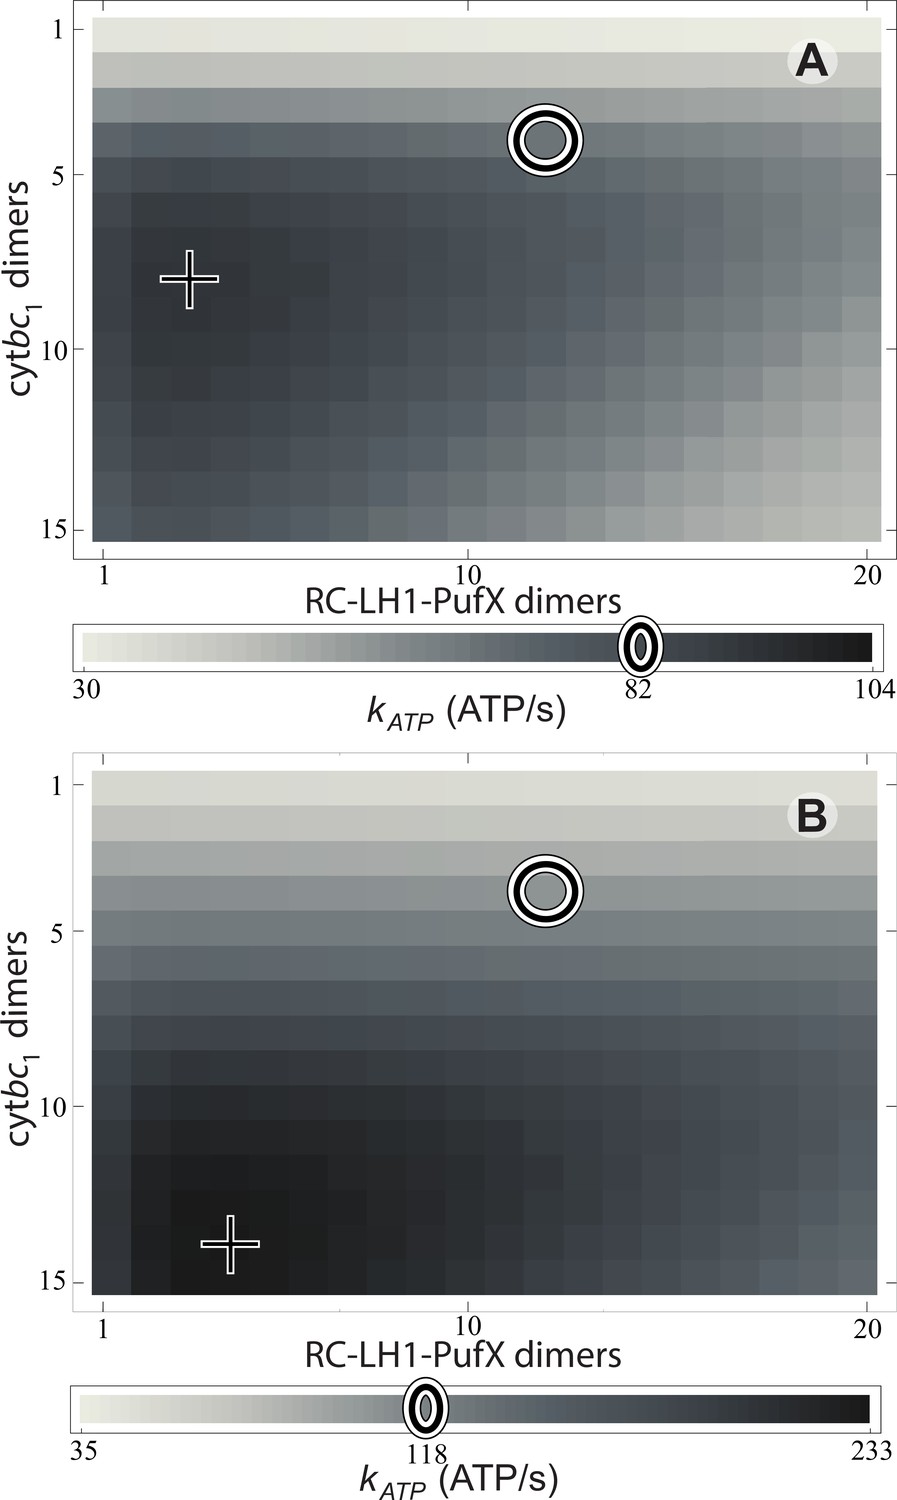
Effect of vesicle composition on steady-state ATP production at different light intensities.
Vesicle composition is given in terms of the number of cyt dimers () and of RC-LH1-PufX dimers () for vesicles featuring identical surface area; LH2 composition of the vesicle is determined by considering the vesicle shown in Figure 1 as a reference point and adjusting the number of LH2 complexes to compensate for the changes in the number of cyt and RC-LH1-PufX dimers to cover the vesicle surface. ATP production rate, , is shown for (A) 1% of full sunlight (10 W/m2) and (B) 3% of full sunlight (30 W/m2), determined according to Equation (20). The two RC-LH1-PufX monomers of the vesicle in Figure 1 were counted as a single dimer for the purposes of this plot. The reference vesicle (Figure 1) is represented by a circle, corresponding to an ATP production rate of 82 s−1 (118 s−1), i.e. 79% (51%) of the maximum possible rate among all stoichiometries, for 1% (3%) of full sun light. The optimal vesicle composition for each illumination is represented by a cross; the corresponding LH2 count for optimal composition is 93 (74) at 1% (3%) of full sunlight as compared with 63 for the reference vesicle (circle). The ATP production rate is marginally greater for vesicles that contain more cyt and LH2 complexes at the expense of fewer RC-LH1-PufX complexes as compared with the reference vesicle. This increase in ATP production rate results from cyt being the rate-limiting component in the energy conversion process.
Figure 4
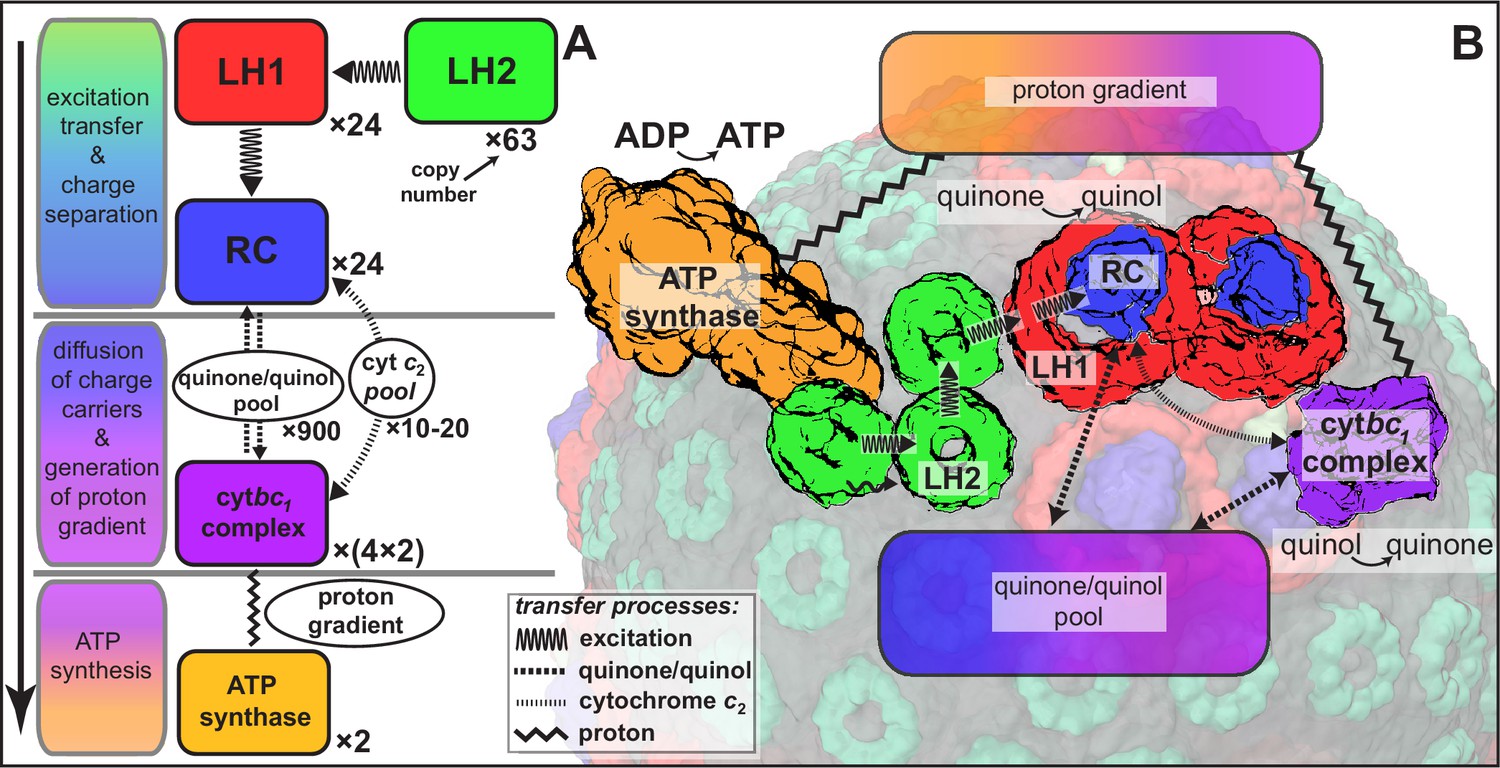
Processes involved in energy conversion in the photosynthetic chromatophore.
(A) Energy conversion processes starting after initial light absorption are divided into three stages: (1) quinol production at RC as a result of excitation transfer; (2) diffusion between RC and cyt of quinone/quinol and cytochrome , together with quinol-to-quinone conversion resulting in a proton gradient across the vesicle membrane; (3) utilization of proton gradient for ATP synthesis. (B) Chromatophore components, in which stages (1–3) take place, include LH2 (green), LH1(red)-RC(blue), cyt(purple), and ATP synthase (brown) complexes as well as the lipid phase (olive; see also Figure 1B).
Figure 5
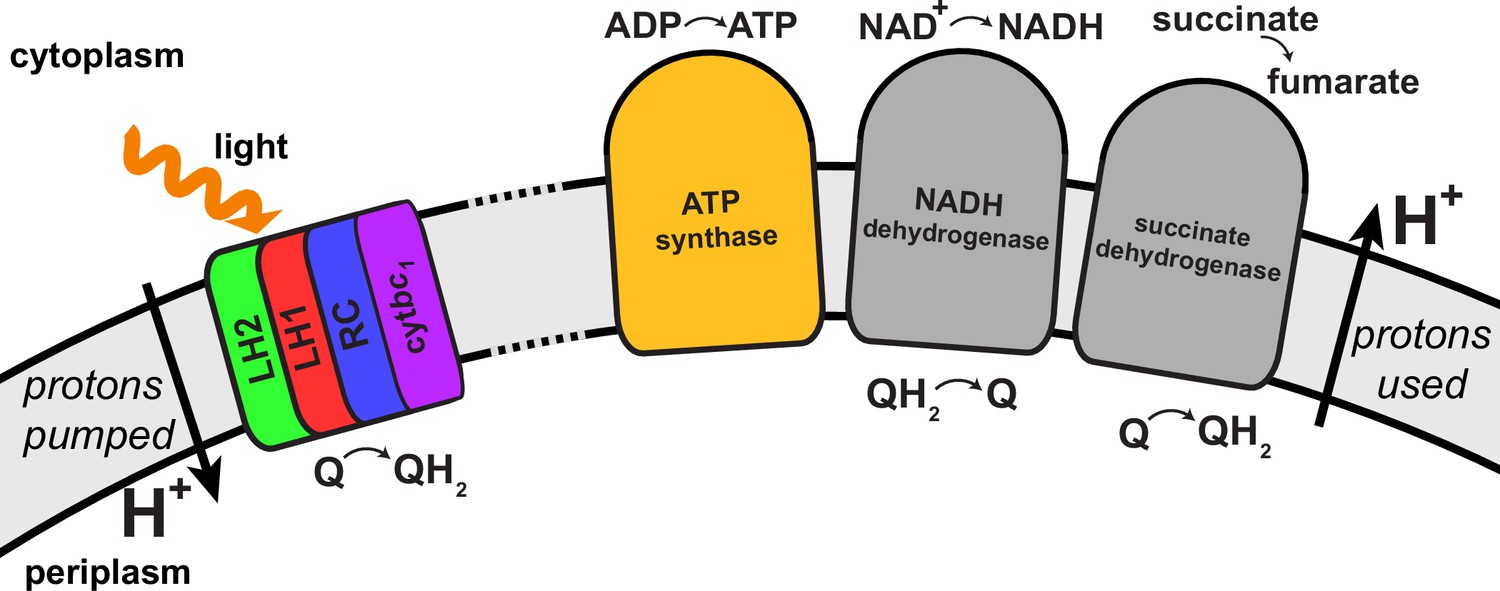
Regulation of the quinone/quinol-pool redox state in the chromatophore involves transmembrane proteins beyond those included in the light harvesting-RC-cyt-ATP synthase system described in (Cartron et al., 2014) and shown in Figure 4.
Succinate dehydrogenase and NADH dehydrogenase regulate the quinone/quinol redox state in the chromatophore membrane. This regulation influences the light intensity dependence of the ATP production rate in the chromatophore by changing the likelihood of finding available quinones at the RC. Two further proteins involved in redox kinetics are cytochrome oxidase and ubiquinol oxidase, which are not shown.
Videos
Video 1
Chromatophore structural model.
A movie that shows a detailed structural model for the low-light adapted chromatophore vesicle as displayed in Figure 1 (Cartron et al., 2014). Presented is a rotating view of the vesicle comprising LH2 complexes (green), dimeric RC-LH1-PufX complexes (red-blue-lime green), dimeric cyt complexes (magenta), and ATP synthases (orange). For half of the model, proteins are shown in solid surface representation, and for the other half, proteins are shown as transparent surfaces with bacteriochlorophylls (BChls), represented by their porphyrin rings, shown as solid surfaces.
Tables
Table 1
Constants employed in the computation of the quantum yield.
| Symbol | Value* | Description |
|---|---|---|
| 12,459 cm−1 12,625 cm−1 | BChl site energies for alternating LH2 B850 BChls, used in Equation (S2) | |
| 12,344 cm−1 | BChl site energies for LH1 B875 BChls, used in Equation (S2) | |
| 12,092 cm−1 12,581 cm−1 | BChl site energies for RC special pair and accessory BChls, used in Equation (S2) | |
| 363 cm−1 | nearest neighbor BChl-BChl coupling for LH2 B850 BChls within the same dimer, used for values in Equation (S3) | |
| 320 cm−1 | nearest neighbor BChl-BChl coupling for LH2 B850 BChls across neighboring dimers, used for values in Equation (S3) | |
| 806 cm−1 | nearest neighbor BChl-BChl coupling for LH1 B875 BChls within the same dimer, used for values in Equation (S3) | |
| 377 cm−1 | nearest neighbor BChl-BChl coupling for LH1 B875 BChls across neighboring dimers, used for values in Equation (S3) | |
| 500 cm−1 | Coupling between RC special pair BChls, used in Equation (S3) | |
| 348,000 Å3 cm−1 | coupling constant for transition dipole interactions between non-nearest neighbor LH2 BChls, used in Equation (S4) | |
| 235 cm−1 | linewidth of LH1 exciton states, assumed uniform, used for in Equation (S8) | |
| 188 cm−1 | linewidth of LH2 exciton states, assumed uniform, used for in Equation (S8) | |
| (35 ps)−1 | excitation transfer rate from LH1 B875 BChls to RC, used for corresponding values in in Equation (S10) | |
| (8 ps)−1 | excitation transfer rate from RC to LH1 B875 BChls, used for corresponding values in in Equation (S10) | |
| (1 ns)−1 | excitation decay rate due to internal conversion, used in Equation (S10) | |
| (3 ps)−1 | charge separation rate at reaction center, used in Equation (S10) |
-
*: energy units given in wavenumbers (1 eV = 8066 cm−1).
Additional files
-
Supplementary file 1
BChl groups of the chromatophore and the corresponding transition dipole moments needed to determine the effective Hamiltonian: LH2 complexes.
(file: Vesicle30BCLdipoleLH2.pdb) Here we provide the transition dipole moments of all 2577 chromatophore BChls defining the effective Hamiltonian in Equations (2,3) of the main text, needed for evaluation of the excitation transfer rates through Equation (4). The reader is referred to (Cartron et al., 2014; Şener et al., 2007, 2010) for the construction of the underlying chromatophore structural model.The three PDB files listed here contain the coordinates for the MG, NB, ND atoms of the BChls in the chromatophore model (Cartron et al., 2014) that define the transition dipole moment unit vectors as discussed in the text and given according to Equation (S1) below. These coordinate files correspond to the following protein complexes: LH2 : [Vesicle30BCLdipoleLH2.pdb], dimeric RC-LH1 : [Vesicle30BCLdipoleLH1RCdimer.pdb], monomeric RC-LH1 : [Vesicle30BCLdipoleLH1RCdimer.pdb], where coordinates of multiple complexes of the same type are concatenated into one file for each complex type.The BChls of the chromatophore can be divided into the following groups: (i) B800 BChls of LH2 : labeled as [resid=307] in the file [Vesicle30BCLdipoleLH2.pdb] (resid is used here as an abbreviation for residue sequence number in the PDB file format); named after the absorption peak of 800 nm; (ii) B850 BChls of LH2 : labeled as [resid=301, 302] in the file [Vesicle30BCLdipoleLH2.pdb]; named after the absorption peak of 850 nm; (iii) B875 BChls of LH1-RC (both monomer and dimer) : labeled as [resid=100-155] in the files [Vesicle30BCLdipoleLH1RCdimer.pdb] and [Vesicle30BCLdipoleLH1RCmonomer.pdb]; named after the absorption peak of 875 nm; (iv) reaction center (RC) BChls of LH1-RC (both monomer and dimer) : labeled as [resid=301, 302, 303, 304] in the files [Vesicle30BCLdipoleLH1RCdimer.pdb] and [Vesicle30BCLdipoleLH1RCmonomer.pdb]; the so-called special pair BChls where electron transport is initiated are labeled by [resid = 302, 303]. Of the aforementioned BChl clusters, the three, namely, LH2 B850, LH1 B875, and RC BChls, form strongly coupled excitonic states; the LH2 B800 BChls do not share excitation energy between themselves, transfering it rapidly (within 0.5 ps) (Şener et al., 2007; Ritz et al., 2001) to the B850 ring of the same LH2. The theory of excitation transfer between the BChl clusters listed above is described in Supplementary materials.
- https://doi.org/10.7554/eLife.09541.010
-
Supplementary file 2
BChl groups of the chromatophore and the corresponding transition dipole moments needed to determine the effective Hamiltonian: RC-LH1 dimer complexes.
(file: Vesicle30BCLdipoleLH1RCdimer.pdb) As explained for Supplementary file 1, but for BChls belonging to RC-LH1 dimers.
- https://doi.org/10.7554/eLife.09541.011
-
Supplementary file 3
BChl groups of the chromatophore and the corresponding transition dipole moments needed to determine the effective Hamiltonian: RC-LH1 monomer complexes.
(file: Vesicle30BCLdipoleLH1RCmonomer.pdb) As explained for Supplementary file 1, but for BChls belonging to RC-LH1 monomers.
- https://doi.org/10.7554/eLife.09541.012
Download links
A two-part list of links to download the article, or parts of the article, in various formats.
Downloads (link to download the article as PDF)
Open citations (links to open the citations from this article in various online reference manager services)
Cite this article (links to download the citations from this article in formats compatible with various reference manager tools)
Overall energy conversion efficiency of a photosynthetic vesicle
eLife 5:e09541.
https://doi.org/10.7554/eLife.09541


