Fucosylation and protein glycosylation create functional receptors for cholera toxin
- University of Texas Southwestern Medical Center, United States
- University of Gothenburg, Sweden
- University of Copenhagen, Denmark
Figures
Figure 1 with 1 supplement
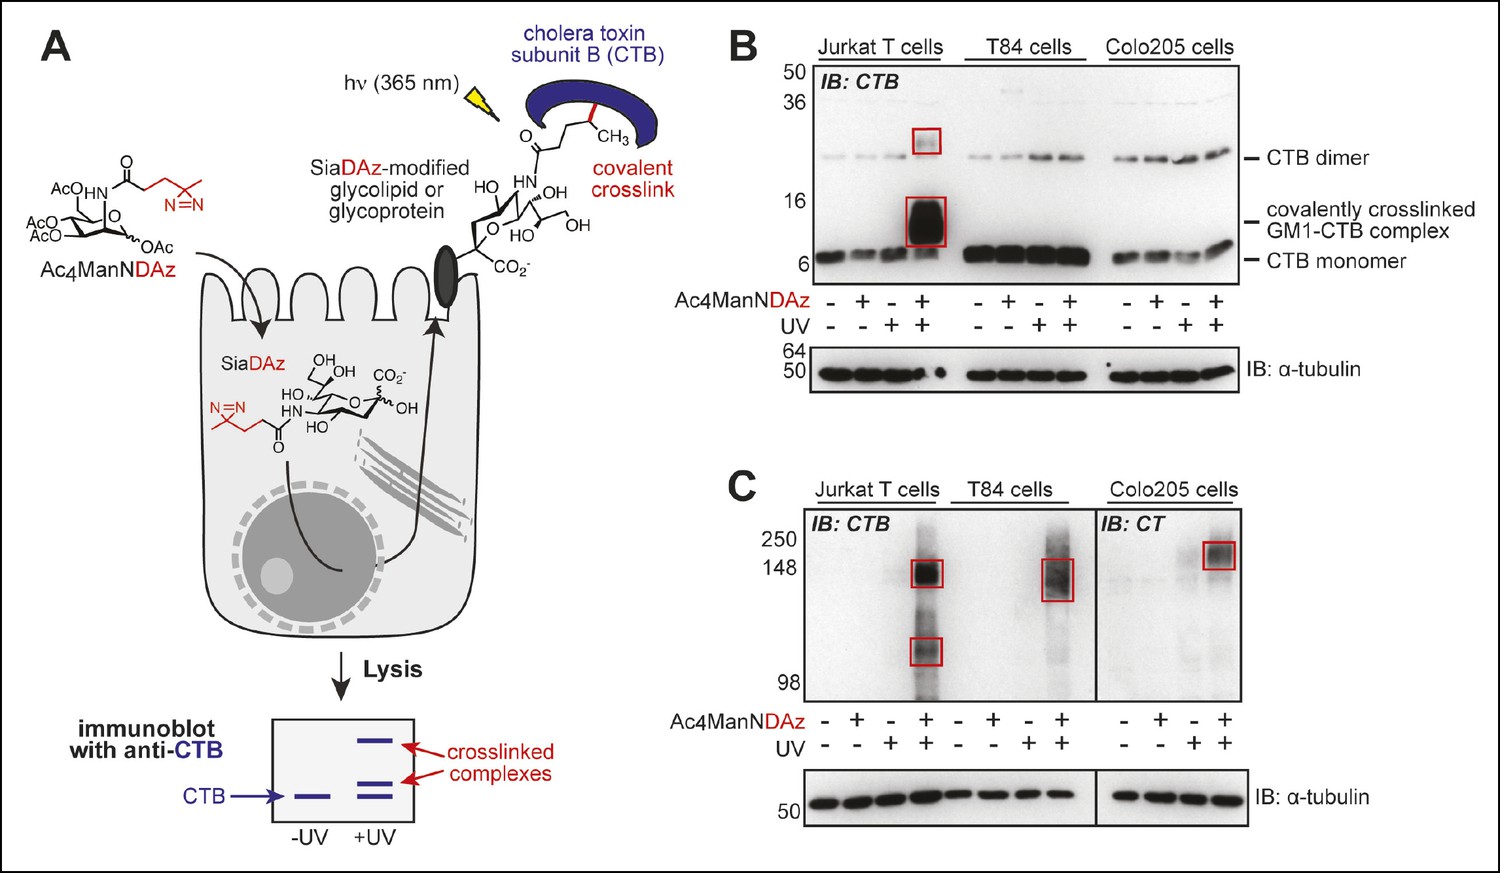
Products of SiaDAz-mediated crosslinking of CTB depend on cell type.
(A) Photocrosslinking sialic acid (SiaDAz) is produced by culturing cells with Ac4ManNDAz. SiaDAz is incorporated into glycolipids and glycoproteins that are displayed on the cell surface. CTB is added to cells. Application of 365 nm radiation causes activation of the diazirine crosslinker and results in covalent crosslinking between CTB and neighboring SiaDAz-modified glycoconjugates. Crosslinked complexes can be observed by immunoblot, or purified and characterized by LC-MS/MS analysis. (B) Jurkat, T84, and Colo205 cells were cultured with Ac4ManNDAz, incubated with CTB, and UV irradiated. Lysates were analyzed by 15% SDS-PAGE immunoblot with anti-CTB antibody. Red boxes highlight crosslinked complexes not present in control lanes. (C) Jurkat, T84, and Colo205 cells were cultured with Ac4ManNDAz, incubated with CTB, and UV irradiated. Lysates were analyzed by 6% SDS-PAGE immunoblot with anti-CTB antibody (for Jurkat and T84 samples) or anti-CT antibody (for Colo205 samples). Red boxes highlight crosslinked complexes not present in control lanes.
Figure 1—figure supplement 1
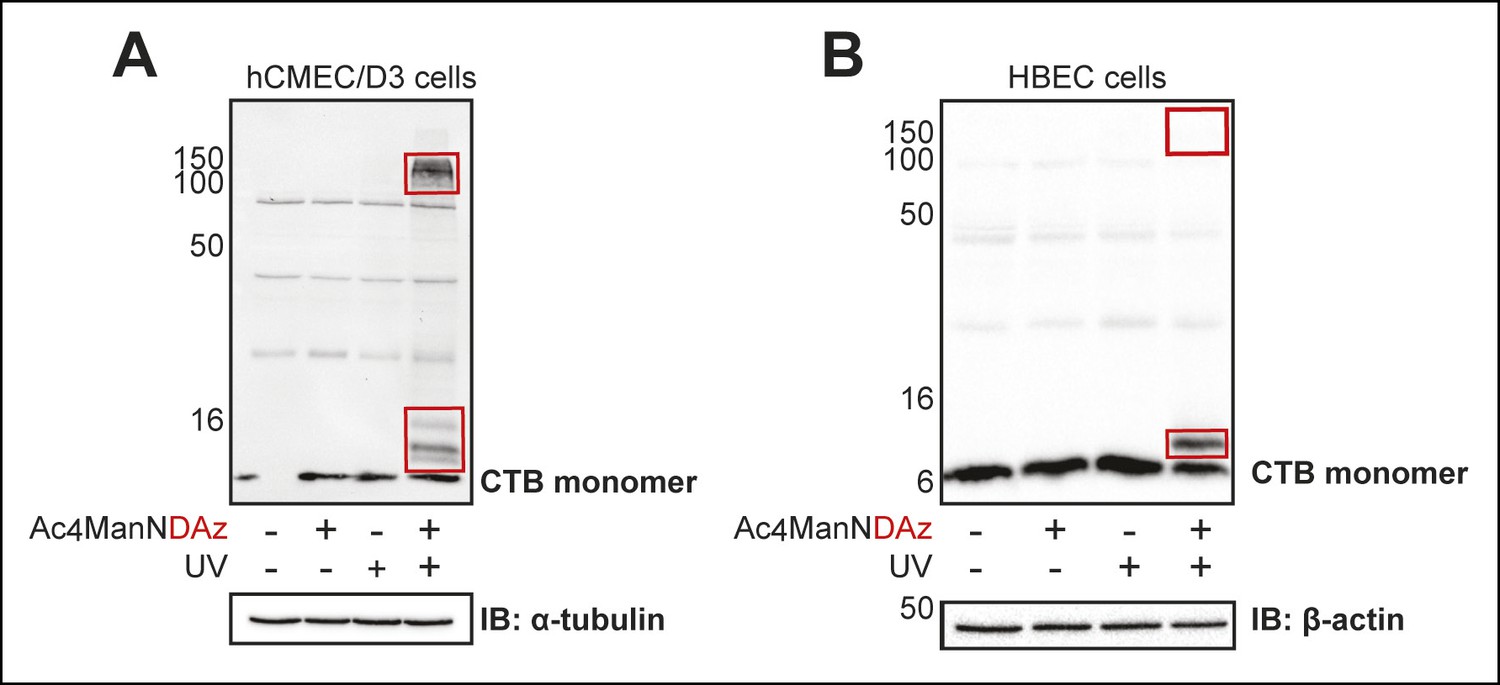
SiaDAz-mediated crosslinking of CTB in additional cell types.
(A) hCMEC/D3 cells were cultured with Ac4ManNDAz, incubated with CTB, and UV irradiated. Lysates were analyzed by 13% SDS-PAGE immunoblot with anti-CTB antibody. (B) HBEC cells were cultured with Ac4ManNDAz, incubated with CTB, and UV irradiated. Lysates were analyzed by 16% SDS-PAGE immunoblot with anti-CTB antibody. Images were acquired on a Bio-Rad Chemi-Doc MP Imaging system.
Figure 2 with 2 supplements
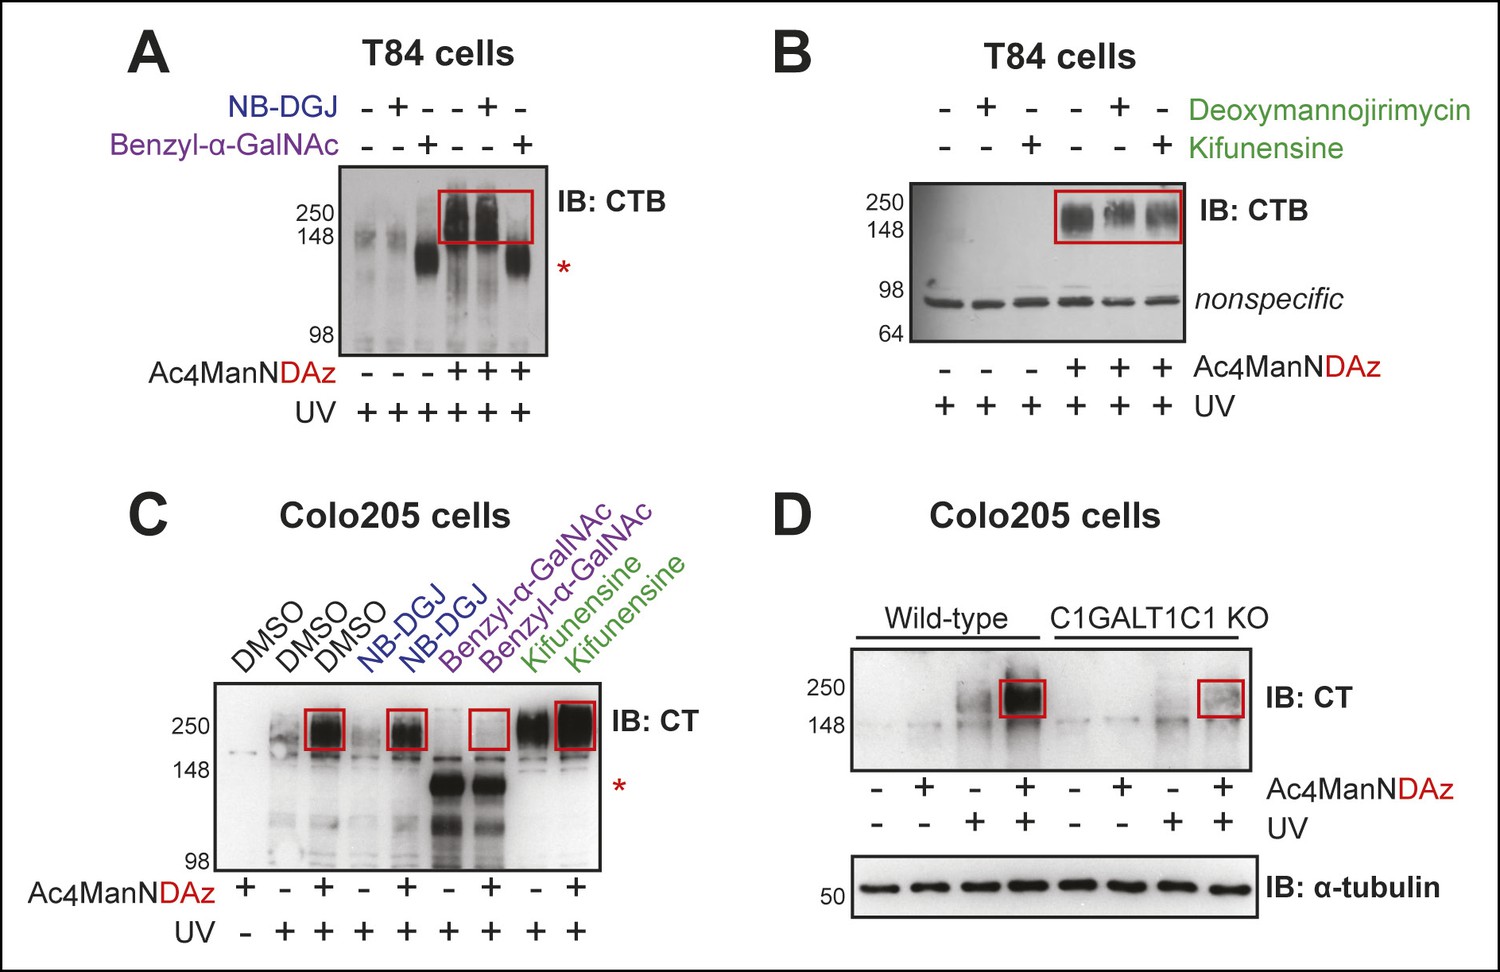
CTB recognizes glycoproteins on human colonic epithelial cell lines.
(A) T84 cells were cultured with Ac4ManNDAz and a glycosylation inhibitor, incubated with CTB, and UV irradiated. NB-DGJ interferes with ganglioside biosynthesis; benzyl-α-GalNAc competitively inhibits GalNAc-type O-linked glycosylation. Lysates were analyzed by 7.5% SDS-PAGE immunoblot with anti-CTB antibody. The asterisk indicates a SiaDAz-independent band that is observed with benzyl-α-GalNAc treatment. (B) T84 cells were cultured with Ac4ManNDAz and a glycosylation inhibitor, incubated with CTB, and UV irradiated. Deoxymannojirimycin and kifunensine both interfere with maturation of N-linked glycans. Lysates were analyzed by 7.5% SDS-PAGE immunoblot with anti-CTB antibody. (C) Colo205 cells were cultured with Ac4ManNDAz and a glycosylation inhibitor, incubated with CTB, and UV irradiated. Lysates were analyzed by 6% SDS-PAGE immunoblot with anti-CT antibody. The red asterisk indicates a SiaDAz-independent band that is observed with benzyl-α-GalNAc treatment. (D) Wild-type or C1GALT1C1 KO Colo205 cells were cultured with Ac4ManNDAz, incubated with CTB, and UV irradiated. Lysates were analyzed by 6% SDS-PAGE immunoblot with anti-CT antibody. In all panels, red boxes highlight CTB crosslinked complexes observed in cells cultured with Ac4ManNDAz and treated with UV radiation.
Figure 2—figure supplement 1
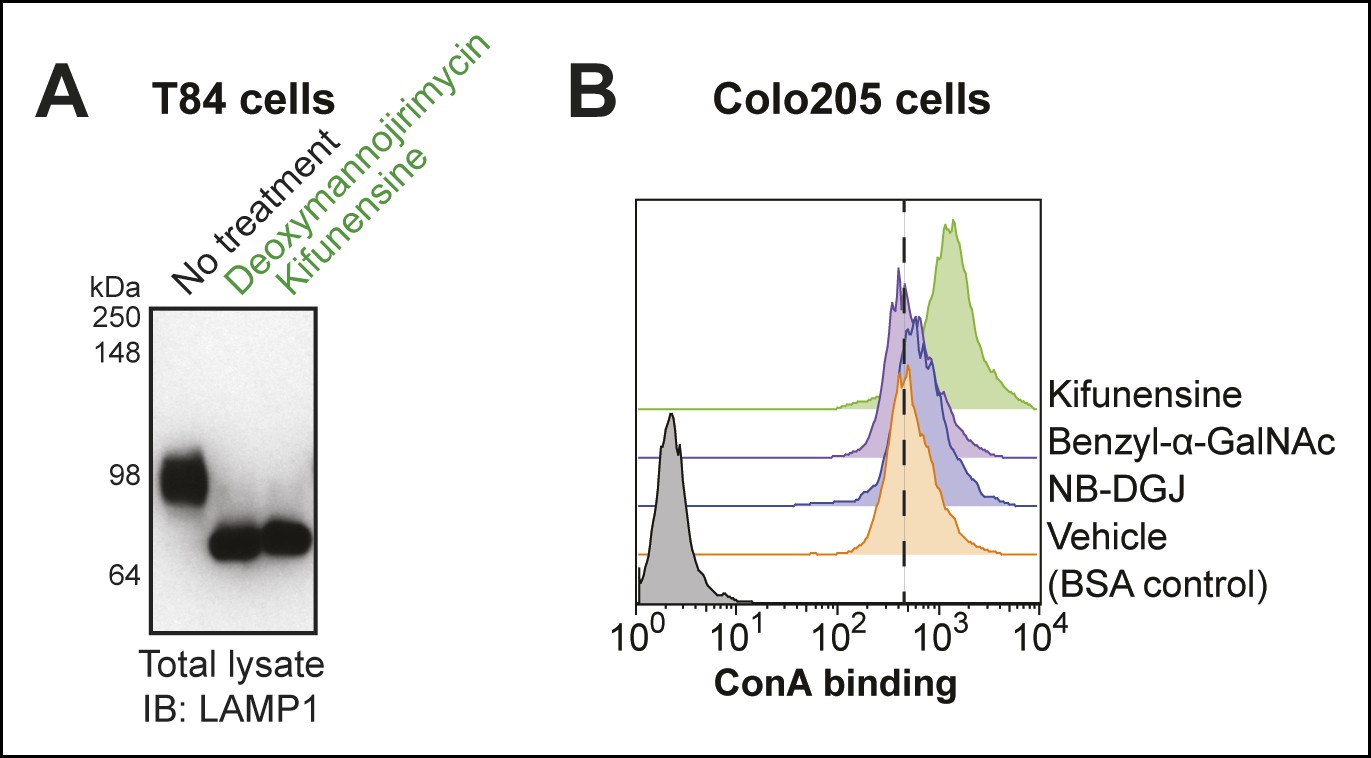
Effectiveness of N-linked glycosylation inhibitors in human colonic epithelial cell lines.
(A) T84 cells were cultured with inhibitors of N-linked glycosylation. Lysates were analyzed by immunoblot with an anti-LAMP1 antibody. (B) Colo205 cells were cultured with inhibitors of glycosylation, then ConA binding was analyzed by flow cytometry. ConA binds high mannose structures that are produced when N-linked maturation is blocked.
Figure 2—figure supplement 2
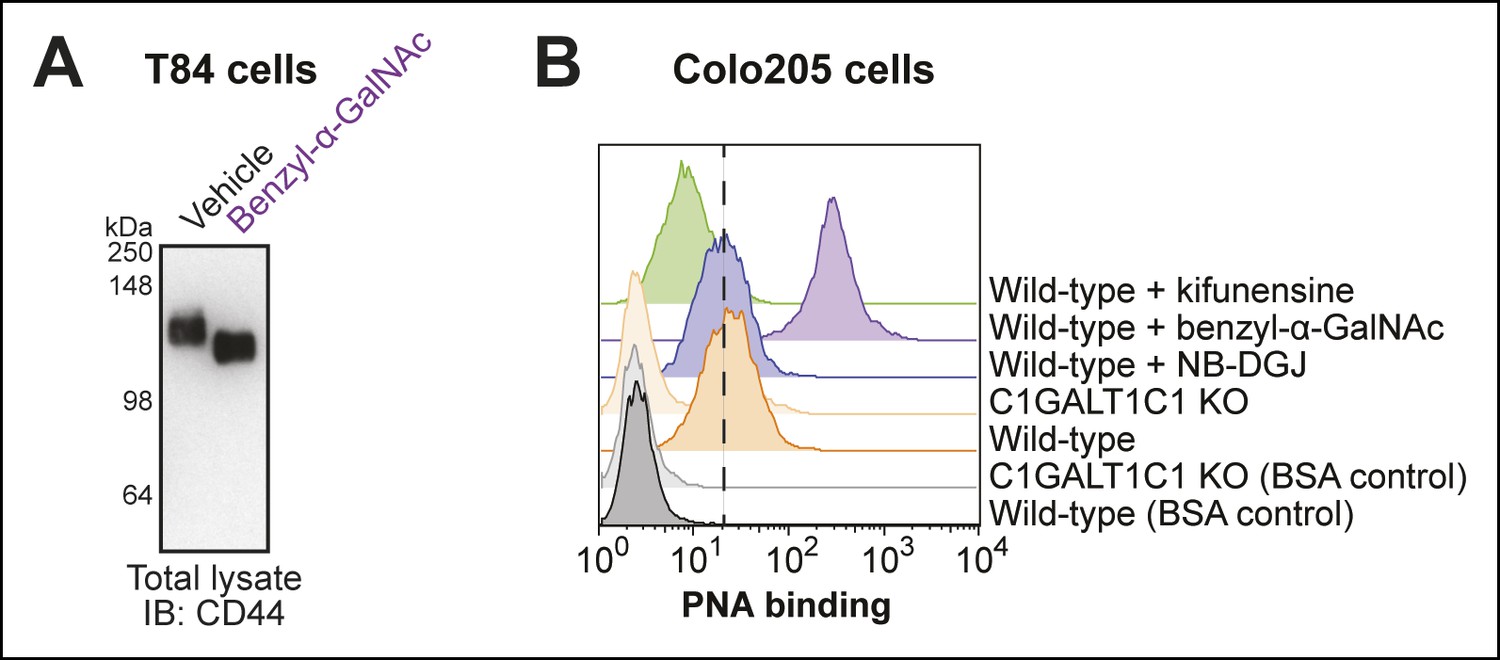
Effectiveness of O-linked glycosylation inhibitor in human colonic epithelial cell lines.
(A) T84 cells were cultured with benzyl-α-GalNAc, an inhibitor of O-linked glycosylation. Lysates were analyzed by immunoblot with an anti-CD44 antibody. (B) Colo205 cells were cultured with benzyl-α-GalNAc, an inhibitor of O-linked glycosylation, then PNA binding was analyzed by flow cytometry. PNA binds the T-antigen, which is produced, but not elaborated, when cells are cultured with benzyl-α-GalNAc.
Figure 3
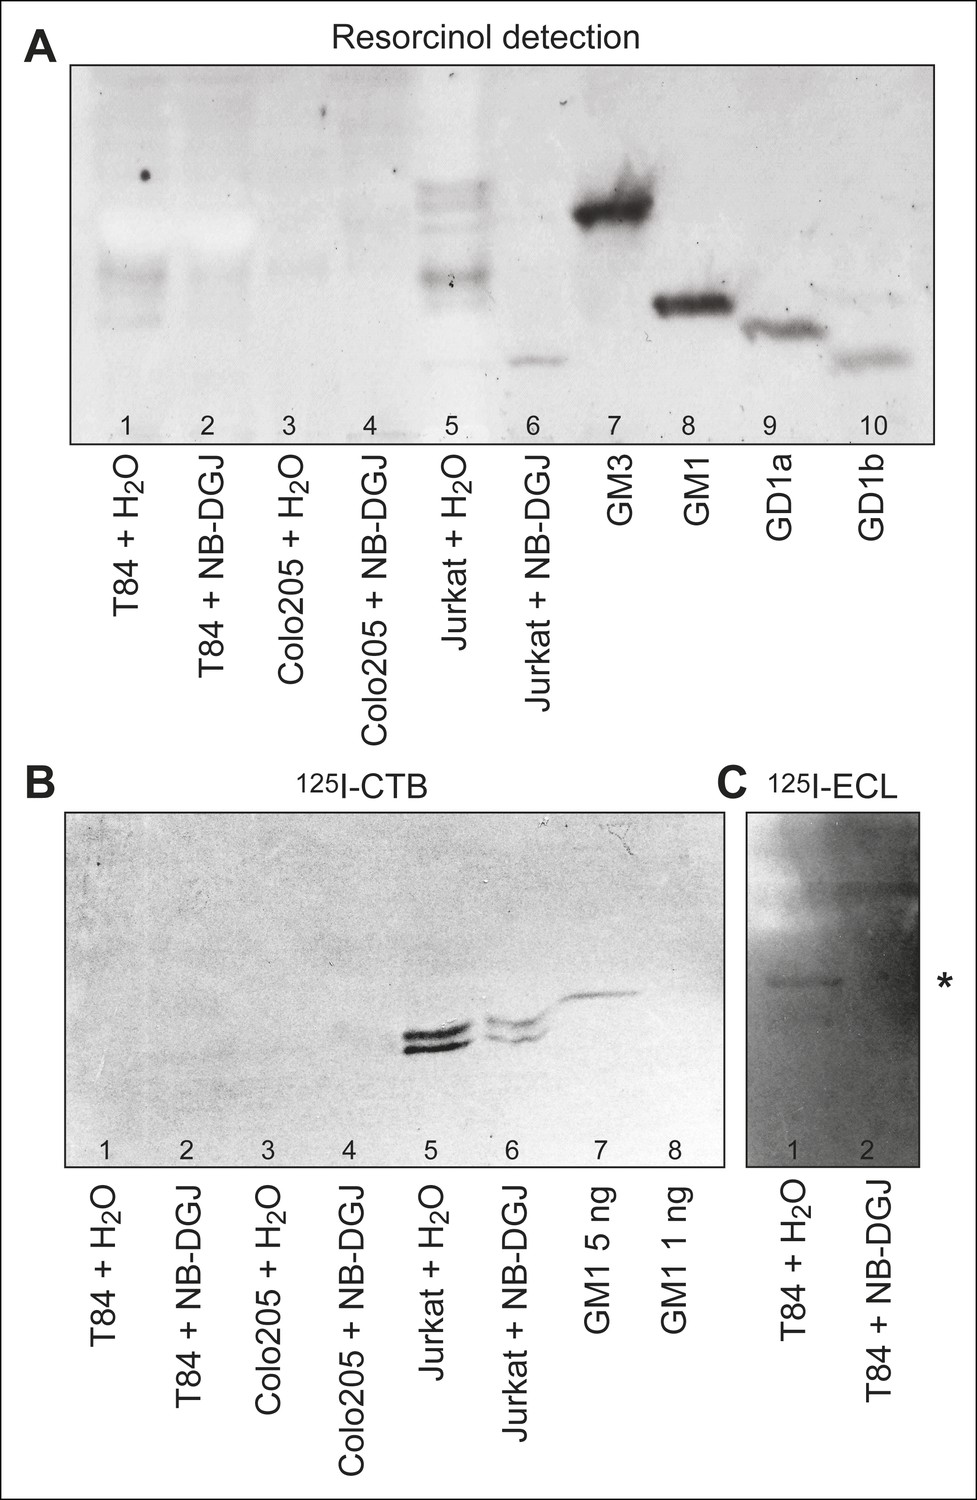
HP-TLC analysis of glycosphingolipids from T84, Colo205, and Jurkat cells.
Partially purified glycosphingolipid fractions isolated from T84, Colo205 and Jurkat cells cultured with either vehicle or the glycosphingolipid inhibitor NB-DGJ were separated on aluminum-backed silica gel plates using chloroform/methanol/water (60:35:8, by volume) as solvent and stained with resorcinol (A). Chromatograms with separated glycosphingolipids were incubated with 125I-labeled CTB (B) or lectin from Erythrina cristagalli (C), followed by autoradiography for 12 hr. In (C), the asterisk (*) highlights the putative neolactotetraosylceramide band. Additional detail about samples analyzed is provided in the methods section.
Figure 4 with 2 supplements
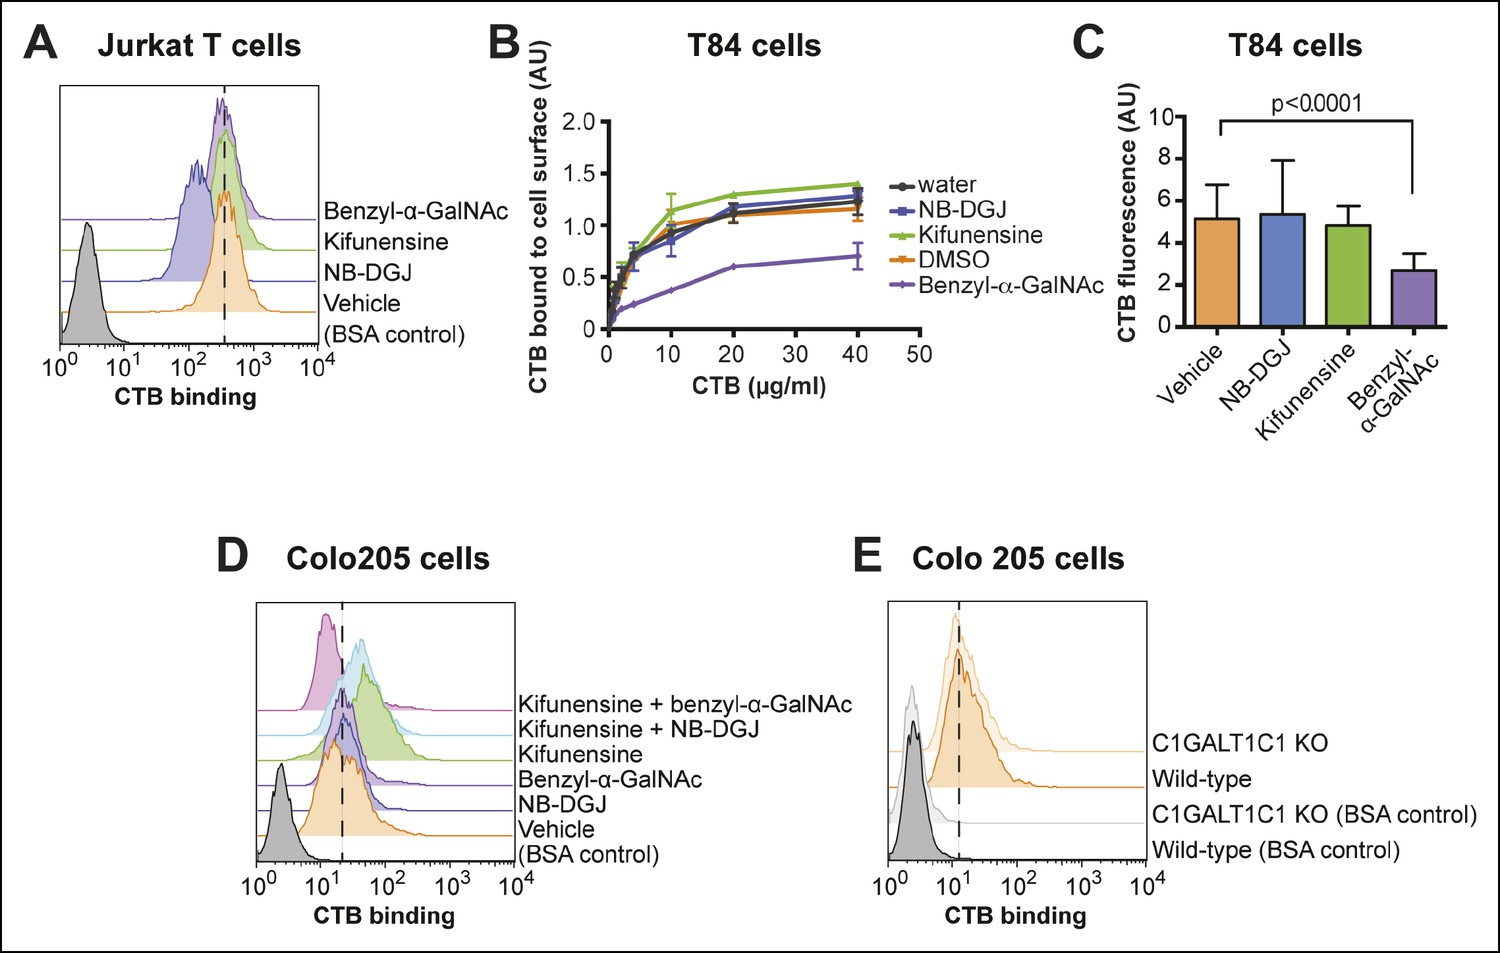
CTB binding to human colonic epithelial cell lines depends on protein glycosylation.
(A) Jurkat cells were cultured with inhibitors of glycosylation. Binding of CTB was measured by flow cytometry. Data shown are a single representative trial from two independent experiments. (B) T84 cells were cultured with inhibitors of glycosylation, then incubated with increasing concentrations of CTB. Binding of CTB was measured by ELISA. Data presented are the mean values for duplicate samples with error bars indicating the standard deviation. A replicate experiment yielded similar results. (C) T84 cells were cultured with inhibitors of glycosylation. Binding of Alexa Fluor 647-CTB was measured by fluorescence microscopy. (D) Colo205 cells were cultured with inhibitors of glycosylation. Binding of CTB was measured by flow cytometry. Data shown are a single representative trial from two independent experiments. (E) Binding of CTB to wild-type or C1GALT1C1 KO Colo205 cells was measured by flow cytometry. Data shown are a single representative trial from three independent experiments.
Figure 4—figure supplement 1
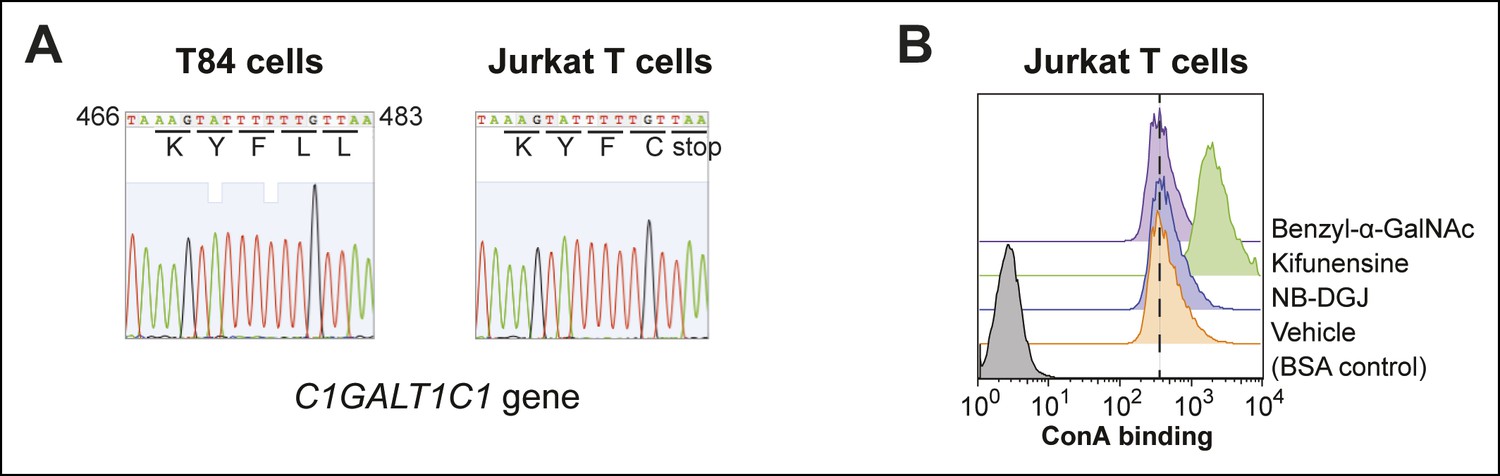
Characterization of protein glycosylation in Jurkat T cells.
(A) The C1GALT1C1 gene was amplified from genomic DNA of T84 and Jurkat cells by PCR, then sequenced. Jurkat C1GALT1C1 was confirmed to contain a frame shift mutation that results in the expression of a truncated form of the protein (Ju and Cummings, 2002). (B) Jurkat T cells were cultured with inhibitors of glycosylation, then ConA binding was analyzed by flow cytometry. ConA binds high mannose structures that are produced when N-linked maturation is blocked.
Figure 4—figure supplement 2
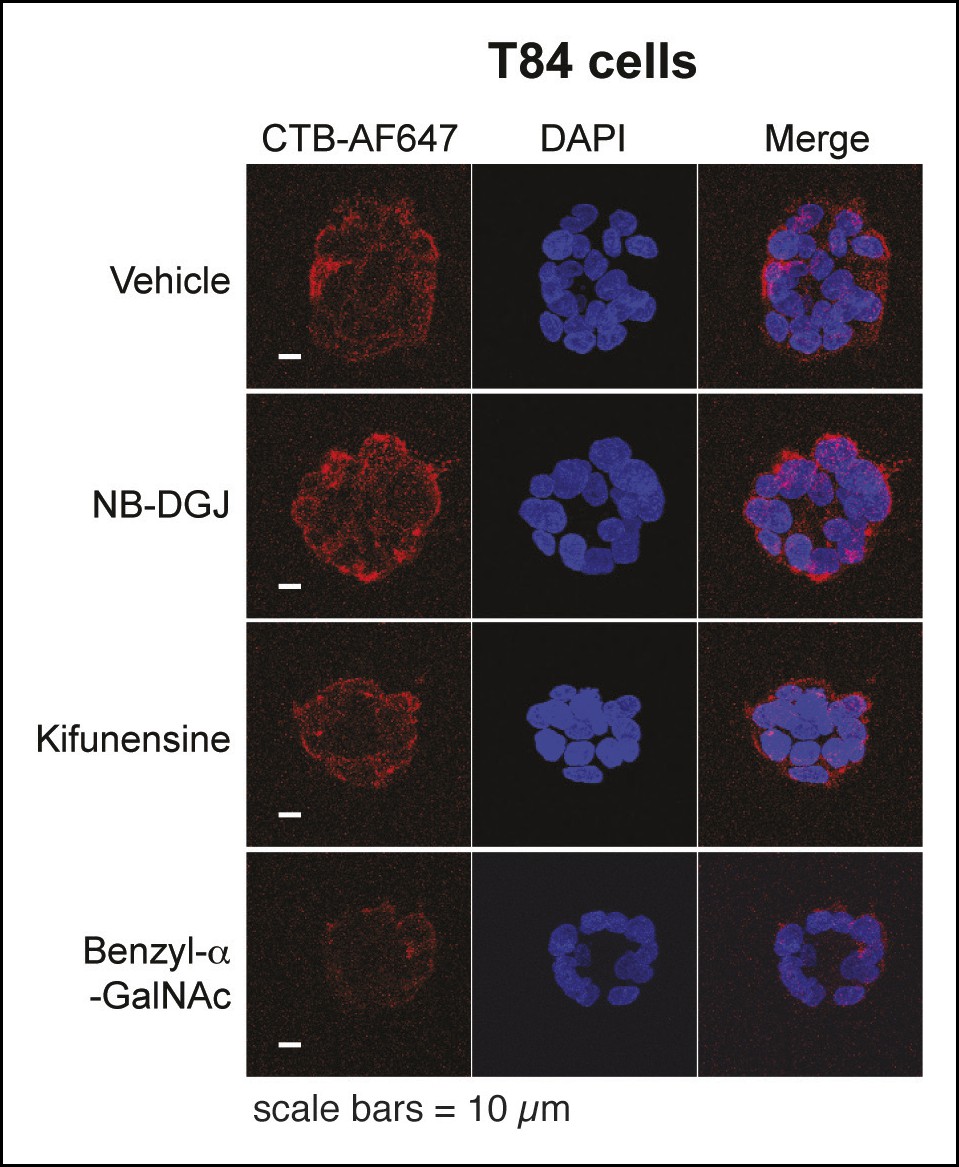
Representative fluorescence microscopy images of Alexa Fluor 647-CTB binding to T84 cells cultured with glycosylation inhibitors.
T84 cells were cultured with inhibitors of glycosylation. Binding of Alexa Fluor 647-CTB and DAPI staining were measured by fluorescence microscopy. Quantification of imaging data is presented in Figure 4C.
Figure 5
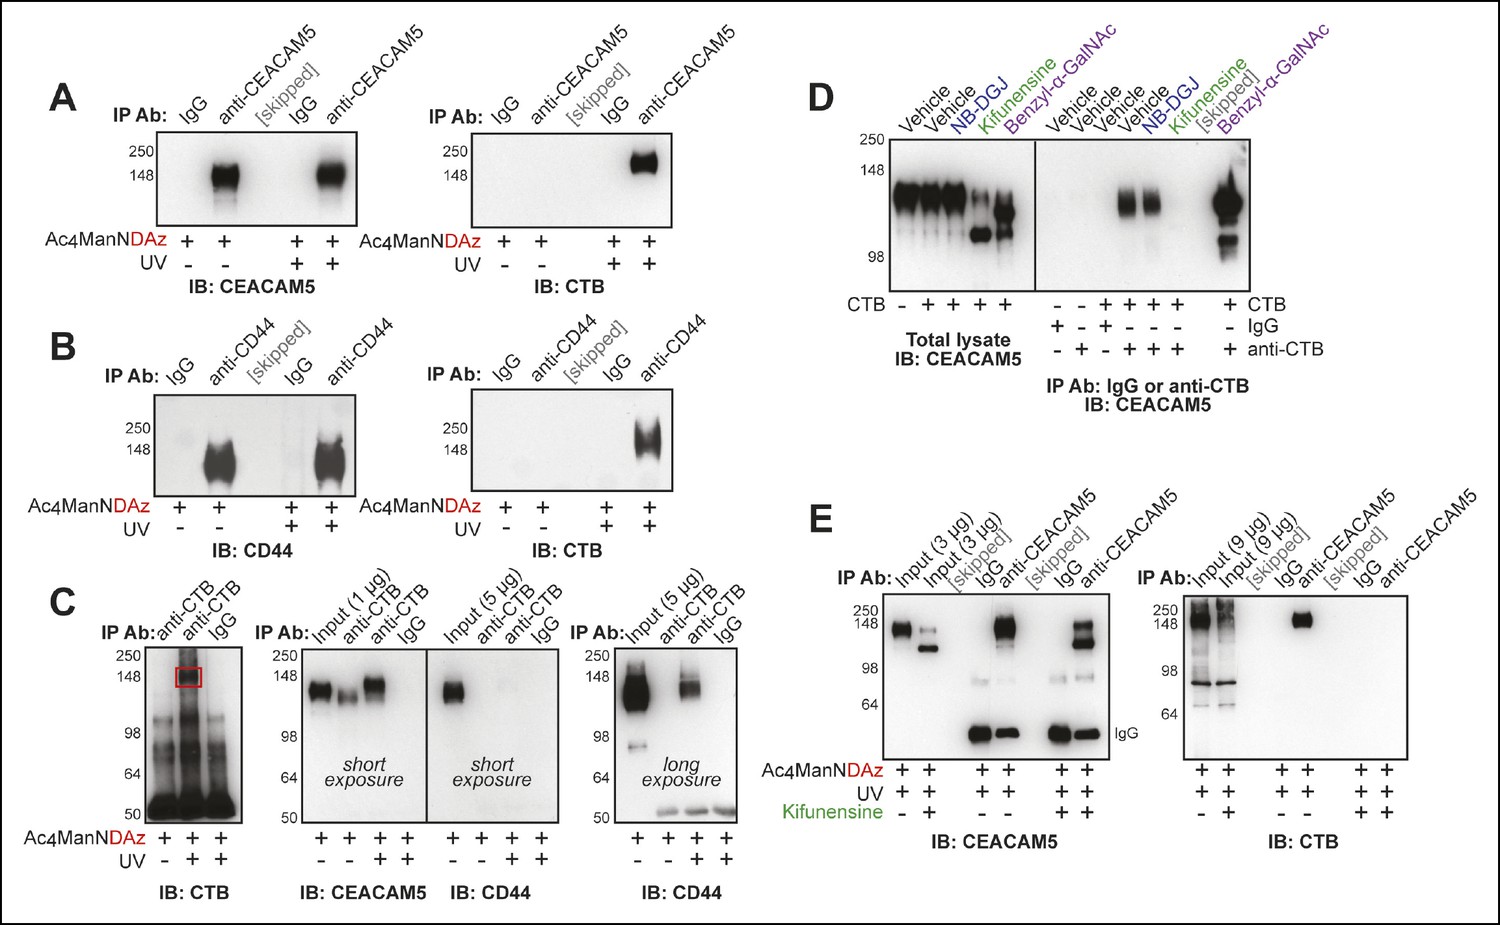
Protein glycosylation is required for a CTB-glycoprotein interaction.
(A) T84 cells were cultured with Ac4ManNDAz, incubated with CTB, and UV irradiated. Immunopurification was performed with control IgG or anti-CEACAM5. 7.5% SDS-PAGE immunoblots were performed with anti-CEACAM5 and anti-CTB. (B) T84 cells were cultured with Ac4ManNDAz, incubated with CTB, and UV irradiated. Immunopurification was performed with control IgG or anti-CD44. 7.5% SDS-PAGE immunoblots were performed with anti-CD44 and anti-CTB. (C) T84 cells were cultured with Ac4ManNDAz, incubated with CTB, and UV irradiated. Immunopurification was performed with control IgG or anti-CTB. 6% SDS-PAGE immunoblots were performed with anti-CTB, anti-CEACAM5, and anti-CD44. (D) T84 cells were cultured with inhibitors of glycosylation, then incubated with or without CTB. Immunopurification was performed with control IgG or anti-CTB. 6% SDS-PAGE immunoblots were performed with anti-CEACAM5. (E) T84 cells were cultured with Ac4ManNDAz and with or without kifunensine, incubated with CTB, and UV irradiated. Immunopurification was performed with control IgG or anti-CEACAM5. 7.5% SDS-PAGE immunoblots were performed with anti-CEACAM5 and anti-CTB.
Figure 6 with 3 supplements
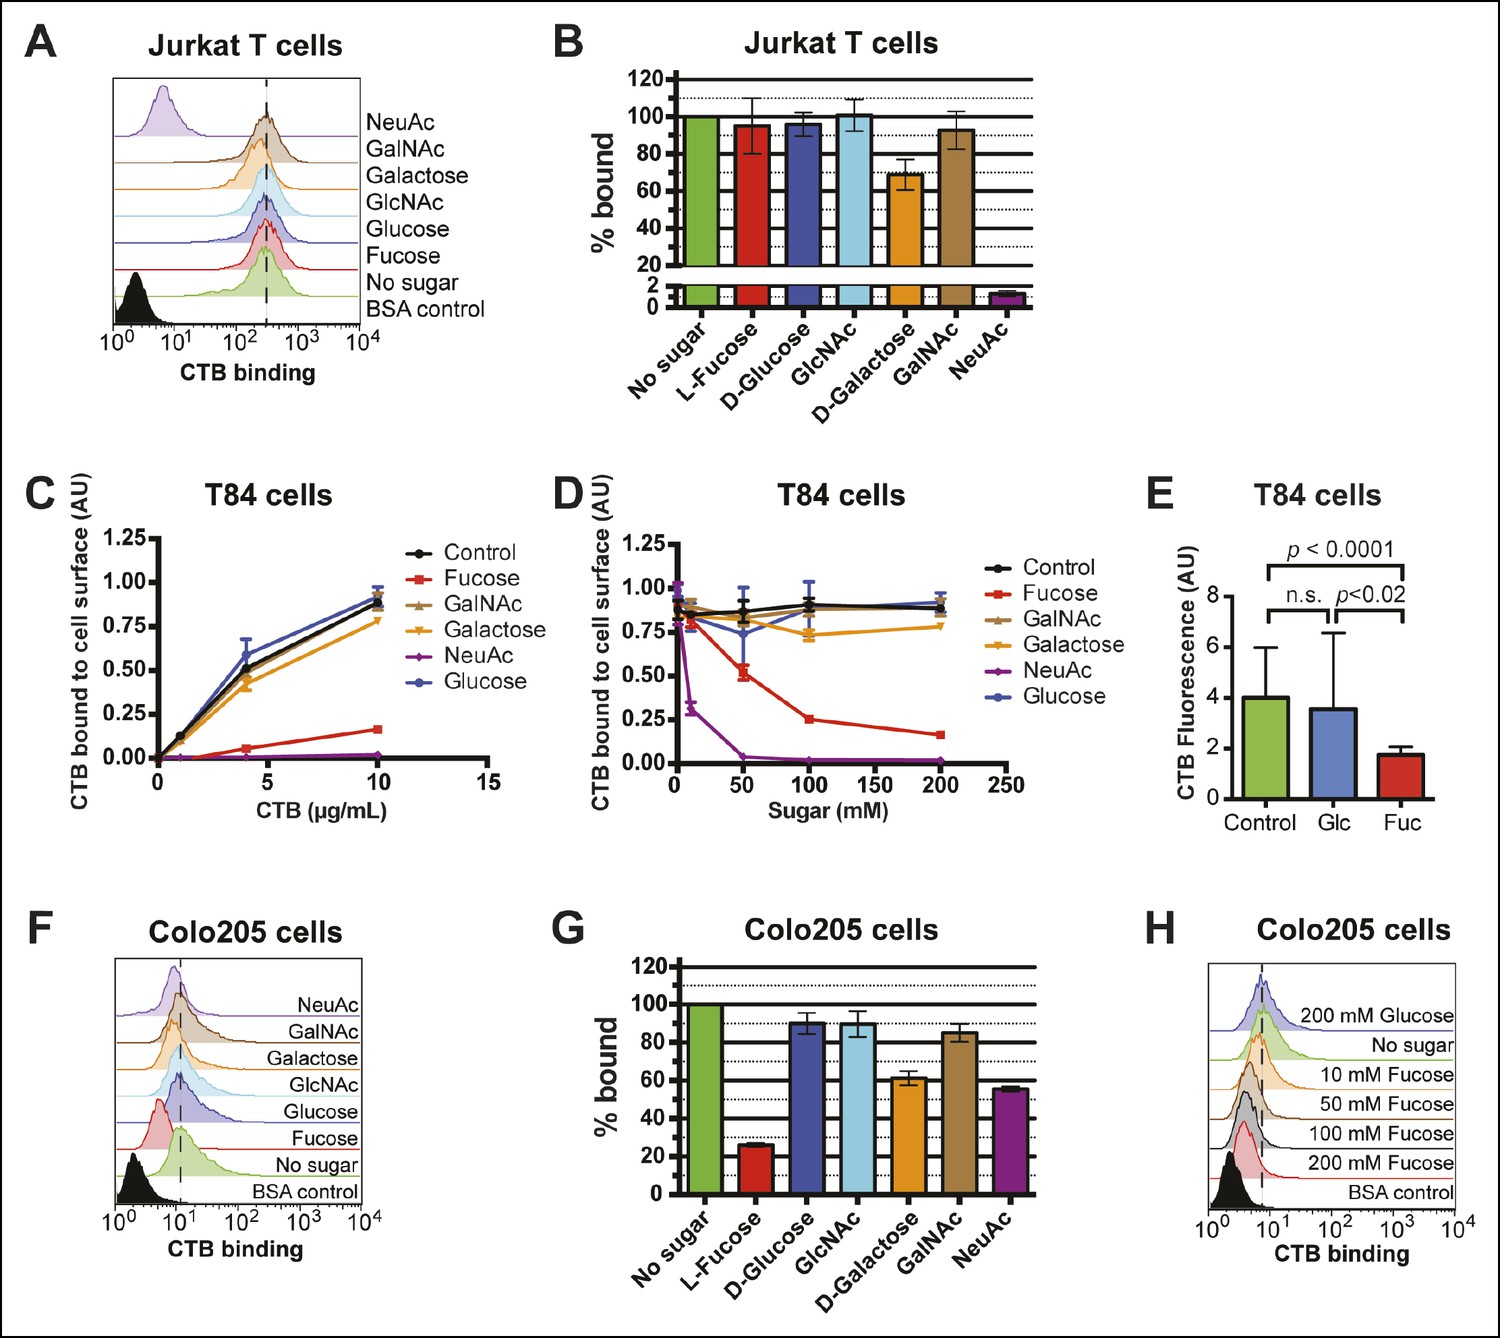
Fucose blocks binding of CTB to human colonic epithelial cell lines.
(A) Jurkat cells were incubated with 4 µg/mL of CTB in the presence of 100 mM of free sugar. Binding of CTB was measured by flow cytometry. Data shown are a single representative trial from three independent experiments. (B) The median fluorescence intensity (MFI) for the no sugar treatment sample presented in panel A was normalized to 100% bound. Data shown represent an average of three independent trials and their standard deviations. (C) T84 cells were incubated with 200 mM of free sugar and variable concentrations of CTB. Binding of CTB was measured by ELISA. Data presented are the mean values for duplicate samples with error bars indicating the standard deviation. A replicate experiment yielded similar results. (D) T84 cells were incubated with variable free sugar concentrations and 10 µg/mL of CTB. Binding of CTB was measured by ELISA. Data presented are the mean values for duplicate samples with error bars indicating the standard deviation. A replicate experiment yielded similar results. (E) T84 cells were incubated with 100 mM fucose or 100 mM glucose in the presence of Alexa Fluor 647-CTB. Binding of Alexa Fluor 647-CTB was measured by fluorescence microscopy. (F) Colo205 cells were incubated with 10 µg/mL of CTB in the presence of 100 mM of free sugar. Binding of CTB was measured by flow cytometry. Data shown are a single representative trial from three independent experiments. (G) The median fluorescence intensity (MFI) for the no sugar treatment sample presented in panel F was normalized to 100% bound. Data shown represent an average of three independent trials and their standard deviations. (H) Colo205 cells were incubated with variable free fucose concentrations and 10 µg/mL of CTB. Binding of CTB was measured by flow cytometry. Data shown are a single representative trial from two independent experiments.
Figure 6—figure supplement 1
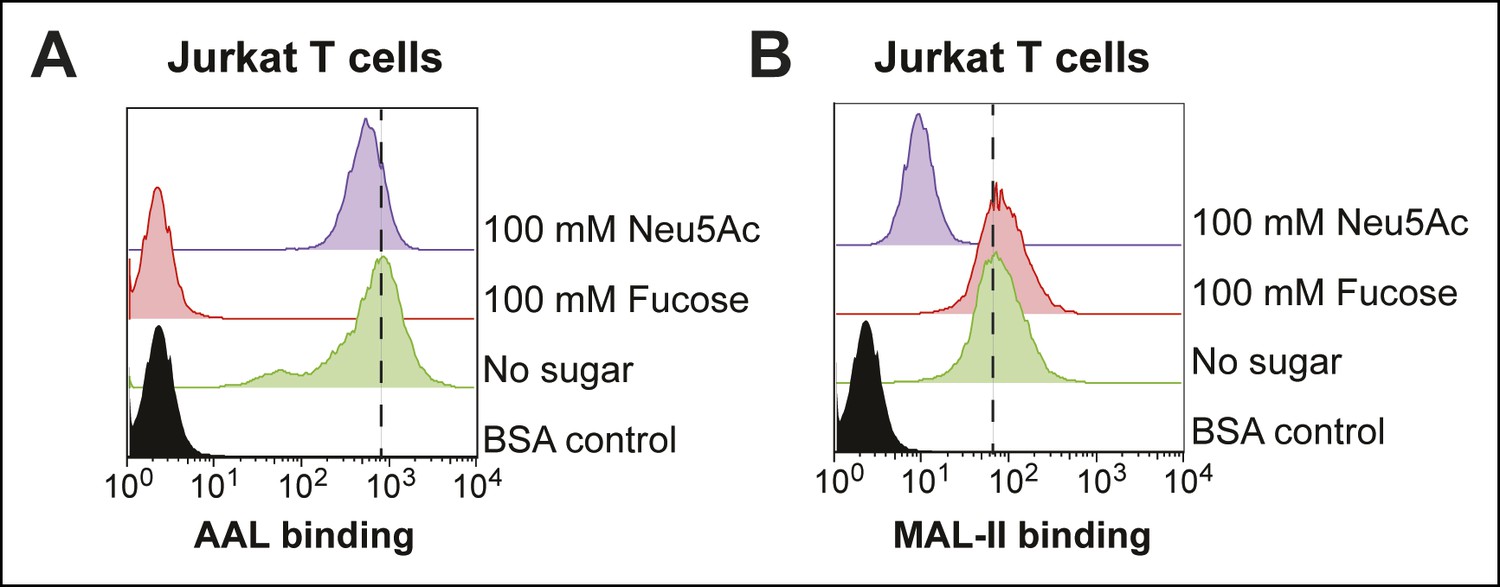
Effects of free sugars on lectin binding to Jurkat cells.
(A) Jurkat T cells were incubated with 100 mM fucose or Neu5Ac and 4 µg/mL of biotin-AAL. Binding of AAL was measured by flow cytometry. (B) Jurkat T cells were incubated with 100 mM fucose or Neu5Ac and 4 µg/mL of biotin-MAL-II. Binding of MAL-II was measured by flow cytometry.
Figure 6—figure supplement 2
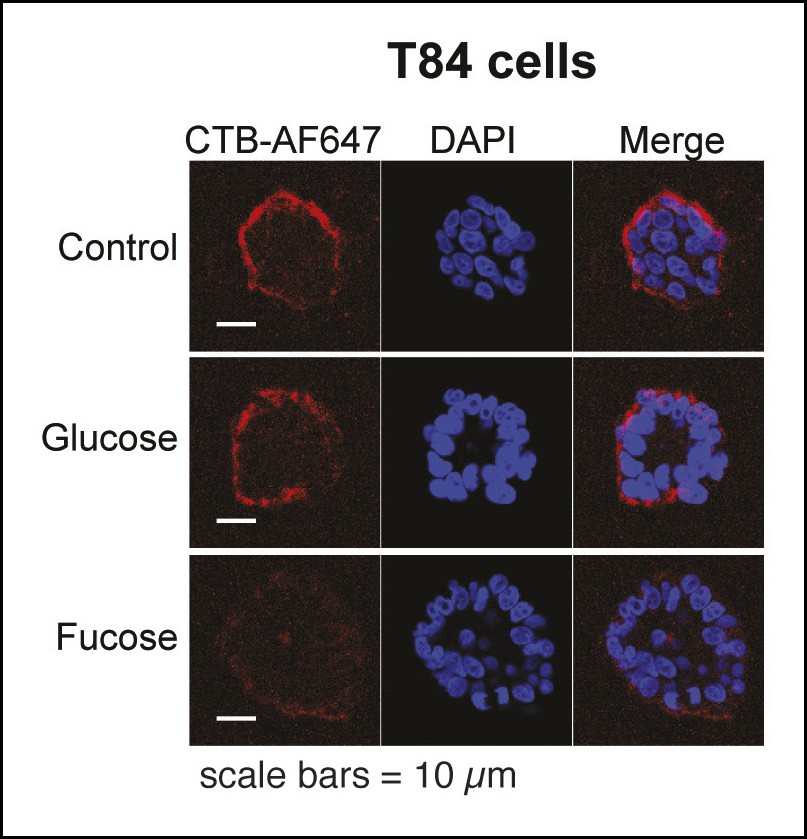
Representative fluorescence microscopy images showing effects of free sugars on binding of Alexa Fluor 647-CTB to T84 cells.
Binding of Alexa Fluor 647-CTB and DAPI staining in the presence of 100 mM fucose or 100 mM glucose were measured by fluorescence microscopy. Quantification of imaging data is presented in Figure 6E.
Figure 6—figure supplement 3
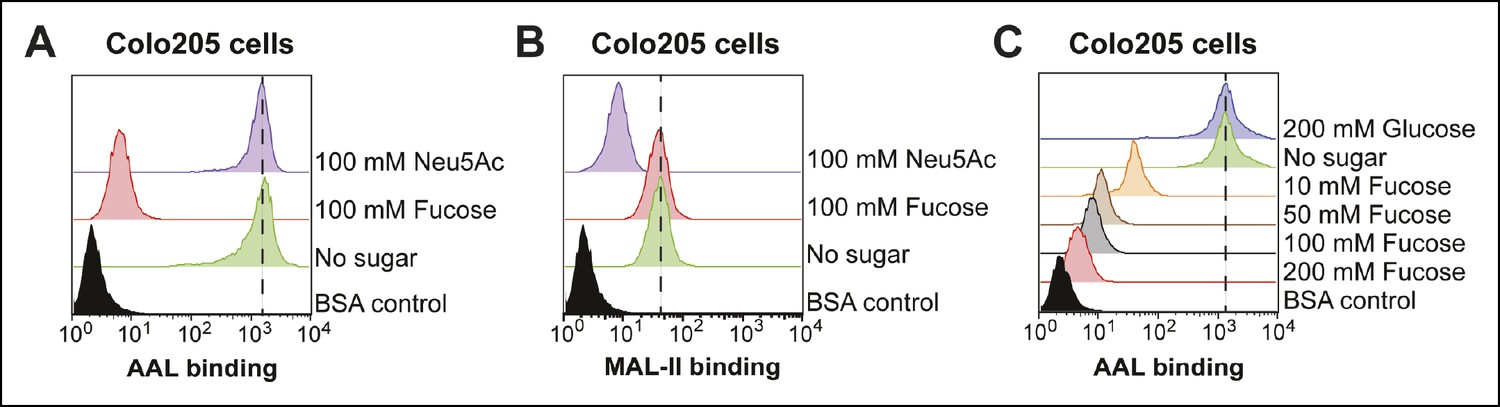
Effects of free sugars on lectin binding to Colo205 cells.
(A) Colo205 cells were incubated with 100 mM fucose or Neu5Ac and 10 µg/mL of biotin-AAL. Binding of AAL was measured by flow cytometry. (B) Colo205 cells were incubated with 100 mM fucose or Neu5Ac and 10 µg/mL of biotin-MAL-II. Binding of MAL-II was measured by flow cytometry. (C) Colo205 cells were incubated with variable free fucose concentrations and 10 µg/mL of biotin-AAL. Binding of AAL was measured by flow cytometry.
Figure 7
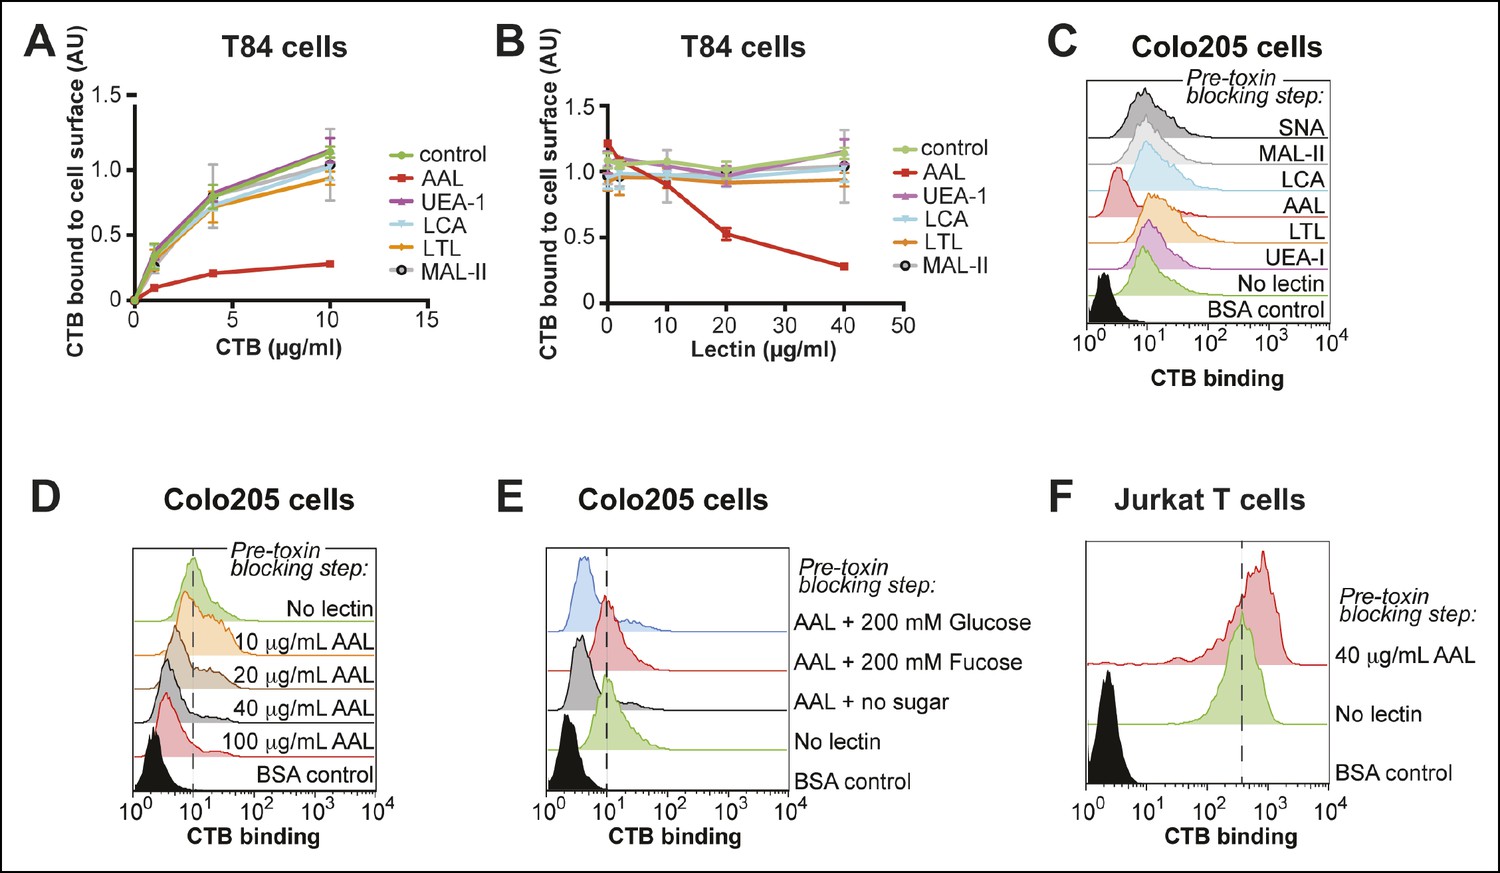
Aleuria aurantia lectin (AAL) blocks CTB binding to human colonic epithelial cell lines.
(A) T84 cells were incubated with 40 µg/mL of the indicated lectin, then variable concentrations of CTB were added. Binding of CTB was measured by ELISA. (B) T84 cells were incubated with variable lectin concentrations, then 10 µg/mL of CTB was added. Binding of CTB was measured by ELISA. Data presented are the mean values for duplicate samples with error bars indicating the standard deviation. A replicate experiment yielded similar results. (C) Colo205 cells were incubated with 100 µg/mL of the indicated lectins, then 10 µg/mL of CTB was added. Binding of CTB was measured by flow cytometry. Data shown are a single representative trial from three independent experiments. (D) Colo205 cells were incubated with variable AAL lectin concentrations, then 10 µg/mL of CTB was added. Binding of CTB was measured by flow cytometry. Data shown are a single representative trial from two independent experiments. (E) Colo205 cells were incubated with 40 µg/mL of AAL lectin in the presence of 200 mM free sugar (fucose or glucose), then 10 µg/mL of CTB was added. Binding of CTB was measured by flow cytometry. Data shown are a single representative trial from two independent experiments. (F) Jurkat T cells were incubated with 40 µg/mL AAL lectin, then 4 µg/mL of CTB was added. Binding of CTB was measured by flow cytometry. Data shown are a single representative trial from two independent experiments.
Figure 8 with 3 supplements
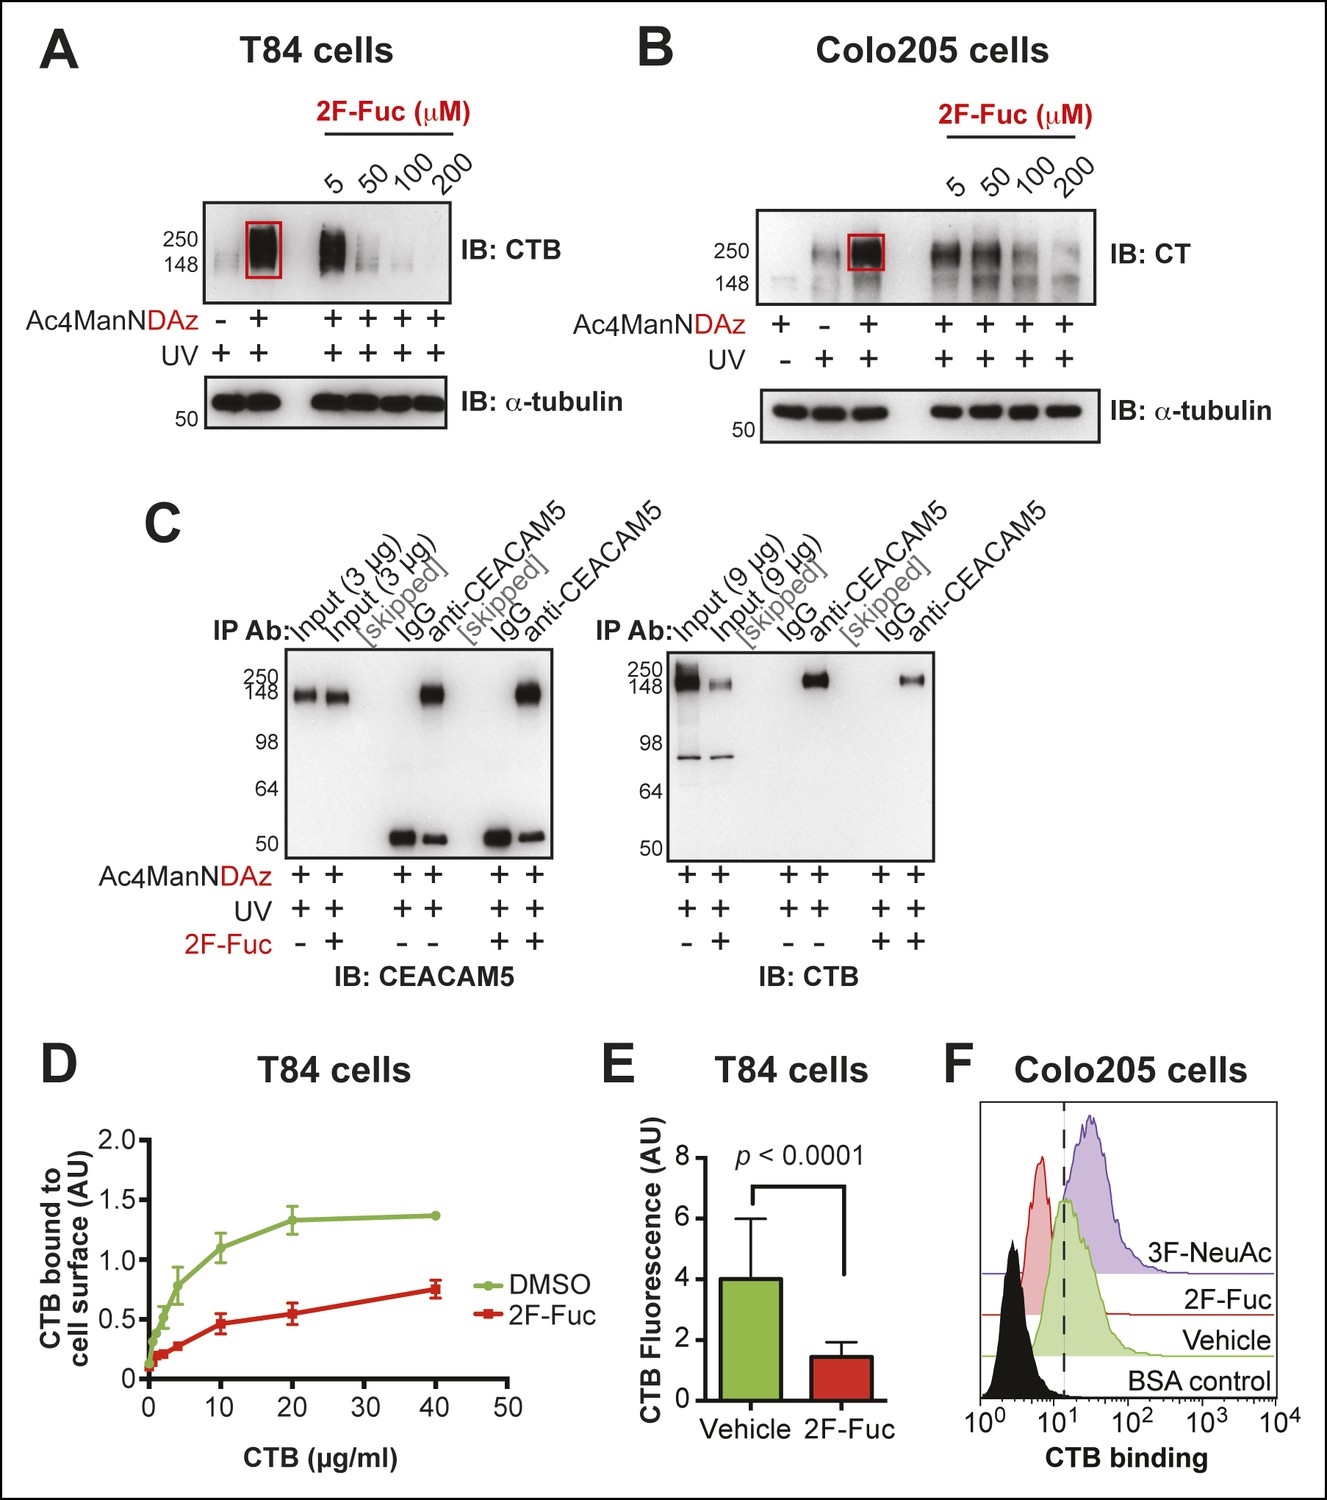
Inhibition of fucosylation reduces CTB crosslinking and binding to human colonic epithelial cell lines.
(A)T84 cells were cultured with Ac4ManNDAz and increasing concentrations of 2F-Fuc, incubated with CTB, and UV irradiated. Lysates were analyzed by 7.5% SDS-PAGE immunoblot with anti-CTB antibody. (B)Colo205 cells were cultured with Ac4ManNDAz and increasing concentrations of 2F-Fuc, incubated with CTB, and UV irradiated. Lysates were analyzed by 7.5% SDS-PAGE immunoblot with anti-CT antibody. (C) T84 cells were cultured with Ac4ManNDAz and with or without 2F-Fuc, incubated with CTB, and UV irradiated. Immunopurification was performed with IgG or anti-CEACAM5. 7.5% SDS-PAGE immunoblots were performed with anti-CEACAM5 and anti-CTB. (D)T84 cells were cultured with 2F-Fuc, then incubated with increasing concentrations of CTB. Binding of CTB was measured by ELISA. Data presented are the mean values for duplicate samples with error bars indicating the standard deviation. A replicate experiment yielded similar results. (E) T84 cells were cultured with 2F-Fuc. Binding of Alexa Fluor 647-CTB was measured by fluorescence microscopy. (F) Colo205 cells were cultured with 2F-Fuc or 3F-NeuAc. Binding of CTB was measured by flow cytometry. Data shown are a single representative trial from three independent experiments.
Figure 8—figure supplement 1
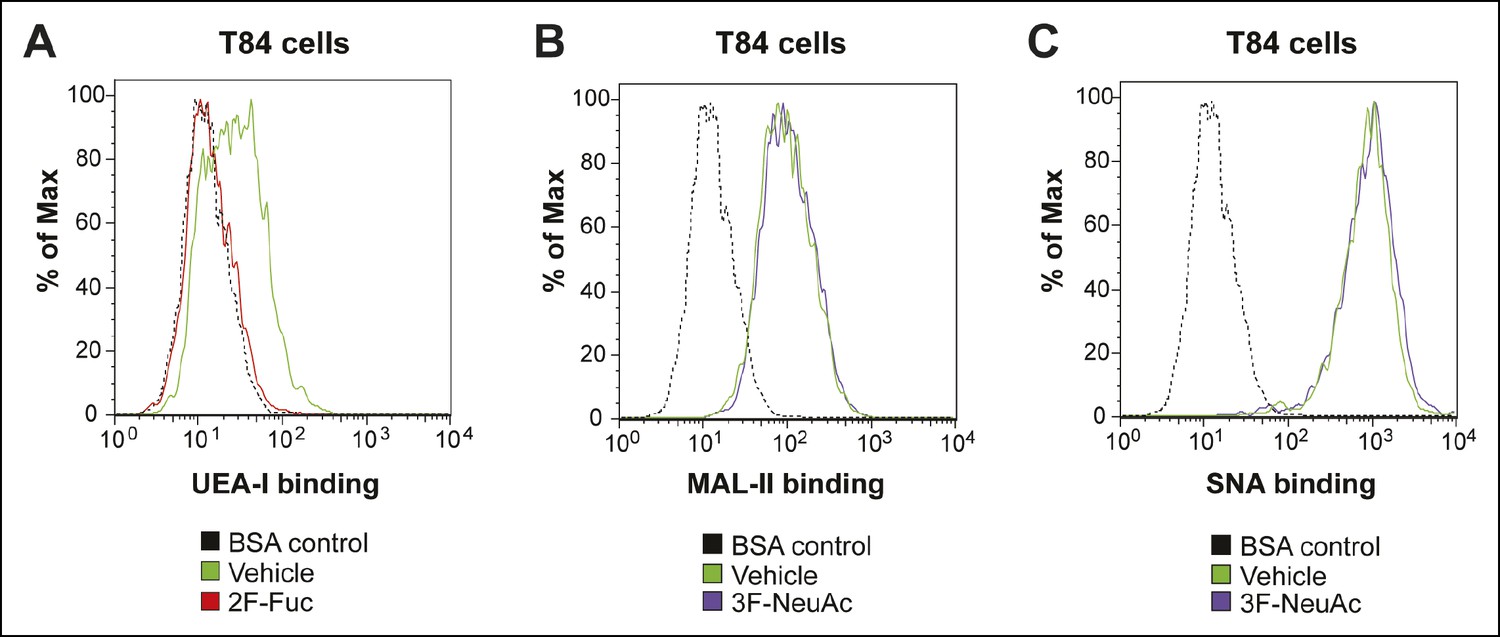
Culturing T84 cells with 2F-Fuc causes decreased cell surface fucosylation.
(A) Culturing T84 cells with 100 µM 2F-Fuc results in reduced biotin-UEA-I binding by flow cytometry. (B) Culturing T84 cells with 100 µM 3F-NeuAc does not result in reduced biotin-MAL-II binding by flow cytometry. (C) Culturing T84 cells with 100 µM 3F-NeuAc does not result in reduced biotin-SNA binding by flow cytometry.
Figure 8—figure supplement 2
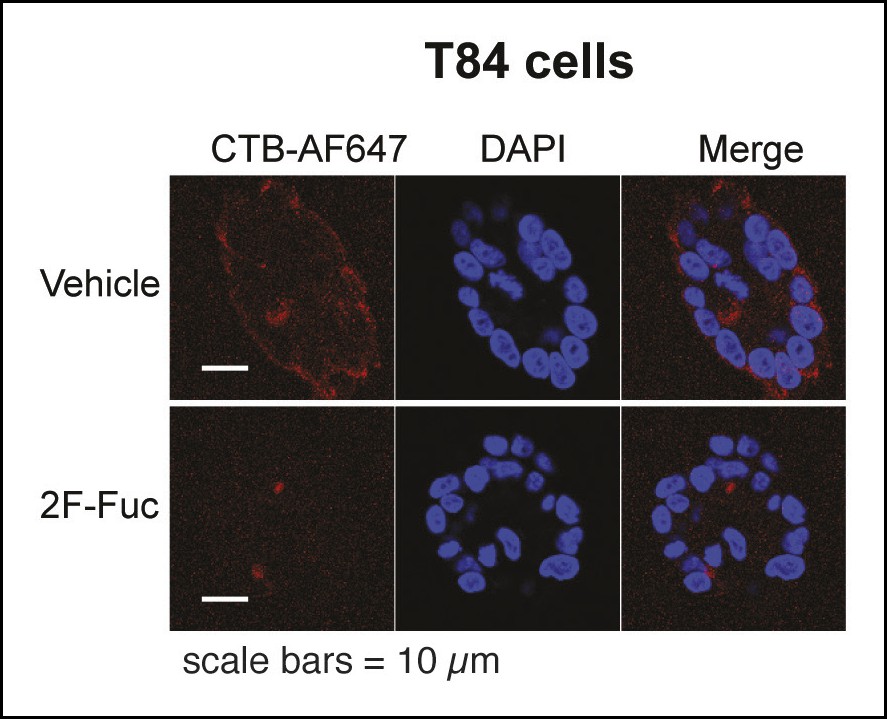
Representative fluorescence microscopy images of Alexa Fluor 647-CTB binding to T84 cells cultured with 2F-Fuc.
T84 cells were cultured with 2F-Fuc. Binding of Alexa Fluor 647-CTB and DAPI staining were measured by fluorescence microscopy. Quantification of imaging data is presented in Figure 8E.
Figure 8—figure supplement 3
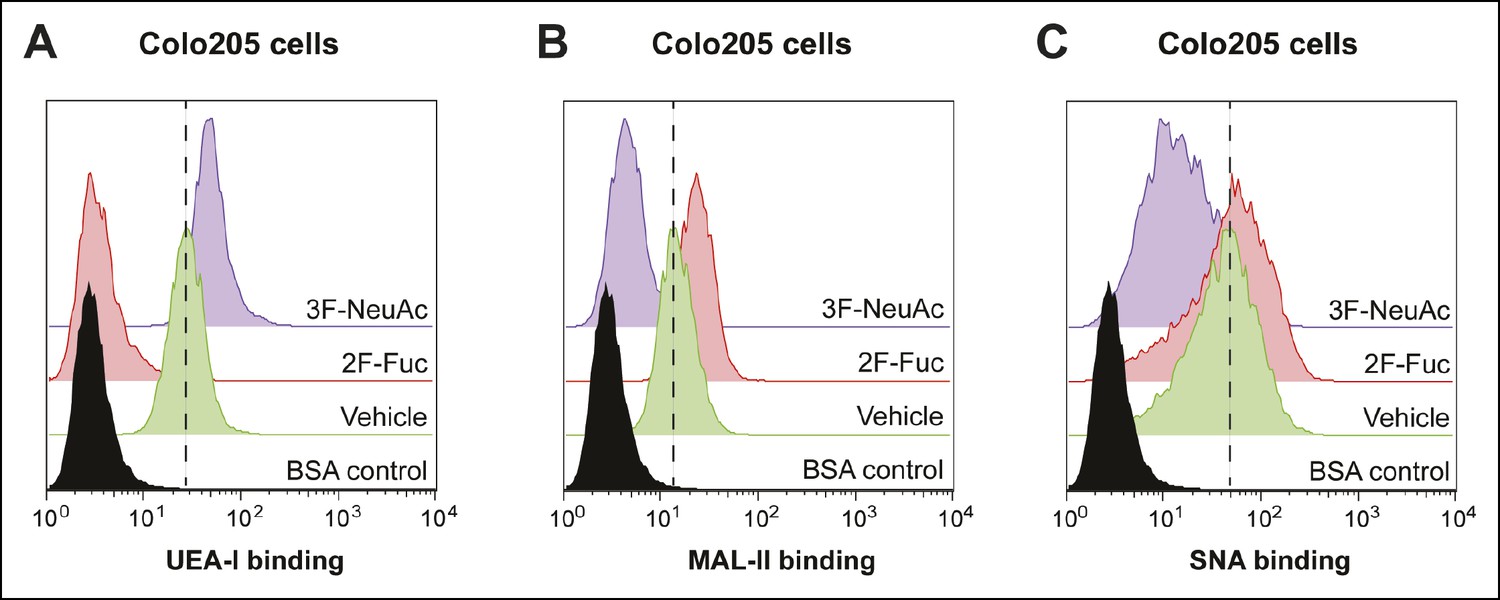
Culturing Colo205 cells with 2F-Fuc and 3F-NeuAc causes decreased cell surface fucosylation and sialylation, respectively.
(A) Culturing Colo205 cells with 200 µM 2F-Fuc results in reduced biotin-UEA-I binding by flow cytometry. (B) Culturing Colo205 cells with 200 µM 3F-NeuAc results in reduced biotin-MAL-II binding by flow cytometry. (C) Culturing Colo205 cells with 200 µM 3F-NeuAc results in reduced biotin-SNA binding by flow cytometry.
Figure 9 with 3 supplements
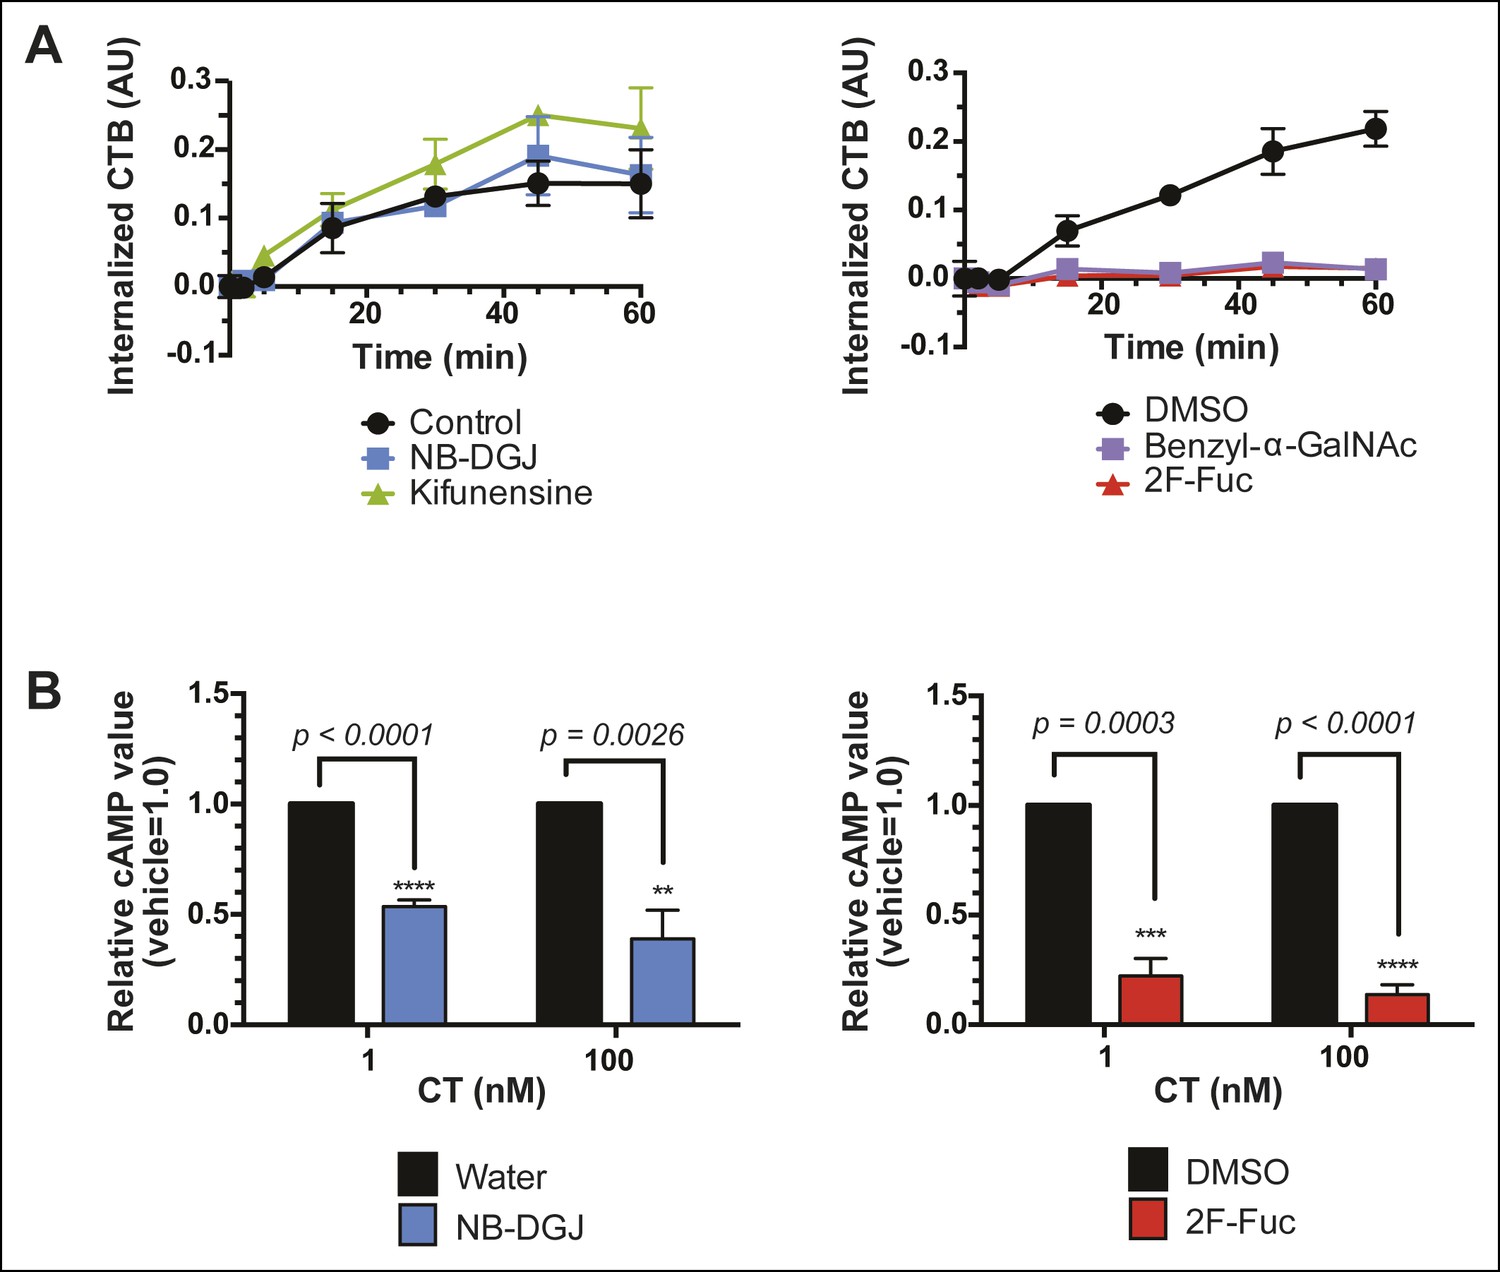
Fucosylation mediates CT internalization and intoxication in a human colonic epithelial cell line.
(A) Internalized biotin-CTB for vehicle-, NB-DGJ-, and kifunensine-treated cells and vehicle-, benzyl-α-GalNAc-, and 2F-Fuc-treated cells are displayed as a function of time. Cells were incubated with biotin-CTB at 37°C for the indicated amount of time to allow internalization to occur. The amount of internalized biotin-CTB was measured by ELISA. Data presented are the mean values for duplicate samples with error bars indicating the standard deviation. Replicate experiments yielded similar results. (B) T84 cells were cultured with inhibitors of glycosylation. Cells were exposed to variable concentrations of CT holotoxin for 1 hr. cAMP levels were measured by ELISA. The cAMP levels for experimental samples are reported relative to the corresponding vehicle-treated control cells. Data shown represent an average of four independent trials.
Figure 9—figure supplement 1
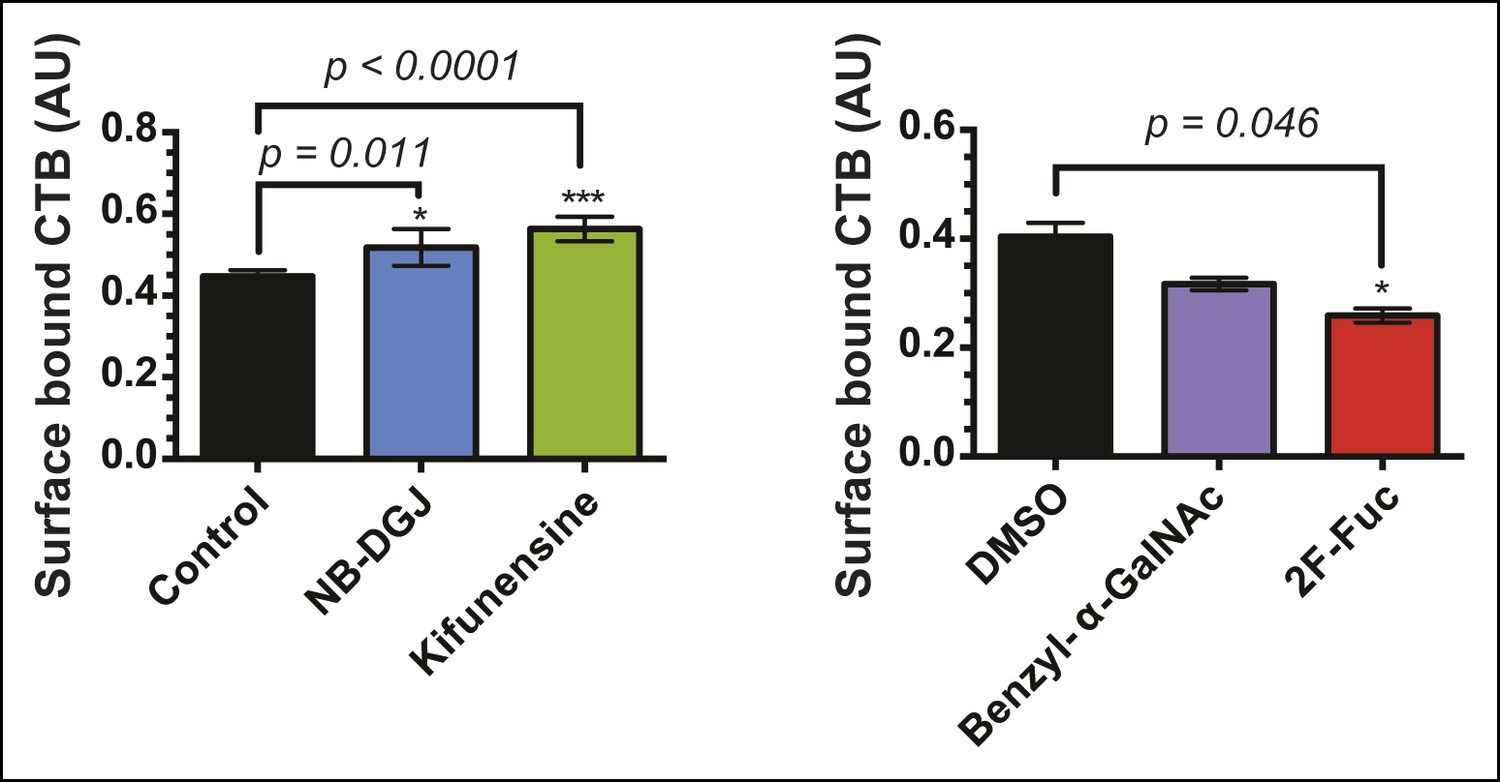
Total surface-bound biotin-CTB for vehicle-, NB-DGJ-, and kifunensine-treated cells and vehicle-, benzyl-α-GalNAc-, and 2F-Fuc-treated cells.
Cells were incubated with biotin-CTB at 4°C. Surface-bound biotin-CTB was measured by ELISA.
Figure 9—figure supplement 2
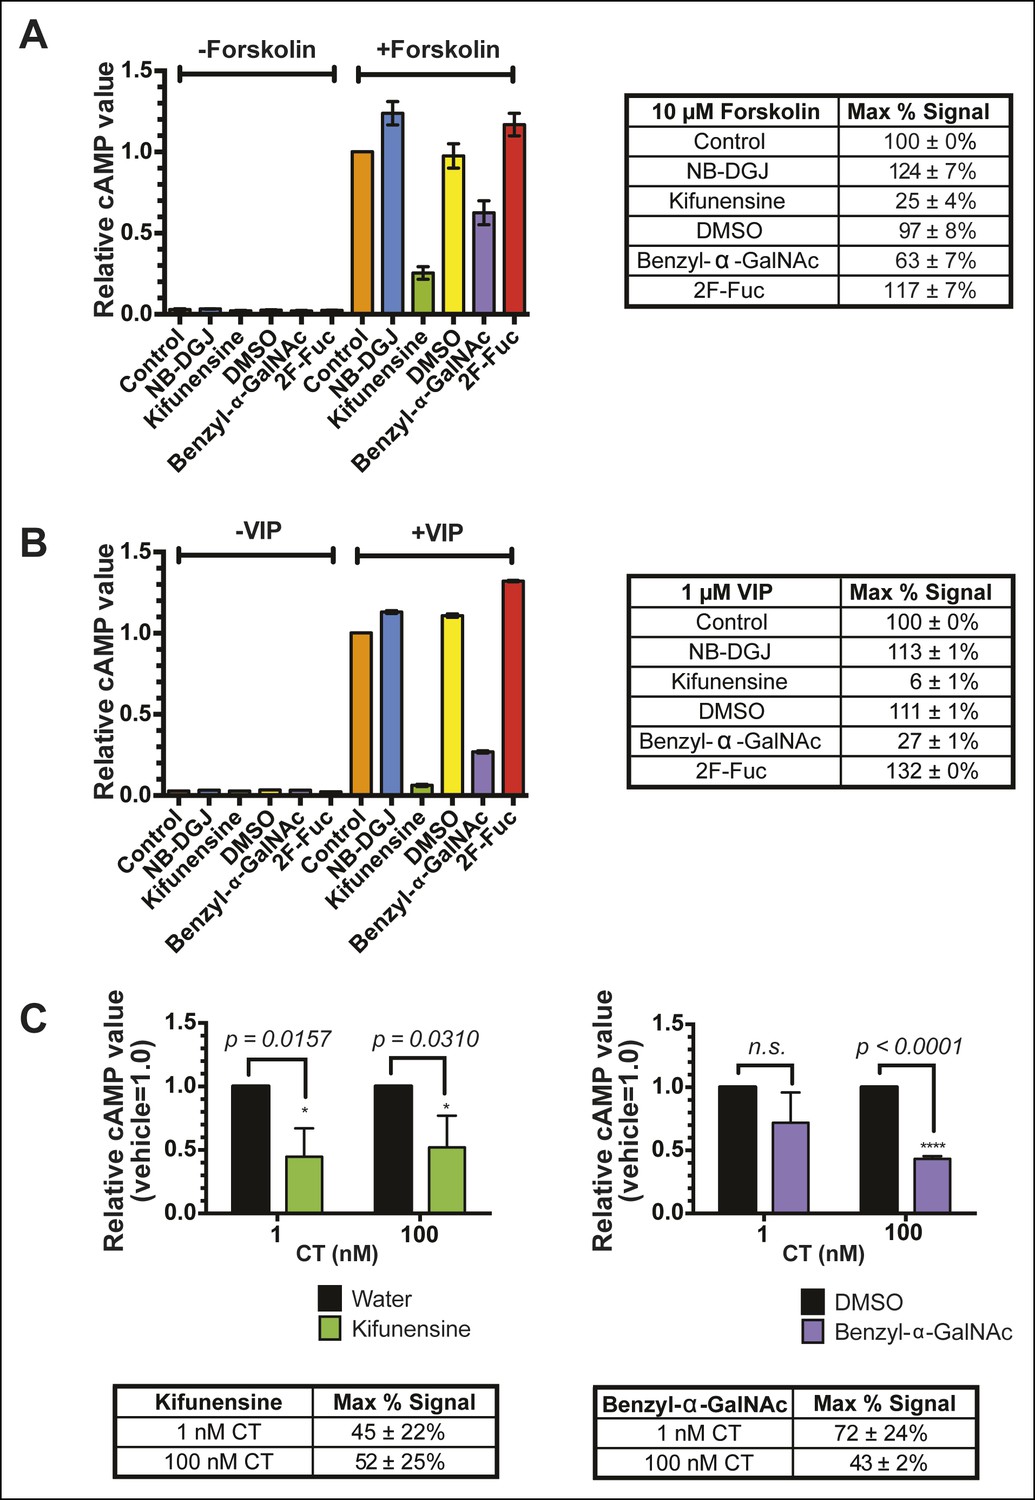
The inhibitors of glycosylation kifunensine and benzyl-α-GalNAc exhibit off-target effects on cAMP production.
(A) T84 cells were cultured with inhibitors of glycosylation. Cells were exposed to 10 μM forskolin for 1 hr at 37°C. cAMP levels were measured by ELISA. The cAMP levels are reported relative to control cells induced with forskolin. Data shown represent an average of two independent trials. (B) T84 cells were cultured with inhibitors of glycosylation. Cells were exposed to 1 μM VIP (vasoactive intestinal peptide) for 1 hr at 37°C. cAMP levels were measured by ELISA. The cAMP levels are reported relative to control cells induced with VIP. Data shown represent an average of two independent trials. (C) T84 cells were cultured with inhibitors of glycosylation. Cells were exposed to variable concentrations of CT holotoxin for 1 hr. cAMP levels were measured by ELISA. The cAMP levels for experimental samples are reported relative to the corresponding vehicle-treated control cells. Data shown represent an average of four independent trials.
Figure 9—figure supplement 3
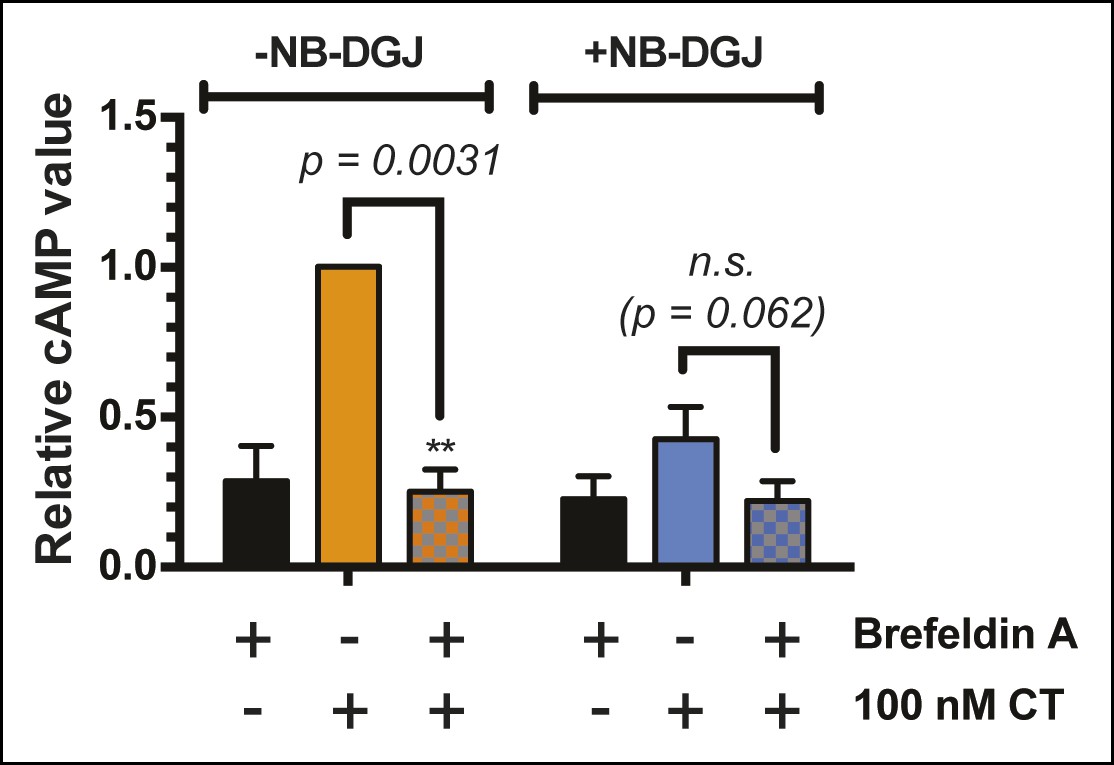
Brefeldin A blocks CT-induced cAMP accumulation.
T84 cells were cultured with or without the ganglioside inhibitor NB-DGJ. Cells were exposed to 1 μg/mL brefeldin A at 37°C for 30 min, then 100 nM of CT holotoxin for 1 hr. cAMP levels were measured by ELISA. The cAMP levels are reported relative to control cells induced with CT in the absence of brefeldin A treatment. Data shown represent an average of three independent trials.
Figure 10
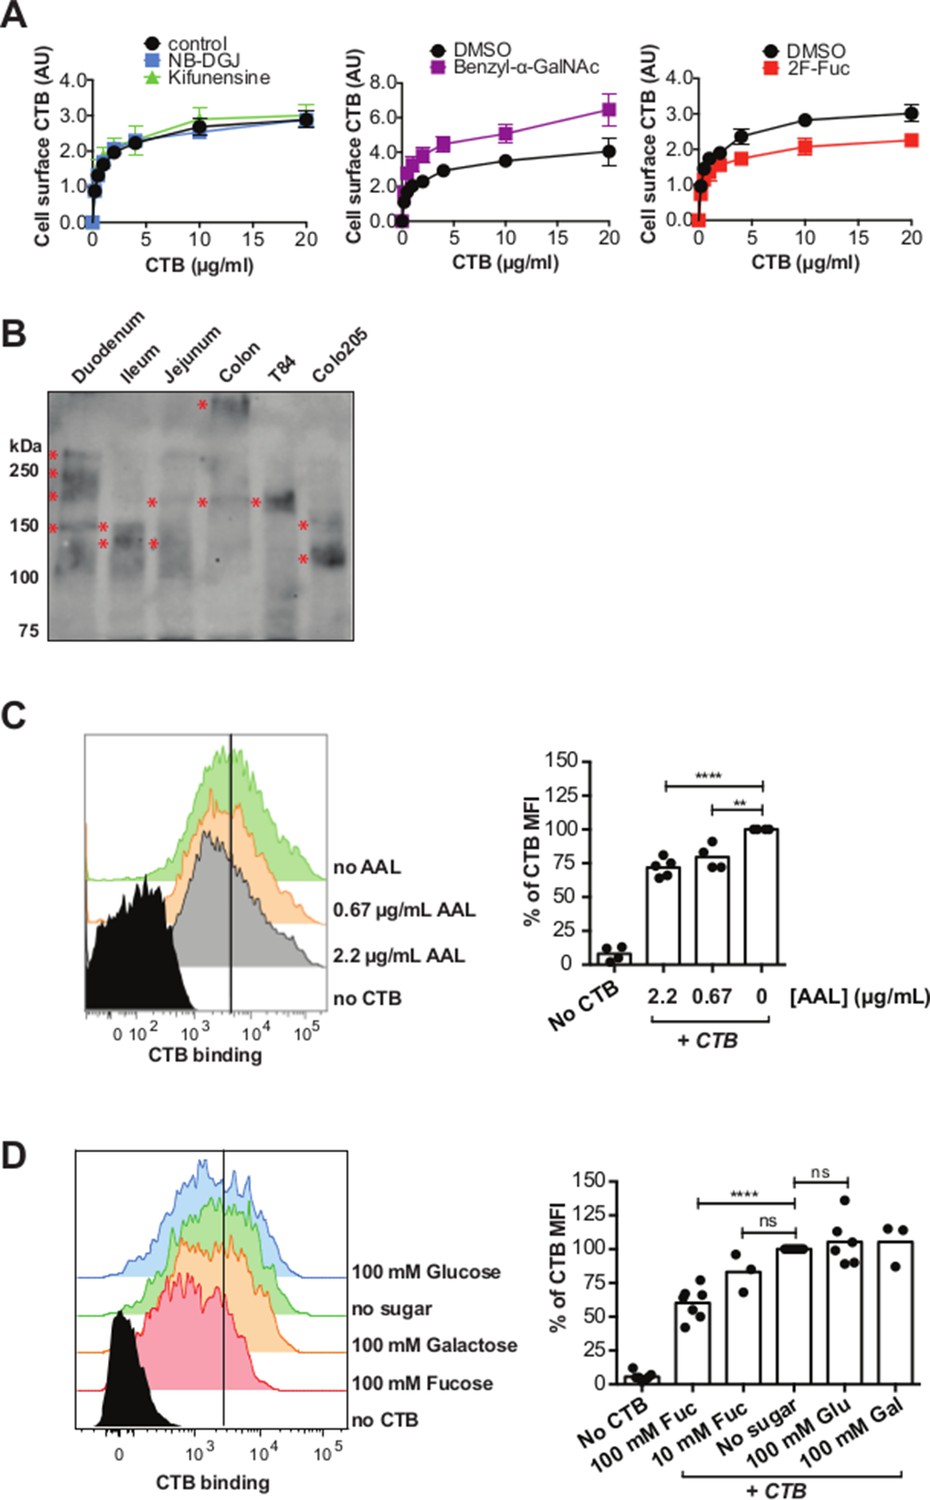
CTB binds fucosylated glycoproteins present in normal gut epithelia.
(A) HCEC cells were cultured with inhibitors of glycosylation. Binding of CTB was measured by ELISA. Data presented are the mean values for triplicate samples with error bars indicating the standard deviation. Two additional replicate experiments yielded similar results. (B) Normal human intestinal epithelial lysate from three parts of small intestine (duodenum, jejunum, and ileum), normal human colon epithelial lysate, T84 cell lysate, and Colo205 cell lysate were separated by SDS-PAGE and probed with CTB-HRP. (C and D) CTB binding to freshly isolated human colonic epithelial cells (LIVE/DEAD-CD45- EpCAM+) assessed by flow cytometry. Cells were blocked with AAL at the indicated concentrations before addition of CTB – Alexa Fluor 647 and antibodies (C) or stained with CTB – Alexa Fluor 647 and antibodies in buffer containing the indicated concentrations of fucose (D). The level of blocking was calculated as percent CTB – Alexa Fluor 647 mean fluorescence intensity (MFI) compared to samples without sugar or lectin block. Representative flow cytometry data are shown. For bar graphs, results are pooled from 2–4 independent experiments; each symbol represents one patient *p<0.05, **p<0.01, ***p<0.001 and ****p<0.0001.
Tables
Table 1
Proteomics analyses of CTB crosslinked complexes.
| In gel | In solution | ||||||
| Protein symbol | Protein name | Peptide sequences | % coverage | Spectral count | Peptide sequences | % coverage | Spectral count |
| ITGB4 | Integrin beta-4 | 11 | 6.5 | 14 | NA | NA | NA |
| SLC12A2 | Solute carrier family 12 (Sodium/potassium/chloride transporters), member 2 (isoform CRA) | 6 | 6.7 | 10 | NA | NA | NA |
| CD44 | CD44 antigen | 5 | 28.6 | 7.92 | NA | NA | NA |
| PLXNB2 | Plexin-B2 | 4 | 3 | 6 | 5 | 3.5 | 3.00 |
| CEACAM5 | Carcinoembryonic antigen-related cell adhesion molecule 5 | 3 | 6.3 | 5 | 2 | 3.2 | 4.00 |
| CTB | Cholera toxin subunit B | 2 | 15.3 | 4 | 8 | 53.2 | 113.00 |
| LY75 | Lymphocyte antigen 75 (isoform 4) | 3 | 2.1 | 3 | 9 | 6.3 | 11.00 |
| COPA | Coatomer subunit alpha | 3 | 3 | 3 | NA | NA | NA |
| SPTB2 | Spectrin beta chain, brain 1 | 4 | 1.8 | 3 | NA | NA | NA |
| ITGA6 | Integrin alpha-6 (isoform Alpha-6X1A) | NA | NA | NA | 13 | 12.7 | 14.83 |
| EGFR | Epidermal growth factor receptor (isoform 1) | NA | NA | NA | 12 | 11.5 | 11.92 |
| MUC13 | Mucin-13 | NA | NA | NA | 6 | 15.6 | 9.00 |
| ITGB1 | Integrin beta-1 (isoform Beta-1A) | NA | NA | NA | 7 | 9.3 | 7.96 |
| DPP4 | Dipeptidyl peptidase 4 | NA | NA | NA | 8 | 10.1 | 7.00 |
| CDCP1 | CUB domain-containing protein 1 (isoform 1) | NA | NA | NA | 6 | 6.3 | 6.99 |
| PLXNA1 | Plexin-A1 | NA | NA | NA | 8 | 4.2 | 6.98 |
| SPINT1 | Kunitz-type protease inhibitor 1 (isoform 2) | NA | NA | NA | 6 | 11.3 | 6.00 |
| PARP4 | Poly [ADP-ribose] polymerase 4 | NA | NA | NA | 6 | 3.8 | 6.00 |
| ITGAV | Isoform 1 of Integrin alpha-V (isoform 1) | NA | NA | NA | 5 | 5.1 | 5.00 |
| ATP1B3 | Sodium/potassium-transporting ATPase subunit beta-3 | NA | NA | NA | 4 | 17.2 | 4.97 |
| PTGFRN | PTGFRN protein (Fragment) | NA | NA | NA | 6 | 10.6 | 4.00 |
| SCARB1 | Scavenger receptor class B member 1 (isoform 1) | NA | NA | NA | 4 | 9.3 | 4.00 |
| PGRMC1 | Membrane-associated progesterone receptor component 1 | NA | NA | NA | 3 | 15.4 | 4.00 |
| DSG2 | Desmoglein-2 | NA | NA | NA | 4 | 4.4 | 4.00 |
| PVR | Poliovirus receptor (isoform beta) | NA | NA | NA | 4 | 15.7 | 4.00 |
| COPB1 | Coatomer subunit beta | NA | NA | NA | 4 | 5.4 | 4.00 |
| PDIA4 | Protein disulfide-isomerase A4 | NA | NA | NA | 4 | 6.2 | 3.00 |
| ST14 | Suppressor of tumorigenicity 14 protein | NA | NA | NA | 3 | 4.9 | 3.00 |
| RP2 | Protein XRP2 | NA | NA | NA | 3 | 7.4 | 3.00 |
| CA12 | Carbonic anhydrase 12 (isoform 1) | NA | NA | NA | 5 | 15.2 | 3.00 |
| EPHA2 | Ephrin type-A receptor 2 | NA | NA | NA | 4 | 6.7 | 3.00 |
| MFI2 | Melanotransferrin (isoform 1) | NA | NA | NA | 2 | 3.5 | 3.00 |
| CD47 | Leukocyte surface antigen CD47 (isoform OA3-293) | NA | NA | NA | 3 | 9.6 | 3.00 |
-
CTB crosslinked complexes were isolated on streptavidin-agarose. The complexes were eluted from streptavidin-agarose and applied to SDS-PAGE prior to trypsin digest (in-gel) or trypsinized directly on streptavidin-agarose (in-solution). Tryptic fragments were analyzed by LC-MS/MS to identify proteins crosslinked to CTB. This table lists proteins with spectral counts ≥ 3 that were present in a crosslinked sample but absent from the corresponding control sample.
Download links
A two-part list of links to download the article, or parts of the article, in various formats.
Downloads (link to download the article as PDF)
Open citations (links to open the citations from this article in various online reference manager services)
Cite this article (links to download the citations from this article in formats compatible with various reference manager tools)
Fucosylation and protein glycosylation create functional receptors for cholera toxin
eLife 4:e09545.
https://doi.org/10.7554/eLife.09545


