Quantitative H2S-mediated protein sulfhydration reveals metabolic reprogramming during the integrated stress response
- Case Western Reserve University, United States
- McGill University, Canada
- University of Michigan Medical School, United States
- Lerner Research Institute, Cleveland Clinic, United States
- School of Medicine, Case Western Reserve University, United States
Figures
Figure 1 with 5 supplements
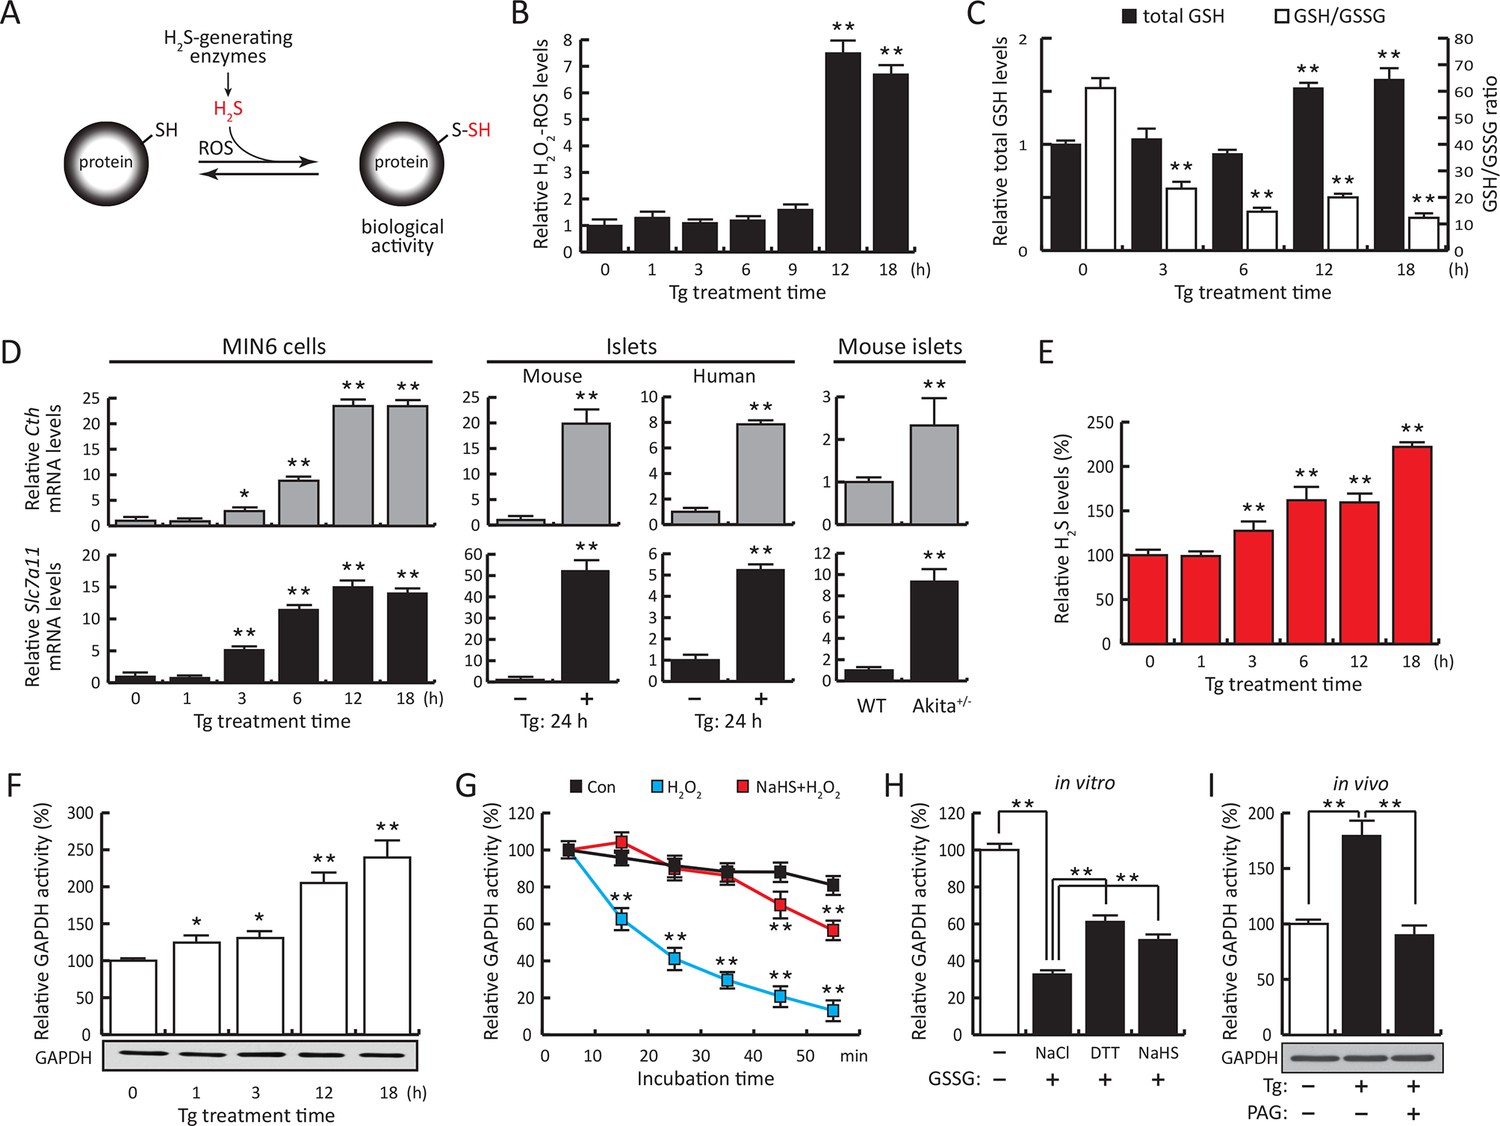
ER stress induces protein sulfhydration, a reversible cysteine-based post-translational modification.
(A) Schematic overview of protein sulfhydration, which requires synthesis of H2S and low ROS levels. Pancreatic β cells (MIN6) were treated with thapsigargin (Tg) for the indicated times, and the cellular levels of ROS (B), total levels of GSH and GSH/GSSG ratios (C) and H2S levels (E) were evaluated. (D) RT-qPCR analysis of the mRNA levels for the H2S-producing enzyme CTH and the cystine/glutamate exchanger Slc7a11 in MIN6 cells treated with Tg or pancreatic islets as indicated. (F) Evaluation of GAPDH activity in cell extracts from MIN6 cells treated with Tg at the indicated times (top), and GAPDH protein levels by Western blot analysis (bottom). (G). Time-dependent measurements of human recombinant GAPDH activities after exposure to H2O2 (50 μM, blue) or H2O2 together with the H2S donor, NaHS (50 μM, red). (H) In vitro evaluation of the reversal of the inhibitory effect of glutathionylation on the activity of recombinant GAPDH treated for 15 min with either NaHS (20 mM), DTT (reduced dithiothreitol, 20 mM), or NaCl (20 mM). (I). Evaluation of GAPDH activities in MIN6 cell extracts either untreated or treated with Tg (18 hr) with or without the CTH inhibitor, PAG (3 mM) (top). PAG was included for the last 3.5 hr of Tg-treatment. GAPDH protein levels were evaluated by Western blotting (bottom). All quantifications are presented as mean ± S.E.M. of three independent experiments. CTH: γ-cystathionase; ER: endoplasmic reticulum; PAG: propargylglycine; ROS: reactive oxygen species.
Figure 1—figure supplement 1

ER stress induces the levels of the H2S-producing enzyme CTH but not CBS.
Western blot analysis for the indicated proteins, of cell extracts isolated from Tg treated MIN6 cells for the indicated times. CTH: γ-cystathionase; ER: endoplasmic reticulum.
Figure 1—figure supplement 2

Regulation of gene expression in MIN6 cells, human, and mouse islets in response to ER stress.
MIN6 cells (A) and human islets (B) were treated with Tg for the indicated times. Islets were isolated from WT and heterozygous Akita Ins2 c96y 6-week-old mice (C). RNA was isolated from cells and islets and was tested by RT-qPCR for expression of the indicated genes. ER: endoplasmic reticulum; WT: wild type.
Figure 1—figure supplement 3
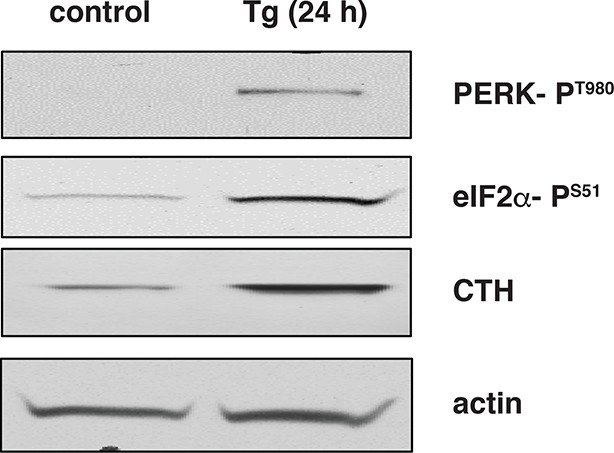
Activation of the integrated stress response leads to increased expression of CTH in wild-type mouse islets treated with Tg.
Western blot analysis for the indicated proteins of cell extracts isolated from Tg treated islets for 24 hr. CTH: γ-cystathionase.
Figure 1—figure supplement 4
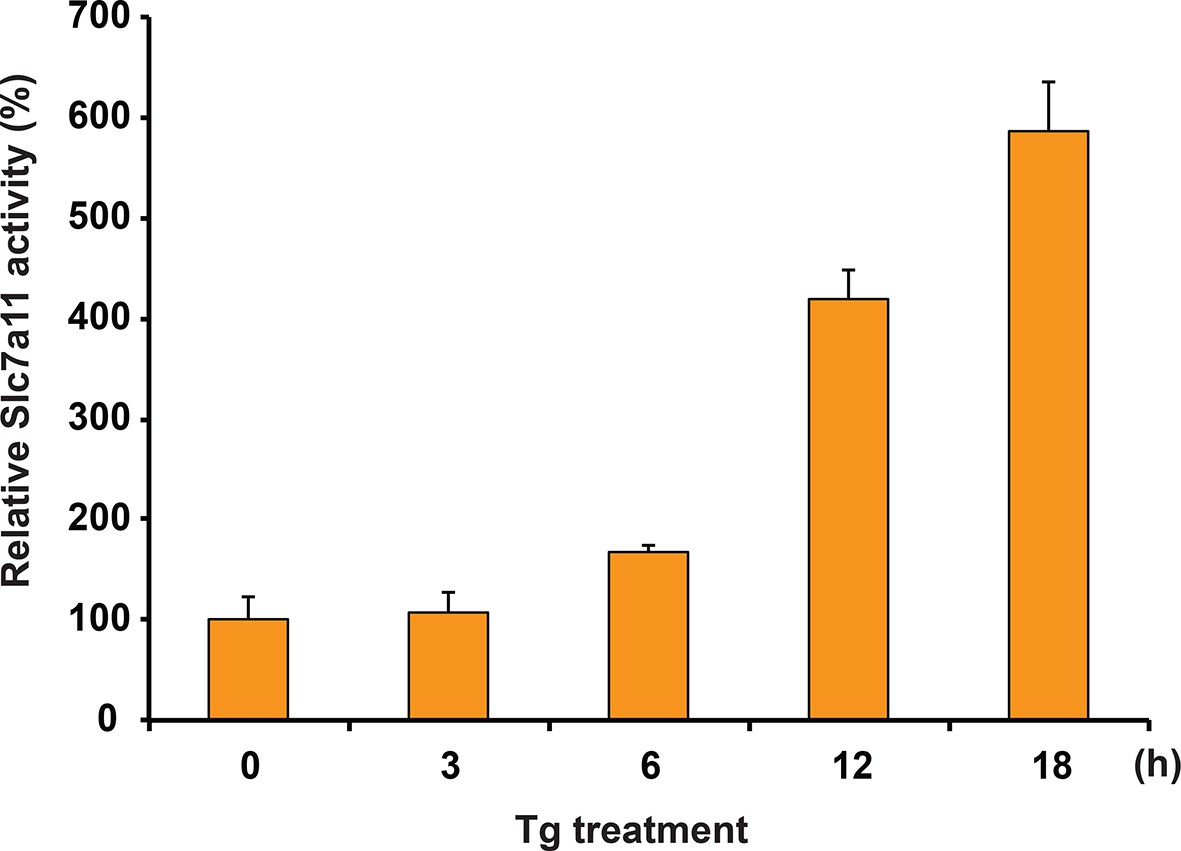
Glutamate uptake in MIN6 cells treated with Tg at the indicated times.
https://doi.org/10.7554/eLife.10067.007
Figure 1—figure supplement 5
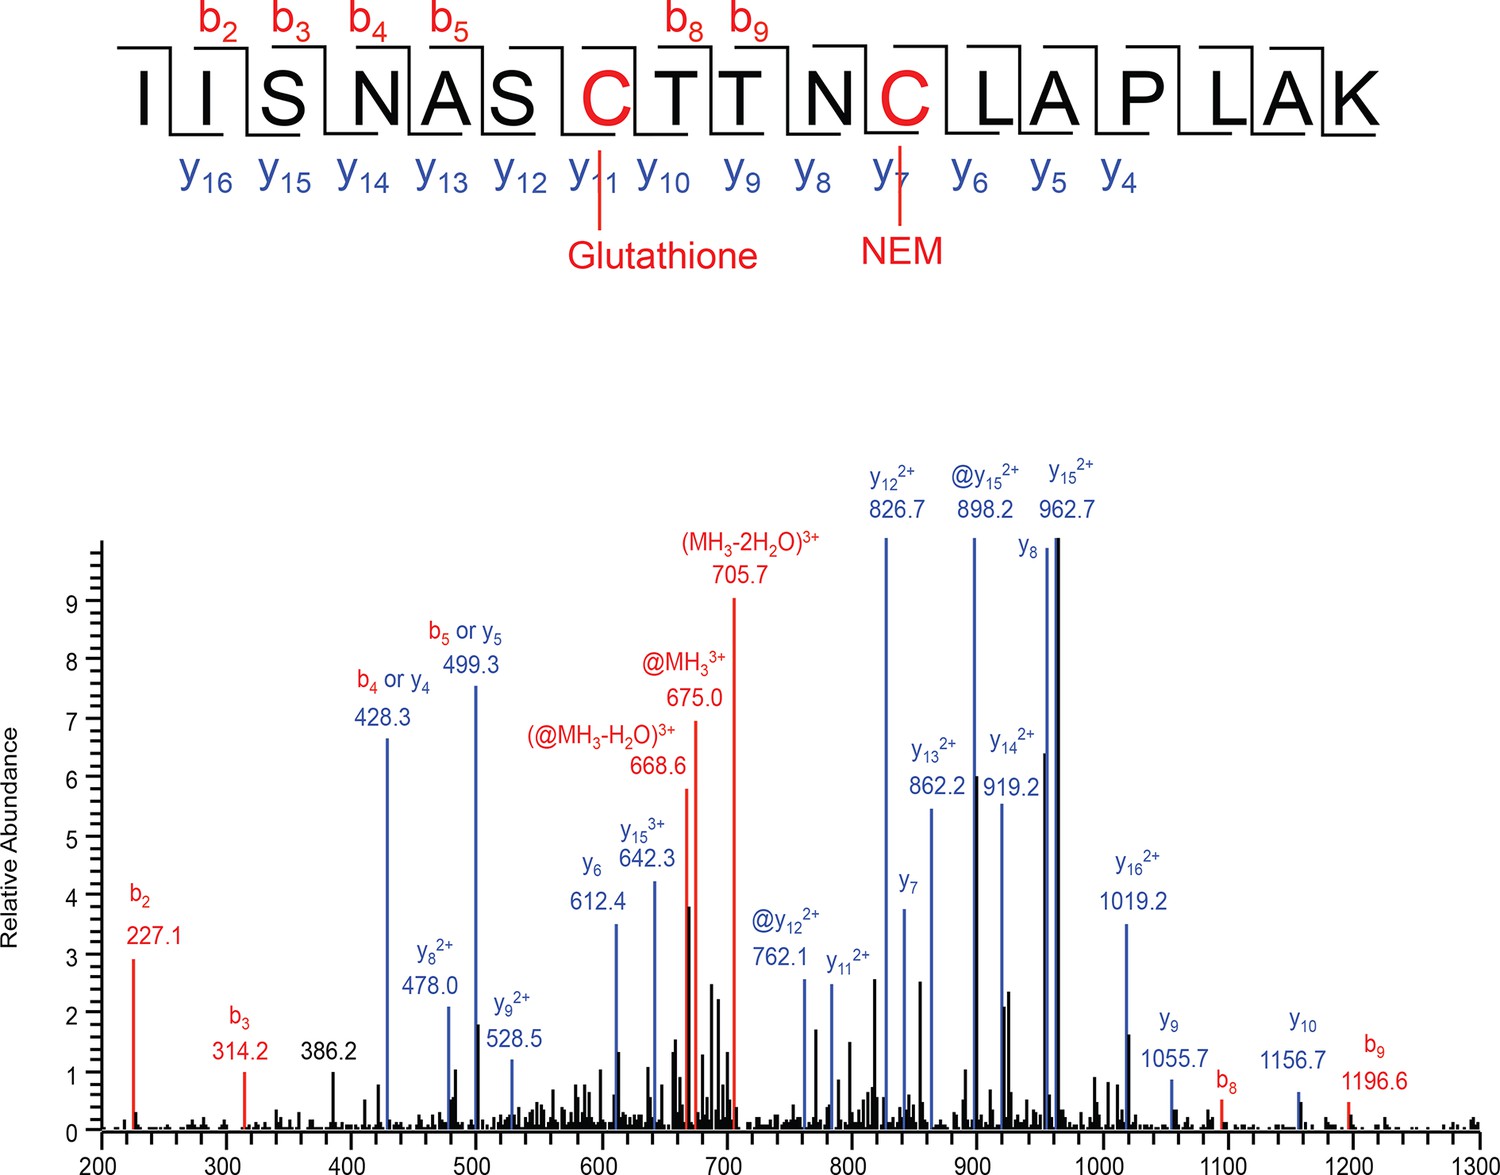
Analysis of S-glutathionylated GAPDH by LC-MS/MS.
Recombinant GAPDH (20 μg) was treated with GSSG (5 mM) for 45 min, and then incubated with 50 mM of NEM. The sample was resolved by SDS-PAGE electrophoresis and analyzed by LC-MS/MS. Tandem mass spectrum of the active site peptide IISNASCTTNCLAPLAK of the protein with glutathionylated Cys150, and Cys154 alkylated with NEM. Comparison with the same peptide both NEM alkylation, there are no mass changes of y series ions from y4 to y10 and b series ions from b2 to b4, but a mass shift from y11 to y16, and b8, b9 ions, which strongly suggests the modification at Cys150. @ represents the neutral loss of -129Da from a glutathione adduct.
Figure 2 with 11 supplements
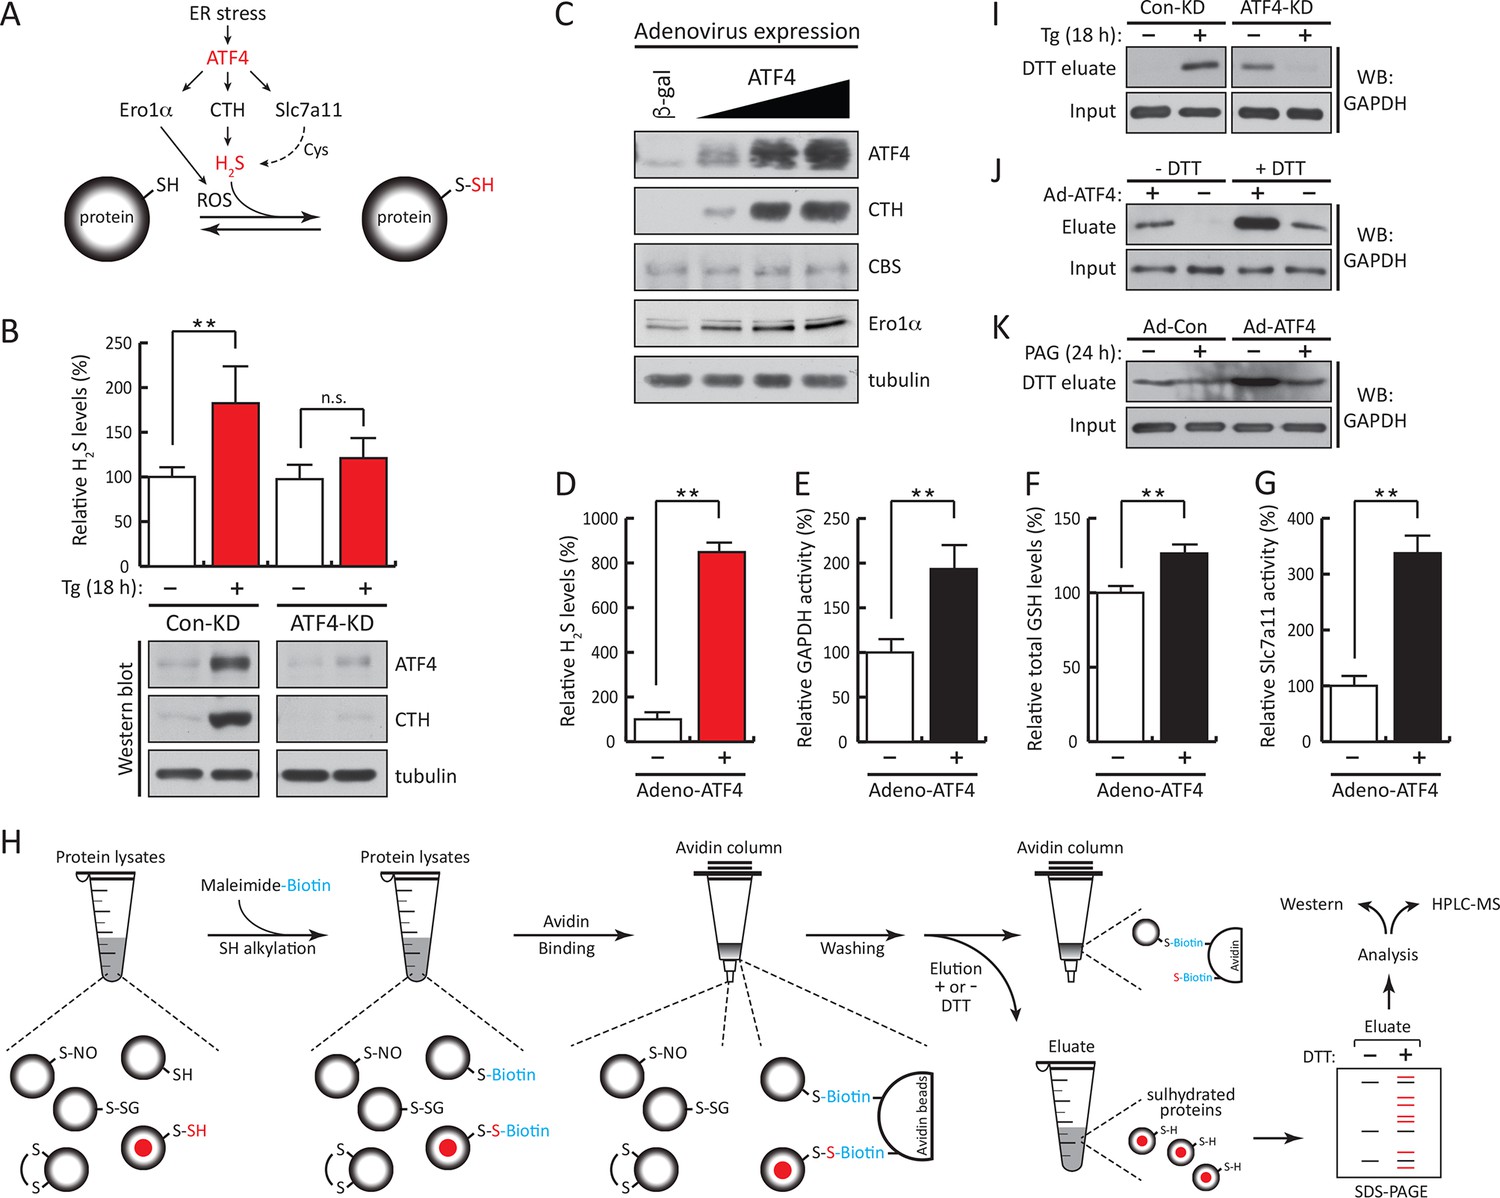
ATF4-mediated transcriptional reprogramming during ER stress increases expression of a gene cohort involved in H2S synthesis and protein sulfhydration.
(A) Schematic representation of the ATF4-induced cohort of genes leading to sulfhydration of proteins during ER stress. (B) Evaluation of intracellular H2S levels (top) or ATF4 and CTH protein levels (bottom) in MIN6 cells infected with either control shRNA or shRNA against ATF4. Cells were untreated or treated with Tg for 18 hr. (C) Western blot analysis for the indicated proteins in MIN6 cells infected (for 48 hr) with either adenovirus mediated lacZ-expression as control, or ATF4-expression, at increasing viral particle concentrations. MIN6 cells infected with either control adenovirus or ATF4-expressing adenovirus were used to measure (D) H2S levels (E) GAPDH relative activities, (F) GSH levels, and (G) Glutamate (Glu) uptake by the cystine/glutamate exchanger. (H) Schematic representation of the novel Biotin-Thiol-Assay (BTA), an experimental approach for the identification of sulfhydrated proteins in cell extracts. Highly reactive cysteine residues or sulfhydrated cysteine residues in proteins under native conditions were alkylated with low concentrations of maleimide-PEG2-biotin (NM-Biotin). Subsequent avidin column purification and elution with DTT, which cleaved the disulfide bonds, leaving the biotin tag bound to the column, produced an eluate that was further analyzed either by western blotting or coupled with LC-MS/MS. (I) Identification via the BTA of sulfhydrated GAPDH in MIN6 cell extracts from Tg-treated cells in the presence or absence of ATF4. (J) Identification of sulfhydrated GAPDH in MIN6 cells overexpressing ATF4. (K) Determination of the effect of PAG on sulfhydrated GAPDH levels in MIN6 cells overexpressing ATF4 in the presence or absence of PAG. ER: endoplasmic reticulum; PAG: propargylglycine.
-
Figure 2—source data 1
Sulfhydrated proteins from MIN6 cells treated with Tg for 18 hr.
- https://doi.org/10.7554/eLife.10067.010
Figure 2—figure supplement 1
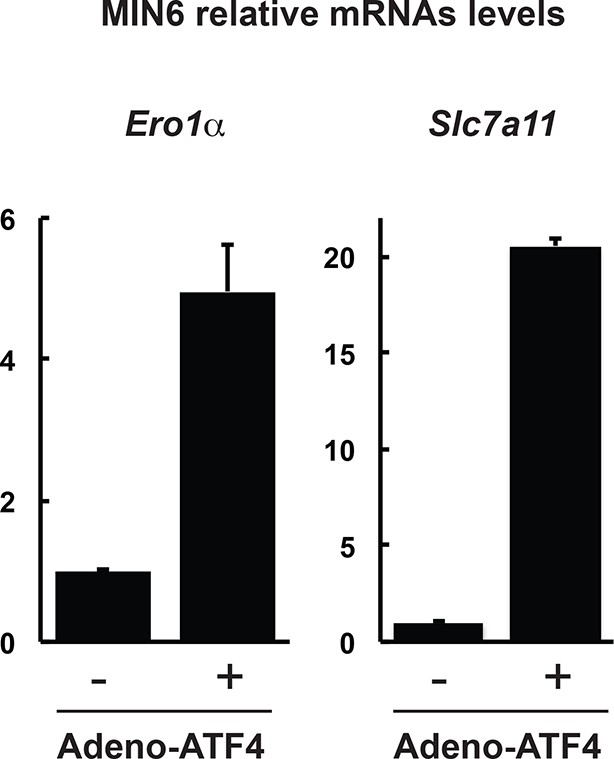
Expression of genes in MIN6 cells overexpressing the transcription factor ATF4.
RT-qPCR analysis of RNA isolated from cells infected with control adenovirus (-) or ATF4-expressing adenovirus (+) for 48 hr, for the indicated genes. The results are shown as the average of three independent determinations.
Figure 2—figure supplement 2
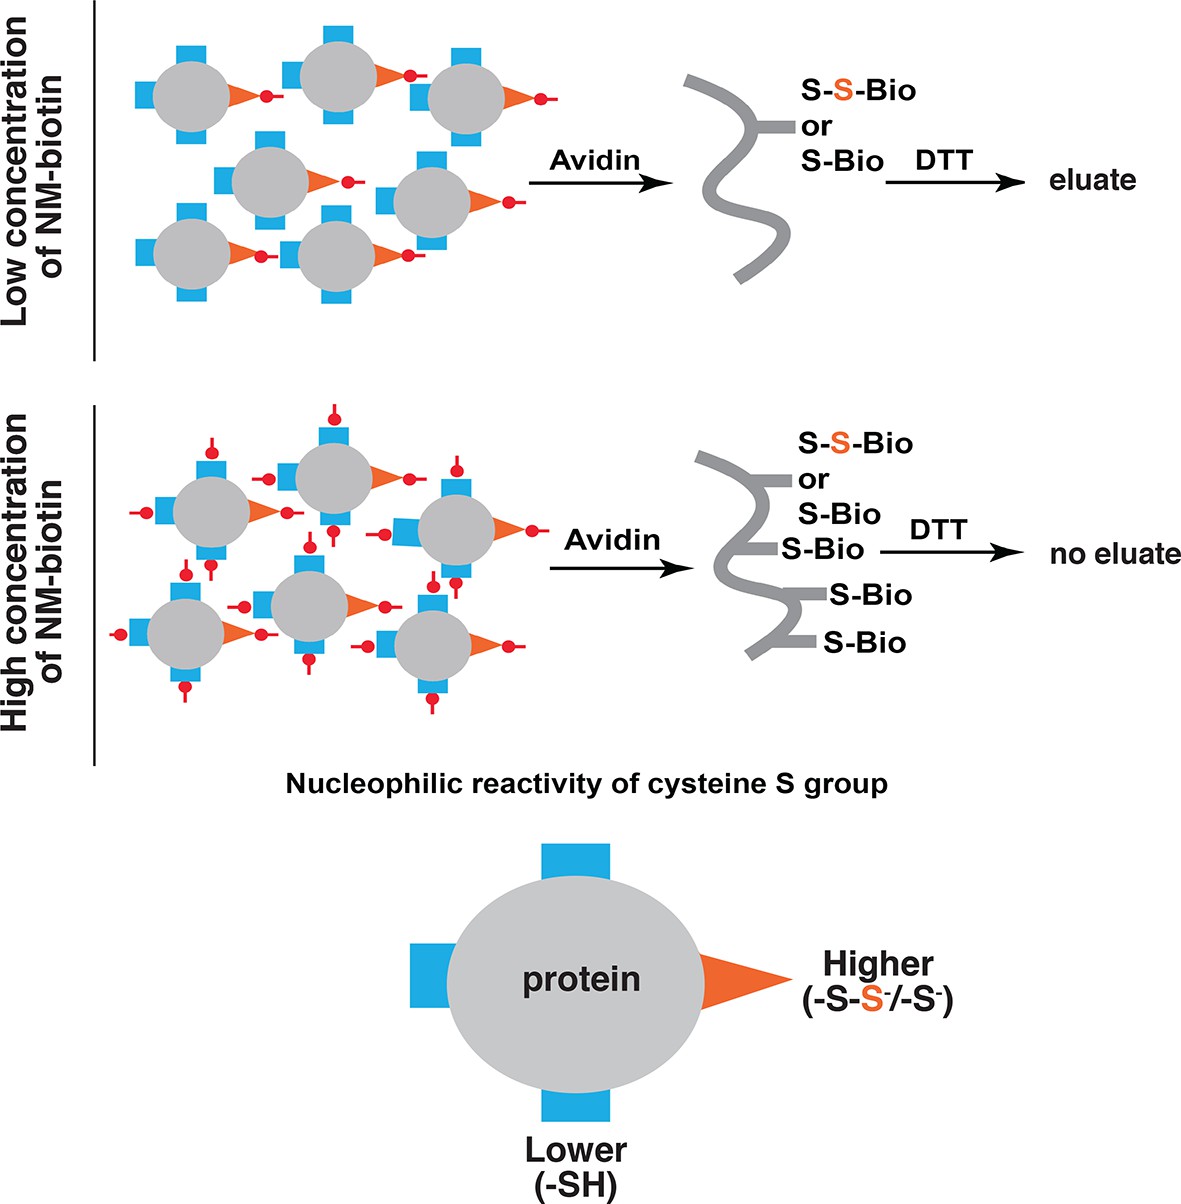
Schematic representation of the predicted proteins in the eluate of the BTA approach as a consequence of increasing concentrations of biotin conjugated maleimide (NM-biotin, red).
At low concentration (top), the high reactive -SH groups (orange) including unmodified and sulfhydrated cysteines are discriminated for alkylation, leading to elution of sulfhydrated proteins from the avidin column by DTT. At the high concentration (bottom), all -SH groups in cysteines are labeled, leading to the proteins permanently bound to the beads and unable to be eluted by DTT. BTA: Biotin thiol assay.
Figure 2—figure supplement 3
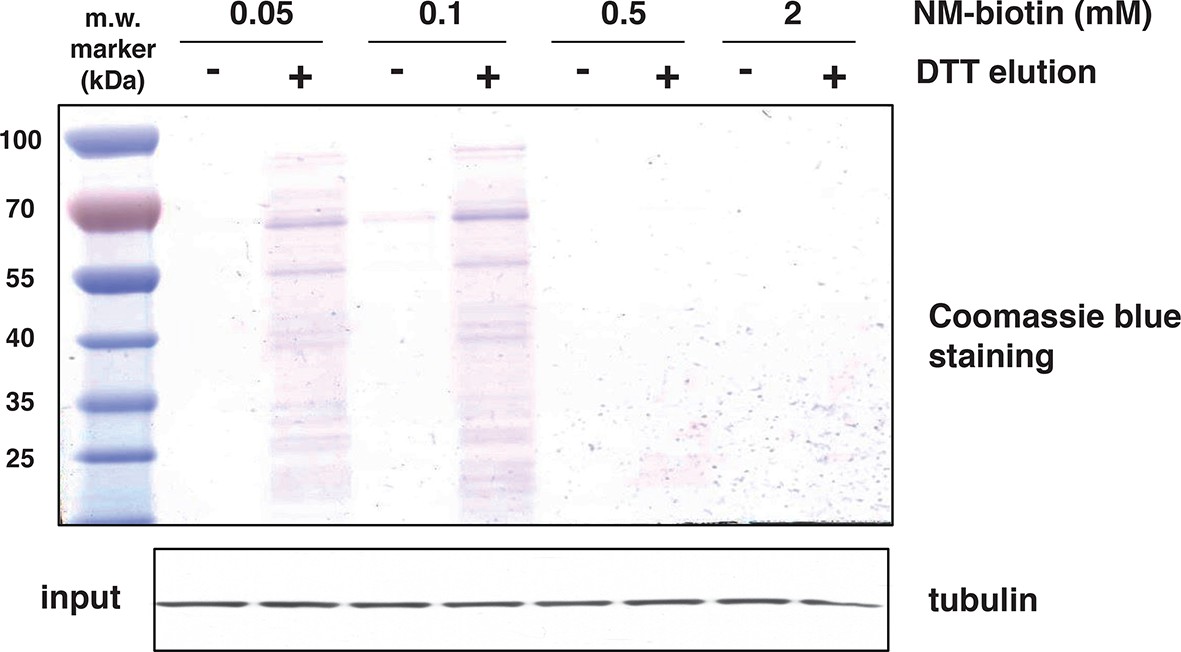
Increasing concentrations of NM-biotin in the BTA of cell extracts isolated from Tg treated for 18 hr MIN6 cells, inhibit the elution of sulfhydrated proteins.
Eluted proteins were analysed by SDS–PAGE and stained by Coomassie blue. Western blot analysis for tubulin, of equal amount of MIN6 cell extracts before binding to the avidin column. BTA: biotin thiol assay.
Figure 2—figure supplement 4
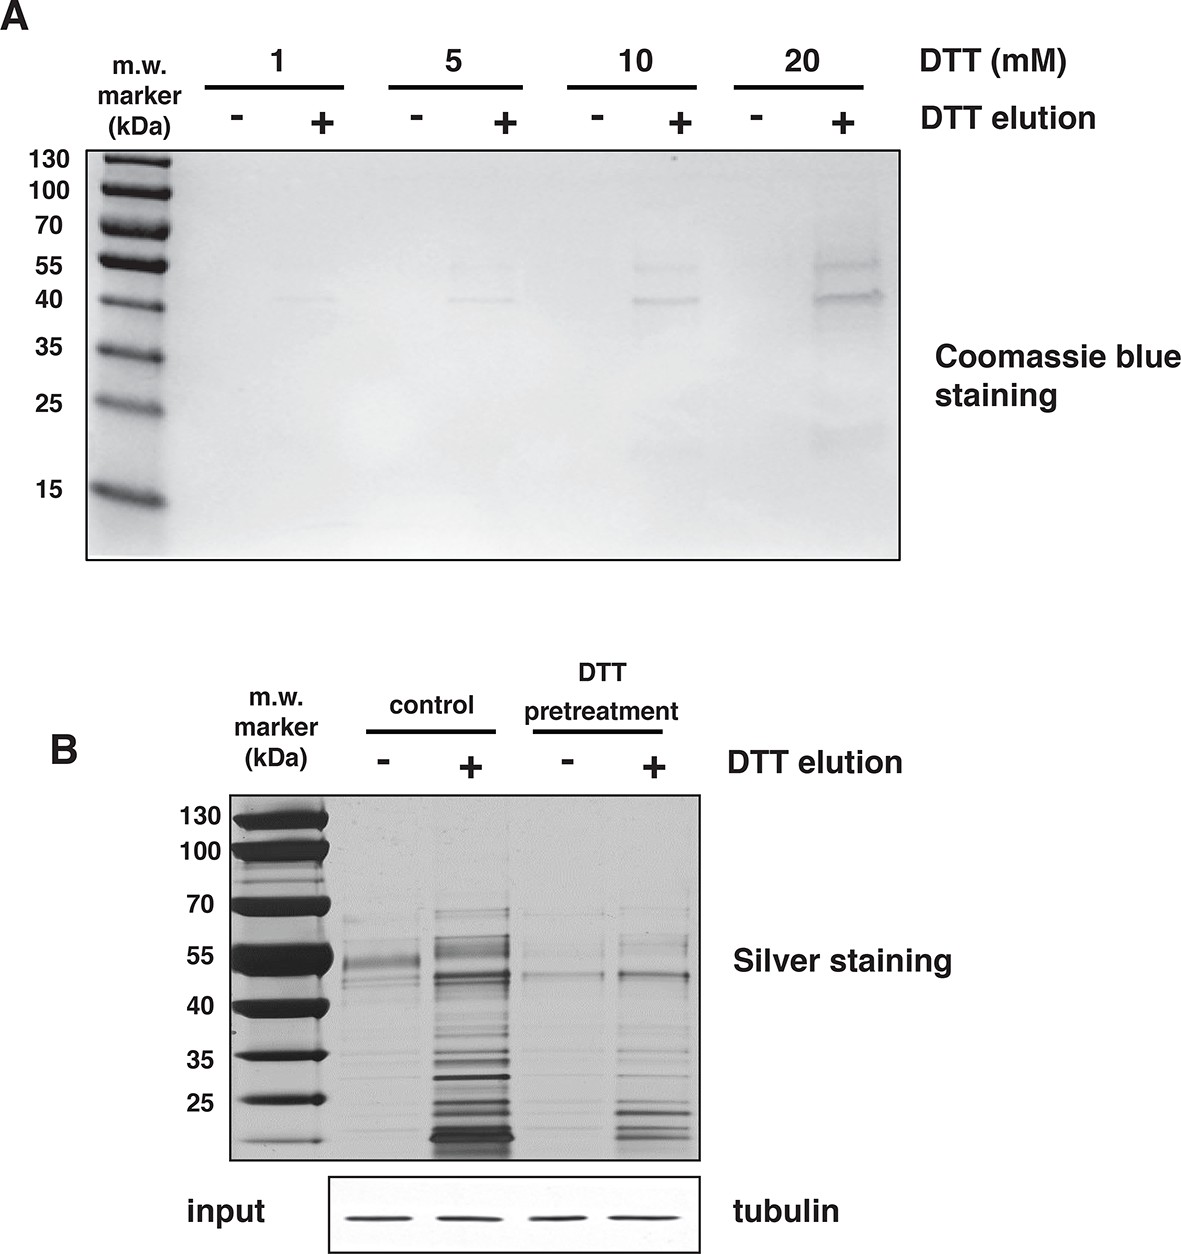
H2S covalently modifies proteins via sulfhydration of cysteine residues.
(A) Mouse liver lysates were subjected to NM-biotin, then divided into eight equal fractions, were bound on avidin columns and eluted by the addition of the indicated concentrations of DTT. The eluates were analysed by SDS–PAGE electrophoresis and stained by Coomassie blue. (B) Lysates from MIN6 cells treated with Tg for 18 hr, were pretreated with or without 20 mM DTT for 20 min, and after passing through a NAP-5 gel filtration column, were subjected to the BTA assay followed by SDS–PAGE electrophoresis and silver staining of the gels. Equal amount of extracts before loading on the avidin columns were analyzed by Western blotting for tubulin. DTT treatment of extracts before the avidin column, reversed global protein sulfhydration, implying a covalent cysteine-based modification.
Figure 2—figure supplement 5
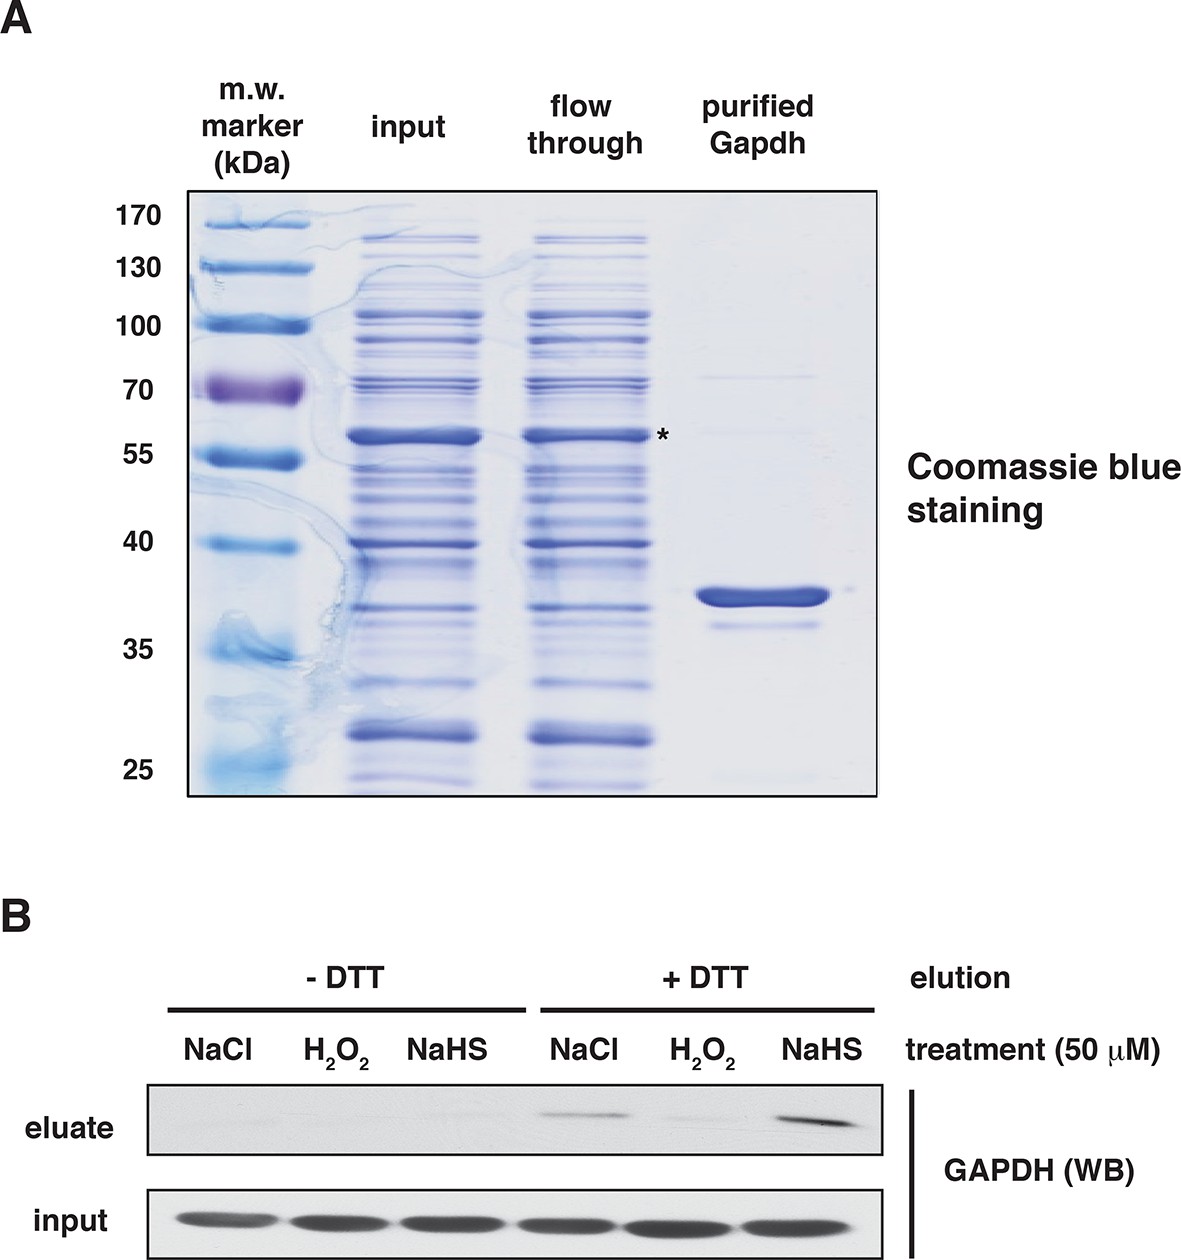
Assessment of the specificity of BTA to identify reactive -S-SH groups of proteins via the use of recombinant GAPDH.
(A) The purity of human recombinant GAPDH was evaluated by SDS–PAGE electrophoresis and was stained by Coomassie blue. *- indicates GST-tagged GAPDH. (B) Recombinant GAPDH (100 μg) was incubated for 45 min with 50 μM NaCl, as the control, H2O2 (mediating oxidation of cysteines) or NaHS (mediating sulfhydration of cysteines). Following desalting, samples were subjected to the BTA assay. Eluates were analyzed by Western blotting for GAPDH. Extracts from samples before loading to the avidin column were also analyzed by Western blotting for GAPDH (input). BTA: biotin thiol assay.
Figure 2—figure supplement 6
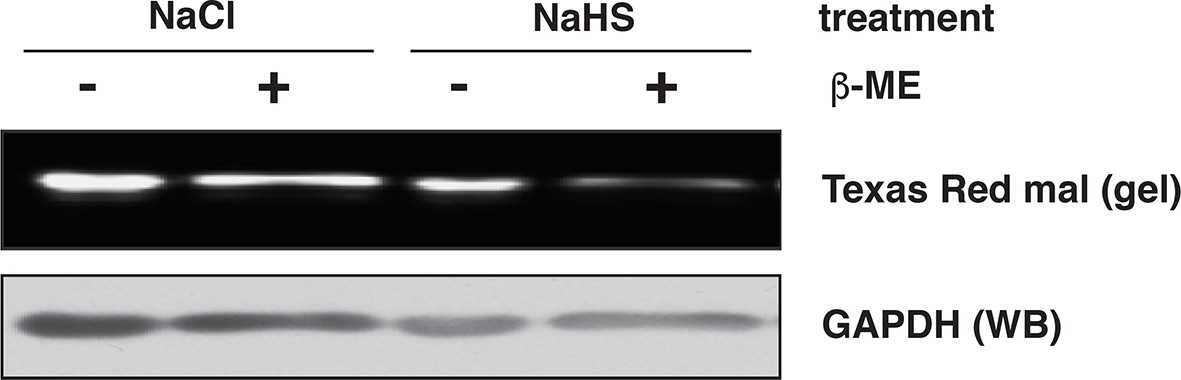
Assessment of GAPDH sulfhydration by the red maleimide assay.
Recombinant GAPDH (20 μg) was exposed to NaHS (50 μM), or NaCl (50 μM) as the control, for 45 min. The levels of sulfhydrated GAPDH were evaluated with the red maleimide assay and measured by the decreasing fluorescence intensity after β‑mercaptoethanol (β-ME) treatment.
Figure 2—figure supplement 7
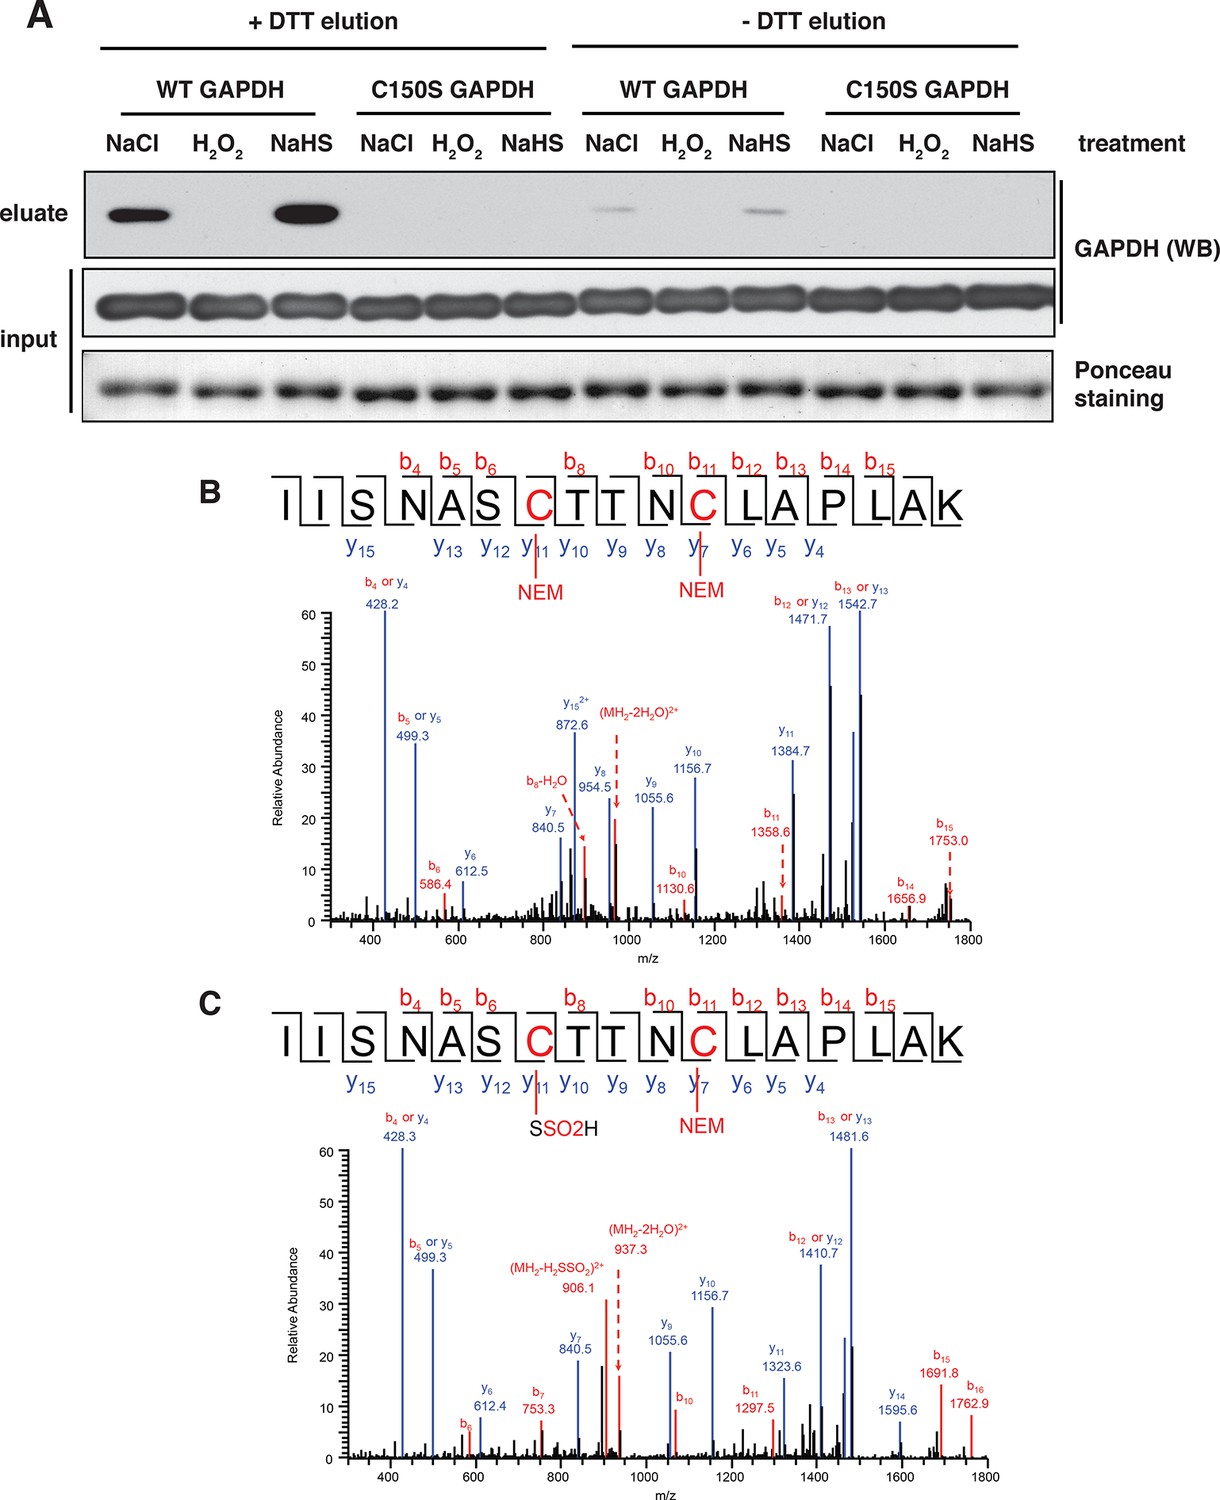
BTA identifies sulfhydration of GAPDH at the catalytic cysteine, Cys150.
(A) Both wild-type (WT) and Cys150Ser recombinant GAPDH mutant (100 μg) were incubated with 50 μM each, NaHS, H2O2, or NaCl (as the control), for 45 min. After desalting, samples were subjected to the BTA assay. Eluates were analyzed by Western blot analysis for GAPDH. Sulfhydration was observed only for the WT GAPDH. (B) WT recombinant GAPDH (20 μg) was pretreated with DTT (20 mM) for 45 min following desalting. The protein was subsequently incubated with or without NaHS (50 μM) for 45 min, followed with treatment with NEM (50 mM). The latter treatment is expected to block all free -SH groups. The samples were resolved by SDS–PAGE electrophoresis followed by LC-MS/MS analysis. The NaHS-treated GAPDH showed a mass shift of Cys150 corresponding to the sulfinic acid due to sulfhydration (bottom). The oxidation of the S-SH group of Cys150 to sulfinic acid is expected due to its high reactivity when exposed to O2 under the aerobic conditions of the experiment. BTA: biotin thiol assay.
Figure 2—figure supplement 8

The BTA assay shows that Tg-induced ER stress in MIN6 cells promotes global protein sulfhydration.
(A) The BTA assay was performed to detect protein sulfhydration in extracts from MIN6 cells treated with Tg for 18 hr. (B) Western blot analysis confirmed that GAPDH was sulfhydrated in MIN6 cells during Tg treatment. (C) GAPDH activity in cell extracts from untreated or Tg-treated MIN6 cells for 18 hr. (D) LC-MS/MS of a subset of the sulfhydrated proteins in (A), including GAPDH, actin, and β-tubulin (Mustafa et al., 2009). BTA: biotin thiol assay.
Figure 2—figure supplement 9
LC-MS/MS spectrum of H2S-modified peptides purified by the BTA technique from MIN6 cells treated with Tg for 18 hr.
https://doi.org/10.7554/eLife.10067.019
Figure 2—figure supplement 10
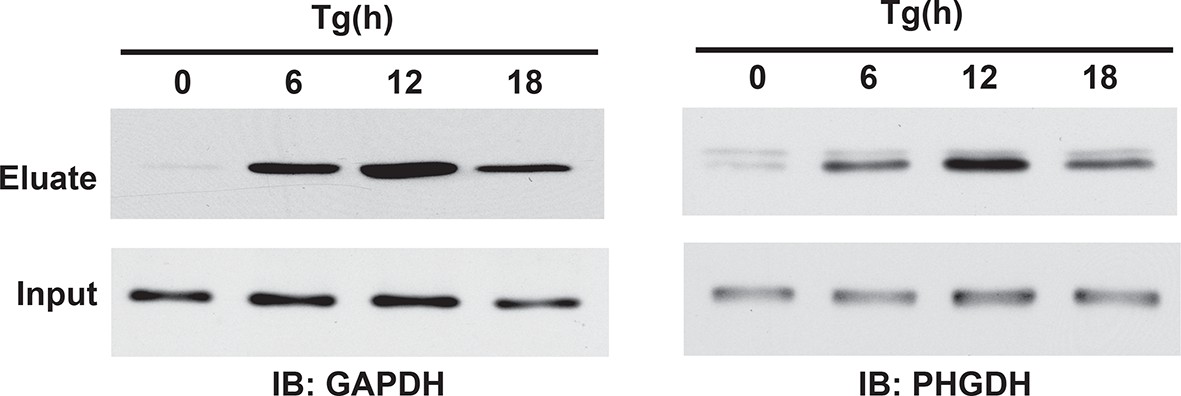
Western blot analysis of eluates from the BTA of sulfhydrated GAPDH and PHGDH in MIN6 cells treated with Tg in a time-dependent manner. a peak of protein sulfhydration occurred at 12 h of Tg treatment.
BTA: biotin thiol assay.
Figure 2—figure supplement 11
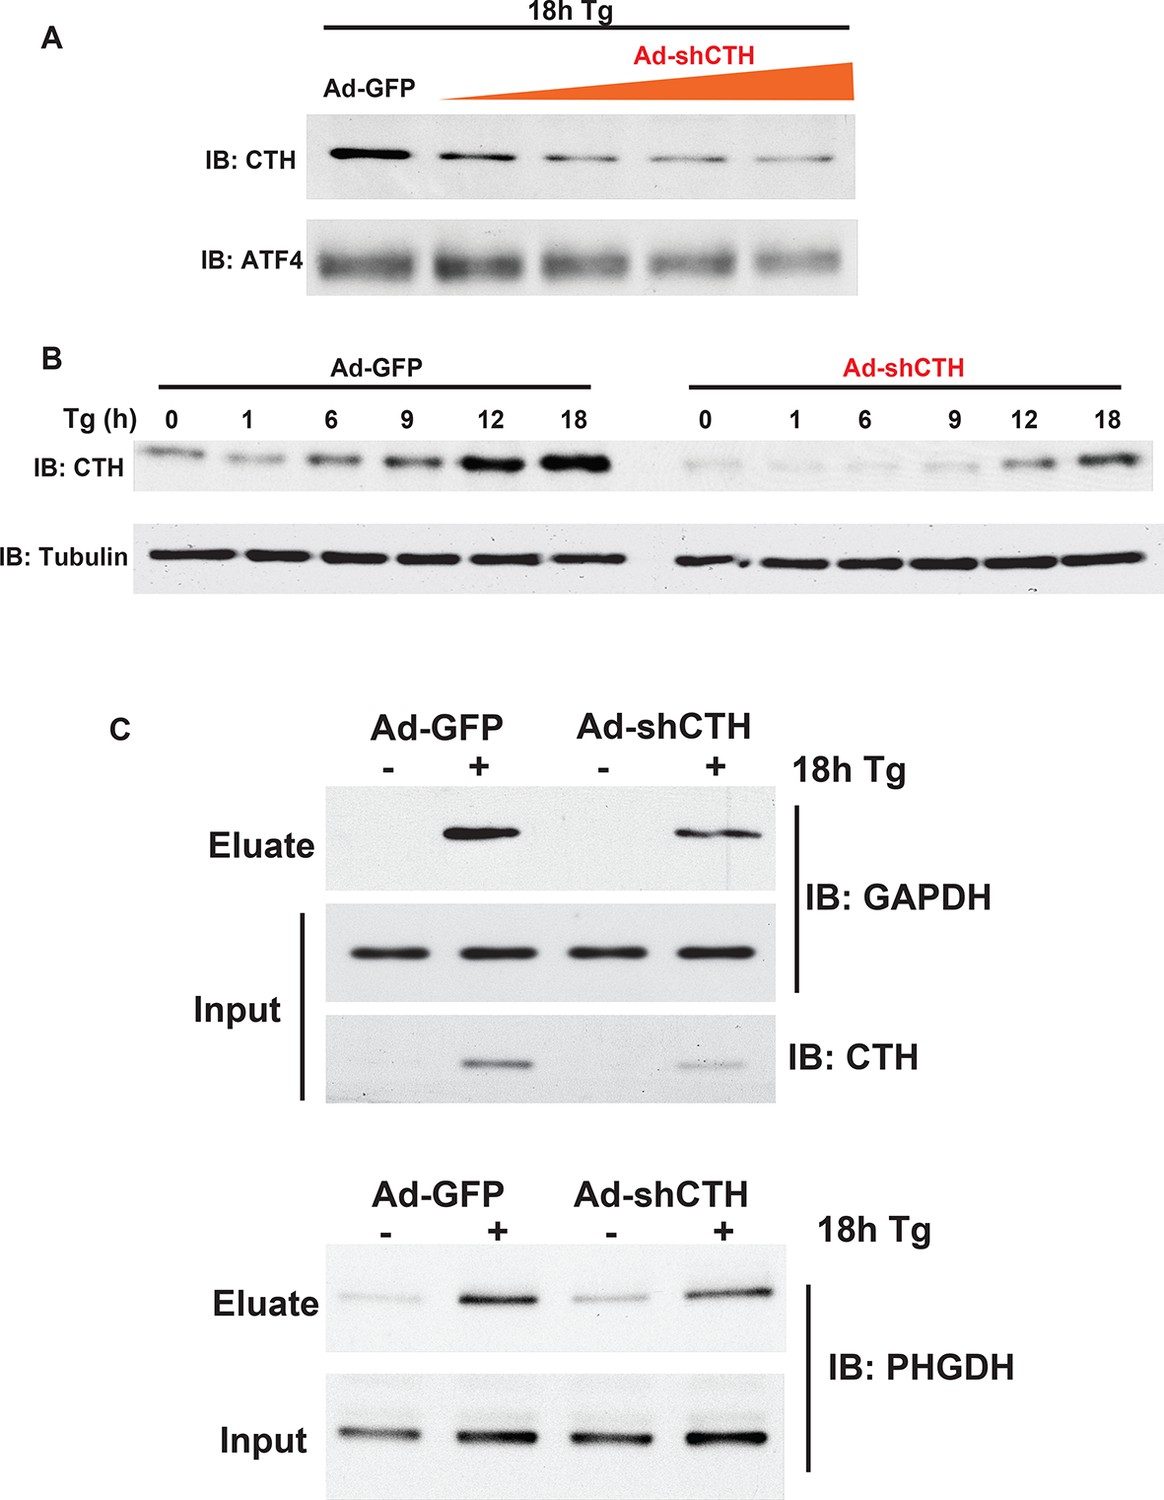
Western blot analysis for CTH protein levels from MIN6 cells infected with either adenovirus-mediated expression of GFP as control, or shRNA against the CTH mRNA in a dose.
(A) and time- (B) dependent manner. (C) Western blot analysis of the indicated proteins from cell extracts before applying to the column (input) or after the column (eluate). The effects of CTH knockdown by shRNA on sulfhydrated GAPDH and PHGDH levels in MIN6 cells treated with or without Tg for 18 hr, is shown.
Figure 3 with 7 supplements
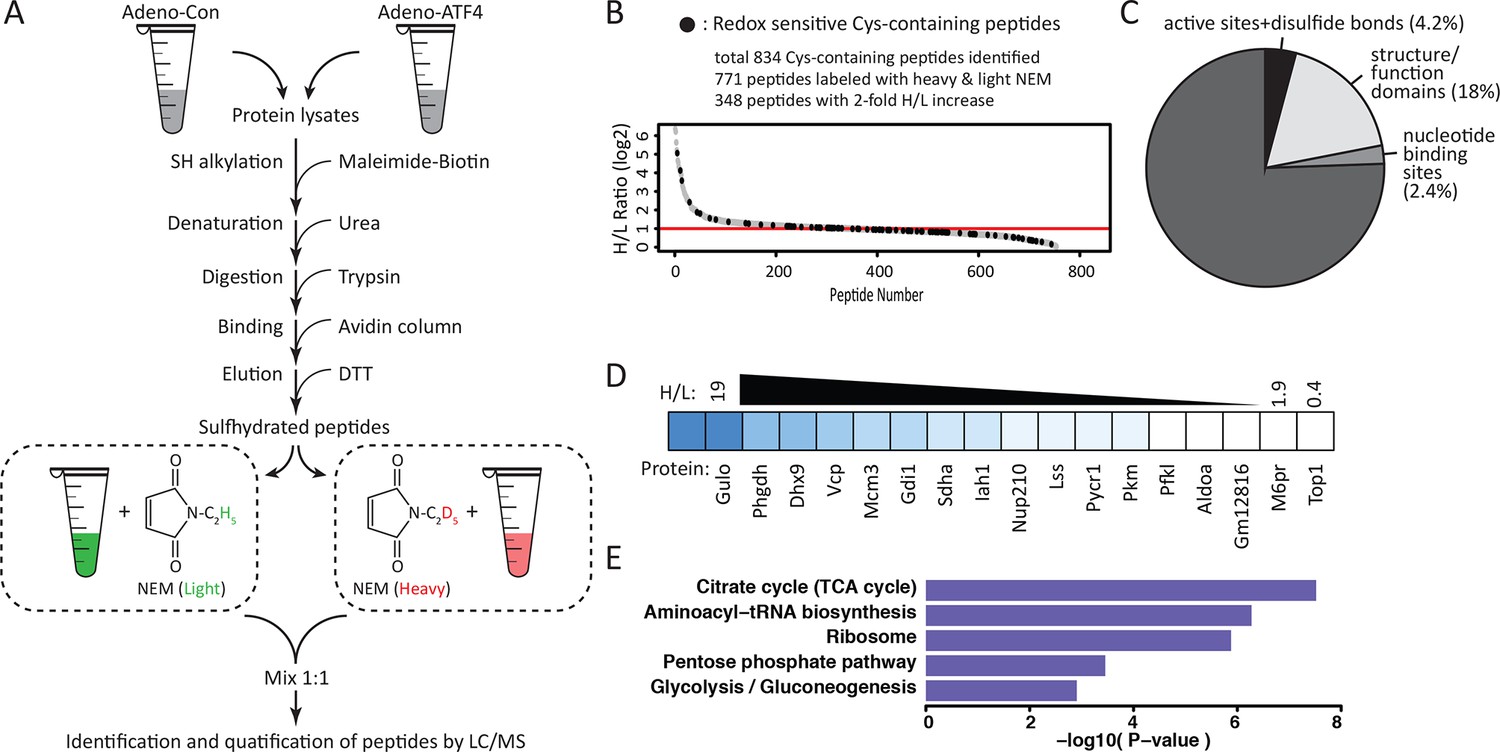
Quantitative and pathway analysis of sulfhydrated peptides in MIN6 cells overexpressing the transcription factor ATF4.
(A) Schematic representation of the BTA experimental approach combined with alkylation of free SH groups by either the stable isotope-labeled (D5, heavy) or normal (H5, light) maleimide. The relative levels of H5 and D5 labeled peptides were quantified by the LC-MS/MS method. (B) Distribution of peptides containing sulfhydrated cysteine residues relative to their H/L ratios as determined by the BTA analysis of cell extracts isolated from MIN6 cells overexpressing ATF4 (indicated in A). Values of H/L ratios are plotted against the number of identified peptides. The red line marks the H/L ratio >2, consisting of cysteine-containing peptides in proteins that exhibited higher reactivity with H2S under ATF4 overexpression. The black dots show redox sensitive cysteine peptides, which are common between the ones found in the RedoxDB database, and by the BTA assay. (C) Pie chart illustrating the percentage of cysteine-containing peptides (from A) that belong to known functional domains of proteins in the Uniprot database. (D) Heat map of H/L values obtained from experimental data in (A), illustrating the profound differences in the reactivity with H2S of cysteine residues in different proteins. (E) Gene ontology biological pathways for peptides with H/L ratio >2. H/L values were obtained from the experimental data in (A). BTA: biotin thiol assay.
-
Figure 3—source data 1
Sulfhydrated proteins from ATF4 overexpressed MIN6 cells.
- https://doi.org/10.7554/eLife.10067.023
-
Figure 3—source data 2
Relative abundance of proteins in MIN6 cells treated with Tg for 18 hr.
- https://doi.org/10.7554/eLife.10067.024
Figure 3—figure supplement 1

Sulfhydrated cysteine-containing peptides are enriched in functional residues.
Distribution of peptides containing sulfhydrated cysteines relative to their H/L ratios with functional annotations from the Uniprot database where active sites (ACT_SITE), binding sites (BINDING), calcium binding sites (CA_BIND), disulfide bonds (DISULFID), DNA binding sites (DNA_BIND), specific domains (DOMAIN), metal binding sites (METAL), modified residues (MOD_RES), motifs with biological activity (MOTIF), nucleotide binding sites (NP_BIND) and zinc finger domains (ZN_FING) are shown as black dots.
Figure 3—figure supplement 2
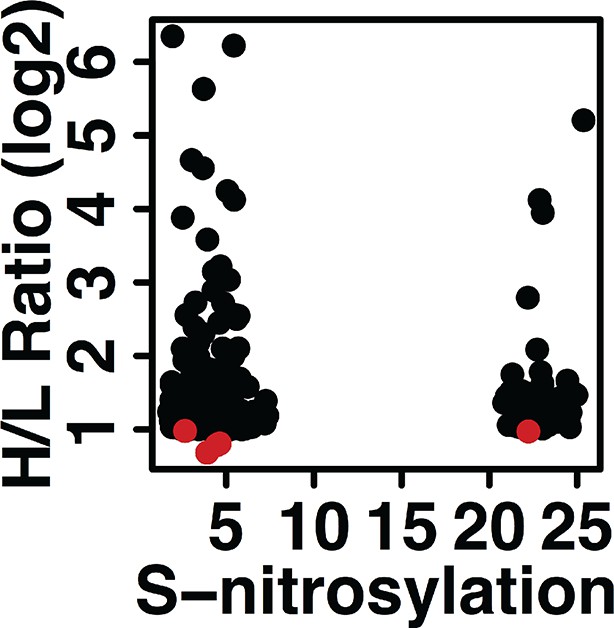
Sulfhydrated proteins are potential targets for nitrosylation.
A total of 827 H2S-modified and pair-labeled peptides were scored for their nitrosylation potential via the use of the GPS-SNO algorithm. We identified 303 peptides with predicted S-nitrosylation sites. Among them, only five peptides (red dots) had an H/L ratio below 2 (1.5% of the scored peptides for S-nitrosylation).
Figure 3—figure supplement 3
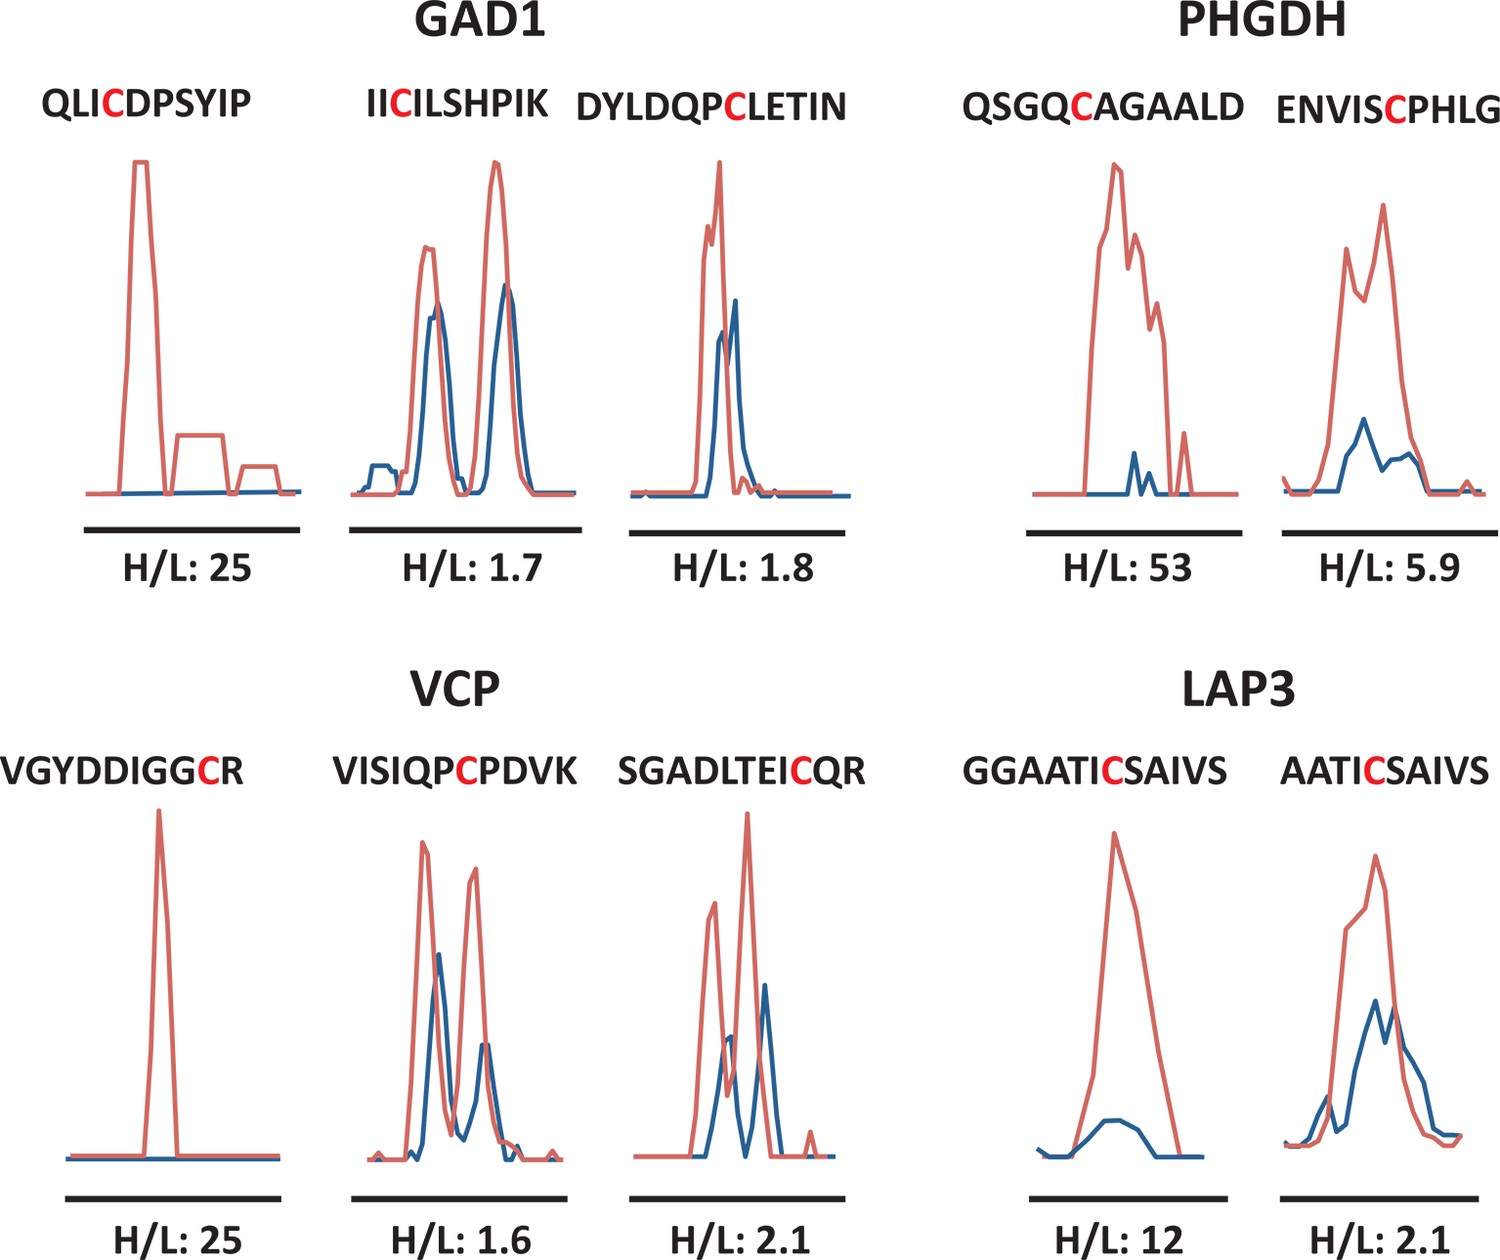
Quantitative profiling of proteins containing cysteines with different reactivity to H2S from ATF4 overexpressing MIN6 cells.
MS1 profiles for multiple cysteine-containing peptides from GDI1, PHGDH, VCP, and LAP3, only one of which exhibits the highest reactivity with H2S, as shown by the H/L ratios.
Figure 3—figure supplement 4
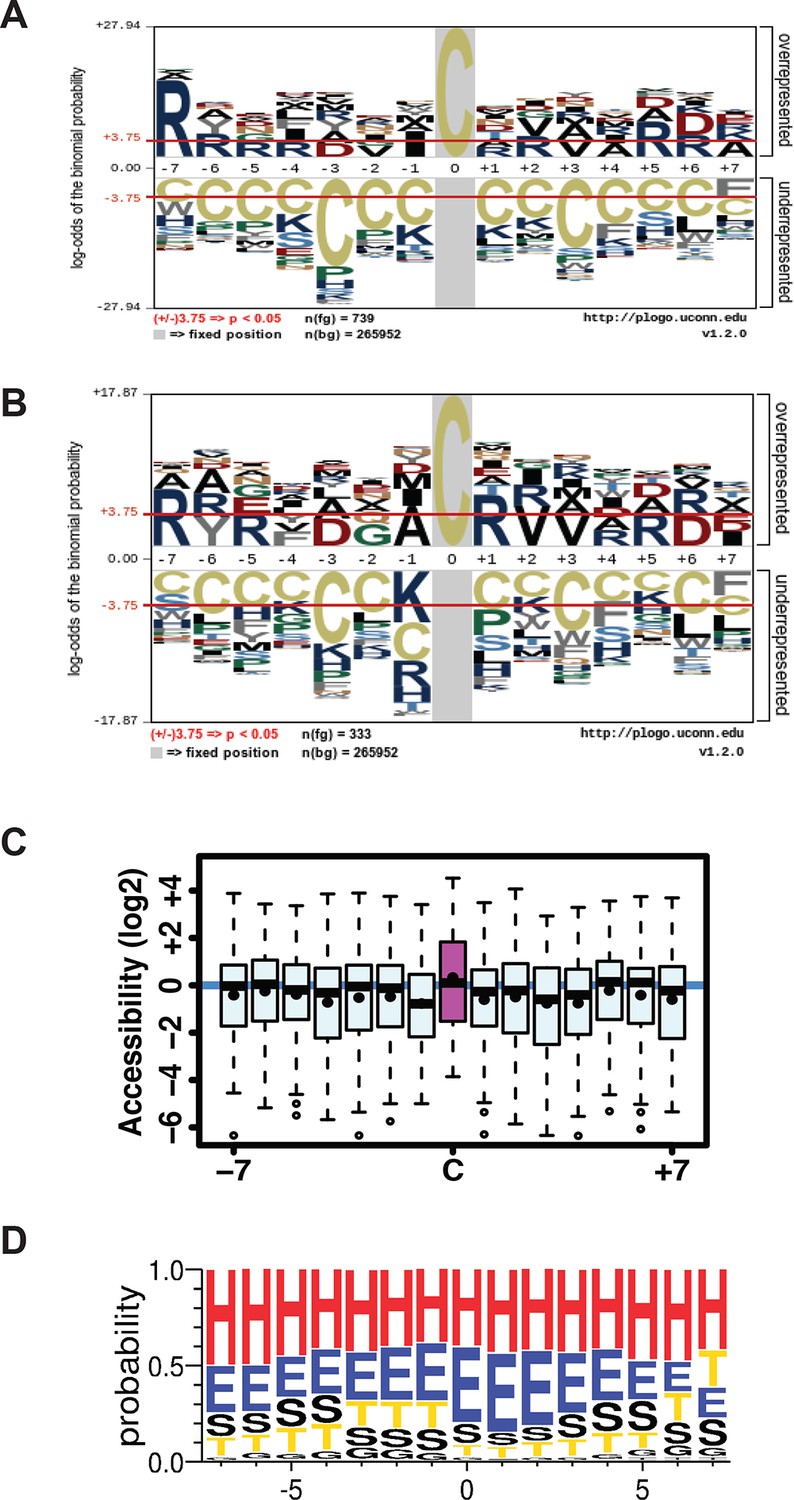
(A,B) Sulfhydrated peptides do not reveal a consensus sequence motif, (C,D) but the modified cysteine residue is significantly accessible and preferentially positioned at the N-terminal of alpha helix.
(A) A total of 739 pair-labeled peptide sequences were used to show that no primary sequence motif could be detected using the pLogo program. (B) A total of 333 peptides with H/L ratios over 2-fold showed significant enrichment for Arg residue found next to the modified cysteine. (C, D) the surface accessibility and secondary structure of the modified cysteine residues in peptides were annotated by comparing those peptides with H/L ratios greater than twofold and proteins with known structures in the PDB database (172 protein structures were employed). In the secondary structure motif, H= alpha helix; G=310-helix; E=beta sheet; T= helix turn; S=bend (high curvature).
Figure 3—figure supplement 5

Gene ontology biological pathways enriched among all pair-labeled peptides in ATF4 overexpressed MIN6 cells.
Seven hundred and thirty-nine pair-labeled cysteine-containing peptides were subjected to a pathway analysis carried by the Davide and IPA programs (A, B). (C,D) the proteins associated with the H/L greater than twofold were selected and subjected for both pathway annotation calculations. Top five pathways are shown with their statistical significance (Bonferroni correction for N=17 tests).
Figure 3—figure supplement 6
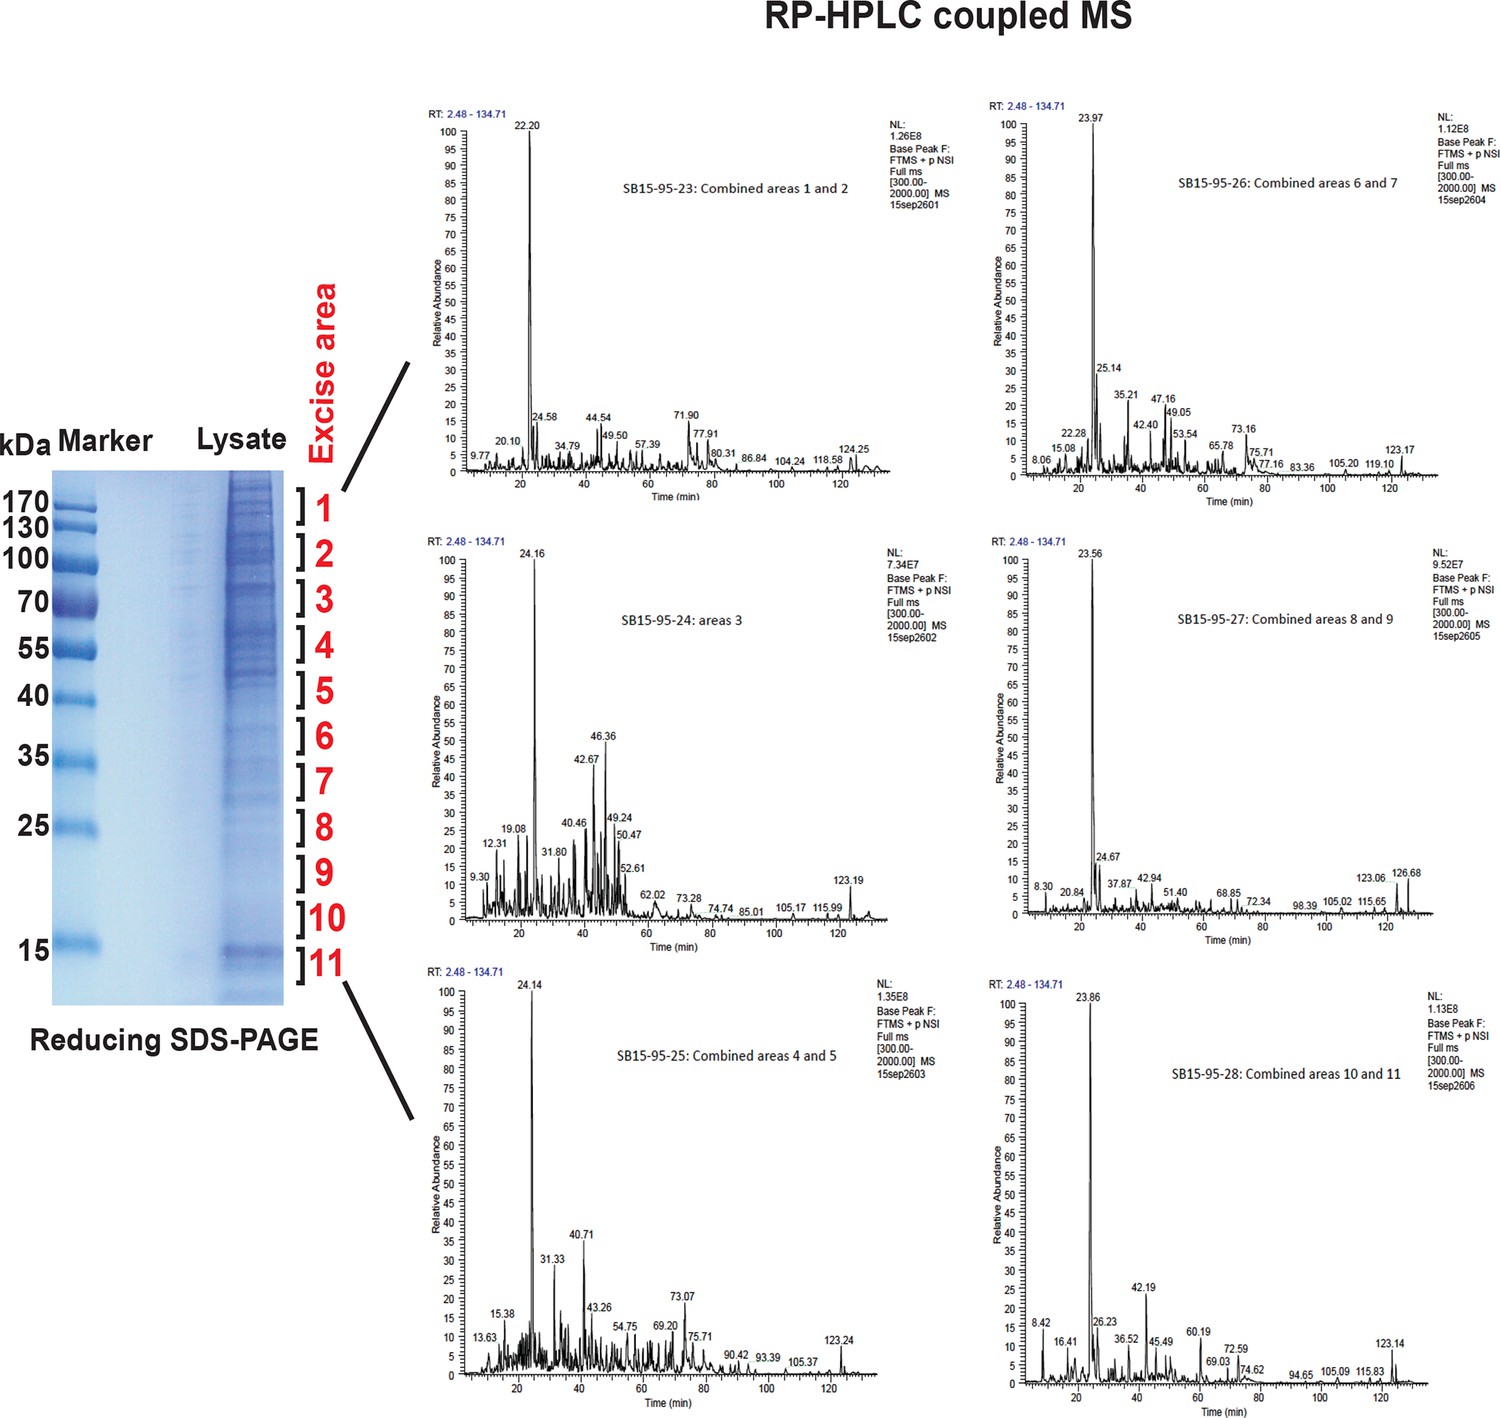
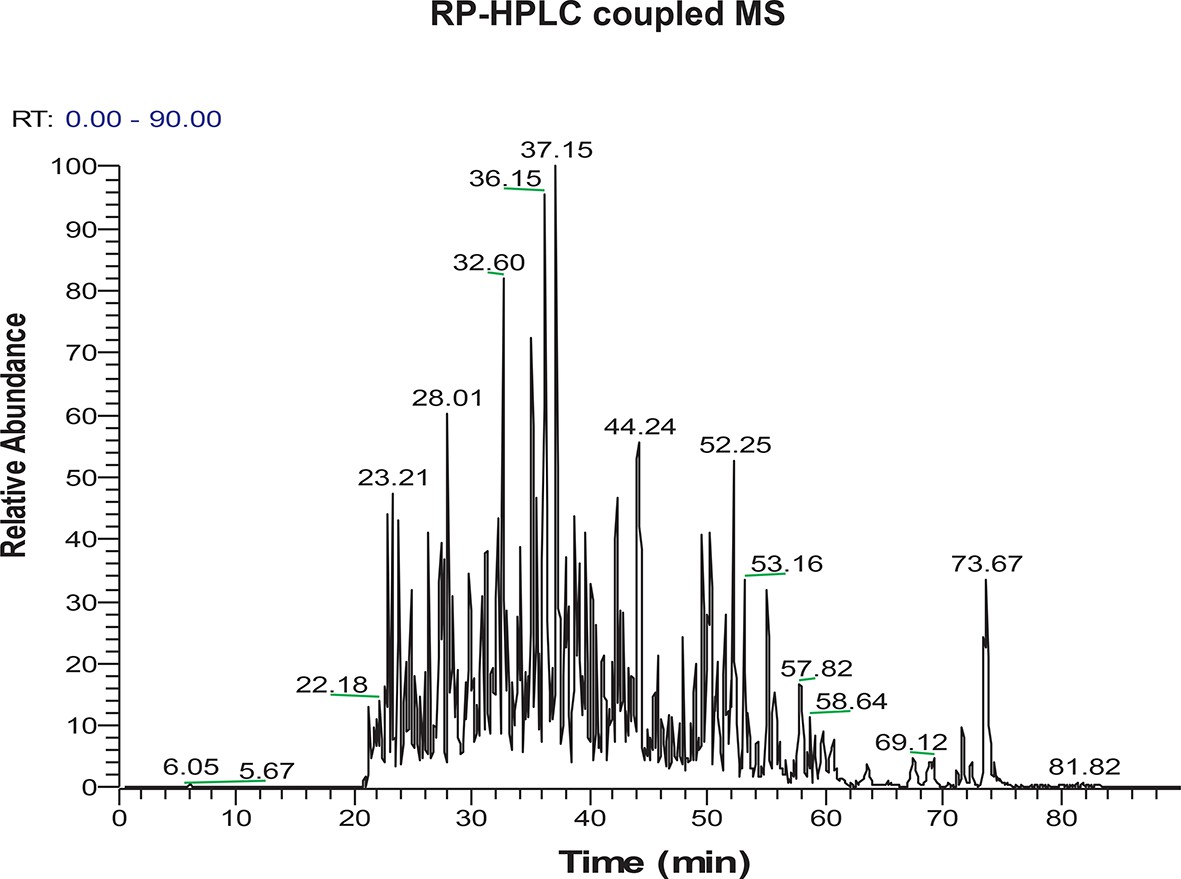
MS analysis of the full proteome from MIN6 cells treated with Tg for 18 hr.
Cell extracts were resolved by reducing SDS–PAGE and stained with Coomassie blue. The entire gel lane was cut into 11 fractions for in-gel digestions. The peptides from each fraction were combined as indicated and submitted for LC-MS/MS analysis. A total of 2244 proteins were quantified by label-free, semi-quantitative MS approaches.
Figure 3—figure supplement 7
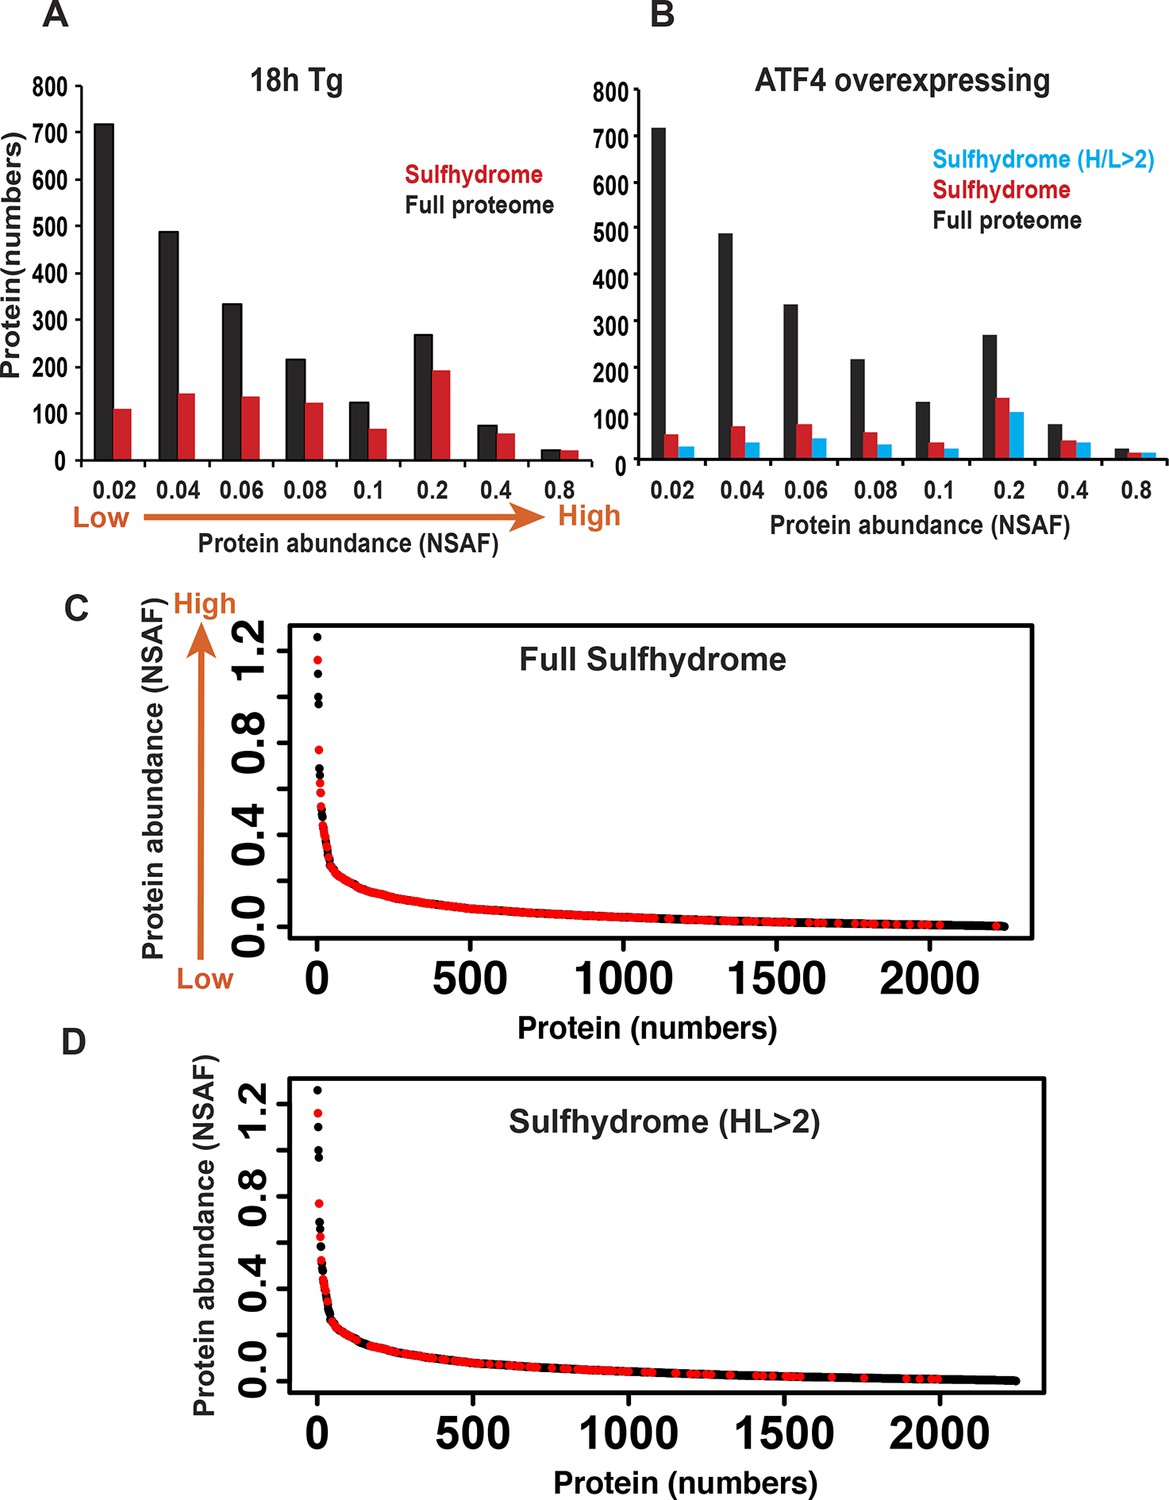
Protein sulfhydration does not correlate with their protein abundance.
The relative abundance of the proteins in the full proteome was determined based on the peptide spectral counts, which were corrected by normalizing to both the total number of spectra and the length of the protein, and this value was expressed as normal spectra abundance factor (NSAF). A comparison of the full protein abundance and sulfhydrome from Tg-treated (A), or ATF4 overexpressing MIN6 (B). (C) A comparison of sulfhydrated protein datasets for the full proteome reveals that a large fraction of medium abundant proteins are mainly targeted by H2S. (D) A comparison of sulfhydrated proteins with H/L ratios greater than twofold and the full proteome.
Figure 4 with 3 supplements
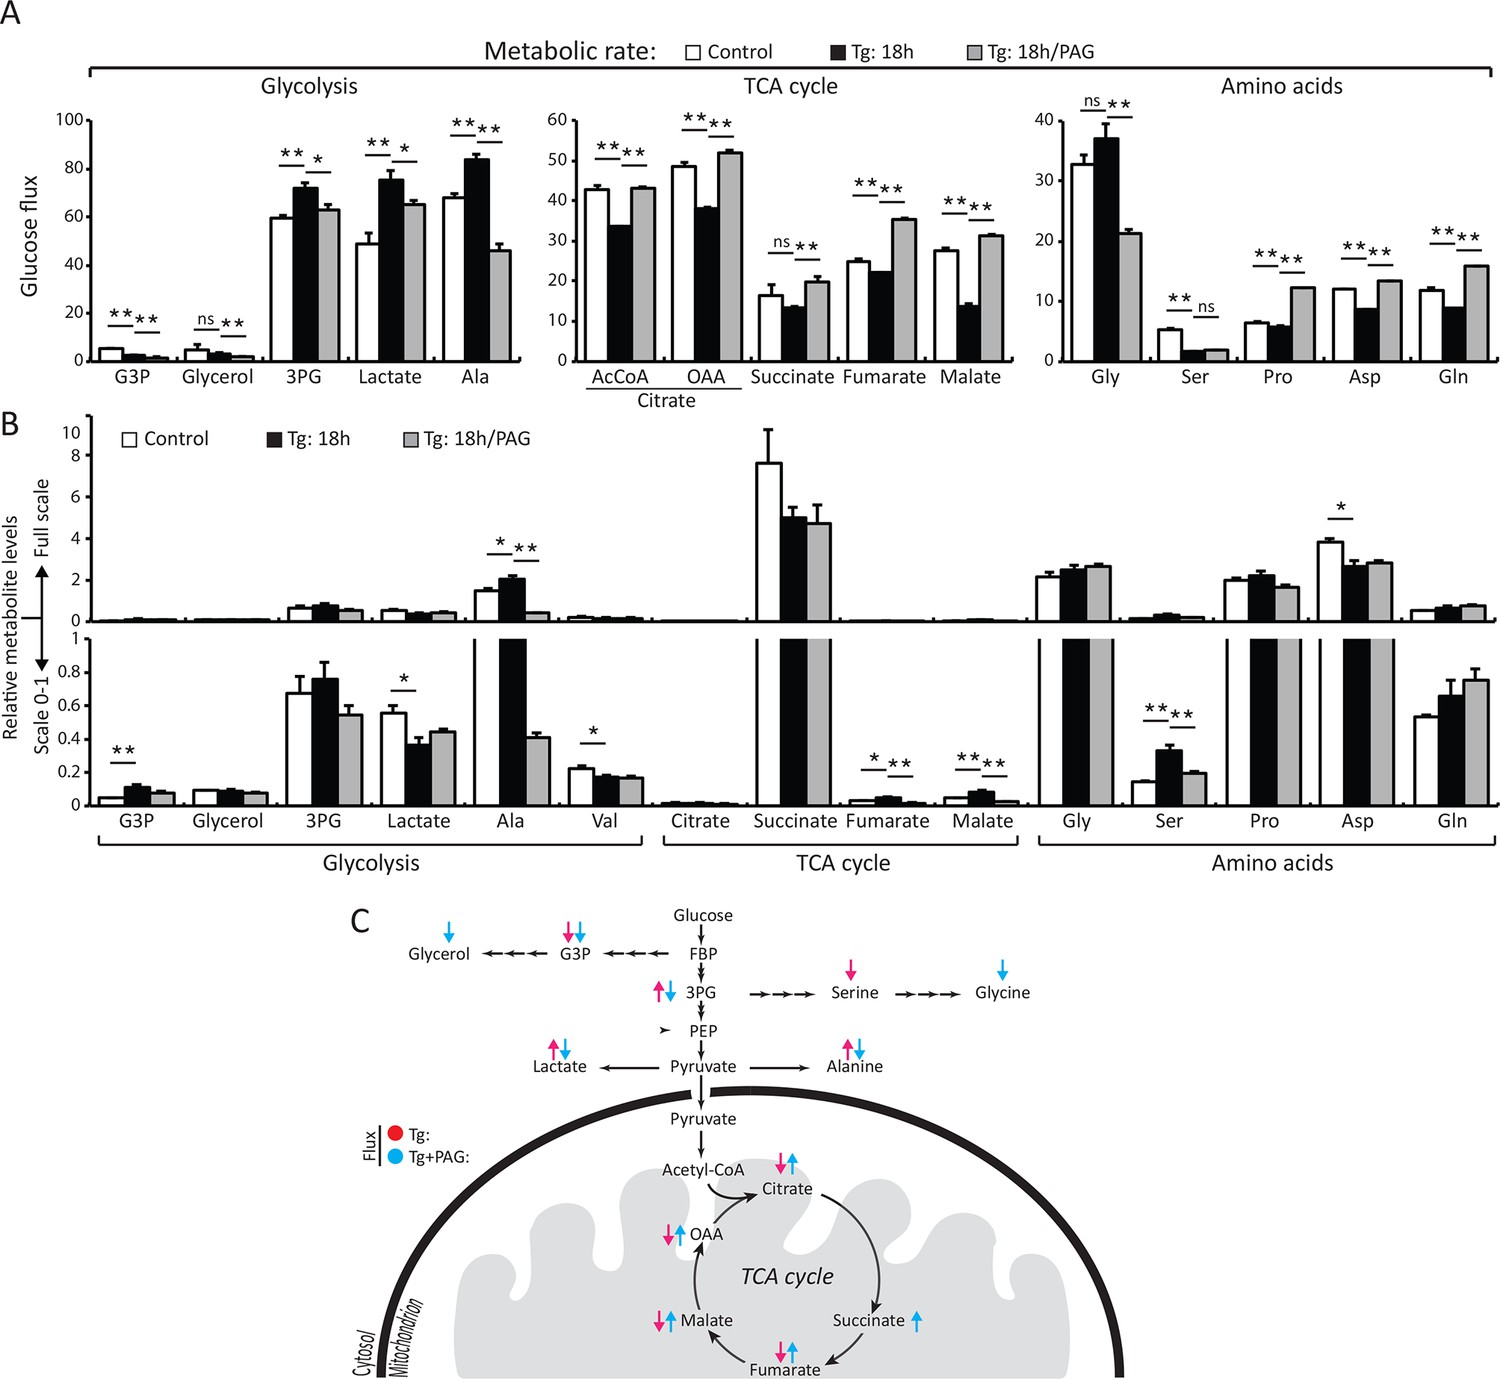
H2S synthesis during ER stress modulates metabolism in MIN6 cells.
(A) Measurement of 13C-glucose flux in metabolites, expressed as the molar percent enrichment [(ratio of labeled/sum (labeled + unlabeled) x 100%)], in MIN6 cells treated with Tg for 18 hr or after addition of PAG for the last 3.5 hr of Tg treatment. [U-13C]-glucose replaced glucose in the media for the last 3.5 hr of treatments. (B) Evaluation of the concentration of metabolites and amino acids in the same samples described in (A). All quantifications are presented as mean ± S.E.M. of technical duplicates and are represented four independent experiments. (C) Schematic representation of the major findings on metabolic flux from glucose during chronic ER stress. Chronic ER stress increased glycolytic flux and decreased forward TCA flux. Inhibition of CTH by PAG reversed the observed changes in glucose flux during ER stress. CTH: γ-cystathionase; ER: endoplasmic reticulum; TCA: tricarboxylic acid cycle.
Figure 4—figure supplement 1
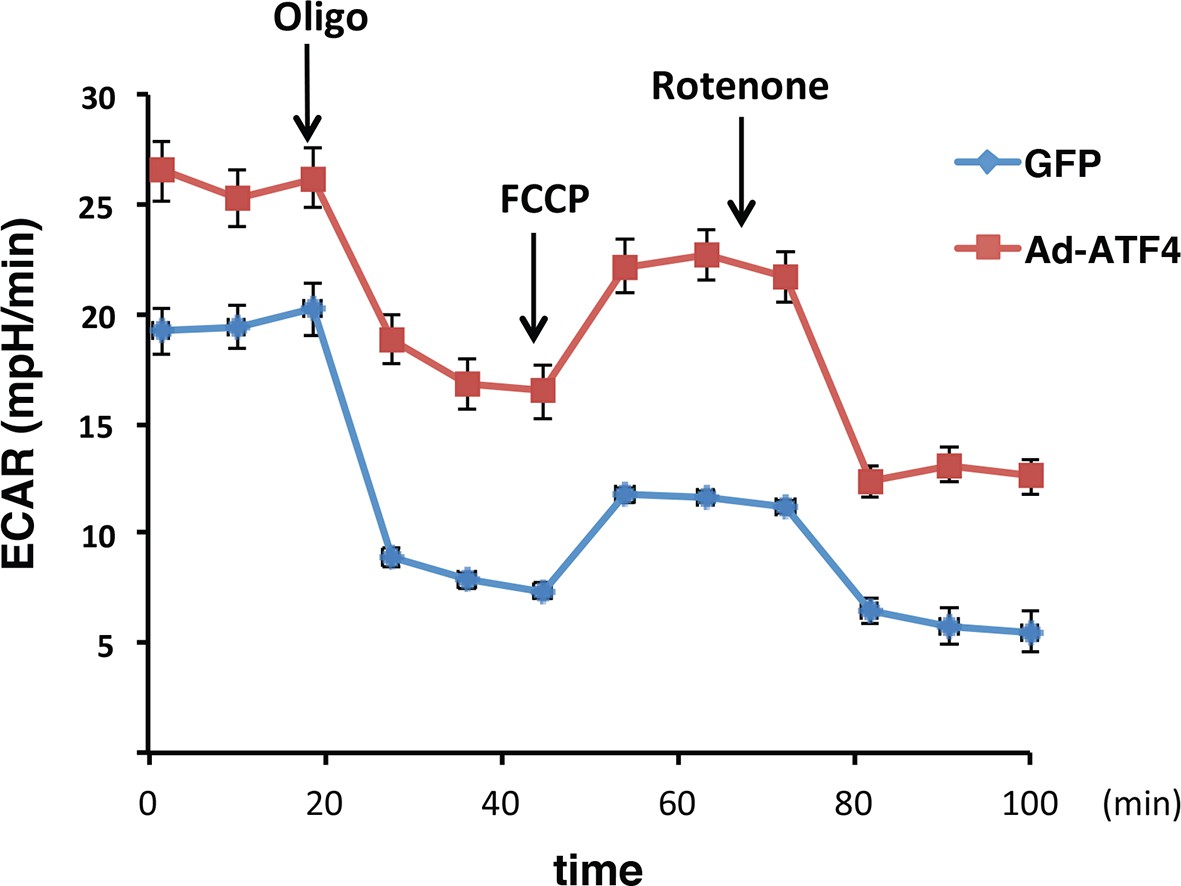
ATF4 -overexpressing MIN6 cells exhibit significantly high glycolytic rates.
The rates of extracellular acidification (ECAR) were determined by using the Seahorse analyzer from ATF4 expressed MIN6 cells, or GFP as the control after 48h of adenovirus infection. ECAR was normalized to cell numbers. The results are shown as a mean of four independent determinations.
Figure 4—figure supplement 2
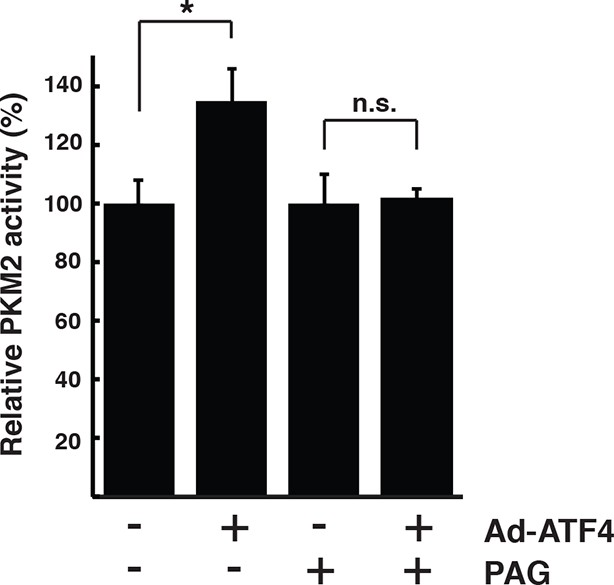
Pharmacological inhibition of CTH activity represses PKM2 activation in ATF4 overexpressed MIN6 cells.
Determination of the effect of PAG on the activity of PKM2 in MIN6 cells infected with either GFP as the control, or ATF4 adenovirus for 48 hr. The activities are shown as a mean of four independent determinations. CTH: γ-cystathionase; PAG: propargylglycine.
Figure 4—figure supplement 3
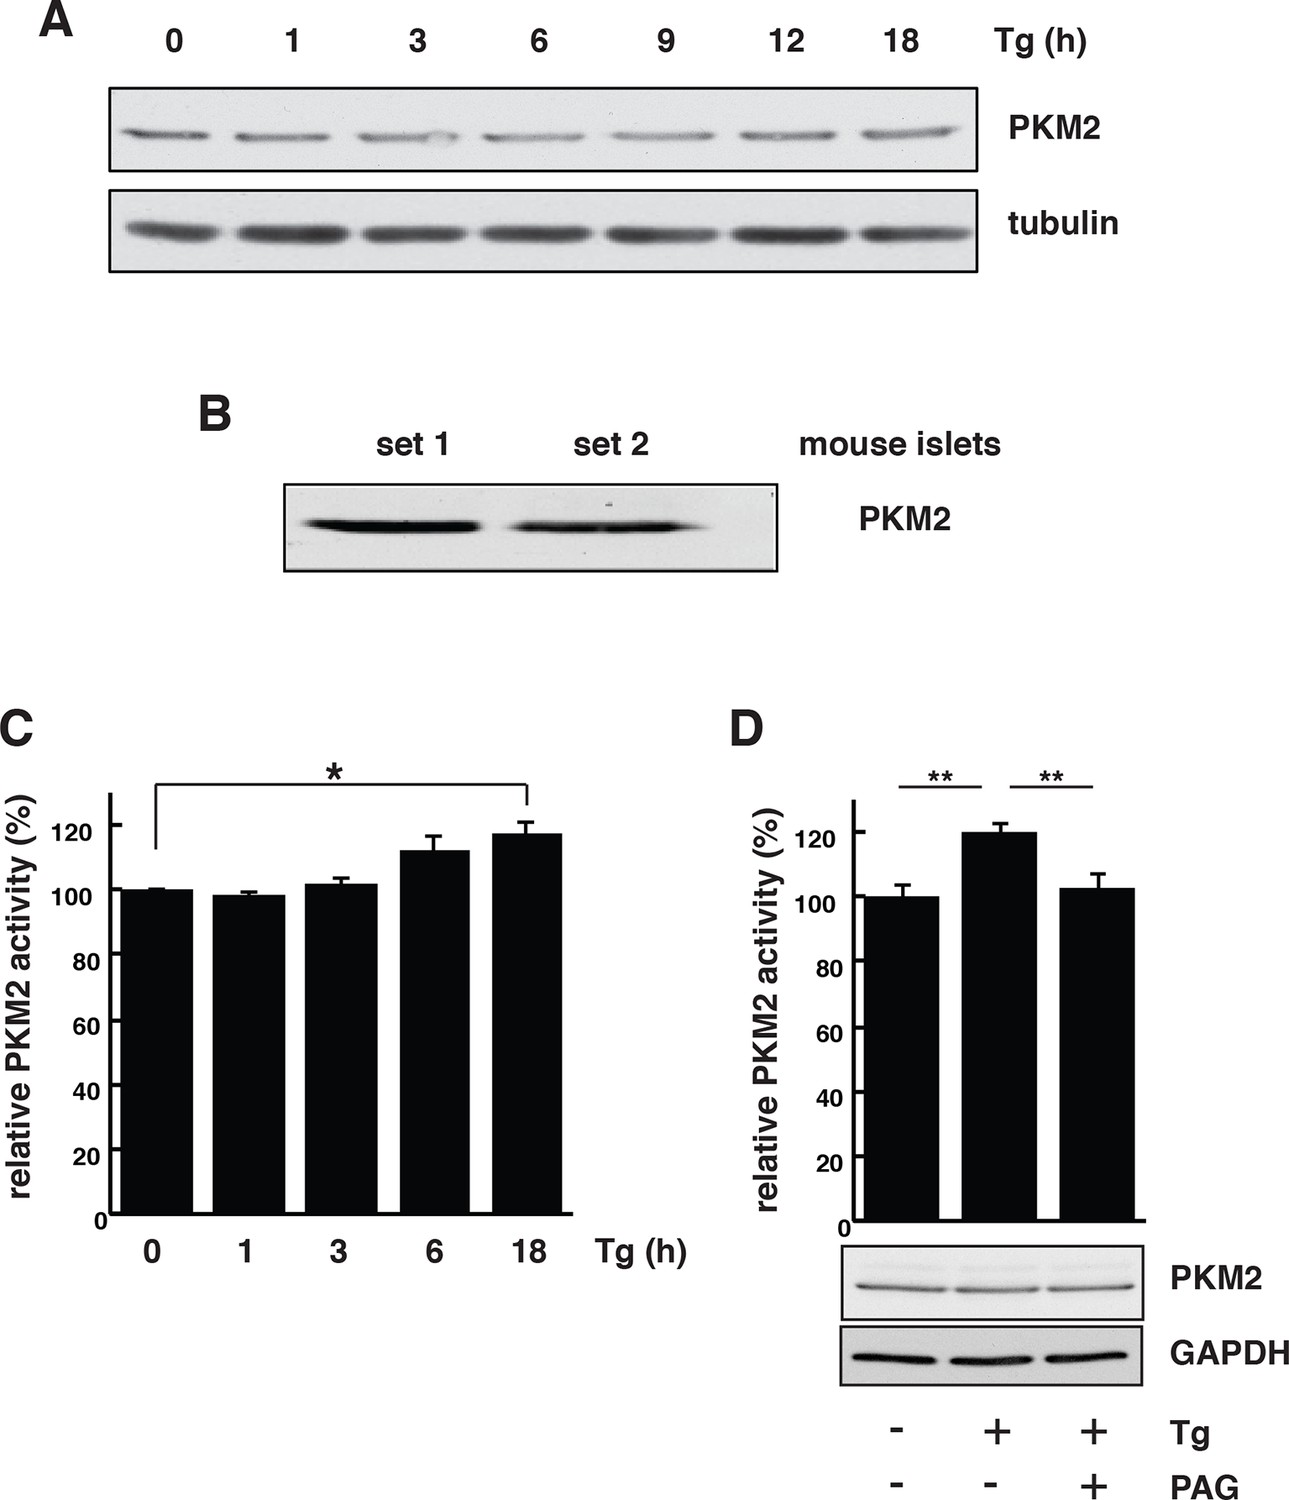
PKM2 activation dependents on CTH activity during ER stress in MIN6 cells.
(A) ER stress does not affect PKM2 protein levels. MIN6 cells were incubated with Tg at the indicated times. The protein expression was evaluated by Western blot analysis. (B) Western blot analysis of the expression of PKM2 in mouse islets. (C) Time-dependent increase of PKM2 activity in MIN6 cells treated with Tg at the indicated times. (D) Determination of the effect of PAG on the activity of PKM2 in MIN6 cells treated with Tg in the presence or absence of PAG (top) and on protein levels evaluated by Western blot analysis (bottom). For panels C and D the results are shown as a mean of four independent determinations. CTH: γ-cystathionase; ER: Endoplasmic reticulum; PAG: Propargylglycine.
Author response image 1
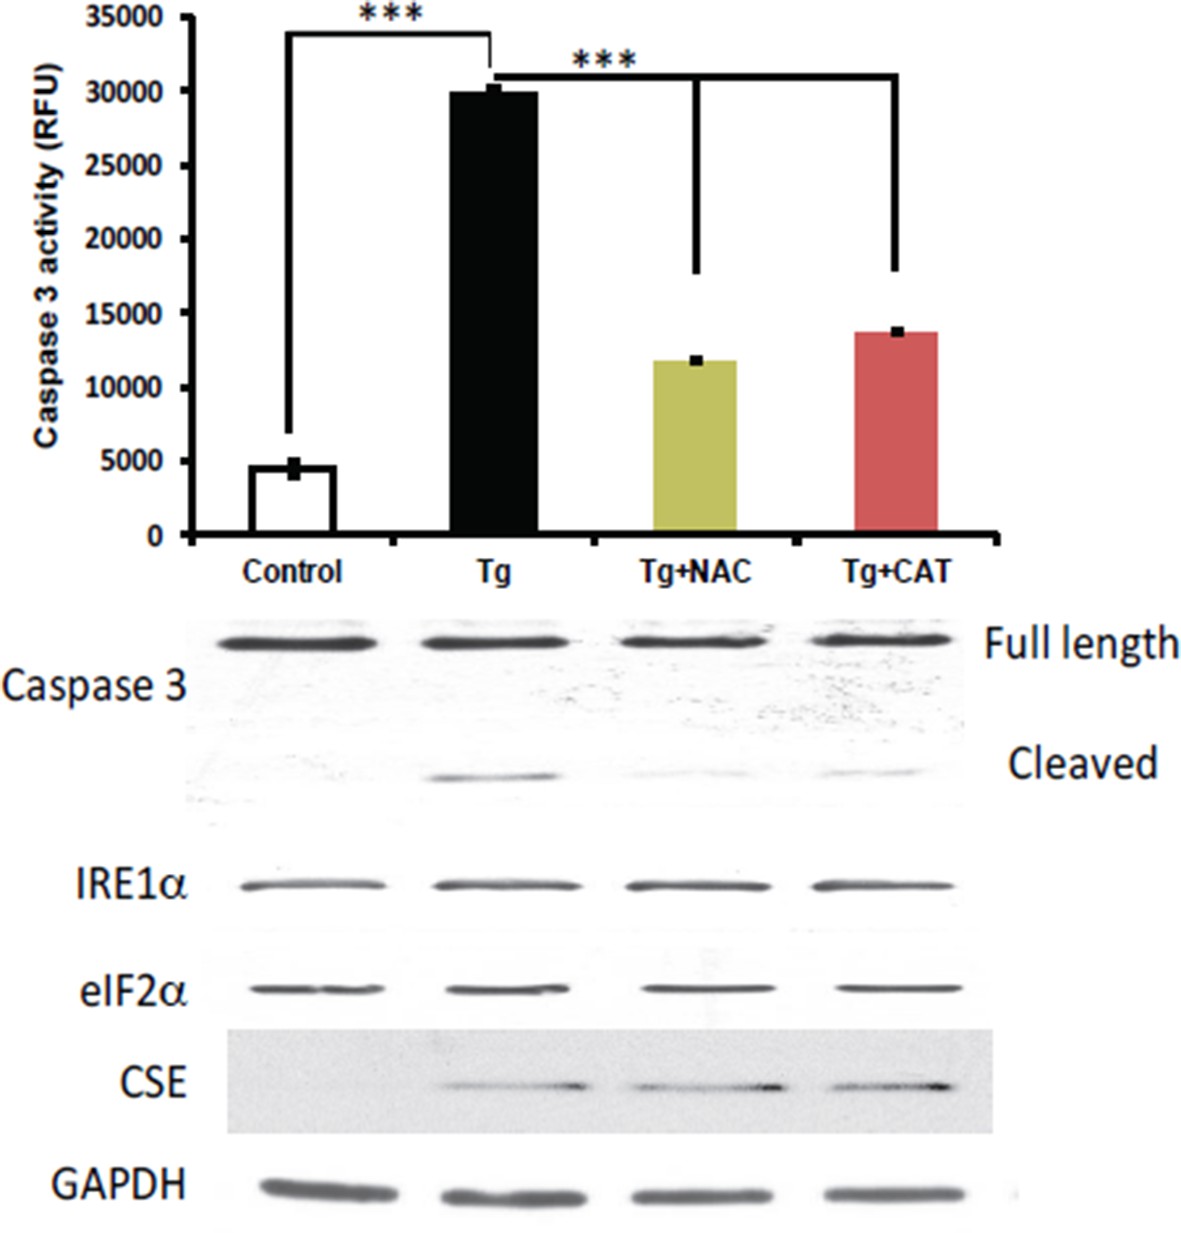
Antioxidant treatments do not affect the induction of CES protein expression in MIN6 treated with Tg for 18h.
MIN6 cells were either kept in DMEM growth medium (10% heat inactive FBS, 2 mM glutamine, and 25 mM glucose) as control, or were cultured in the medium supplement with Tg alone, Tg and N-acetylcysteine (NAC, 1 mM), or Tg and catalase (CAT, 500 unit/mL) for 18h. After treatments, cells were washed with cold PBS and lysed with the RIPA buffer (150 mM NaCl, 1 mM EDTA, 0.5% Triton X-100, 0.5% deoxycholic acid and 100 mM Tris-HCl (pH 7.5) containing protease and phosphatase inhibitor from Roche. Cells were then sonicated on ice, lysates were clarified by centrifugation at 4°C and the protein concentrations were determined by the BCA assay (BioRad). (Top panel) The antioxidant effects were evaluated by the caspase 3 activity assay. We found that the caspase 3 activation was significantly reduced by both antioxidant treatments compared to untreated cells. However, the induction of CSE protein expression was unaffected by the treatments (bottom panel), indicating that Increased ROS production does not contribute in induction of CSE protein levels via the ATF4 transcription program during ER stress in MIN6.
Additional files
-
Supplementary file 1
Metabolite flux and relative concentrations of metabolites from control (CON) and Tg-treated MIN6 cells for 18 hr.
PAG was added for the last 3.5 hr of Tg-treatment in the indicated experimental samples. Notes: the reported serine M+2 labeling reflects the two carbon atoms in the GC-MS fragment ion that was quantitated, and is expected to be predominantly derived from fully-labeled (M+3) serine.
- https://doi.org/10.7554/eLife.10067.036
Download links
A two-part list of links to download the article, or parts of the article, in various formats.
Downloads (link to download the article as PDF)
Open citations (links to open the citations from this article in various online reference manager services)
Cite this article (links to download the citations from this article in formats compatible with various reference manager tools)
Quantitative H2S-mediated protein sulfhydration reveals metabolic reprogramming during the integrated stress response
eLife 4:e10067.
https://doi.org/10.7554/eLife.10067


