The NFκB-inducing kinase is essential for the developmental programming of skin-resident and IL-17-producing γδ T cells
- University of Zurich, Switzerland
- Kantonsspital St. Gallen, Switzerland
- Johannes-Gutenberg University of Mainz, Germany
Figures
Figure 1 with 1 supplement
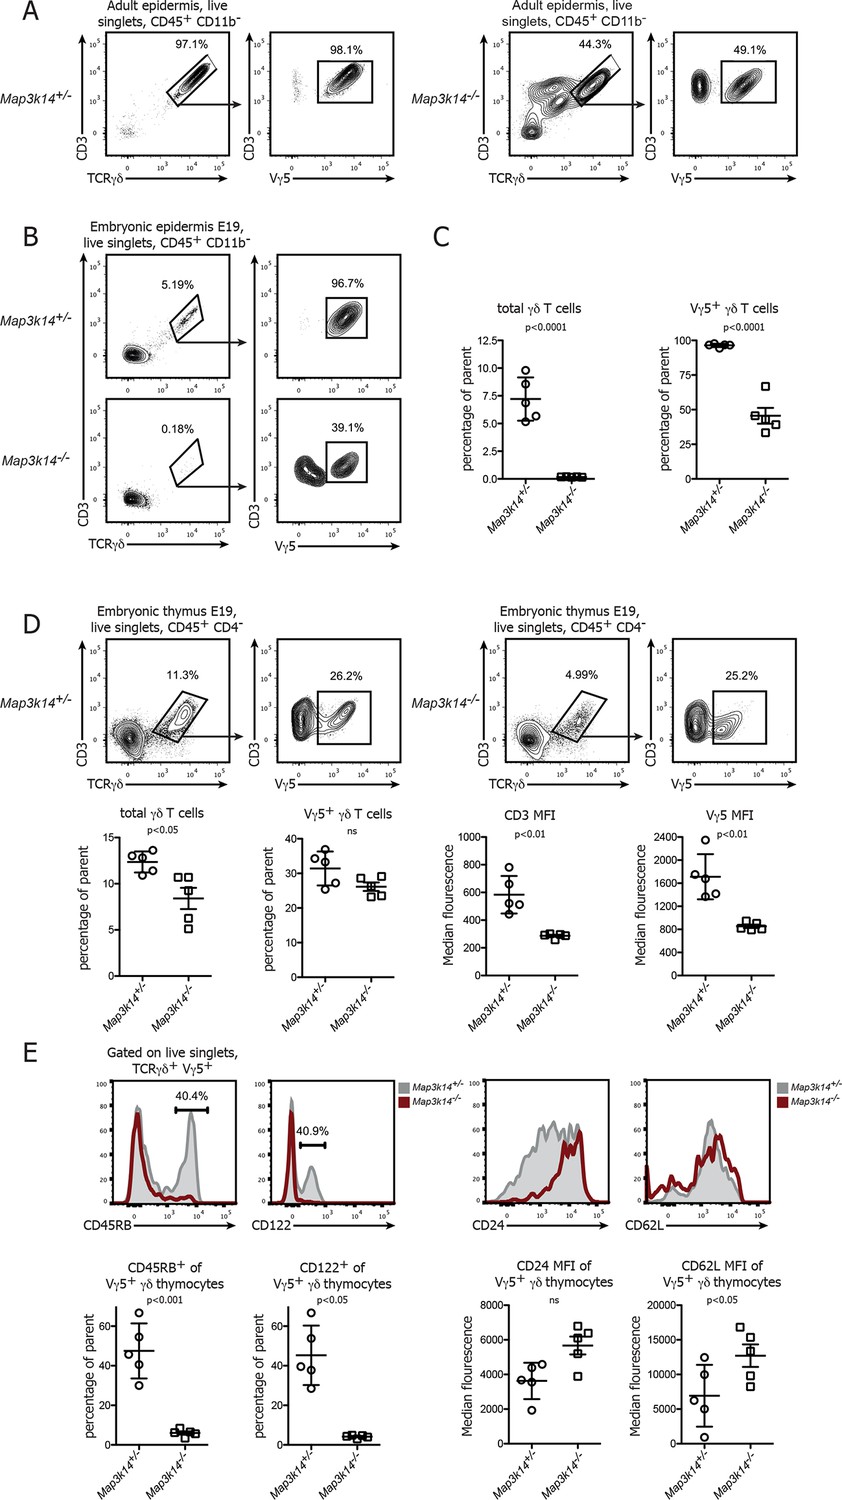
In the absence of NIK, the development of DETCs is blocked in the embryonic thymus.
(A) Lymphocytes isolated from the epidermis of adult heterozygous control (left panel) and Map3k14-/- animals were analysed for the presence of Vγ5+ DETCs. Pregating is on live singlets and CD45+ CD11b- cells. (B) Analysis of the epidermal γδ T cell compartment of heterozygous control (upper panel) and Map3k14-/- embryos (day 19 post conception) after pregating on live singlets and CD45+ CD11b- cells. (C) Summary of the frequency of total γδ T cells as well as Vγ5+ cells within the γδ T cell gate. Data are mean +/- SD and are representative of two similar experiments. (D) Analysis of developing Vγ5+γδ thymocytes in the thymi of E19 embryos. Flow Plots have been pregated on live singlets and CD45+ CD4- cells. Lower panel depicts the summary of the frequency of total γδ thymocytes as well as Vγ5+ cells within the γδ T cell gate in d19 embryonic thymi, and the median fluorescence intensity of the indicated markers. Data are mean +/- SD and representative of two similar experiments. (E) Analysis of the expression level of CD45RB, CD122, CD24 and CD62L on developing Vγ5+γδ thymocytes isolated from E19 embryonic thymi. Grey shaded histograms depict heterozygous controls, red histograms Map3k14-/- cells. Lower panel shows the summary for the frequency of positive cells for CD45RB and CD122 and the median fluorescence intensity of CD24 and CD62L, respectively. Data are mean +/- SD and are representative of two similar experiments.
Figure 1—figure supplement 1
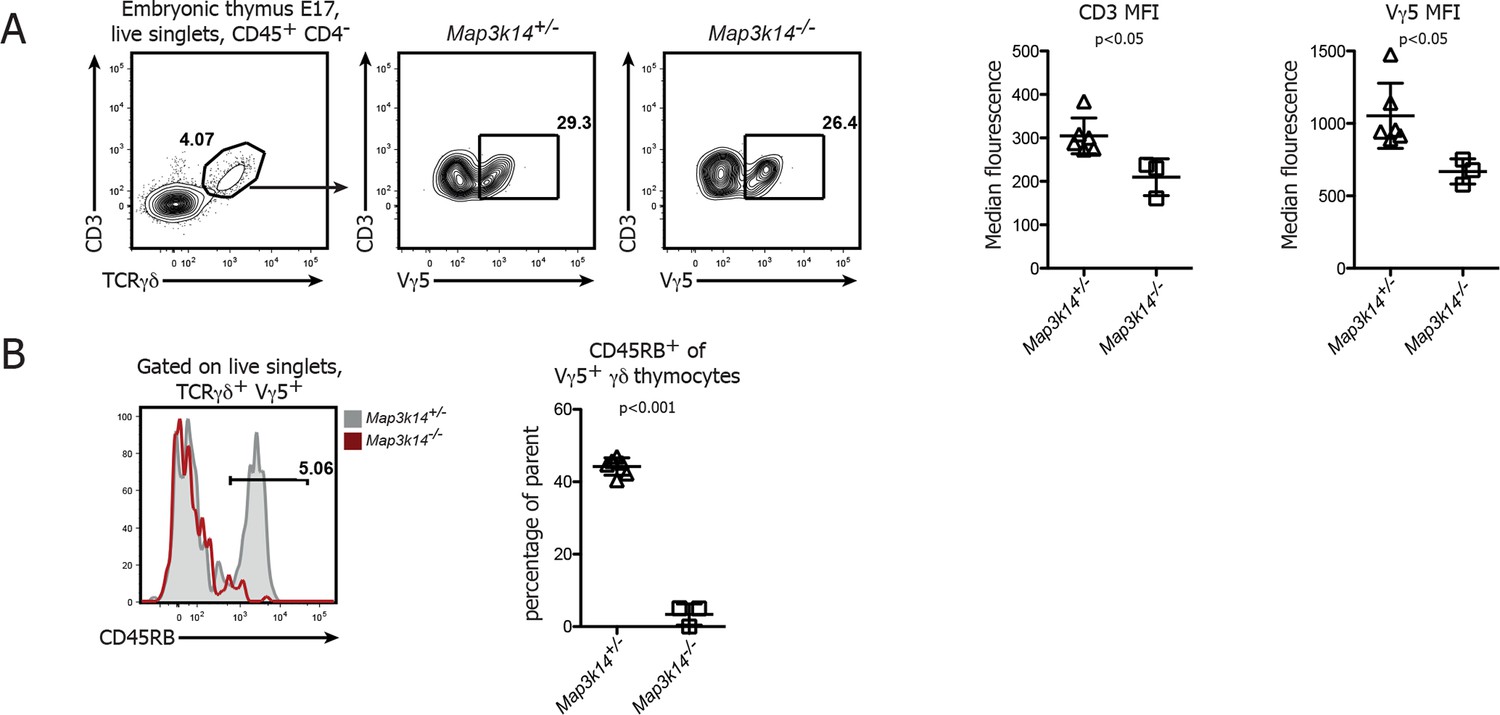
DETC development in NIK-deficient thymi at embryonic day 17.
(A) Analysis of developing Vγ5+ γδ thymocytes in E17 thymi. Flow Plots have been pregated on live singlets and CD45+ CD4- cells. Right panels depict the median fluorescence intensity of CD3 and Vγ5 expression. Data are mean +/- SD and representative of two similar experiments. (B) Analysis of the expression level of CD45RB on developing Vγ5+ γδ thymocytes isolated from E17 embryonic thymi. Grey shaded histograms depict heterozygous controls, red histograms Map3k14-/- cells. Right panel shows the summary for the frequency of CD45RB positive cells. Data are mean +/- SD and are representative of two similar experiments.
Figure 2 with 1 supplement
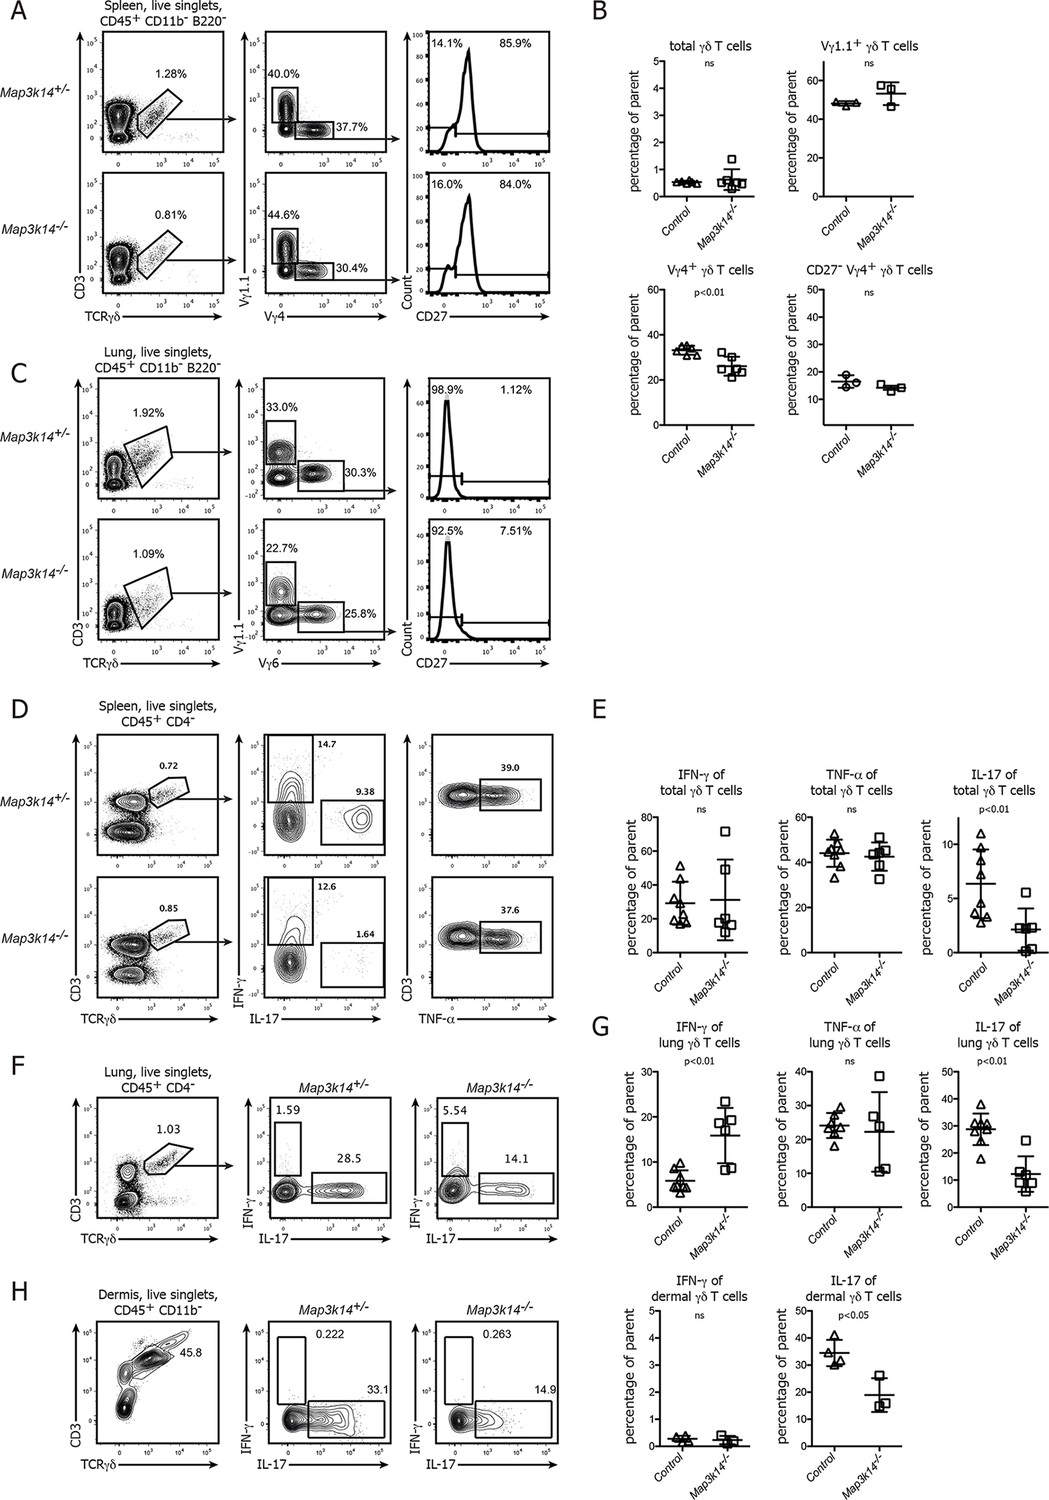
In NIK-deficient mice, γδ T cells selectively lose their ability for production of IL-17.
(A) Flow cytometric analysis of the splenic γδ T cell compartment of heterozygous control (upper panel) and Map3k14-/- animals after pregating on live singlets and CD45+ CD11b- B220- cells. The distribution of Vγ1.1+, Vγ4+, and CD27- Vγ4+ γδ T cells is shown. (B) Summary of two independent experiments. Data represent mean +/- SD of the indicated cell subsets. (C) Analysis of the lung-resident γδ T cell compartment of heterozygous control (upper panel) and Map3k14-/- animals after pregating on live singlets and CD45+ CD11b- B220- cells. The distribution of Vγ1.1+, Vγ6+, and CD27- Vγ6+ γδ T cells is shown. (D) Flow cytometric analysis of IFN-γ, IL-17 and TNF-α expression by peripheral γδ T cells after PMA/Ionomycin stimulation, isolated from the spleen of heterozygous control (upper panel) and Map3k14-/- animals (lower panel). Left plots have been pregated on CD45+ CD11b- CD4- live singlets. (E) Summary of the frequency of cytokine producing cells within the γδ T cell compartment. Data represent mean +/- SD. (F) Flow cytometric analysis of IFN-γ and IL-17 expression by lung-resident γδ T cells isolated from the lung of heterozygous control (upper panel) and Map3k14-/- animals (lower panel). Left plots have been pregated on CD45+ CD11b- CD4- live singlets. (G) Summary of the frequency of cytokine producing cells within the lung-resident γδ T cell compartment. Data represent mean +/- SD. (H) Flow cytometric analysis of IFN-γ and IL-17 expression by dermal γδ T cells isolated from the skin of heterozygous control and Map3k14-/- animals. Right panel depicts the frequency of cytokine producing cells within the dermal γδ T cell compartment. Data show mean +/- SD and are representative of at least three independent experiments.
Figure 2—figure supplement 1
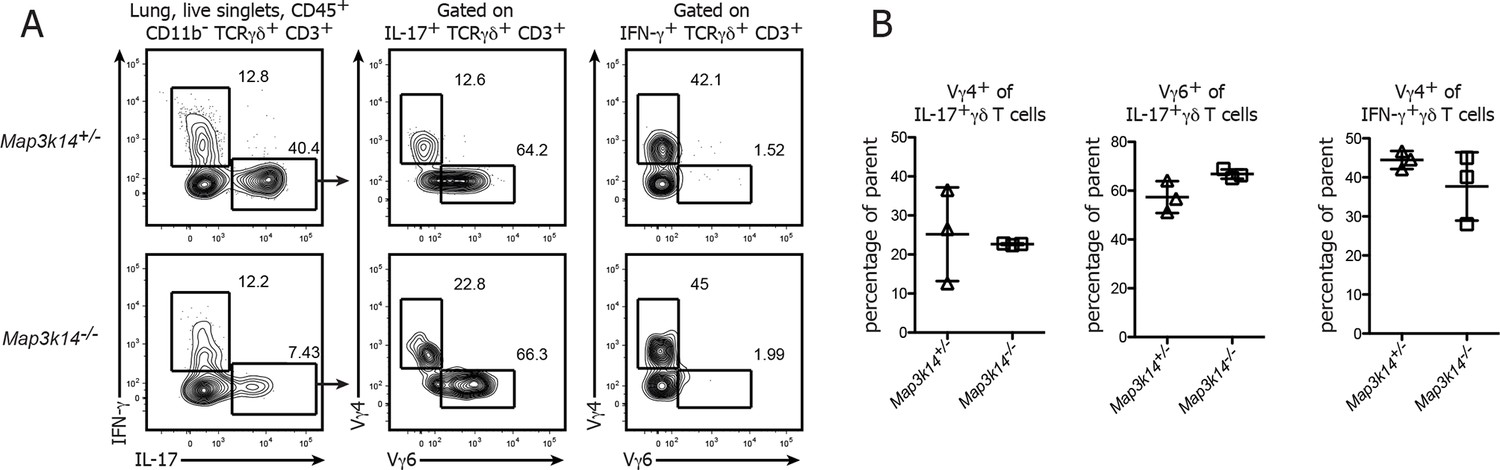
Ratio of Vγ4+ and Vγ6+ cells in the lung-resident IL-17-producing γδ T cell compartment.
(A) Flow cytometric analysis of Vγ4+ and Vγ6+ cells within IFN-γ and IL-17 expressing γδ T cells isolated from the lung of heterozygous control (upper panel) and Map3k14-/- animals (lower panel). Left plots have been pregated on CD45+ CD11b- CD3+ TCRγδ+ live singlets. (B) Summary of the frequency of Vγ4+ and Vγ6+ cells within the lung-resident γδ T cell compartment. Data represent mean +/- SD.
Figure 3
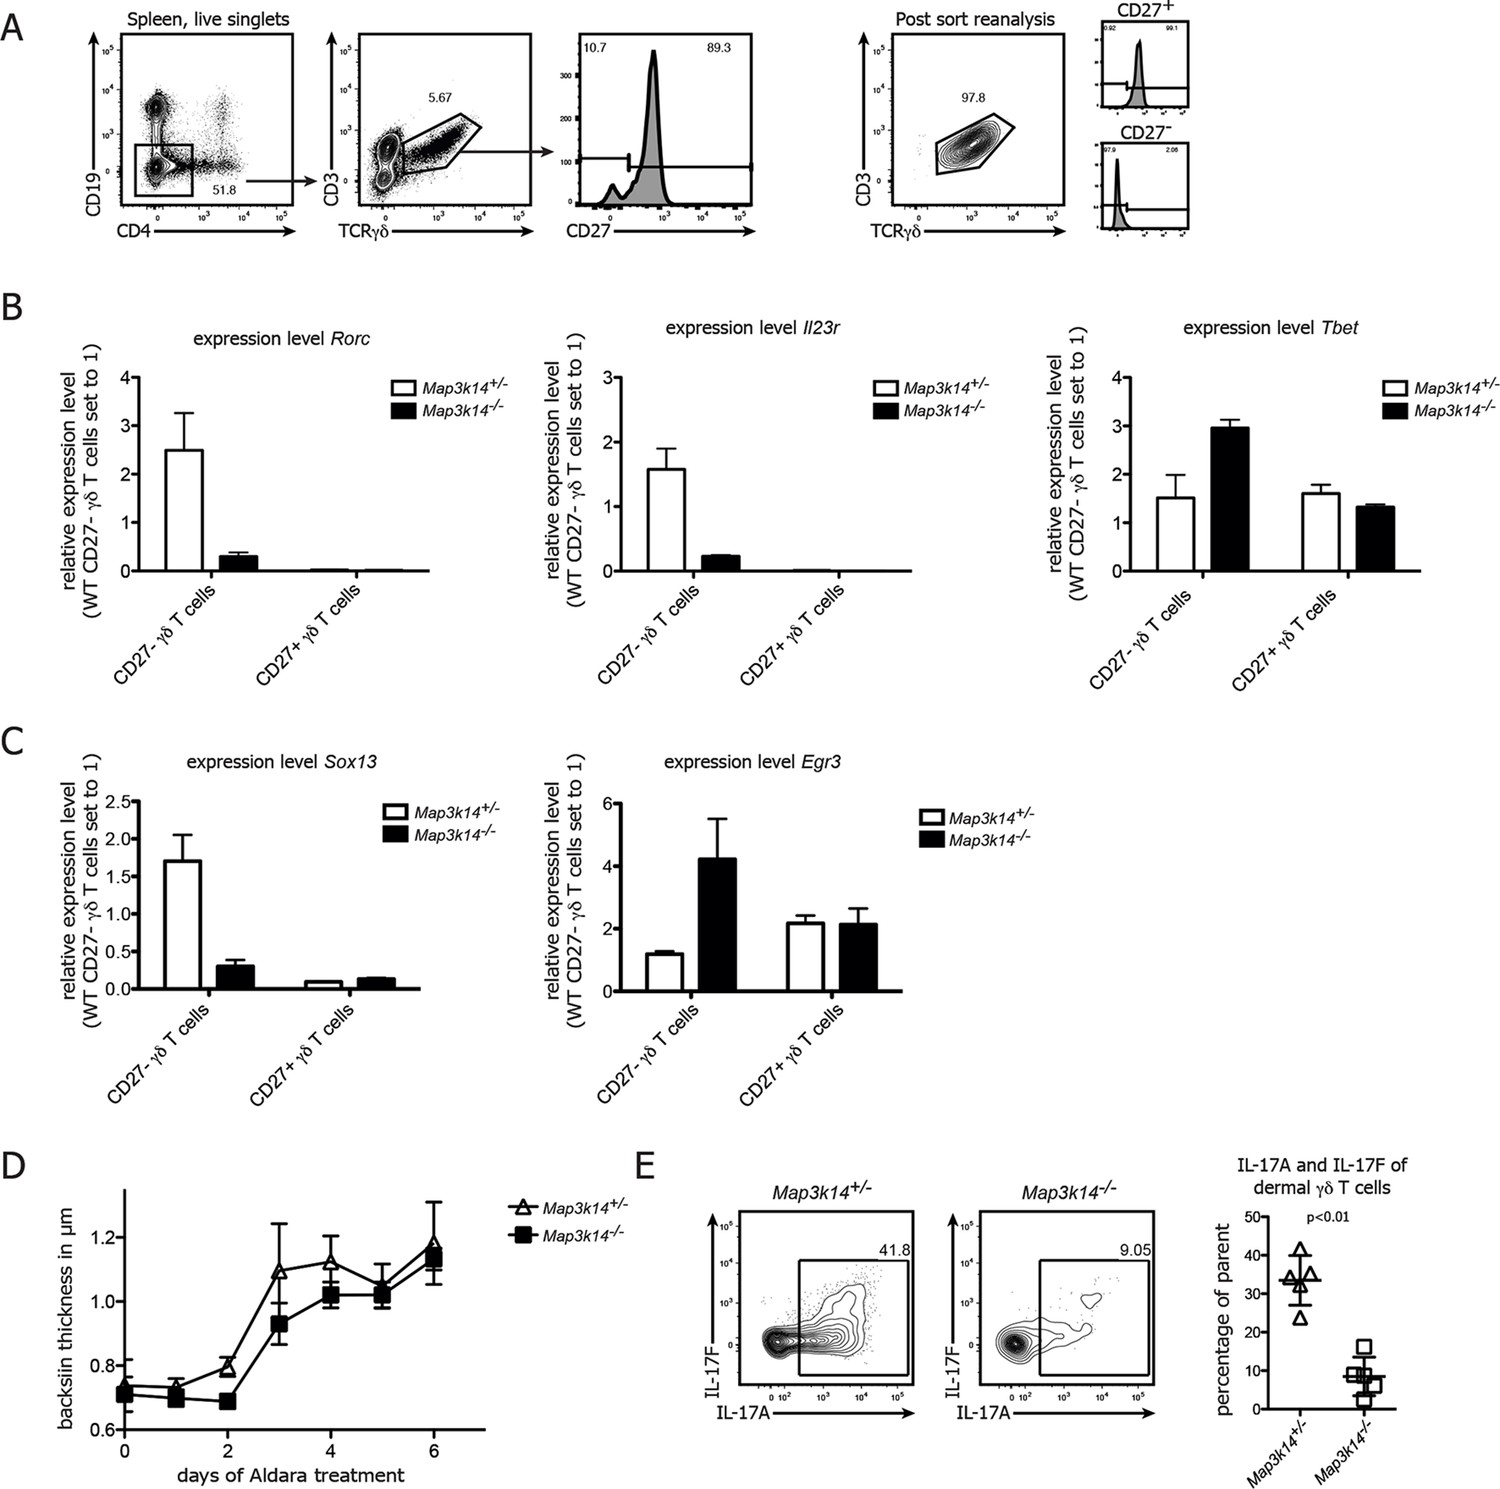
NIK-deficient CD27- γδ T cells show reduced expression of Rorc and and Sox13.
(A) Gating strategy used for sorting of CD27+ and CD27-γδ T cells. Right plot depicts post-sort reanalysis, which routinely yielded purities >95%. (B) Analysis of the expression level of Rorc, Il23r and Tbet mRNA in sorted CD27+ and CD27- γδ T cells isolated from the spleen of the indicated genotypes. Data represent mean +/- SD. (C) Analysis of the expression level of Sox13 and Egr3 in sorted CD27+ and CD27- splenic γδ T cells isolated from the indicated genotypes. (D) Backskin thickness after Aldara treatment of heterozygous control (open triangles) and Map3k14-/- animals (closed squares). Data are representative of two independent experiments. (E) IL17-A and IL17-F expression of dermal γδ T cell on day 6 after Aldara treatment.
Figure 4 with 1 supplement
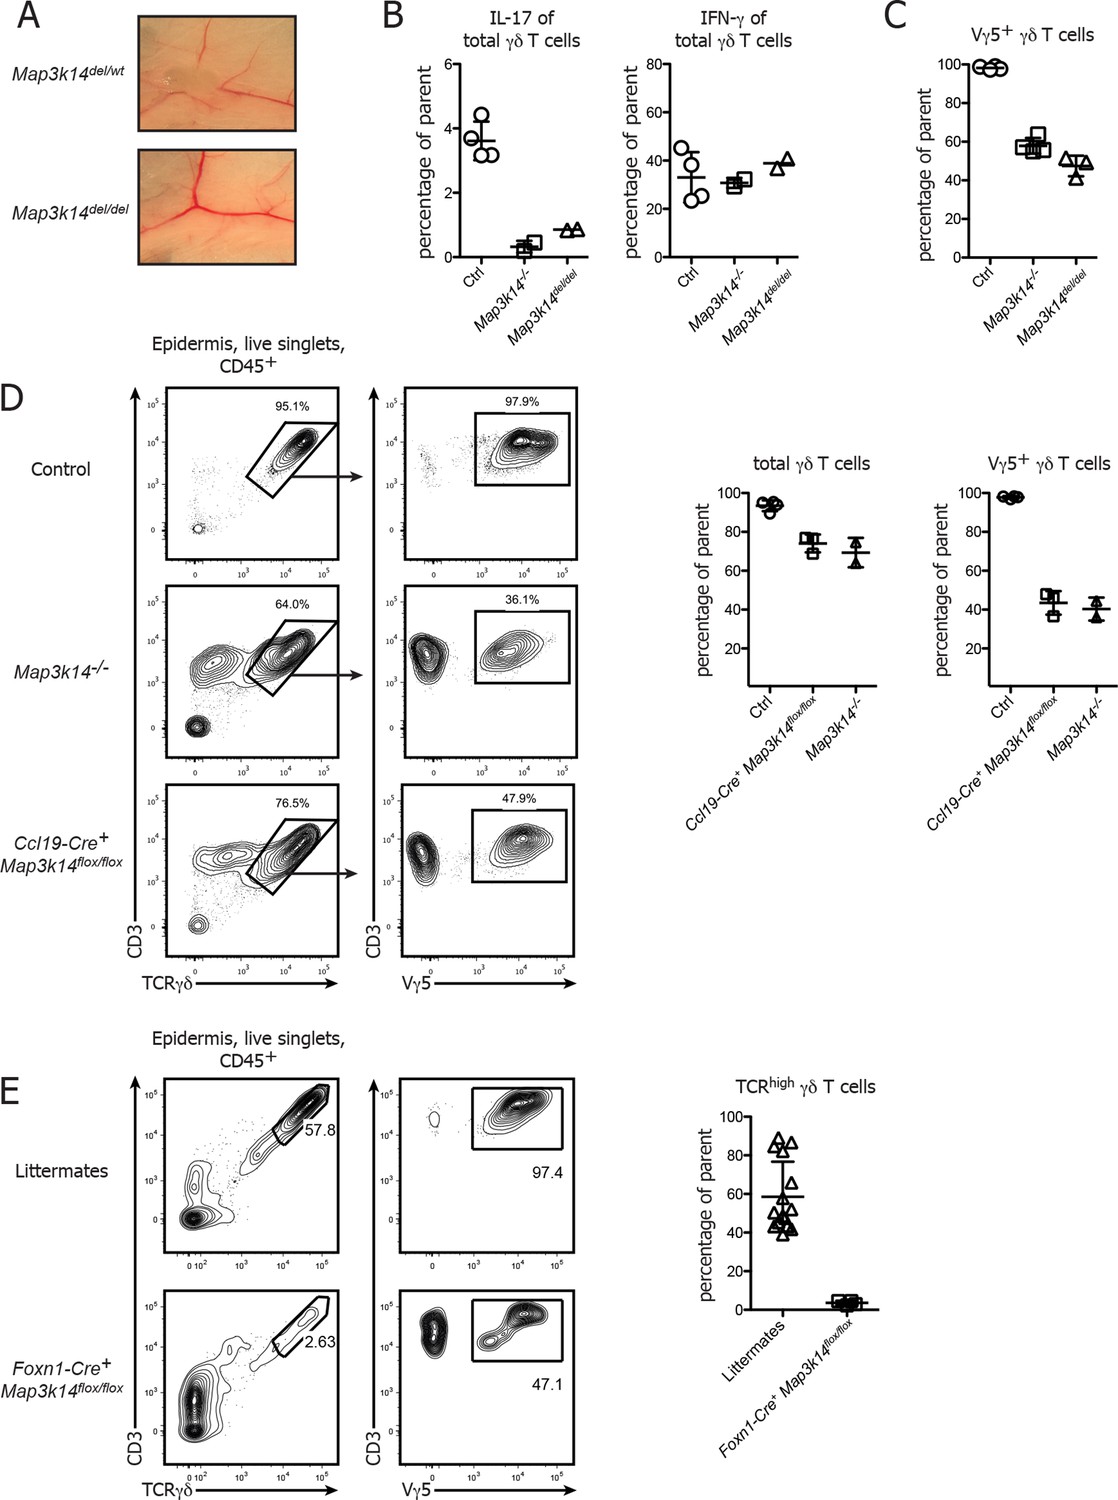
Conditional deletion of NIK in mTECs causes impaired DETC development.
(A) Map3k14flox/wt mice have been crossed to Deleter Cre animals for deletion of the Loxp flanked gene locus. After subsequent breeding to homozygosity, Map3k14del/del mice were analyzed for the presence of lymph nodes. Upper panel depicts heterozygous controls. (B) Splenic γδ T cells from control, Map3k14-/- and Map3k14del/del mice were assessed for production of IL-17 (left panel) and IFN-γ (right panel) by intracellular cytokine staining. (C) The epidermal γδ T cell compartment of control, Map3k14-/- and Map3k14del/del animals was assessed for the frequency of Vγ5+ DETCs. (D) Lymphocytes isolated from the epidermis of adult control (upper panel), Map3k14-/- and Ccl19-Cre+ Map3k14flox/flox animals were analysed for the presence of Vγ5+ DETCs. Pregating is on live singlets and CD45+ cells. Right panel depicts the summary of the frequency of total γδ T cells as well as Vγ5+ γδ T cells in the epidermis of Control, Map3k14-/- and Ccl19-Cre+ Map3k14flox/flox animals. Data represent mean +/- SD. (E) Frequency of total γδ T cells in the skin of 12-–13 day old control littermates and Foxn1-Cre+ Map3k14flox/flox animals. Data represent mean +/- SD and is pooled from several independent experiments.
Figure 4—figure supplement 1
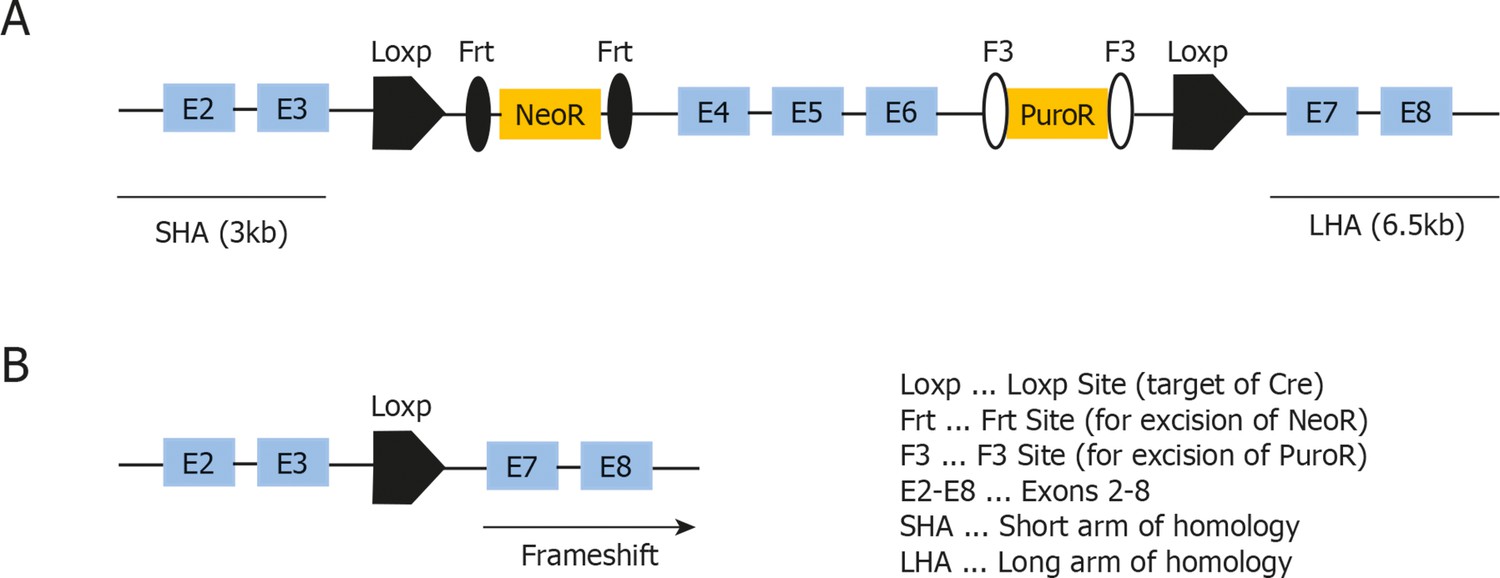
Targeting strategy used for generation of the conditional Map3k14flox/wt strain.
(A) Schematic representation of the targeted Map3k14 gene locus showing the position of the Loxp Sites flanking exon 4-–6. Abbreviations are denoted in the figure. (B) Schematic representation of the Map3k14 locus after Cre-mediated recombination, leading to a frameshift and a stop codon in exon 7.
Figure 5
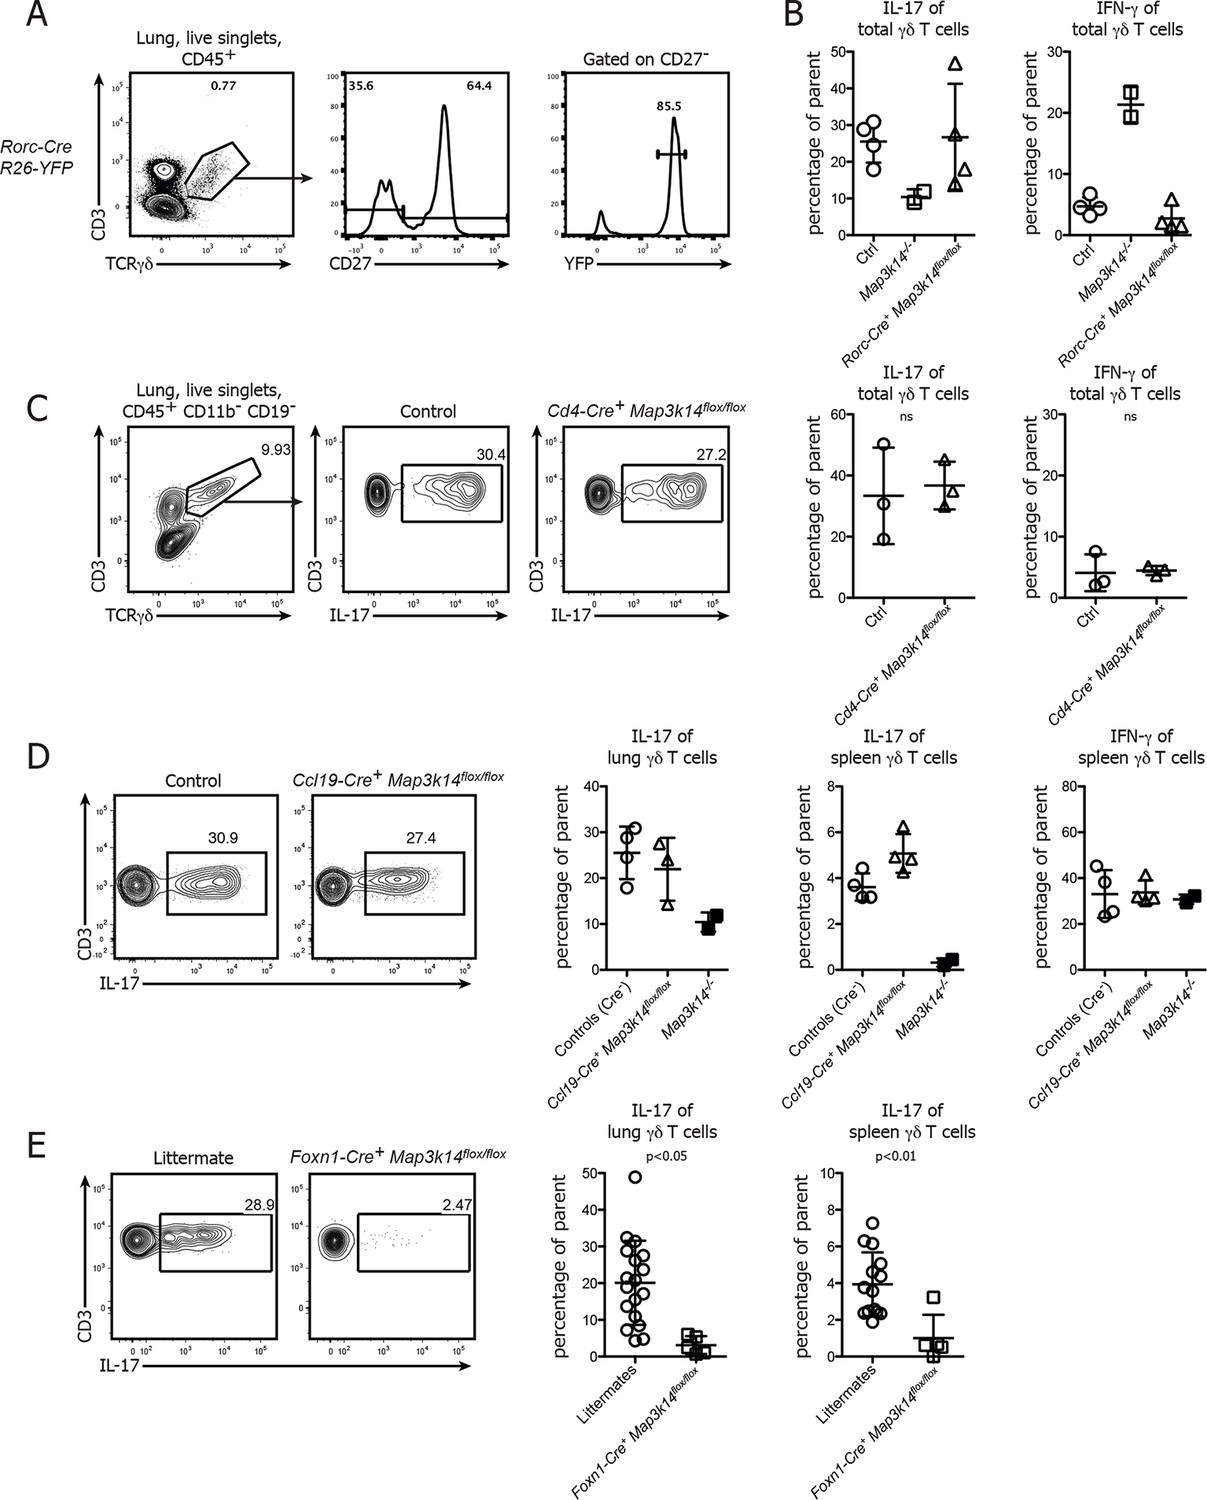
Conditional deletion of NIK in TECs causes not only a loss of DETCs, but also IL-17-producing γδ T cells.
(A) γδ T cells were isolated from the lung of Rorc-Cre+ R26-Stop-flox YFP-mice and assessed for the frequency of YFP+ cells within the CD27-γδ T cell compartment. (B) Lung-resident γδ T cells from adult control, Map3k14-/- and Rorc-Cre+ Map3k14flox/flox mice were assessed for production of IL-17 (left panel) and IFN-γ (right panel) by intracellular cytokine staining. (C) Lung-resident γδ T cells from adult control and CD4-Cre+ Map3k14flox/flox mice were assessed for production of IL-17 (left panel) and IFN-γ (right panel). (D) Lung-resident as well as splenic γδ T cells from adult control and Ccl19-Cre+ Map3k14flox/flox mice were assessed for production of IL-17 and IFN-γ. Data is representative of three independent experiments. (E) Frequency of IL-17-producing γδ T cells in the lung of 12-–13 day old control littermates and Foxn1-Cre+ Map3k14flox/flox animals, plots have been pregated on live CD45+ singlets, CD3+ TCRγδ+ cells. Right panels depict the summary of several independent experiments for cytokine production in the lung (left) and spleen (right). Data are mean +/- SD.
Download links
A two-part list of links to download the article, or parts of the article, in various formats.
Downloads (link to download the article as PDF)
Open citations (links to open the citations from this article in various online reference manager services)
Cite this article (links to download the citations from this article in formats compatible with various reference manager tools)
The NFκB-inducing kinase is essential for the developmental programming of skin-resident and IL-17-producing γδ T cells
eLife 4:e10087.
https://doi.org/10.7554/eLife.10087


