Molecular feature-based classification of retroperitoneal liposarcoma: a prospective cohort study
- Department of Retroperitoneal Tumor Surgery, Peking University People’s Hospital, China
- Department of Retroperitoneal Tumor Surgery, Peking University International Hospital, China
- Department of Gastroenterology, Beijing Friendship Hospital, Capital Medical University, State Key Laboratory for Digestive Health, National Clinical Research Center for Digestive Disease, Beijing Digestive Disease Center, Beijing Key Laboratory for Precancerous Lesion of Digestive Disease, China
- Department of Biomedical Sciences, Humanitas University, Italy
Figures
Figure 1
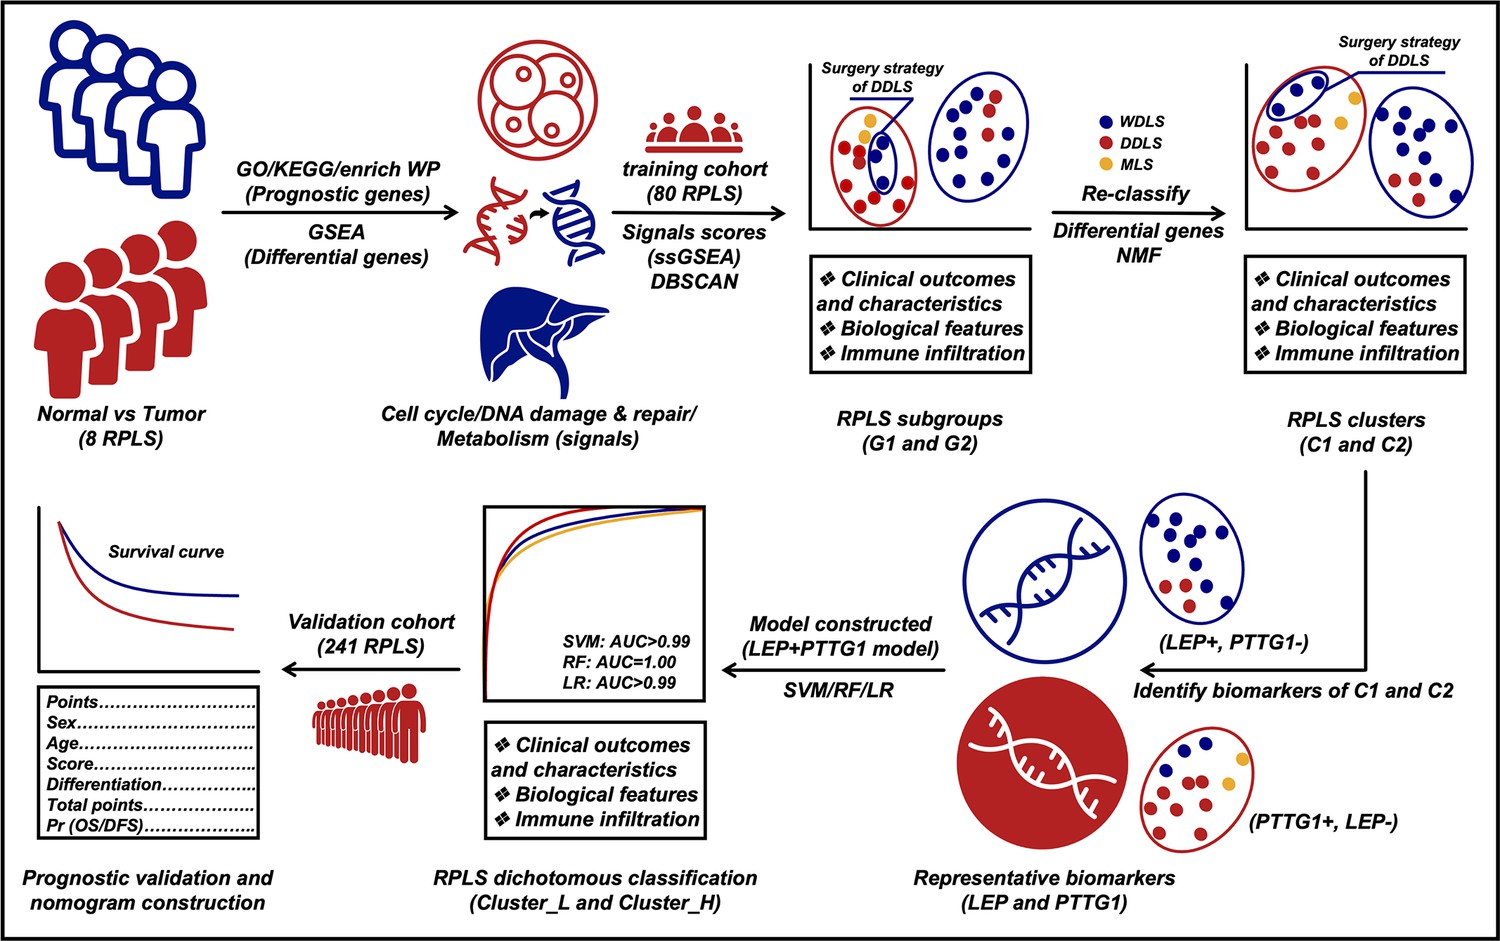
Flow diagram of exploring retroperitoneal liposarcoma (RPLS) dichotomous classification.
Figure 2
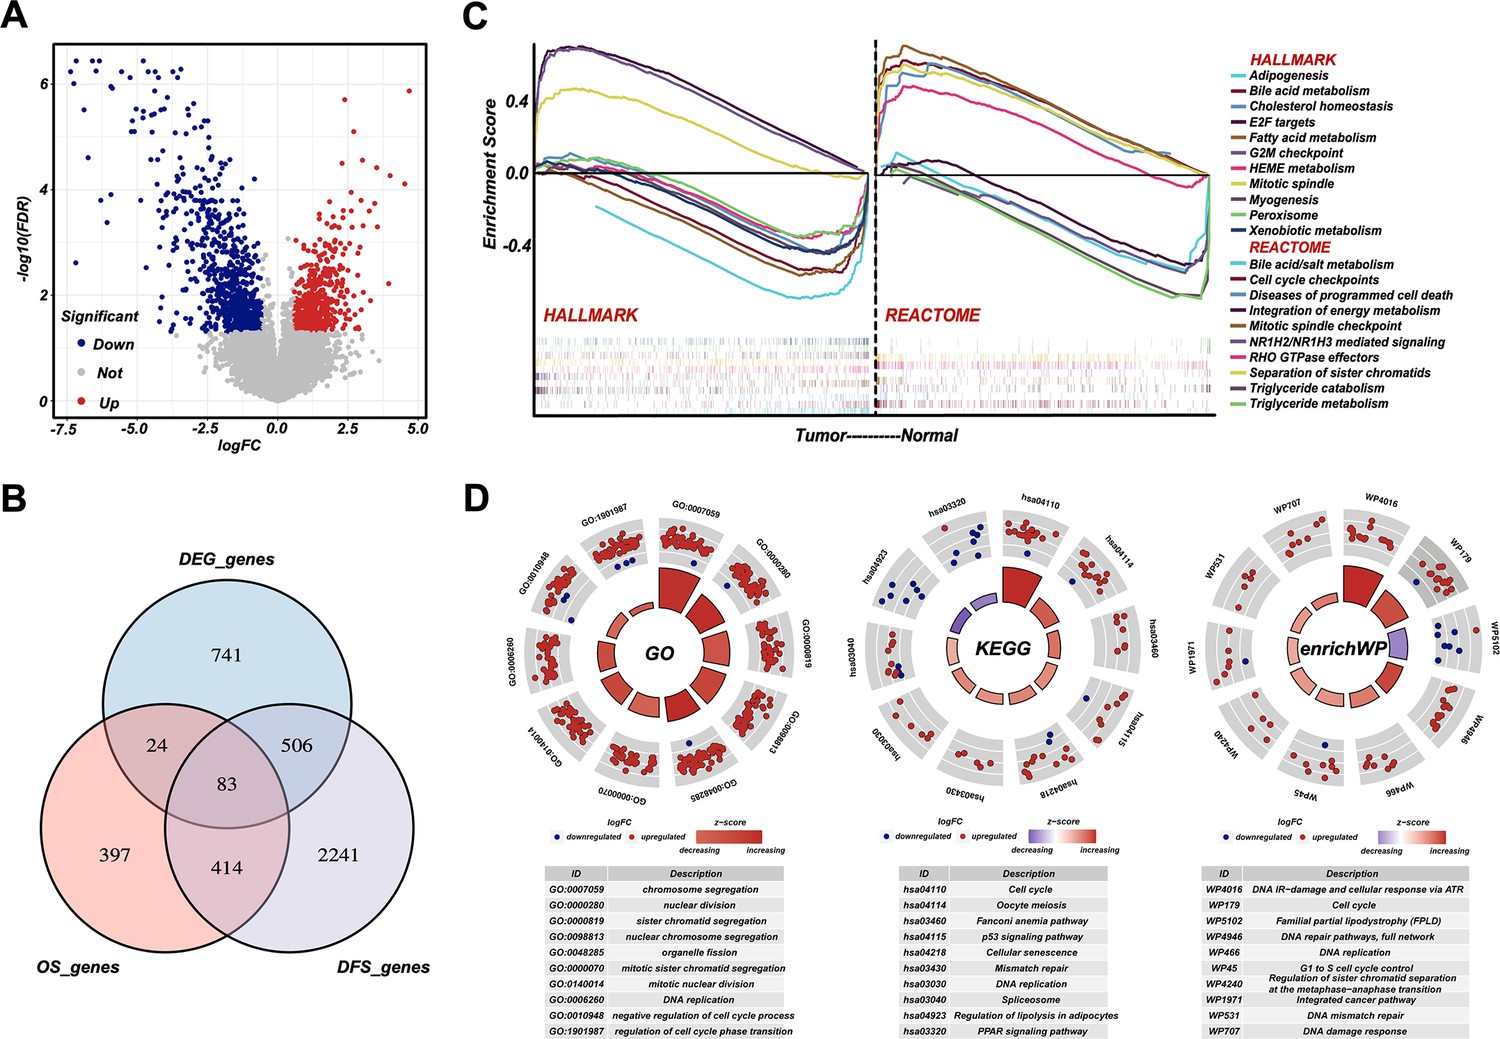
Cell cycle, DNA damage and repair, and metabolism are dysregulated in retroperitoneal liposarcoma (RPLS).
Volcano plot of the differentially expressed genes (DEGs) in eight normal vs eight RPLS tissues (A). Venn diagram showing shared genes between DEGs and prognostic genes (B). Gene set enrichment analysis (GSEA) of RPLS tumors, including HALLMARK gene sets and REACTOME gene sets (C). Circular plots of the prognostic genes in Gene Ontology (GO), Kyoto Encyclopedia of Gene and Genomes (KEGG), and enrichWP (D).
Figure 3 with 1 supplement
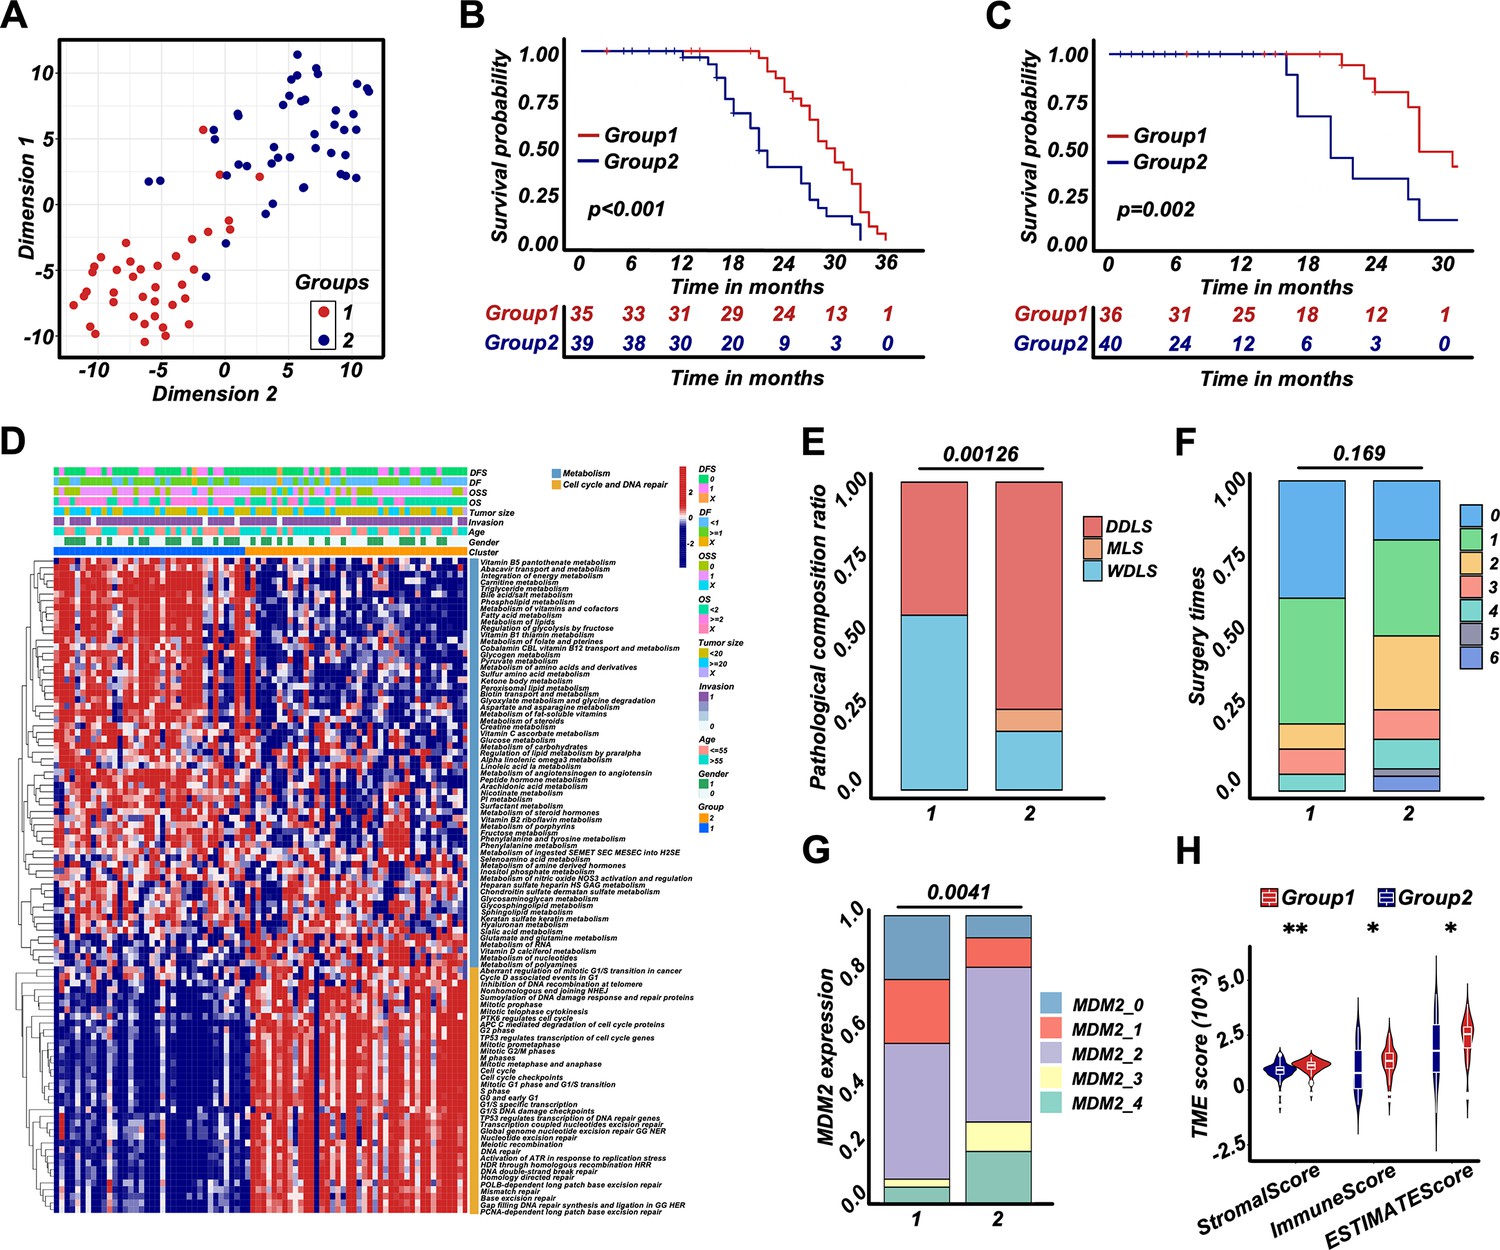
Retroperitoneal liposarcoma (RPLS) subgroups (G1 and G2) based on cell cycle, DNA damage and repair, and metabolism.
t-Distributed stochastic neighbor embedding (t-SNE) exhibited the subgroups (G1 and G2) of RPLS (A). Survival cures of overall survival (OS) (B) and disease-free survival (DFS) (C) in G1 and G2. The hierarchical clustering heatmap of dysregulated pathways in G1 and G2 (D). Histograms revealed the difference in pathological composition ratio (E), surgery times (F), and MDM2 (G) in G1 and G2. Violin plot of the microenvironmental scores in G1 and G2 (H).
Figure 3—figure supplement 1
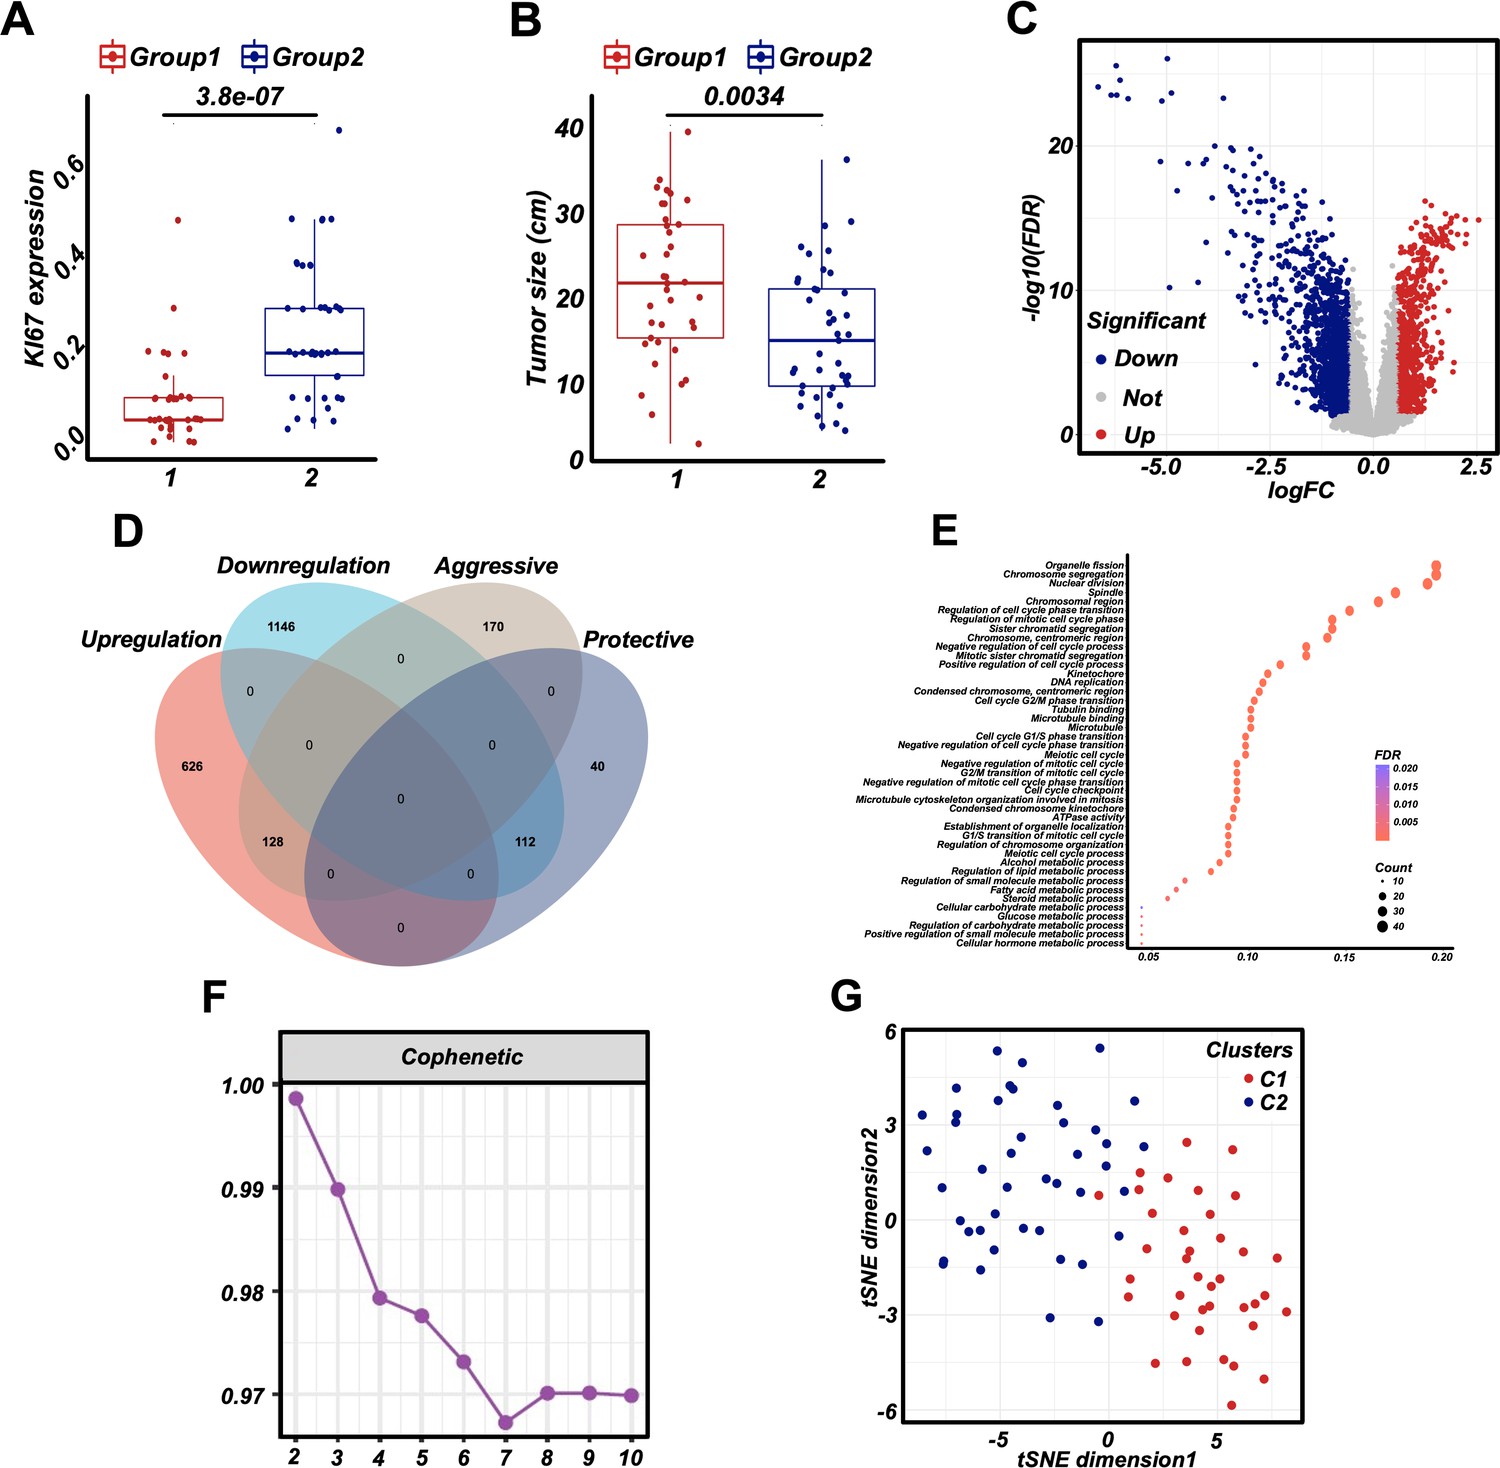
Clinical features and re-classification of retroperitoneal liposarcoma (RPLS) subgroups (G1 and G2).
The difference in Ki67 (A) and tumor size (B) in G1 and G2. Volcano plot of the differentially expressed genes (DEGs) (G1 vs G2) (C). Venn diagram showing shared genes between DEGs and prognostic genes (D). Bubble plot of the DEGs enrichment (E). Nonnegative matrix factorization (NMF) for a re-classification of training cohort 1 (F). t-Distributed stochastic neighbor embedding (t-SNE) exhibits the RPLS clusters (C1 and C2) (G).
Figure 4 with 1 supplement
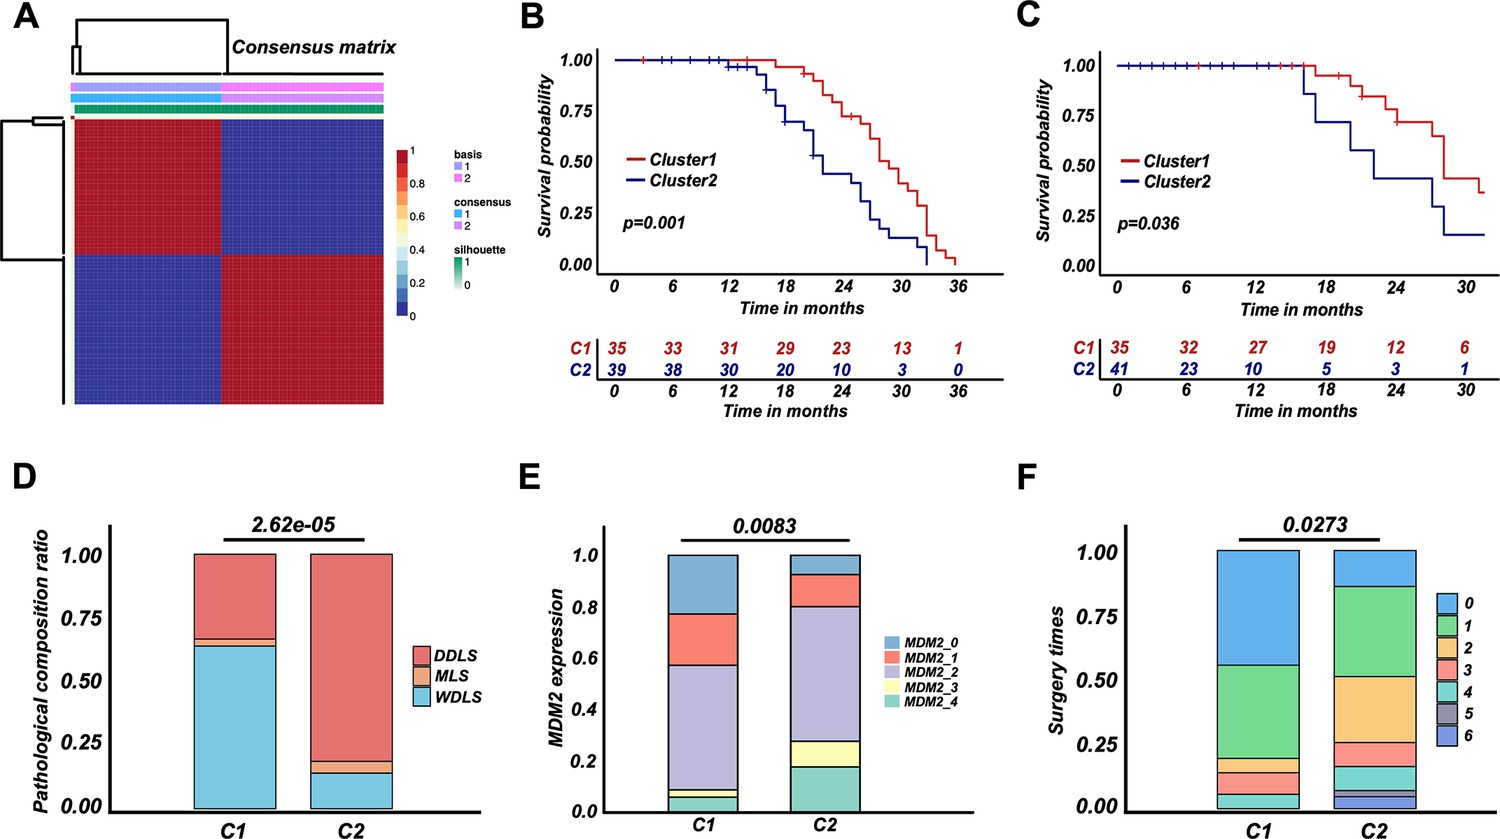
Retroperitoneal liposarcoma (RPLS) classification strategy (C1 and C2) derived from RPLS subgroups.
Nonnegative matrix factorization (NMF) for a reclassification of training cohort 1 (C1 and C2) (A). Survival cures of overall survival (OS) (B) and disease-free survival (DFS) (C) in C1 and C2. Histograms revealed the difference in pathological composition ratio (D), MDM2 (E), and surgery times (F) in C1 and C2.
Figure 4—figure supplement 1
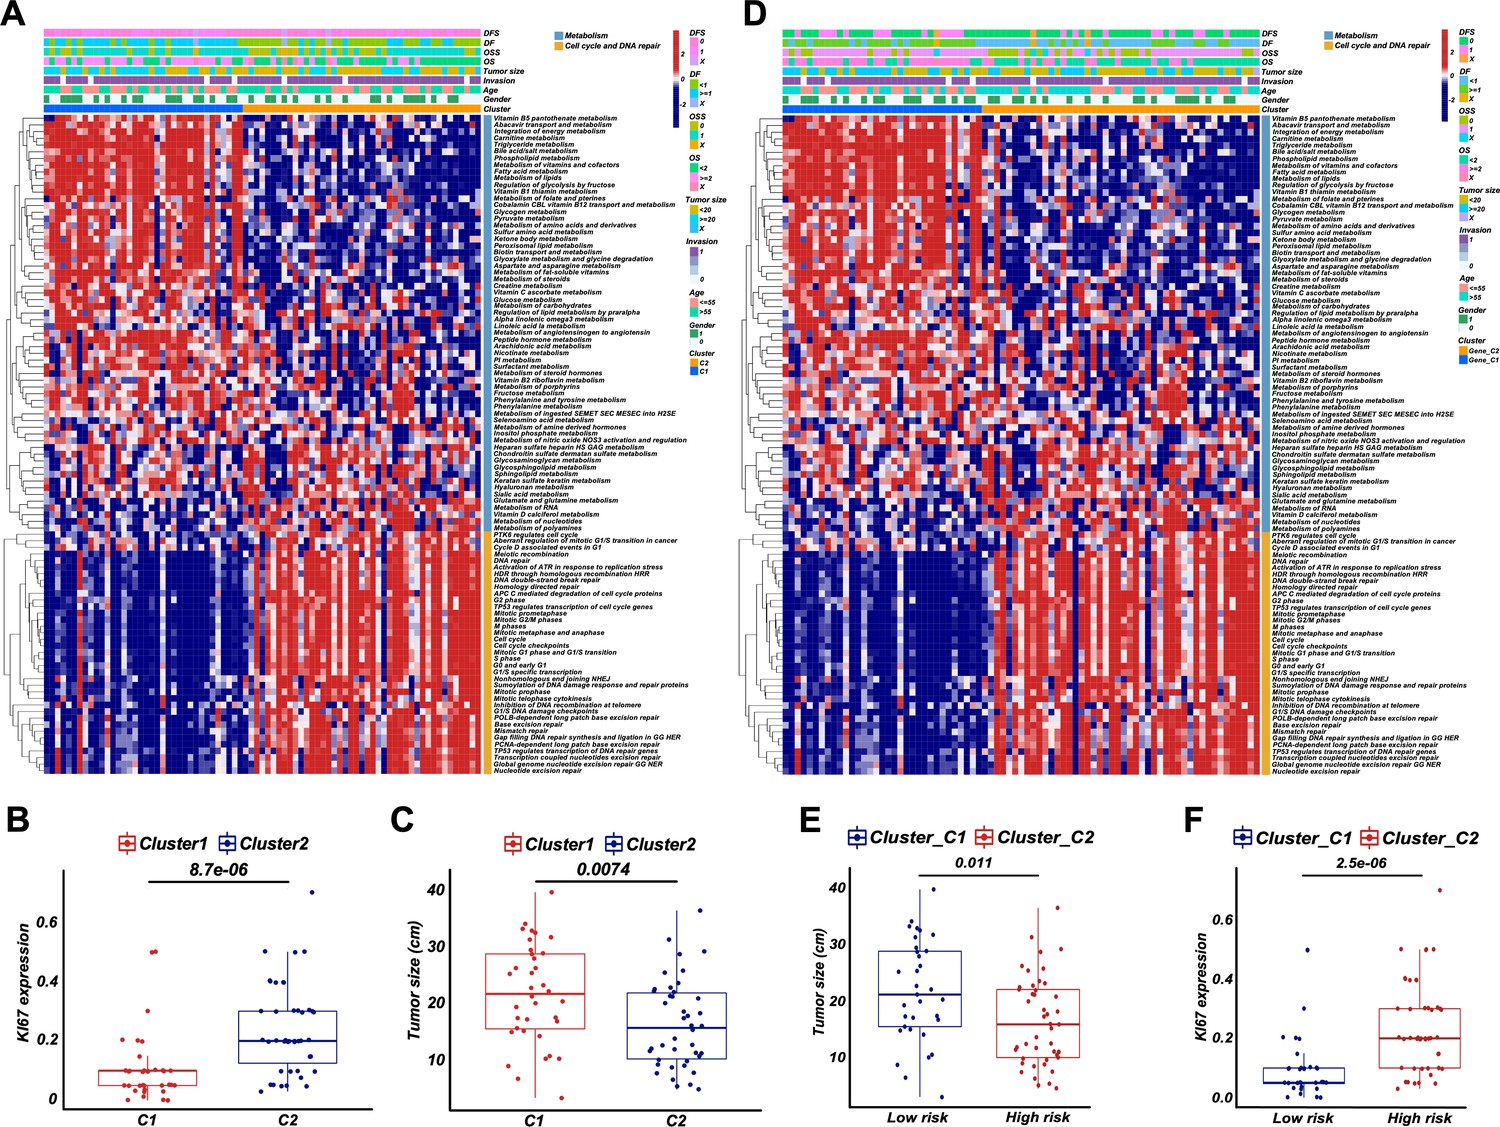
Dysregulated pathways and clinical features of retroperitoneal liposarcoma (RPLS) clusters and high-/low-risk groups.
The hierarchical clustering heatmap of dysregulated pathways in C1 and C2 (A). The difference ofin Ki67 (B) and tumor size (C) in C1 and C2. The hierarchical clustering heatmap of dysregulated pathways in high- and low-risk groups (D). The difference ofin tumor size (E) and Ki67 (F) in high- and low-risk groups.
Figure 5 with 1 supplement
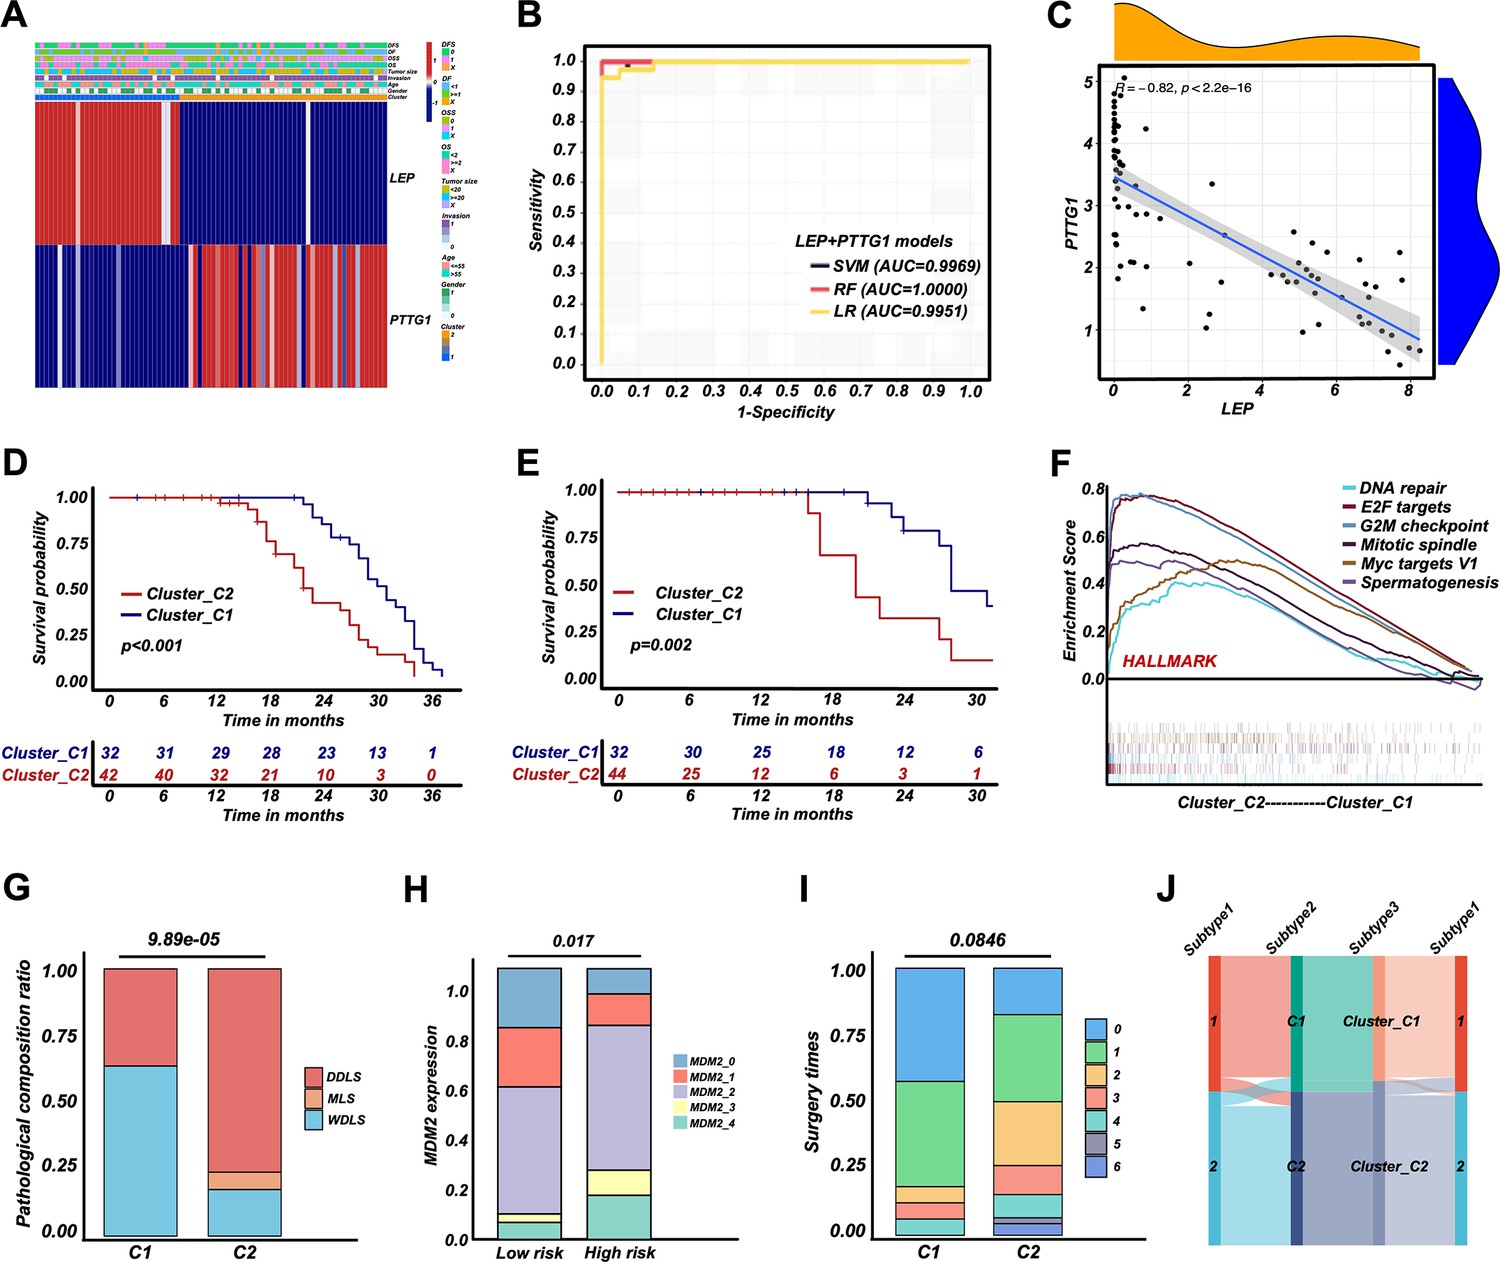
Retroperitoneal liposarcoma (RPLS) dichotomous classification (Cluster_C1 and Cluster_C2) derived from RPLS clusters.
Heatmap of biomarkers identified (LEP and PTTG1) in C1 and C2 (A). ROC curves of the machine learning models to identify C1 and C2 (B). Correlation between LEP and PTTG1 expression (C). Survival curves of overall survival (OS) (D) and disease-free survival (DFS) (E) in Cluster_C1 (low-risk) and Cluster_C2 (high-risk) groups. Gene set enrichment analysis (GSEA) of HALLMARK gene sets in Cluster_C1 and Cluster_C2 (F). Histograms revealed the difference in pathological composition ratio (G), MDM2 level (H), and surgery times (I) in Cluster_C1 and Cluster_C2. Sankey diagram indicated the correlation among G1/G2, C1/C2, and Cluster_C1/C2 (J).
Figure 5—figure supplement 1
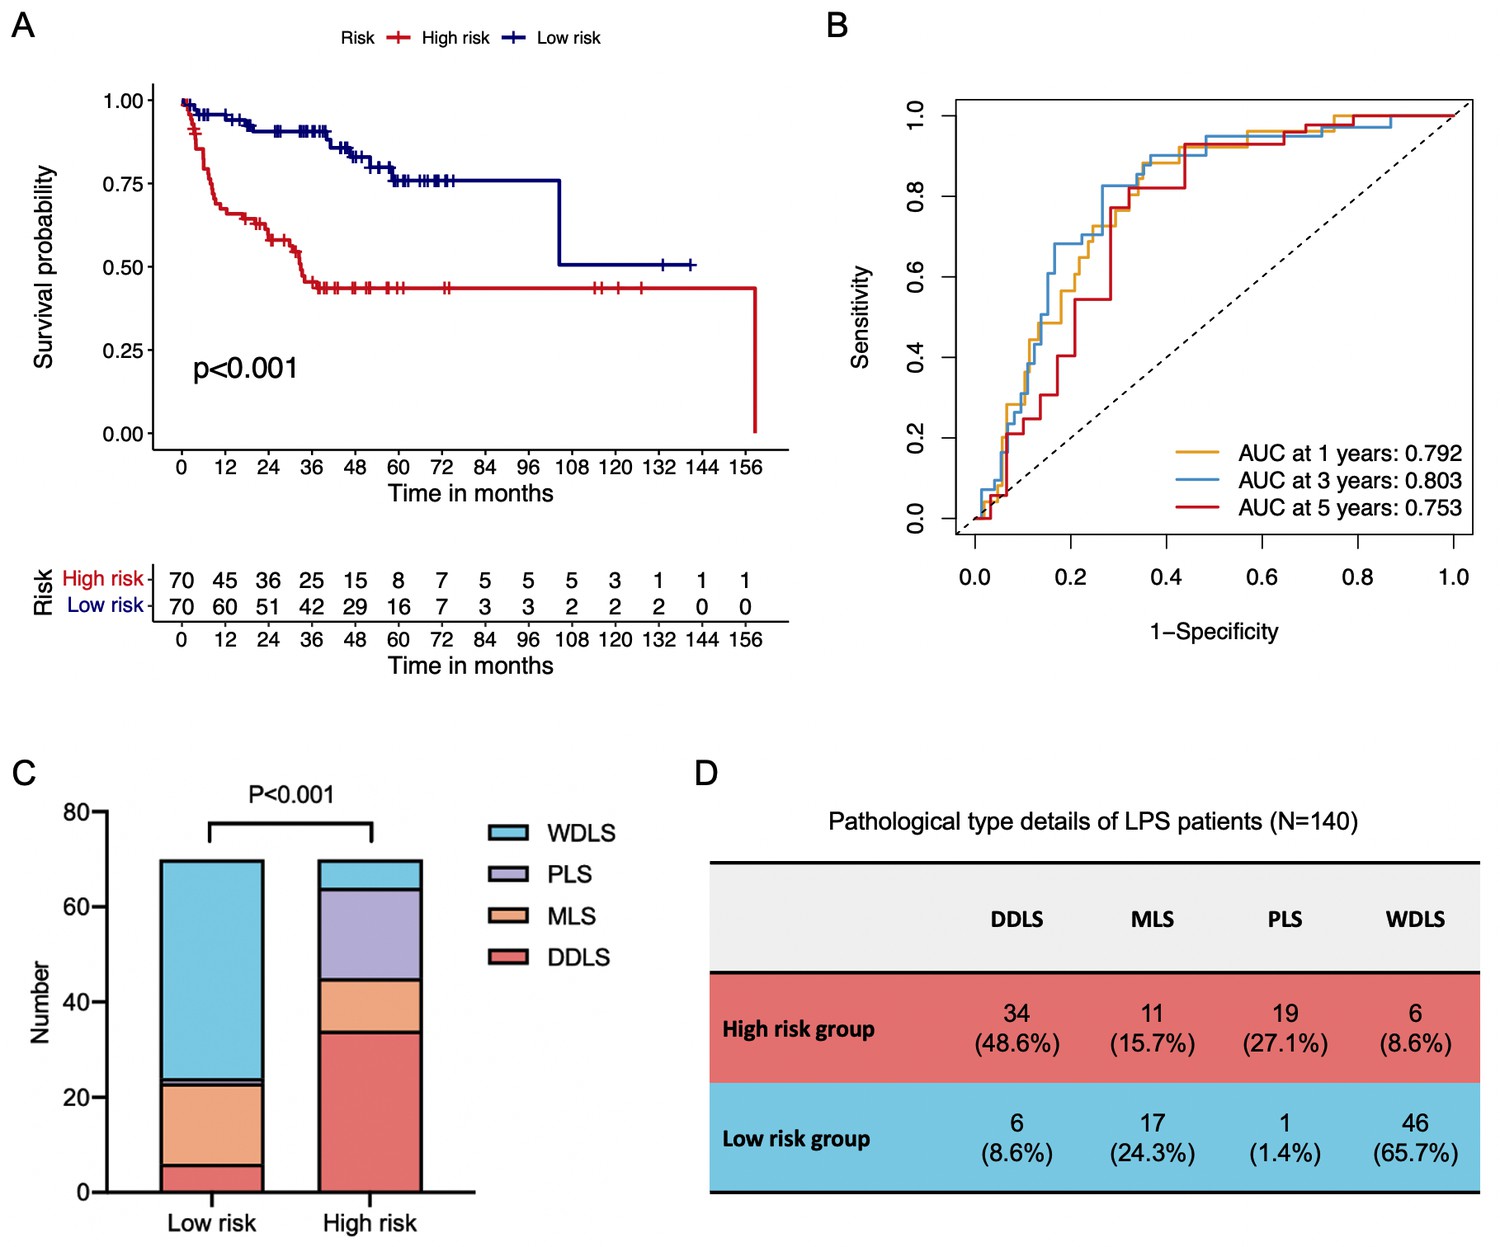
Validation of LEP+PTTG1 model in an external liposarcoma cohort.
Survival curve of distant recurrence-free survival (DRFS) in low-risk and high-risk groups (A). ROC curves of 1-, 3-, and 5-year DRFS in validation cohort (B). Histograms revealed the difference in pathological composition ratio in low-risk and high-risk groups (C). Pathological-type details of LPS ppatients (D).
Figure 6
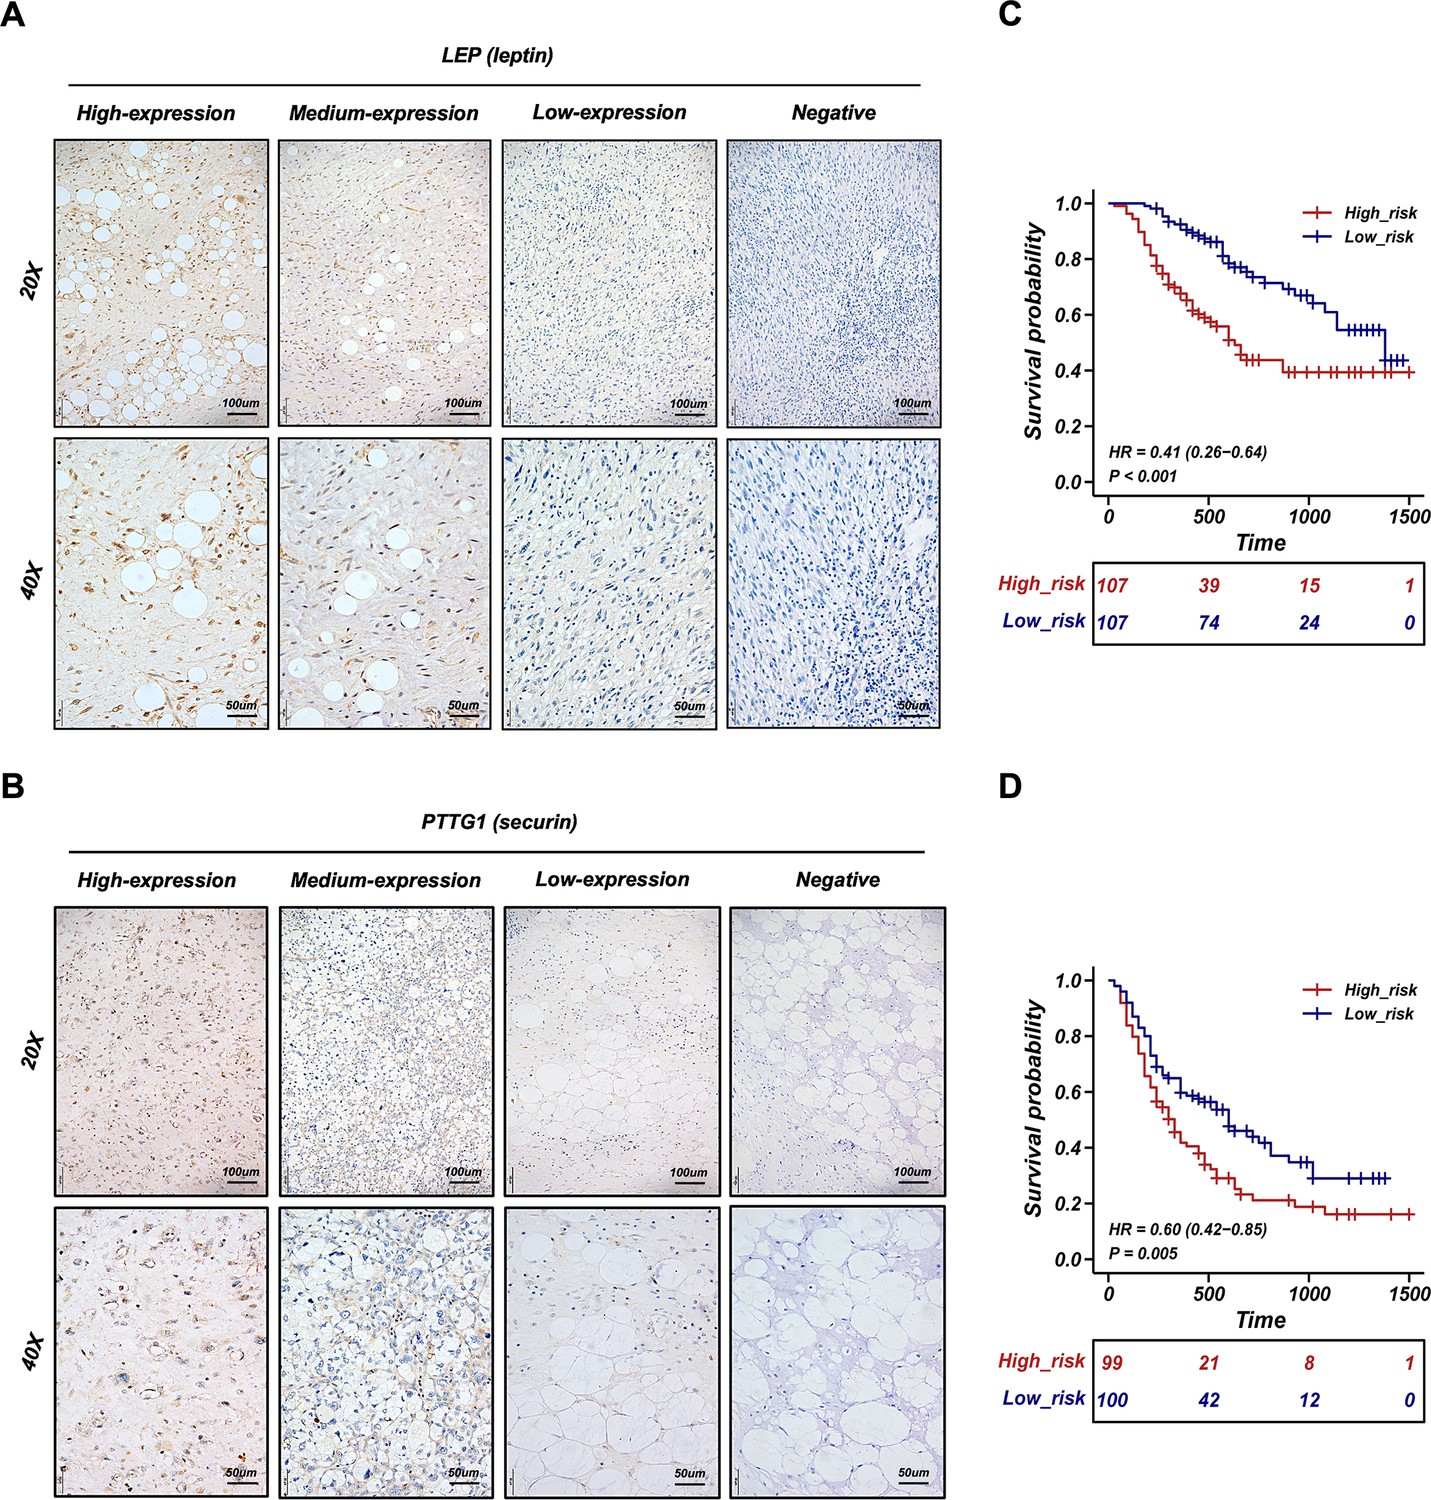
Validation of the retroperitoneal liposarcoma (RPLS) dichotomous classification in another 241 RPLS cohort.
Representative immunohistochemistry (IHC) staining images of LEP (A) and PTTG1 (B). Survival curves of overall survival (OS) (C) and disease-free survival (DFS) (D) in high-risk and low-risk groups.
Figure 7 with 1 supplement
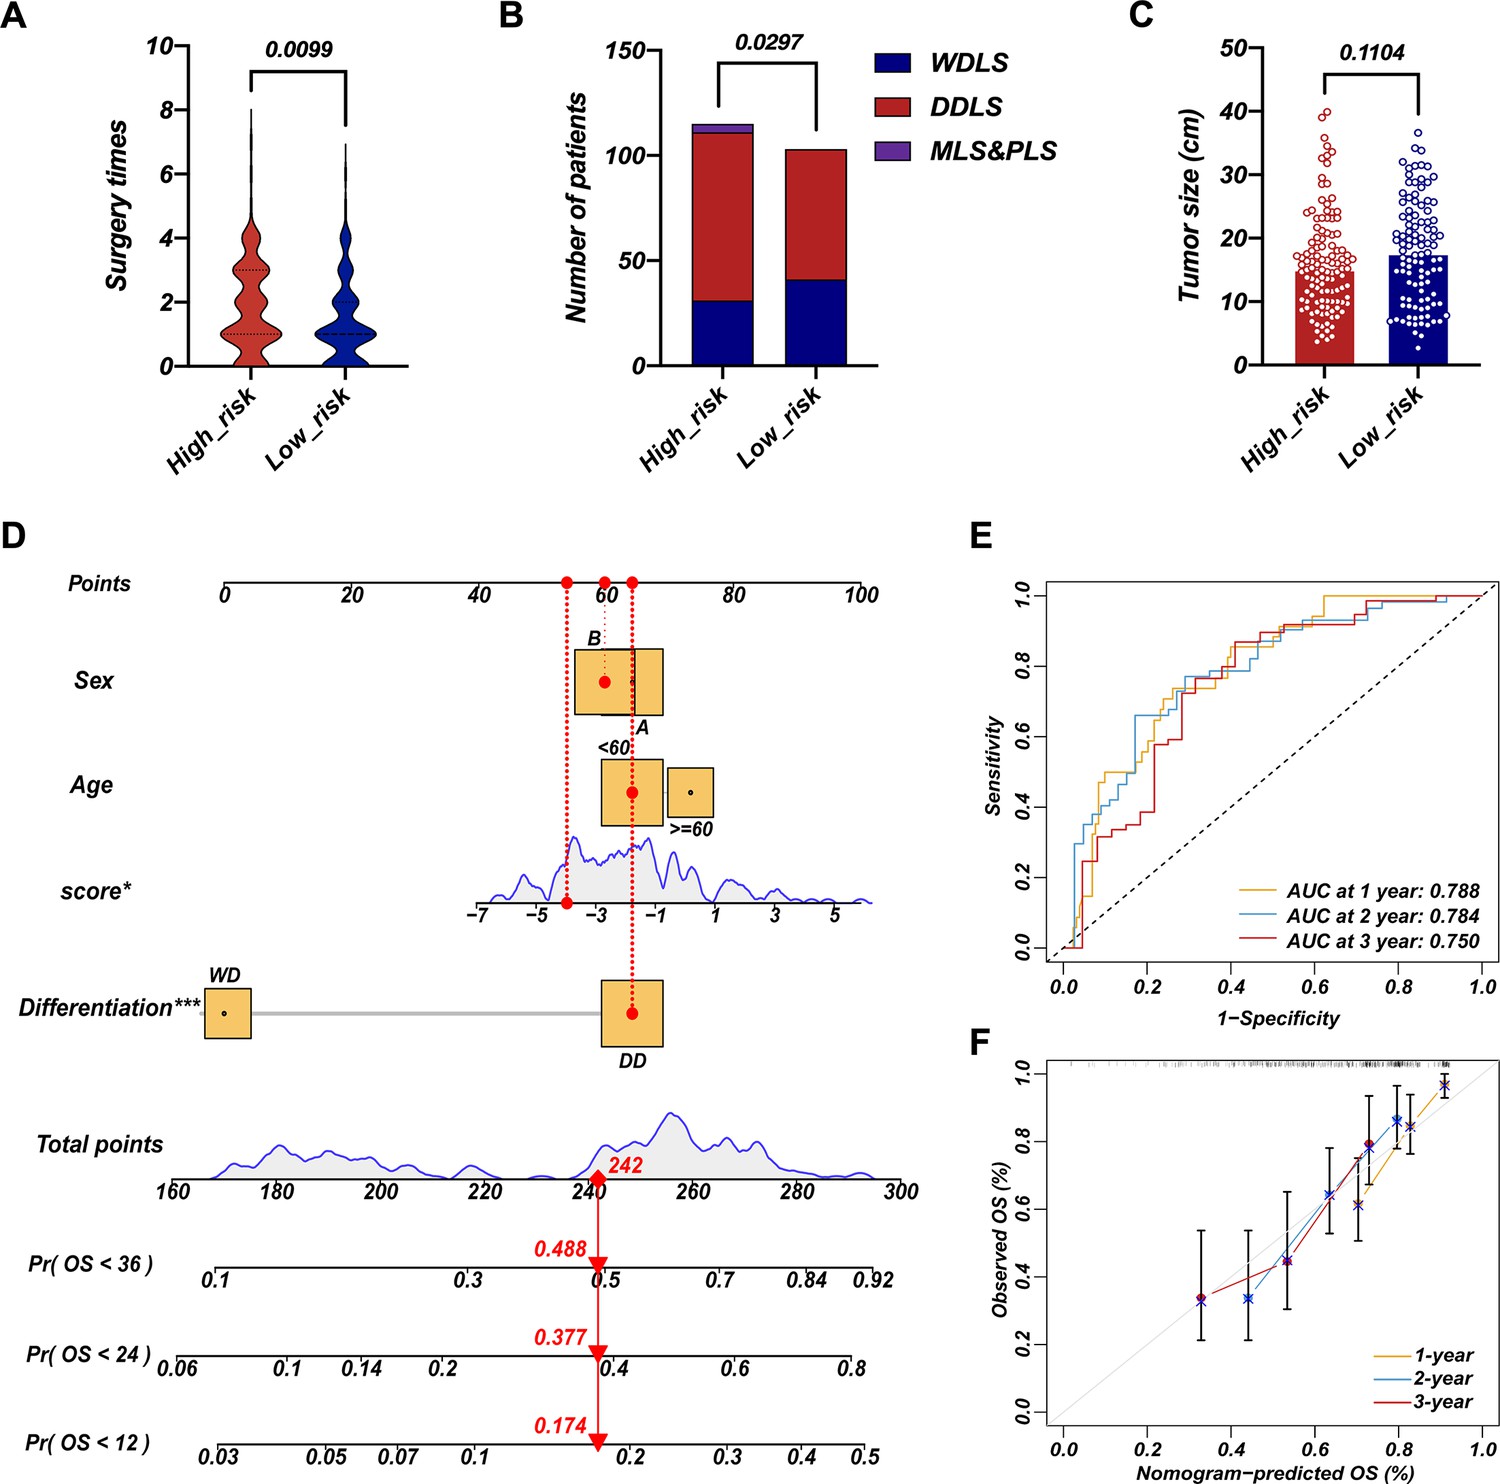
Survival nomogram of LEP+PTTG1 model in validation cohort.
The difference in surgery times (A), pathological composition (B), and surgery times (C) in high-risk and low-risk groups. Nomograms for overall survival (OS) were developed in REASR cohort with four factors: sex, age, risk score, and differentiation (D). ROC curves of 1-, 2-, and 3-year OS in validation cohort (E). Calibration curves of predicting 1-, 2-, and 3-year OS in validation cohort (F).
Figure 7—figure supplement 1
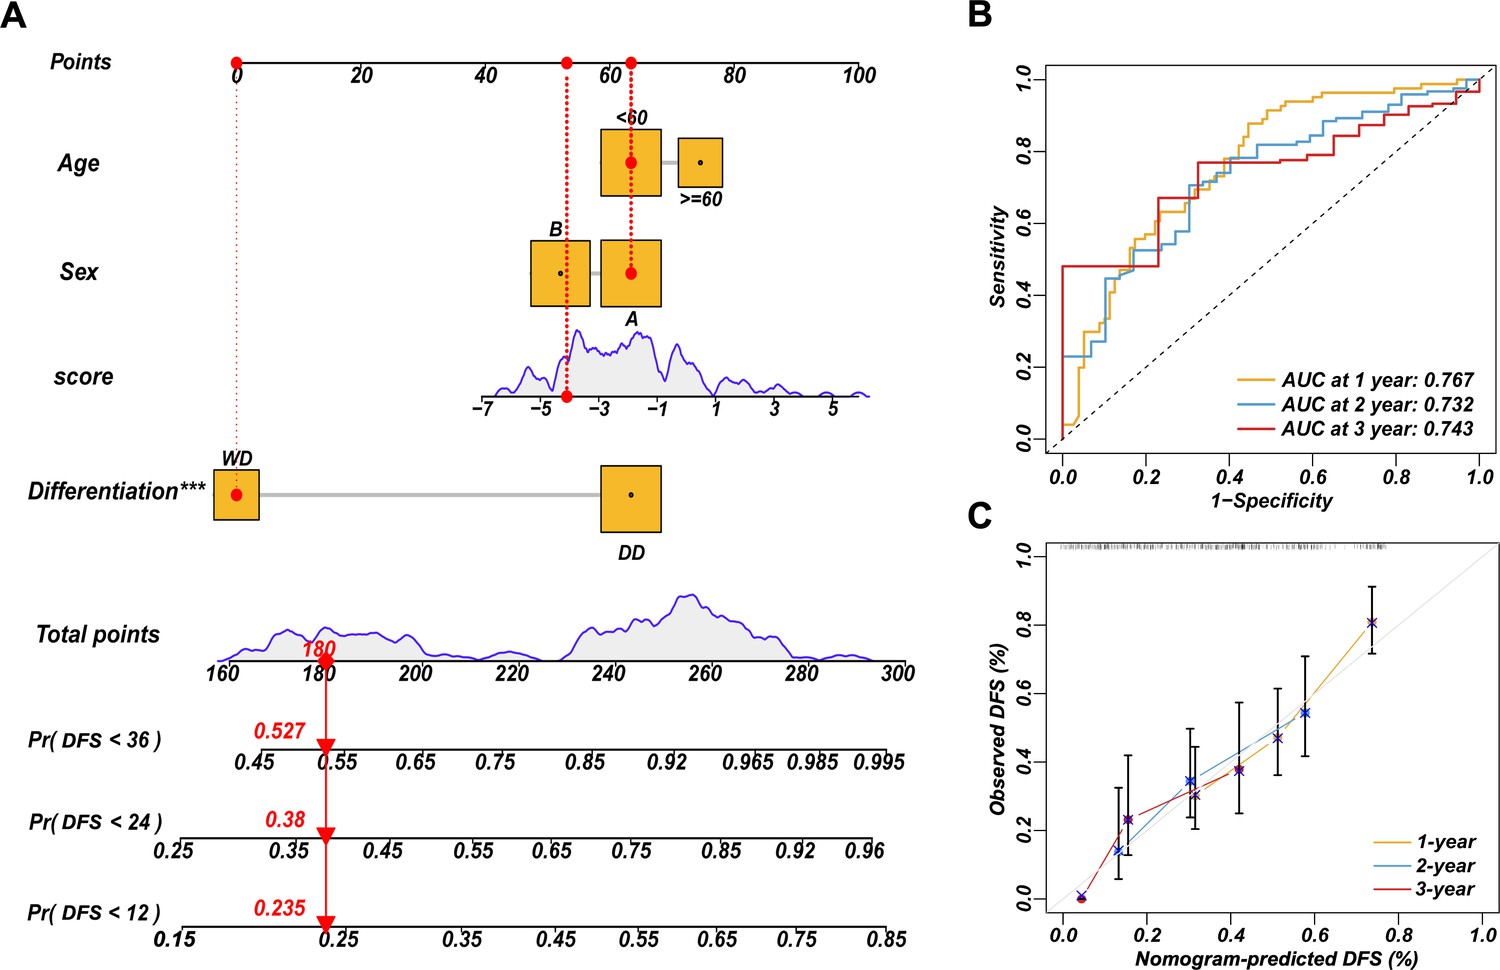
Survival nomogram of LEP+PTTG1 model in validation cohort.
Nomograms for disease-free survival (DFS) were developed in REASR cohort with four factors: sex, age, risk score, and differentiation (A). ROC curves of 1-, 2-, and 3-year DFS in validation cohort (B). Calibration curves of predicting 1-, 2-, and 3-year DFS (C).
Tables
Table 1
Baseline characteristics of training cohort and validation cohort.
| Training cohort (N=80)* | Validation cohort (N=241) | p-Value | |
|---|---|---|---|
| Age (years) | 56.34 (11.14)† | 55.11 (10.80) † | 0.384 |
| Sex | |||
| Male | 37 (46.25) | 118 (48.96) | 0.674 |
| Female | 43 (53.75) | 123 (51.04) | |
| Pathology | |||
| WDLS | 29 (36.25) | 75 (31.12) | 0.078 |
| DDLS | 48 (60.00) | 144 (59.75) | |
| MLS and PLS | 3 (3.75) | 5 (2.07) | |
| NR | 0 (0) | 17 (7.06) | |
| Surgery times ‡ | |||
| 0–1 | 50 (62.50) | 143 (59.34) | 0.834 |
| 2–3 | 21 (26.25) | 73 (30.29) | |
| 4–7 | 9 (11.25) | 24 (9.96) | |
| NR | 0 (0) | 1 (0.41) | |
| Tumor size | |||
| All | 18.65 (8.70)† | 16.90 (7.94)† | 0.101 |
| <18 cm | 40 (50.00) | 135 (56.02) | 0.095 |
| >18 cm | 39 (48.75) | 92 (38.17) | |
| NR | 1 (1.25) | 14 (5.81) | |
| Multilocation | |||
| Yes | 52 (65.00) | 153 (63.49) | 0.081 |
| No | 28 (35.00) | 74 (30.71) | |
| NR | 0 (0) | 14 (5.80) | |
| MDM2 score | |||
| 0 | 11 (13.75) | NA | NA |
| 1 | 12 (15.00) | NA | |
| 2 | 39 (48.75) | NA | |
| 3 | 5 (6.25) | NA | |
| 4 | 9 (11.25) | NA | |
| NR | 4 (5.00) | NA | |
| LEP score | NA | 1.62 (0.82)† | NA |
| LEP strength | |||
| 0 | NA | 10 (4.15) | NA |
| 1 | NA | 39 (16.18) | |
| 2 | NA | 74 (30.71) | |
| 3 | NA | 115 (47.72) | |
| NR | NA | 3 (1.24) | |
| PTTG1 score | NA | 0.83 (0.75)† | NA |
| PTTG1 strength | |||
| 0 | NA | 38 (15.77) | NA |
| 1 | NA | 100 (41.49) | |
| 2 | NA | 61 (25.31) | |
| 3 | NA | 39 (16.18) | |
| NR | NA | 3 (1.25) | |
-
*
Clinical information missing in eight retroperitoneal liposarcoma (RPLS) patients (training cohort 2).
-
†
The data is shown as mean (SD); other data is shown as number (%).
-
‡
The definition of surgical times is the sum of current admission surgery and previous surgical resection DDLS, dedifferentiated liposarcoma; LEP, leptin; MDM2, mouse double minute 2; MLS, myxoid liposarcoma; NA, not applicable; NR, not reported; PLS, pleomorphic liposarcoma; PTTG1, pituitary tumor transforming gene 1; WDLS, well-differentiated liposarcoma.
Additional files
-
Supplementary file 1
The detailed clinicopathological characteristics of the training cohort 1.
- https://cdn.elifesciences.org/articles/100887/elife-100887-supp1-v1.xlsx
-
Supplementary file 2
The RNA-seq data of the training cohort 2.
- https://cdn.elifesciences.org/articles/100887/elife-100887-supp2-v1.xlsx
-
Supplementary file 3
The detailed clinicopathological characteristics of the validation cohort.
- https://cdn.elifesciences.org/articles/100887/elife-100887-supp3-v1.xlsx
-
Supplementary file 4
The RNA-seq data of the training cohort 1.
- https://cdn.elifesciences.org/articles/100887/elife-100887-supp4-v1.xlsx
-
MDAR checklist
- https://cdn.elifesciences.org/articles/100887/elife-100887-mdarchecklist1-v1.docx
Download links
A two-part list of links to download the article, or parts of the article, in various formats.
Downloads (link to download the article as PDF)
Open citations (links to open the citations from this article in various online reference manager services)
Cite this article (links to download the citations from this article in formats compatible with various reference manager tools)
Molecular feature-based classification of retroperitoneal liposarcoma: a prospective cohort study
eLife 14:RP100887.
https://doi.org/10.7554/eLife.100887.3


