A SMARTTR workflow for multi-ensemble atlas mapping and brain-wide network analysis
- Medical Scientist Training Program (MSTP), Columbia University Irving Medical Center (CUIMC), United States
- Neurobiology and Behavior (NB&B) Graduate Program, Columbia University, United States
- Columbia College, United States
- Adult Neurology Residency Program, Stony Brook Medicine, United States
- Tri-Institutional MD-PhD Program, Weill Cornell Medicine, United States
- Life and Health Sciences Research Institute (ICVS), School of Medicine, University of Minho, Portugal
- Department of Psychiatry, Columbia University Irving Medical Center (CUIMC), United States
- European Laboratory for Non-linear Spectroscopy (LENS), University of Florence, Italy
- Division of Systems Neuroscience, Research Foundation for Mental Hygiene, Inc (RFMH)/New York State Psychiatric Institute (NYSPI), United States
Figures
Figure 1
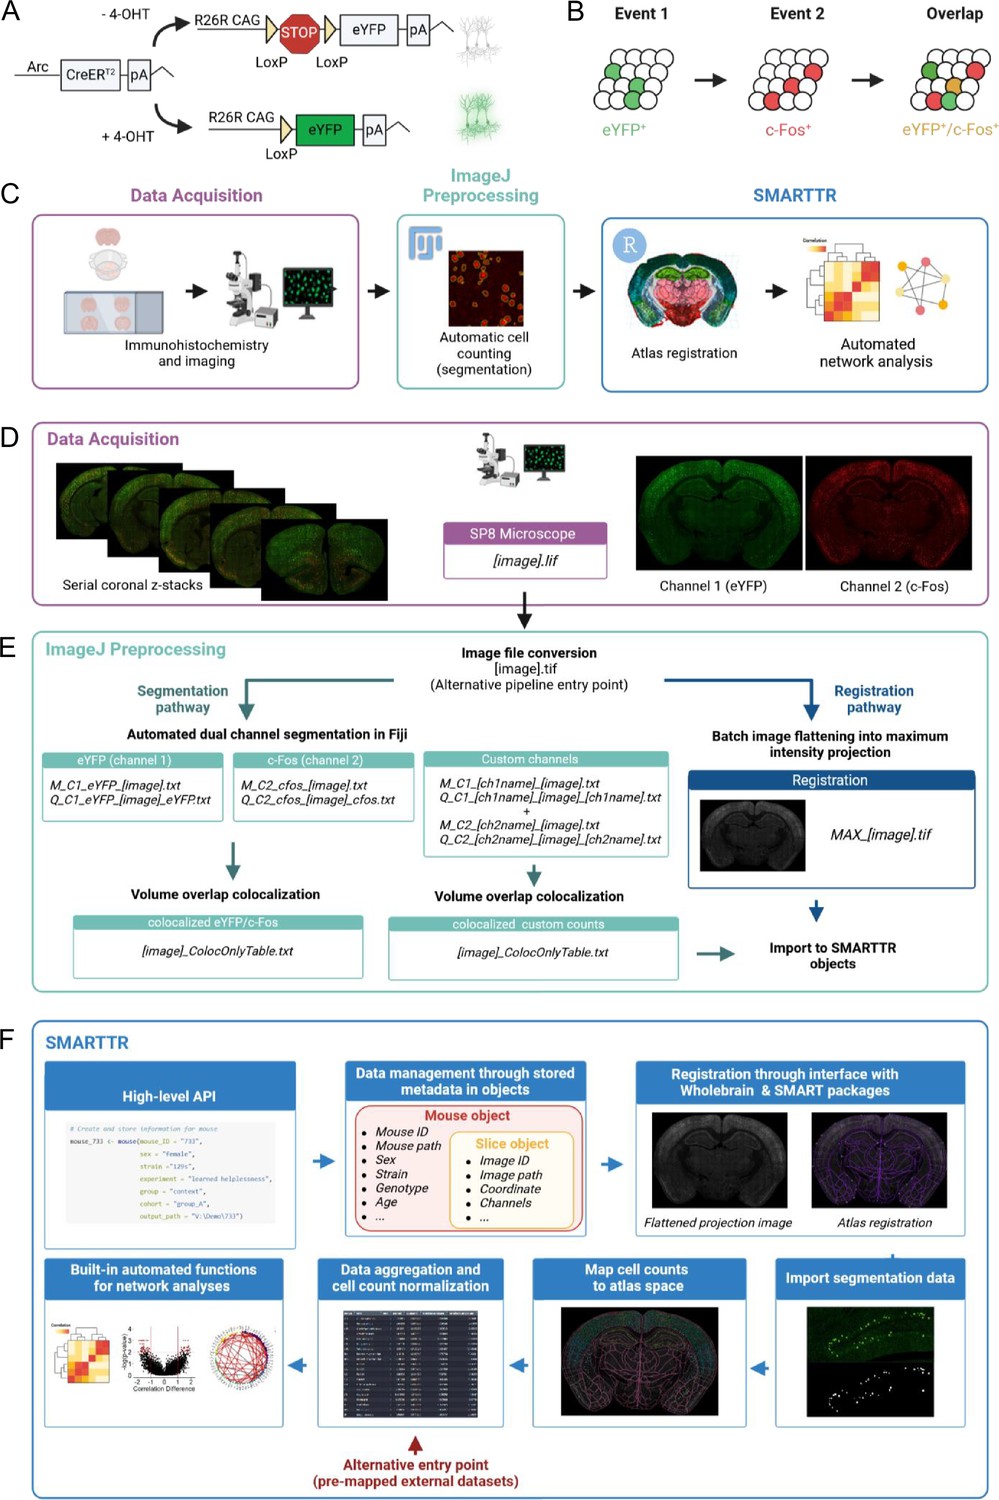
Pipeline schematic.
(A) The ArcCreERT2 × eYFP tagging strategy allows for labeling of Arc-expressing cells with eYFP following injection of 4-hydroxytamoxifen (4-OHT). (B) Indelible labeling of Arc+ ensembles with eYFP followed by immunolabeling for c-Fos+ allows for identification of a co-labeled ensemble active during two distinct time points. (C) A graphical summary of the components of the workflow. (D) eYFP+ and c-Fos+ cells are immunolabeled and imaged across brain-wide coronal sections. (E) eYFP+ and c-Fos+ populations are automatically segmented, and co-labeled cells are identified in ImageJ/Fiji. Images are automatically preprocessed and flattened for registration alignment downstream. (F) The object-oriented infrastructure of the SMARTTR package in R allows for importation of segmentation data, registration, and mapping, and statistical analysis and visualization using a user-friendly API. This figure was created with BioRender.
Figure 2 with 2 supplements
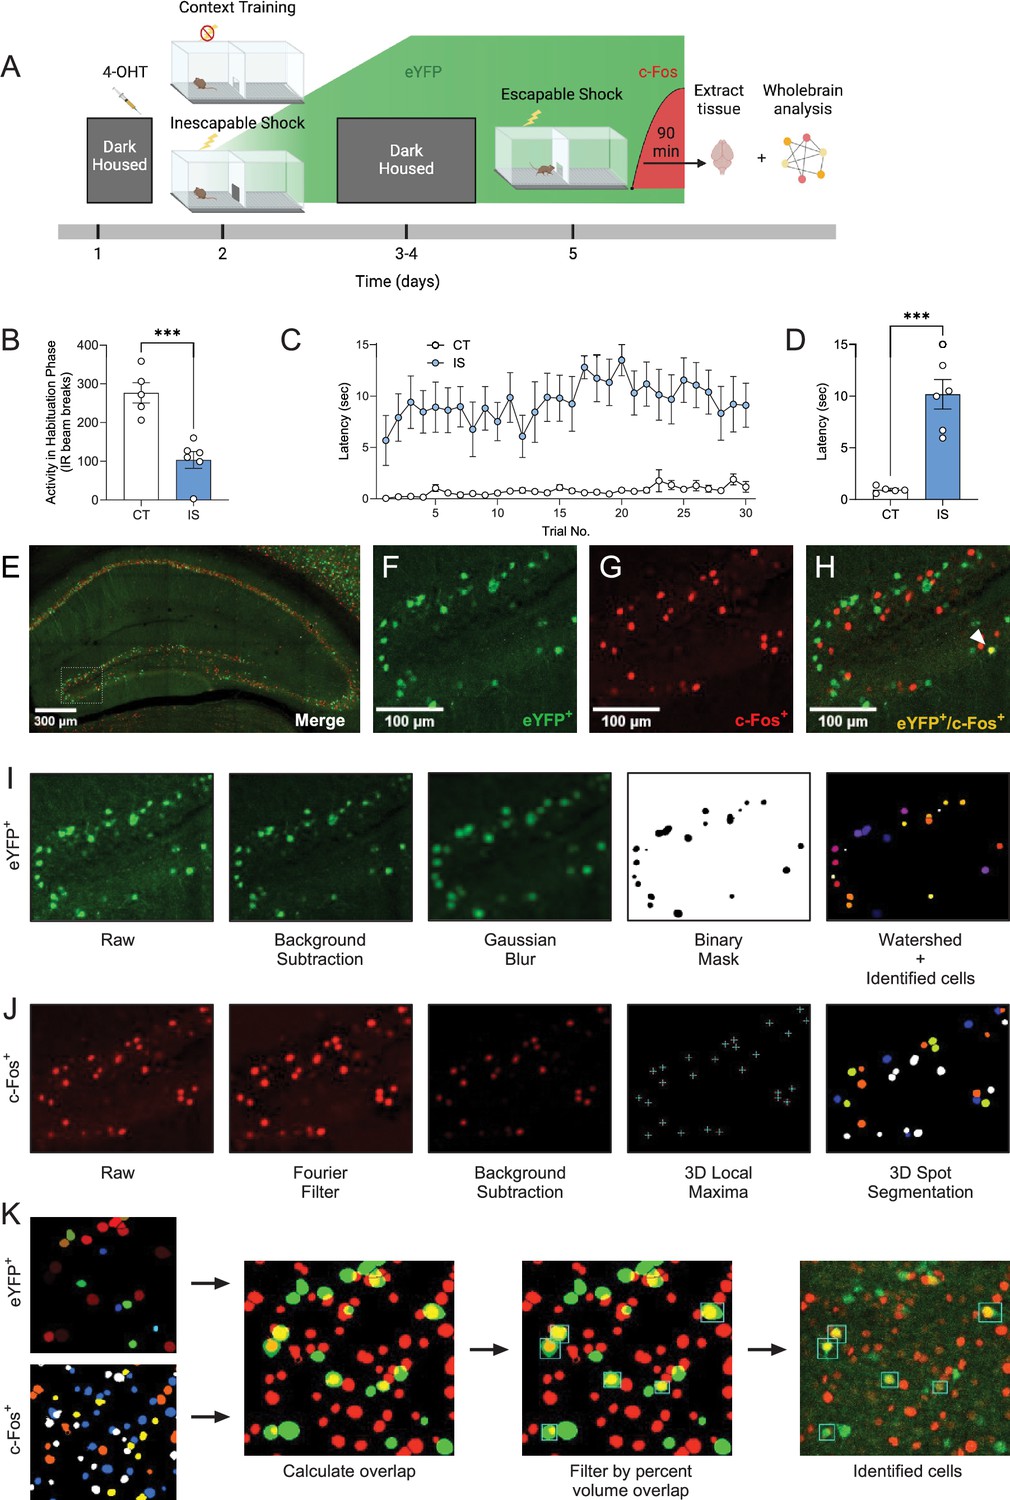
Labeling and automatic identification of ensembles active during the acquisition and expression of learned helplessness.
(A) Experimental design. This panel was created with BioRender. (B) Average habituation activity (IR beam breaks) decreases in the shock group, unpaired t-test. (C) Prior administration of inescapable shocks (IS) increases subsequent escape latency across 30 trials of shocks. (D) Average escape latency across trials 11–30 is higher in the IS group (n = 6) compared to the context training (CT) group (n = 5), unpaired t-test. (E) Representative hippocampal image showing eYFP+ cells (F) and c-Fos+ cells (G), and their overlap (H) in the dDG. (I) The consecutive image processing steps optimized for auto-segmentation of eYFP+ cells. (J) The consecutive image processing steps optimized for auto-segmentation of c-Fos+ cells. (K) Using the 3D MultiColoc plugin, all possible overlaps are calculated between the segmented eYFP+ and c-Fos+ objects in ImageJ (middle left). Results are exported and later thresholded by percent volume overlap relative to segmented c-Fos+ object (middle right) to identify co-labeled cells (left). ***p < 0.001. Error bars represent ± SEM.
-
Figure 2—source data 1
Escape latency and beam breaks.
- https://cdn.elifesciences.org/articles/101327/elife-101327-fig2-data1-v1.xlsx
Figure 2—figure supplement 1
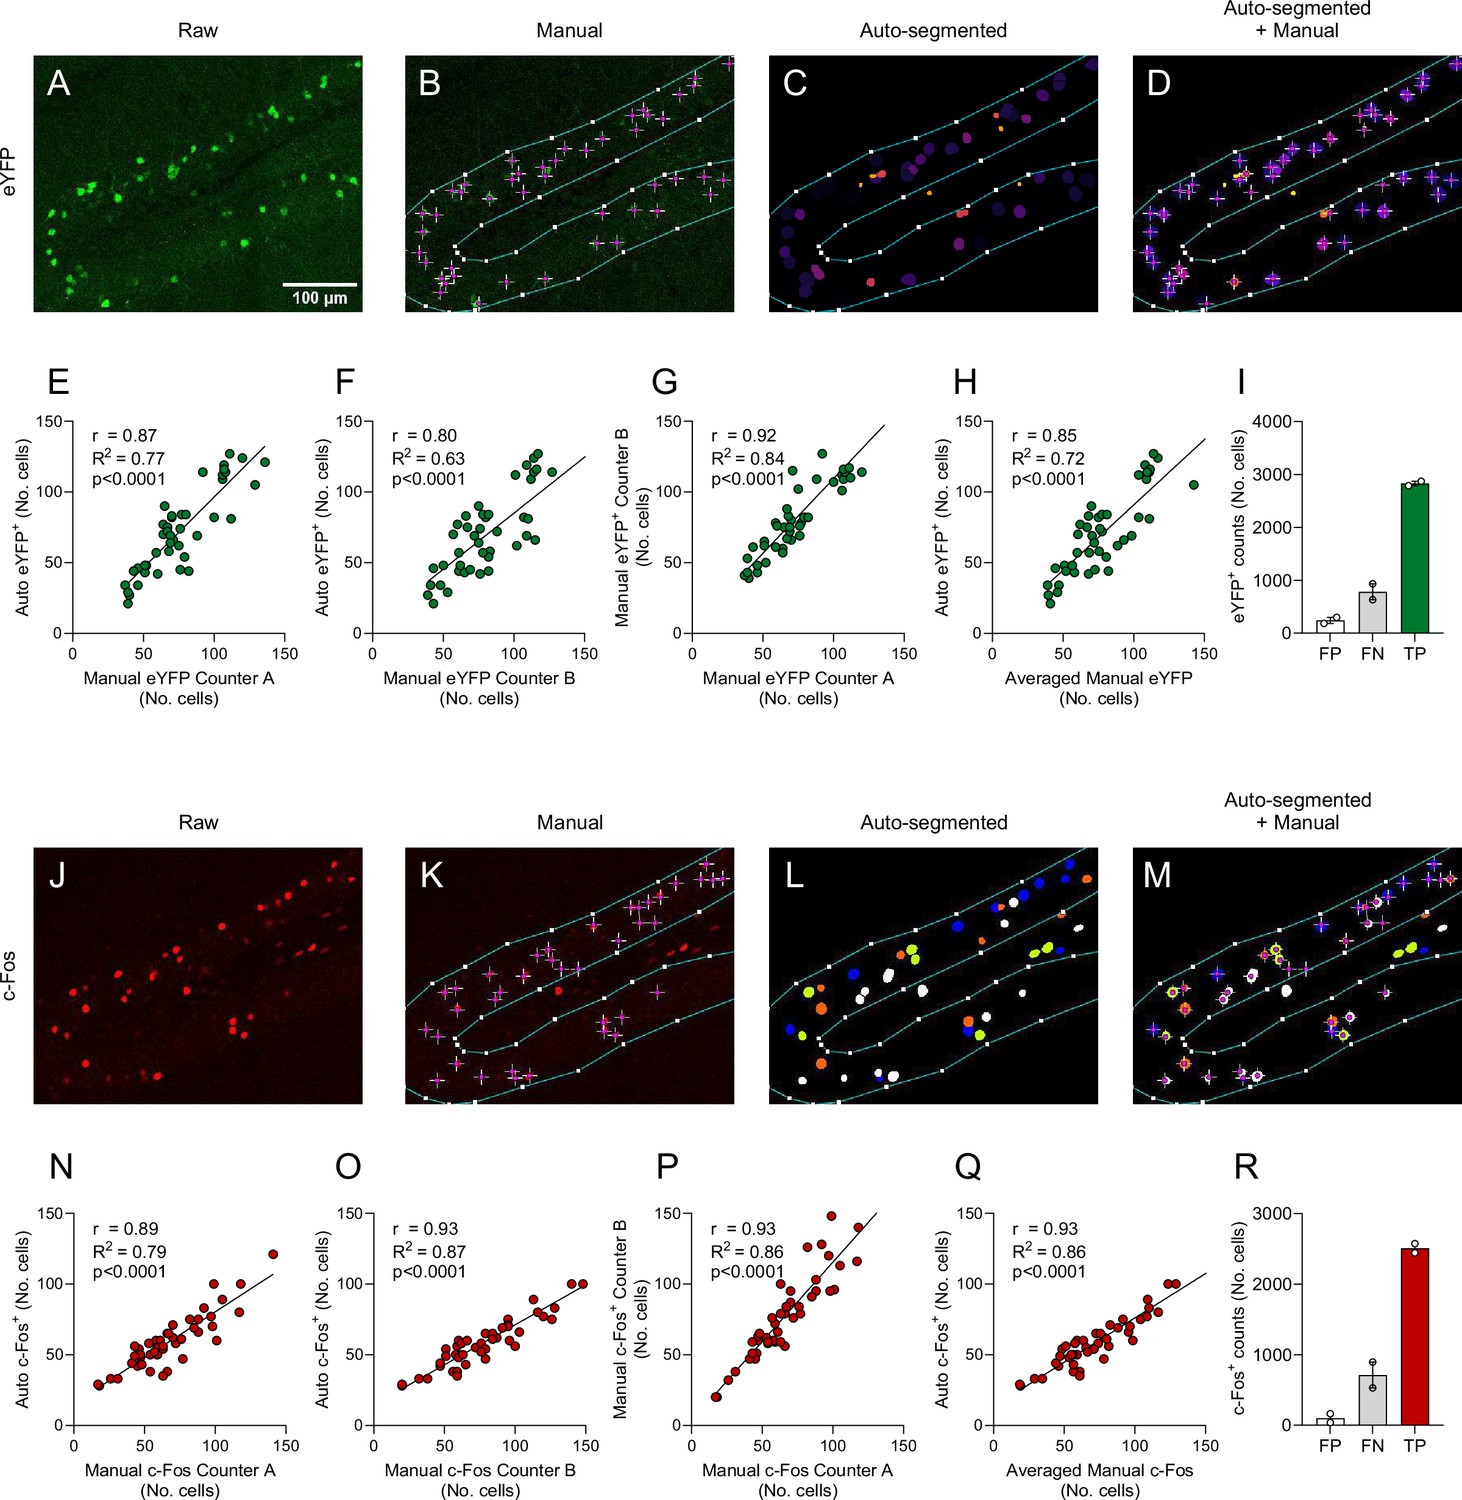
Automated segmentation yields comparable results to manual cell counting.
(A) A representative image of the raw eYFP immunolabeled signal (channel 1) in the dentate gyrus (DG). (B) An ROI was drawn around the granule cell layer of the DG, and eYFP+ cells within the boundaries of the ROI were manually counted. (C) Detected 3D objects representing eYFP+ cells that were automatically segmented from the raw representative image. (D) Qualitative overlay of the manual eYFP+ cell counts and the auto-segmented objects. (E) A high correlation (R = 0.87) was found between manual eYFP+ cell counts by Counter A and the number of auto-segmented objects. Each dot represents one ROI counted. (F) A high correlation (R = 0.80) was found between manual eYFP+ cell counts by Counter B and the number of auto-segmented objects. (G) There was high inter-rater correlation (R = 0.92) between manual eYFP+ cell counts. (H) Averaged manual eYFP+ cell counts showed overall high correlation (R = 0.85) with auto-segmented counts. (I) Counts of all false positive (FP), false negative (FN), and true positive (TP) cell counts when comparing auto-segmented eYFP+ counts and manual counts. (J) Representative image of the raw c-Fos immunolabeling signal (channel 2) in the DG. (K) Manual c-Fos+ cell counts within the drawn ROI. (L) Automatically segmented 3D objects representing c-Fos+ cells. (M) Overlay of manual and auto-segmented c-Fos+ counts. (N) A high correlation (R = 0.89) was found between manual c-Fos+ cell counts by Counter A and the number of auto-segmented objects. Each dot represents one ROI counted. (O) A high correlation (R = 0.93) was found between manual c-Fos+ cell counts by Counter B and the number of auto-segmented objects. (P) There was high inter-rater correlation (R = 0.93) between manual c-Fos+ cell counts. (Q) Averaged manual c-Fos+ cell counts showed overall high correlation (R = 0.93) with auto-segmented counts. (R) Counts of all FP, FN, and TP cell counts when comparing auto-segmented c-Fos+ counts and manual counts.
Figure 2—figure supplement 2
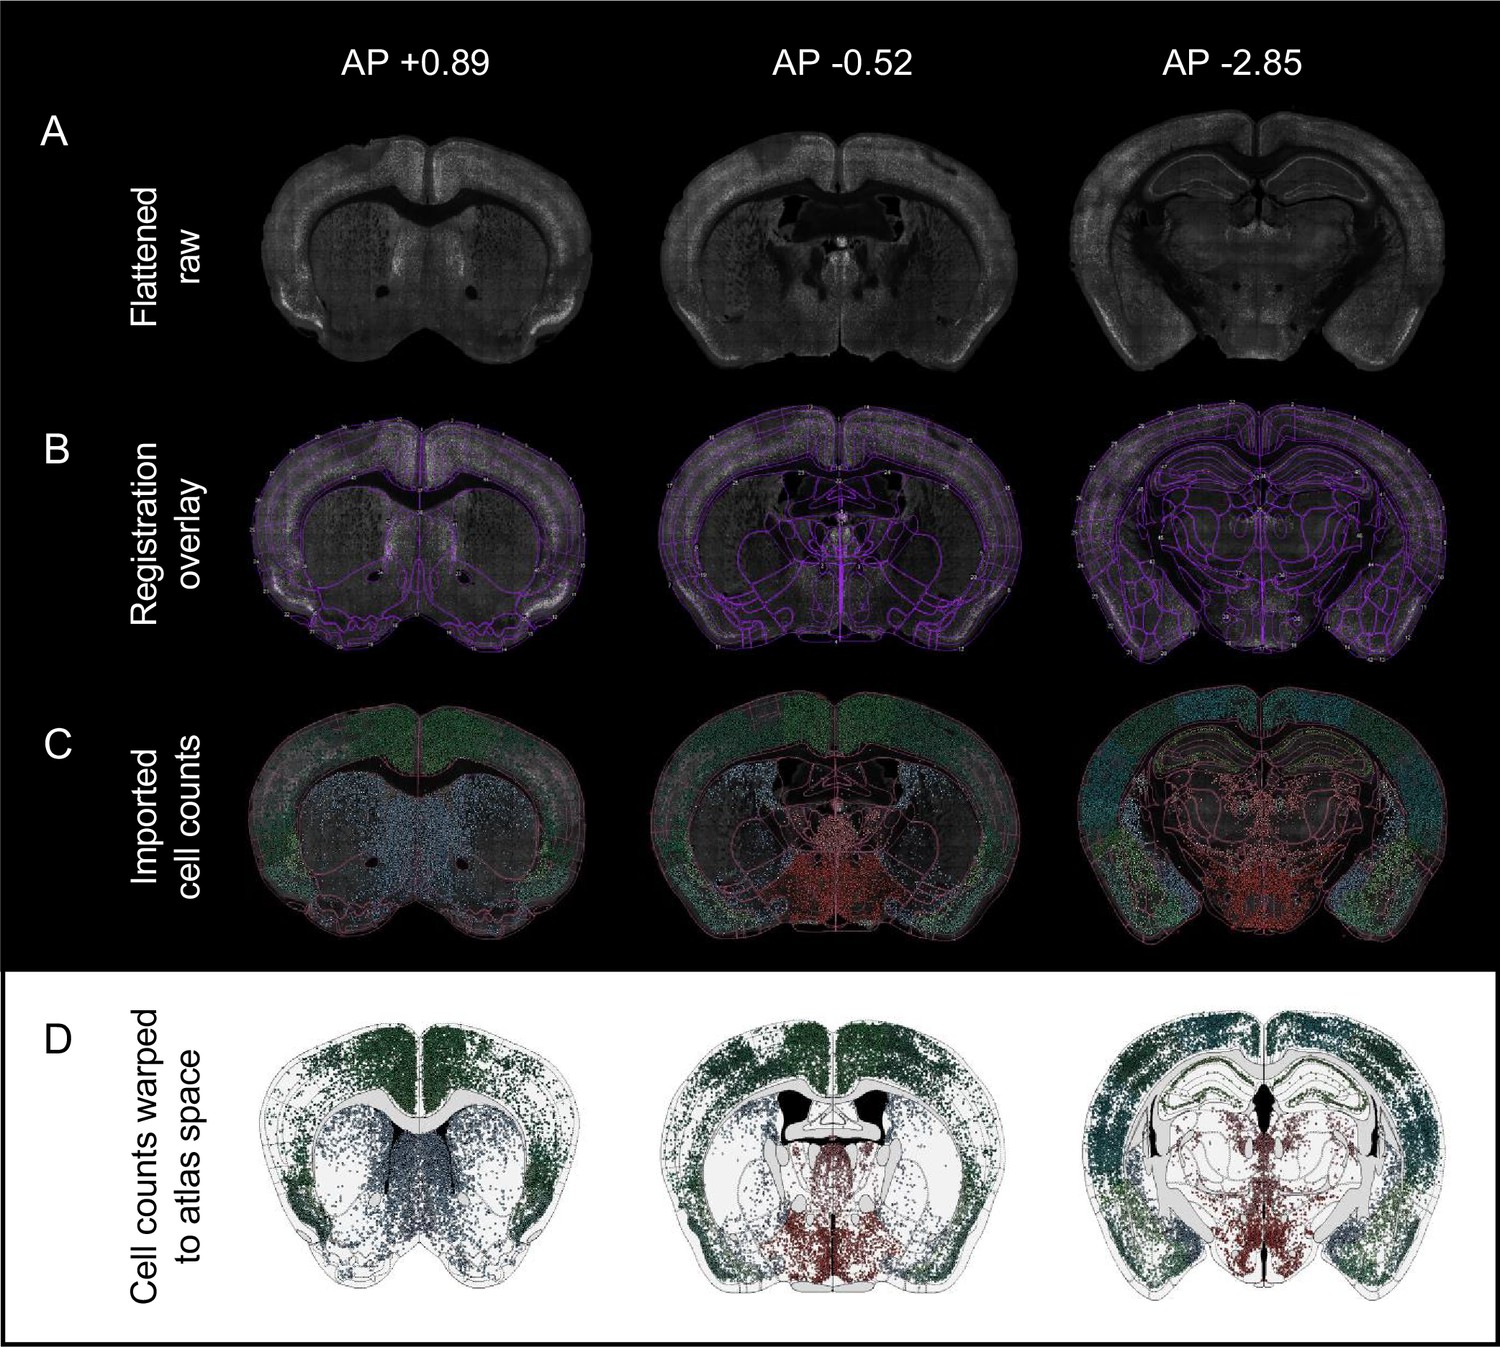
Registration projecting segmented cell counts to a standard atlas space.
(A) Raw grayscale images of whole coronal sections with eYFP+ and c-Fos+ signals combined (Flattened raw). Corresponding coordinates of the best-matching Allen Mouse Brain atlas plates (AP +0.89, left; AP –0.52, middle; AP –2.85, right) are displayed above. (B) The user-corrected registration overlay across the representative coronal sections. User correction through an interactive console interface was performed by interfacing with the Wholebrain and SMART packages through SMARTTR. (C) Representative images of imported c-Fos automated cell counts onto the user-corrected registrations (image space). Cells are color-coded based on region colors consistent with the Allen Mouse Brain Atlas. (D) Forward warp of the segmented c-Fos+ counts from image space to a common shared stereotaxic coordinate space (atlas space) facilitates standardized integration of data across all mice.
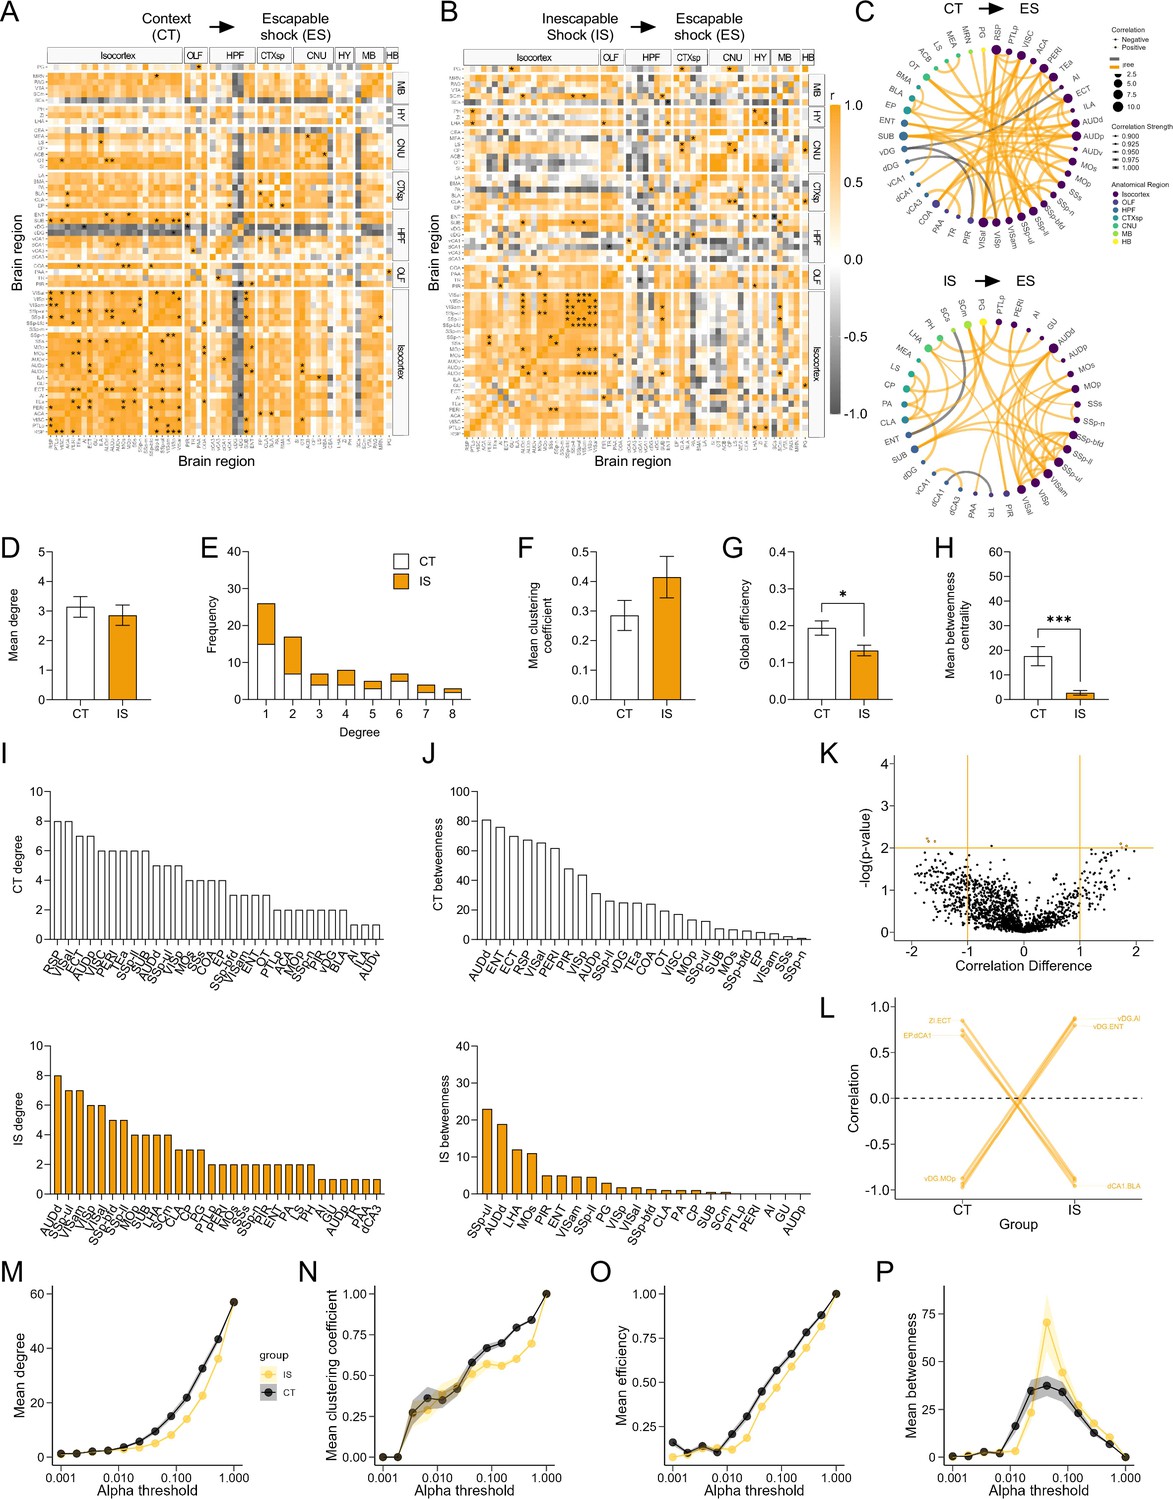
Figure 3 with 3 supplements
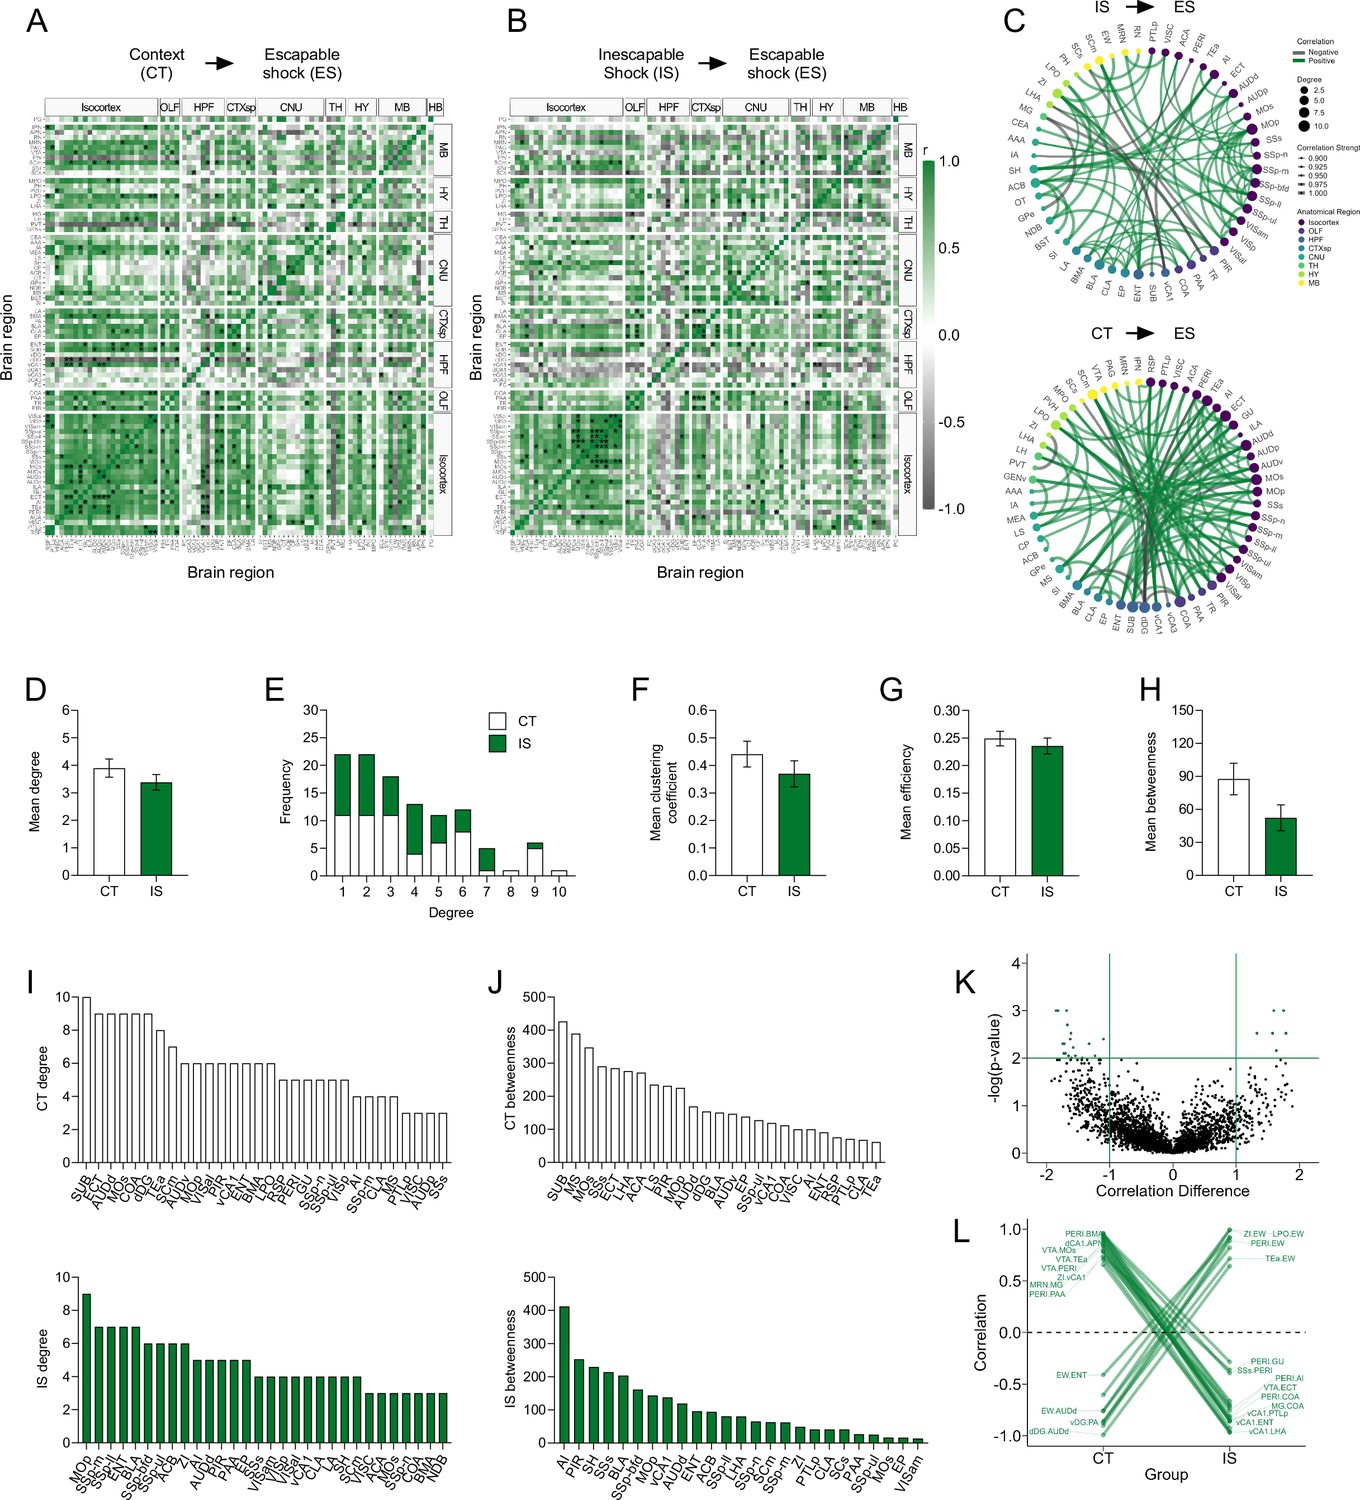
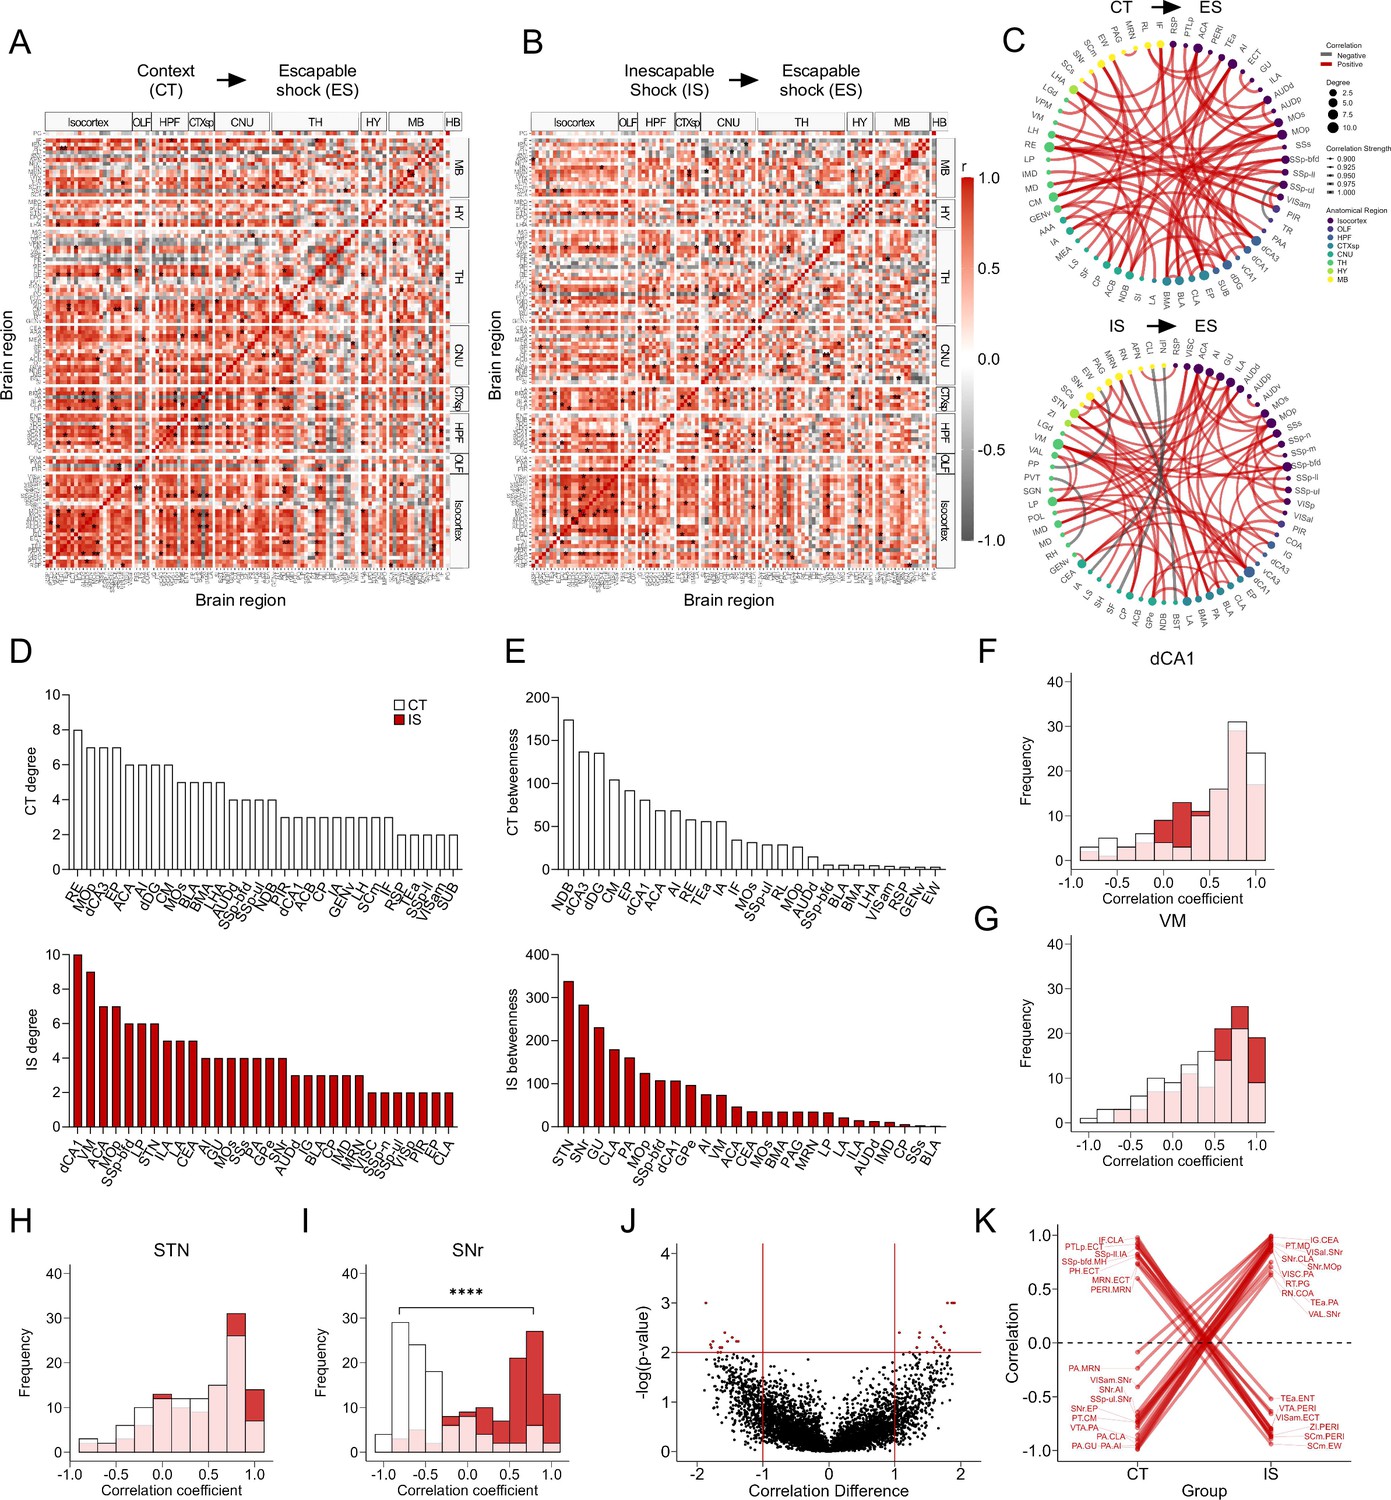
Network-level analysis reveals enhanced sensory and affective processing during learned helplessness acquisition.
(A, B) Regional cross-correlation heatmaps of eYFP+ volume normalized cell counts in context trained (CT) and inescapable shock (IS) mice. Significant values are p < 0.01. (C) Functional networks constructed after thresholding for the strongest and most significantly correlated or anti-correlated connections (r > 0.9, p < 0.01). (D) Average degree centrality does not differ between IS and CT groups, unpaired t-test. (E) Degree frequency distributions are right-tailed. (F–H) Mean clustering coefficient, global efficiency, and mean betweenness centrality do not differ between the CT and IS networks, unpaired t-test. (I) The top node degree values in descending order for the CT (white, top) and IS (green, bottom) networks indicate which regions are most highly connected. (J) The top node betweenness values in descending order for the CT (white, top) and IS (green, bottom) networks indicate which regions are most influential in directing ‘information flow’. (K) Volcano plot of the Pearson correlation differences (rIS – rCT) for all individual regional connections against their p-values calculated from a permutation analysis. Points intersecting or within the upper left or right quadrant represent the regional relationships with the greatest change (|correlation difference| >1), that were most significant (p < 0.01). (L) A parallel coordinate plot highlighting individual significantly changed regional correlations between groups, as well as the direction of their change. Error bars represent ± SEM.
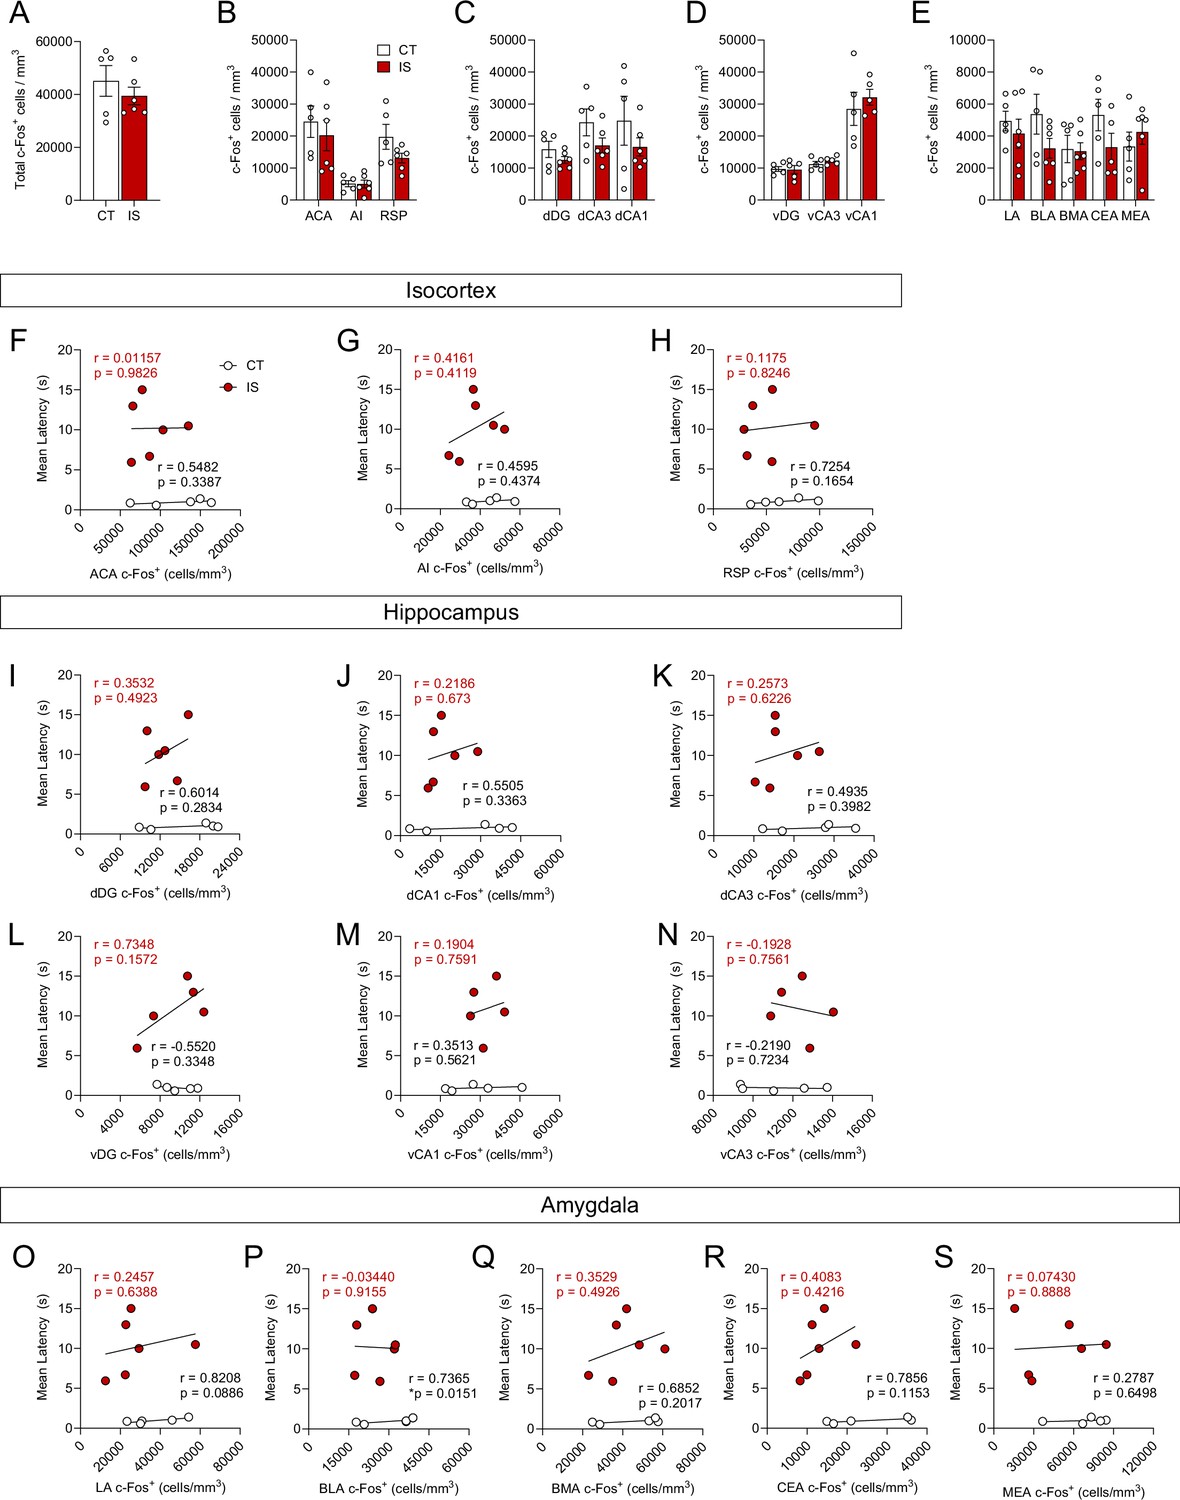
Figure 3—figure supplement 1
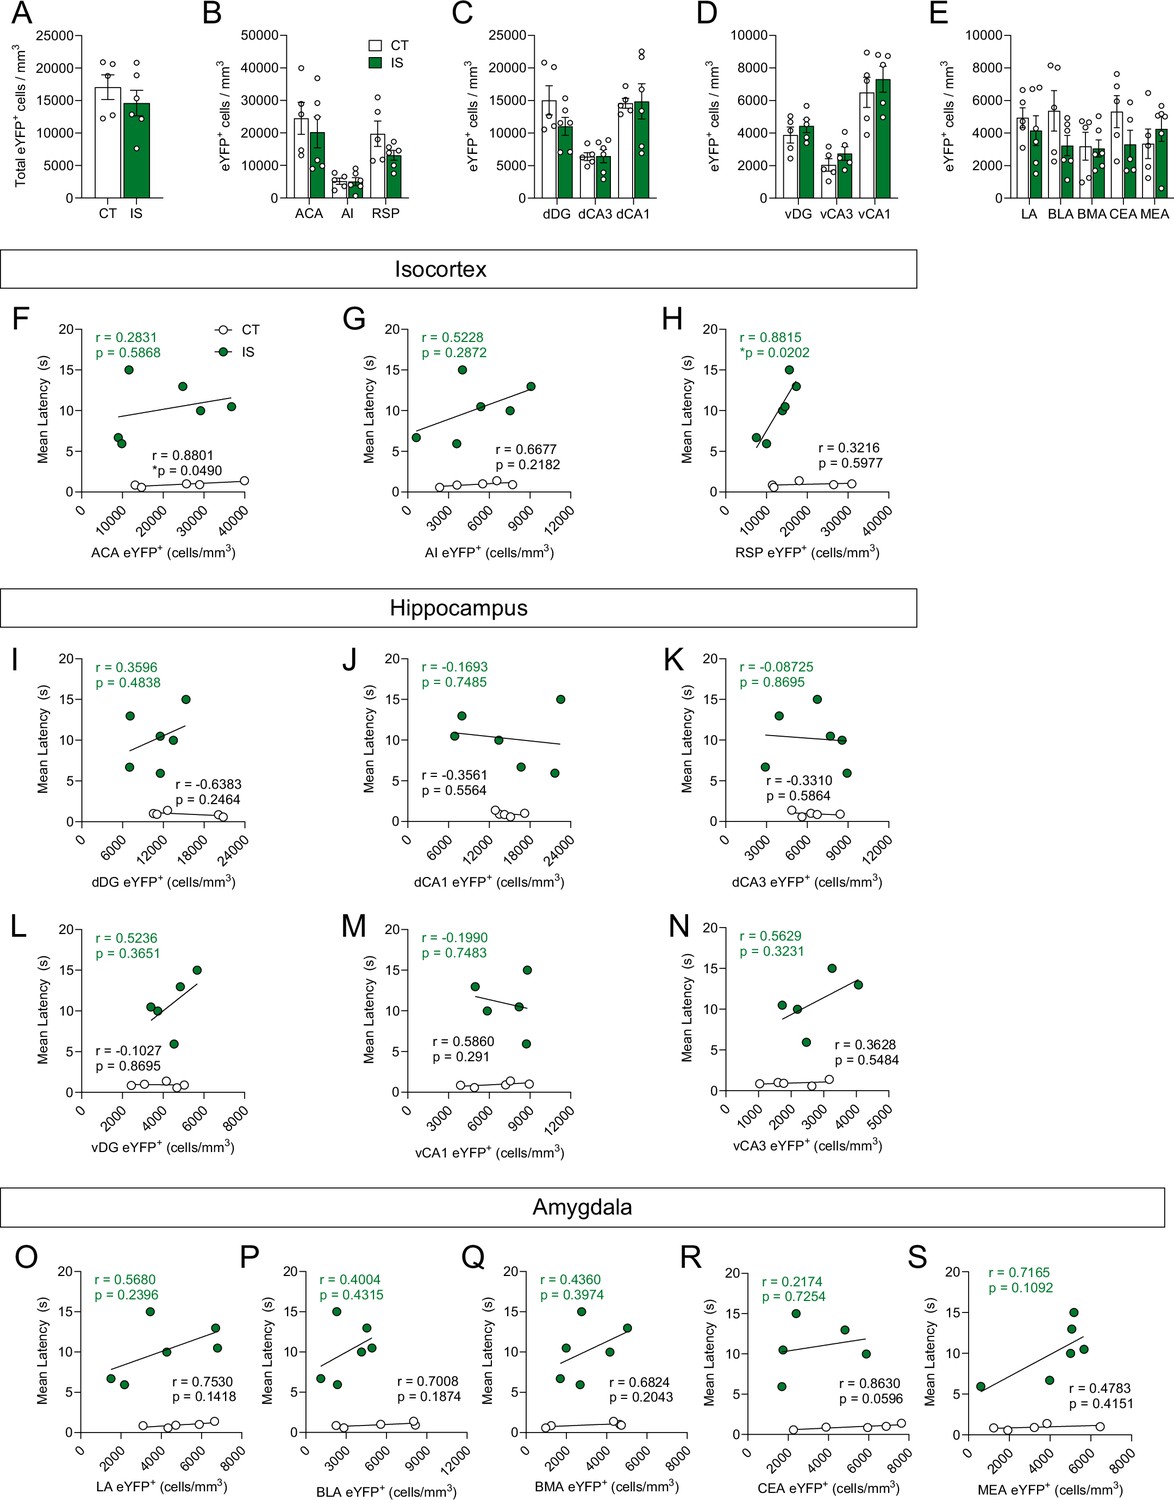
Activity is not heightened globally or across targeted subregions following exposure to inescapable shock (IS).
(A) No significant differences were found in total brain-wide volume normalized (cells/mm3) counts of eYFP+ cells between context trained (CT) or IS groups. Regional activation analysis of targeted (B) isocortical areas (ACA, AI, and RSP), (C) dorsal hippocampal regions (dDG, dCA3, and dCA1), (D) ventral hippocampal regions (vDG, vCA3, and vCA1), and (E) amygdalar areas (LA, BLA, BMA, and CEA) revealed no difference in neural activity levels between CT and IS groups, multiple t-test (Holm-Sidak method for multiple comparisons) (F–H) Targeted isocortical analysis showed that eYFP+ cell counts in the RSP and escape latency during later escapable shock testing were significantly correlated in the IS group. (I–N) No significant correlations were found between dorsal and ventral hippocampal region eYFP+ cell counts and escape latency during later escapable shock testing. (O–S) No significant correlations were found between targeted amygdalar region eYFP cell counts and escape latency. Error bars represent ± SEM. Per brain region analyzed, n = 5 mice for the CT group and n = 5–6 for the IS group. ACA, anterior cingulate area; AI, agranular insula; RSP, retrosplenial area; dDG, dorsal dentate gyrus; dCA3, dorsal CA3; dCA1, dorsal CA1; vDG, ventral dentate gyrus; vCA3, ventral CA3; vCA1, ventral CA1; LA, lateral amygdalar nucleus; BLA, basolateral amygdalar nucleus; BMA, basomedial amygdalar nucleus; CEA, central amygdalar nucleus; MEA, medial amygdalar nucleus.
Figure 3—figure supplement 2
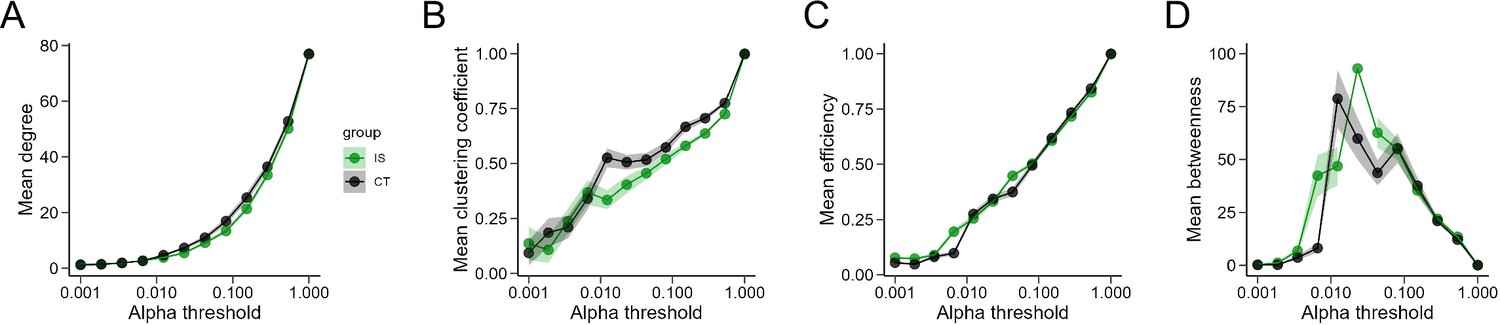
Global network topology metrics during exposure to inescapable shock across a range of thresholds.
(A) Degree, (B) clustering coefficient, (C) global efficiency, and (D) mean betweenness centrality trajectories do not differ between CT and IS groups across a wide range of alpha thresholds.
Figure 3—figure supplement 3
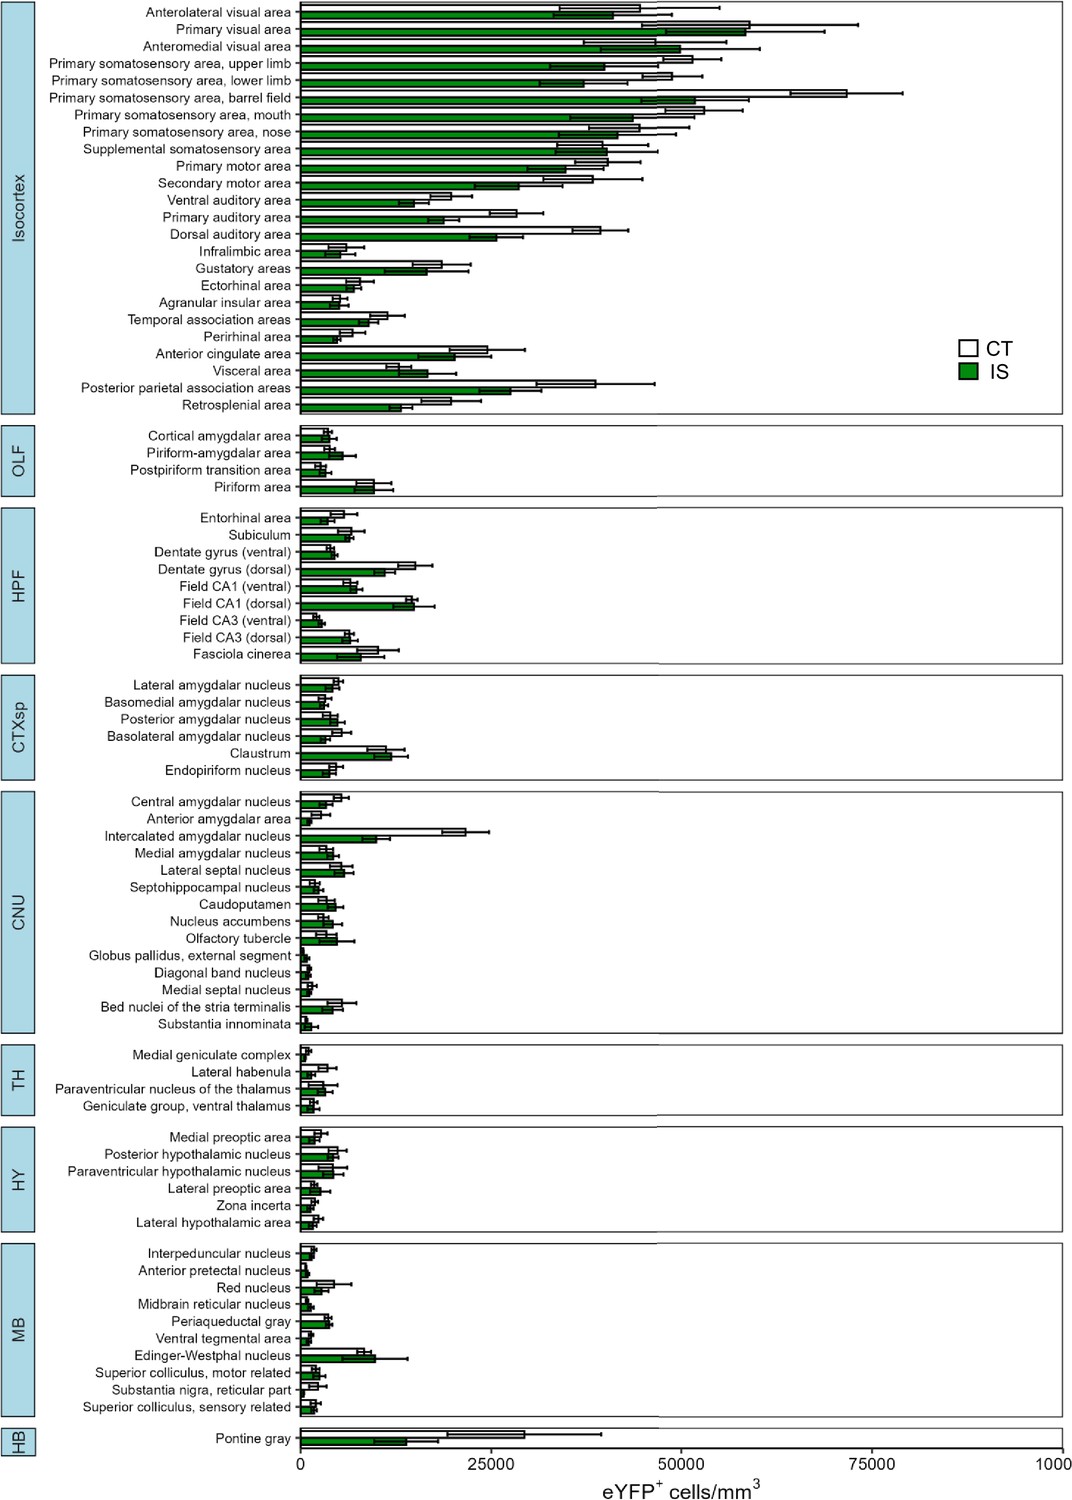
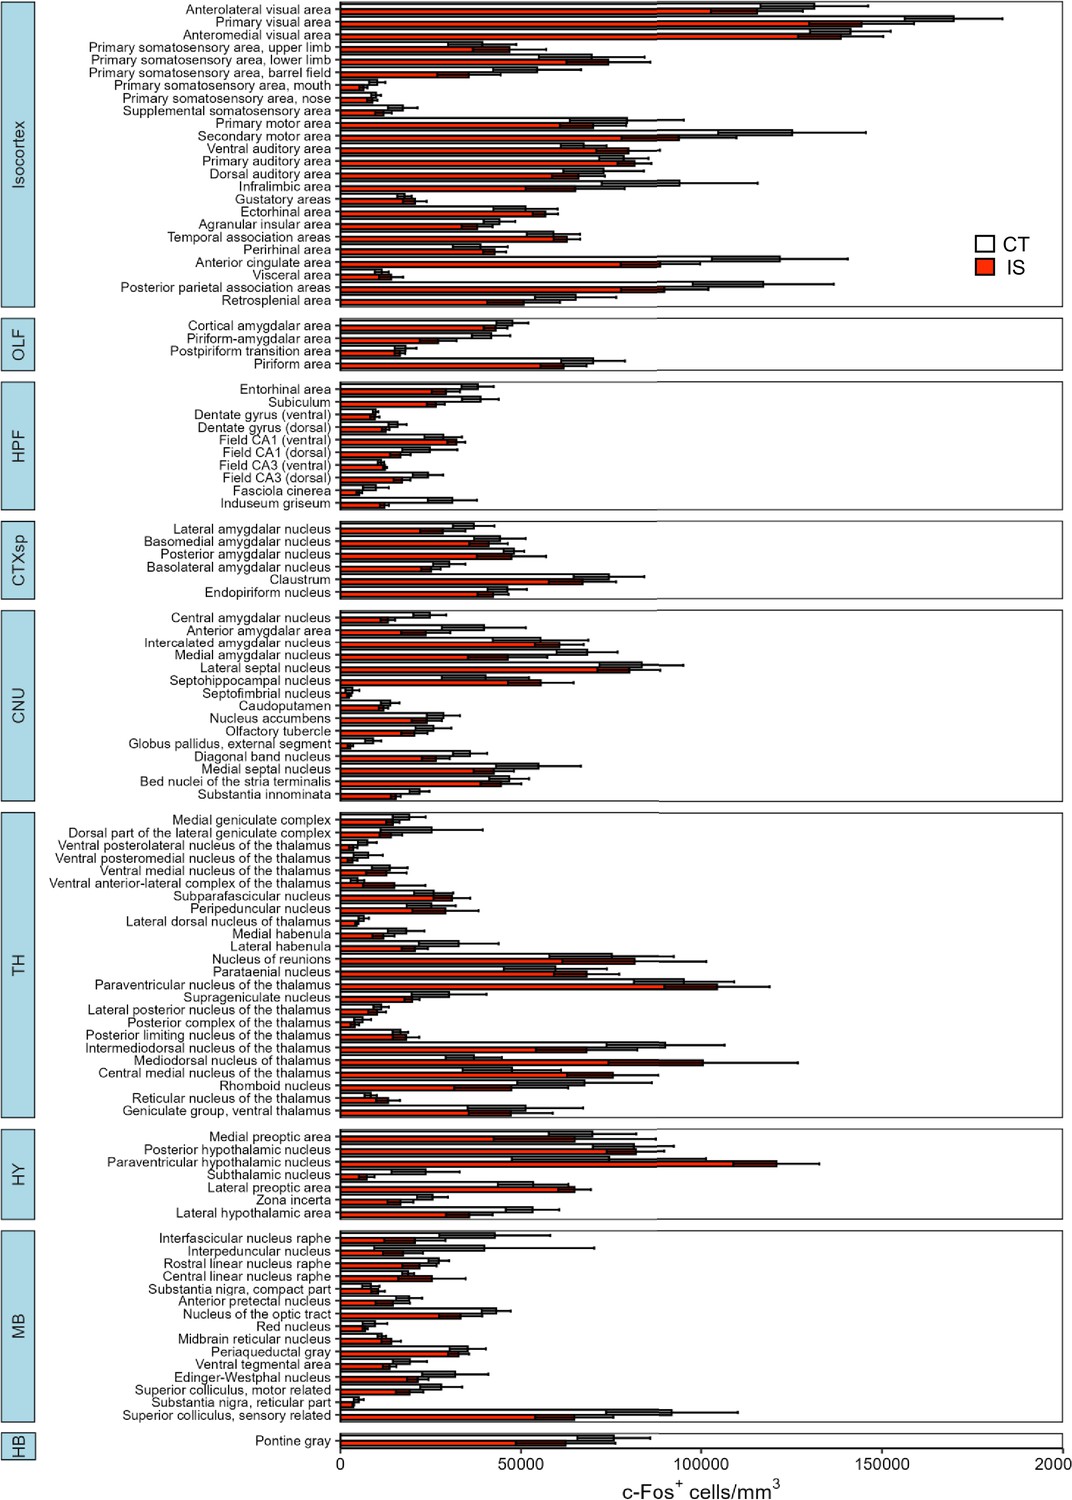
Differential expression of eYFP activity across all mapped regions.
Volume normalized (cells/mm3) counts of eYFP+ cells between context trained (CT, white bars) or inescapable shock (IS, green bars) mice across all regions mapped. Subregion activity expression patterns are organized by parent anatomical divisions. Error bars represent ± SEM. OLF, olfactory areas; HPF, hippocampal formation; CTXsp, cortical subplate; CNU, cerebral nuclei; TH, thalamus; HY, hypothalamus; MB, midbrain; HB, hindbrain. Error bars represent ± SEM; n = 5 mice for the CT group and n = 6 for the IS group.
Figure 4 with 3 supplements
Network-level analysis reveals influential altered functional connectivity of the substantia nigra during learned helplessness expression.
(A, B) Regional cross-correlation heatmaps of c-Fos+ expression in context trained (CT) and inescapable shock (IS) groups. Significant values are p < 0.005. (C) Functional networks constructed after thresholding for the strongest and most significantly correlated or anti-correlated connections (r > 0.9, p < 0.005). (D) Highest individual node degree values in descending order for the CT (white, top) and IS (red, bottom) networks indicate which regions are most highly connected. (E) Node betweenness values in descending order for the CT (white, top) and IS (red, bottom) networks. (F–I) Pearson correlation distributions of the dorsal CA1 (dCA1), ventral medial nucleus of the thalamus (VM), subthalamic nucleus (STN), and substantia nigra, reticular part (SNr). Distributions between CT and IS groups significantly differ in the SNr, two-sample Kolmogorov-Smirnov test. (J–K) Volcano plot and parallel coordinate plots highlighting the permuted correlation differences (rIS – rCT) that show the greatest change (|correlation difference| >1), and are most significant (p < 0.01) between the CT and IS groups. ****p < 0.0001. Error bars represent ± SEM.
Figure 4—figure supplement 1
Absolute activity of targeted isocortical, hippocampal, and amygdala regions is not associated with learned helpless expression.
(A) No significant differences were found in total brain-wide volume normalized (cells/mm3) counts of c-Fos+ cells between context trained (CT) or inescapable shock (IS) groups, unpaired t-test. Regional activation analysis of targeted (B) isocortical areas (ACA, AI, and RSP), (C) dorsal hippocampal regions (dDG, dCA3, and dCA1), (D) ventral hippocampal regions (vDG, vCA3, and vCA1), and (E) amygdalar areas (LA, BLA, BMA, and CEA) revealed no difference in neural activity levels between CT and IS groups, multiple t-test (Holm-Sidak method for multiple comparisons). (F–H) c-Fos+ cell counts in targeted isocortical regions do not correlate with escape latency during later escapable shock. (I–N) No significant correlations were found between dorsal and ventral hippocampal region c-Fos+ cell counts and escape latency during later escapable shock testing. (O–S) No significant correlations were found between targeted amygdalar region c-Fos+ cell counts and escape latency. Error bars represent ± SEM. Per brain region analyzed, n = 5 mice for the CT group and n = 5–6 for the IS group. ACA, anterior cingulate area; AI, agranular insula; RSP, retrosplenial area; dDG, dorsal dentate gyrus; dCA3, dorsal CA3; dCA1, dorsal CA1; vDG, ventral dentate gyrus; vCA3, ventral CA3; vCA1, ventral CA1; LA, lateral amygdalar nucleus; BLA, basolateral amygdalar nucleus; BMA, basomedial amygdalar nucleus; CEA, central amygdalar nucleus; MEA, medial amygdalar nucleus.
Figure 4—figure supplement 2
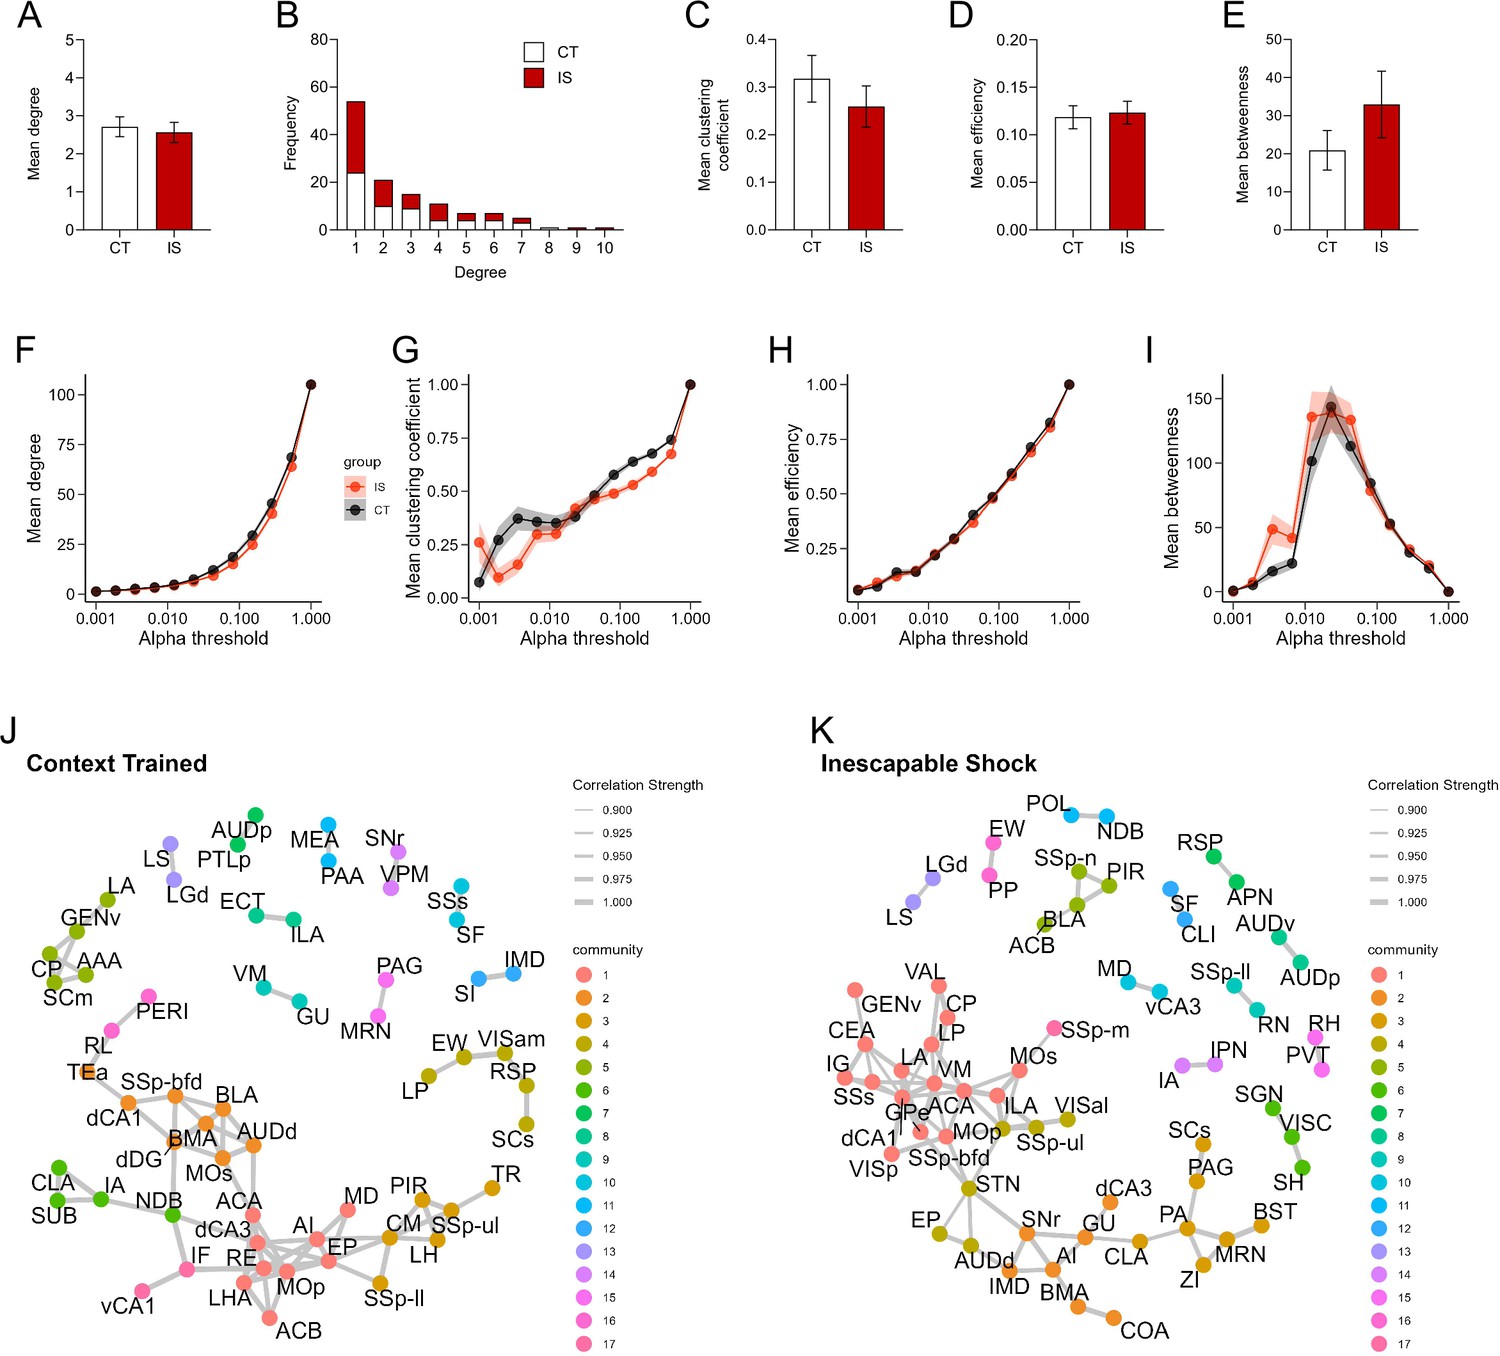
Properties of networks constructed from brain-wide c-Fos+ regional co-expression.
(A) Average degree does not differ between CT and IS groups, unpaired t-test. (B) Degree frequency distribution shows a right-tailed distribution for both groups. (C–E) Mean clustering coefficient, global efficiency, and mean betweenness centrality do not differ between groups, unpaired t-test. (F–I) Trajectories of global c-Fos+ network topology metrics of mean degree, mean clustering coefficient, mean efficiency, and mean betweenness centrality are calculated based off a wide range of possible significance thresholds. Exploratory community detection analysis applied to (J) context trained (CT) and (K) inescapable shock (IS) c-Fos+ networks based on calculation of the leading non-negative eigenvector of the modularity matrix. Gray lines indicate retained network connections between nodes. Nodes belonging to the same detected communities are colored identically. Error bars and shading represents ± SEM; n = 5 mice for the CT group and n = 6 for the IS group.
Figure 4—figure supplement 3
Differential expression of c-Fos activity across all mapped regions.
Volume normalized (cells/mm3) counts of c-Fos+ cells between context trained (CT, white bars) or inescapable shock (IS, red bars) mice across all regions mapped. Subregion activity expression patterns are organized by parent anatomical divisions. Error bars represent ± SEM. OLF, olfactory areas; HPF, hippocampal formation; CTXsp, cortical subplate; CNU, cerebral nuclei; TH, thalamus; HY, hypothalamus; MB, midbrain; HB, hindbrain. Error bars represent ± SEM; n = 5 mice for the CT group and n = 6 for the IS group.
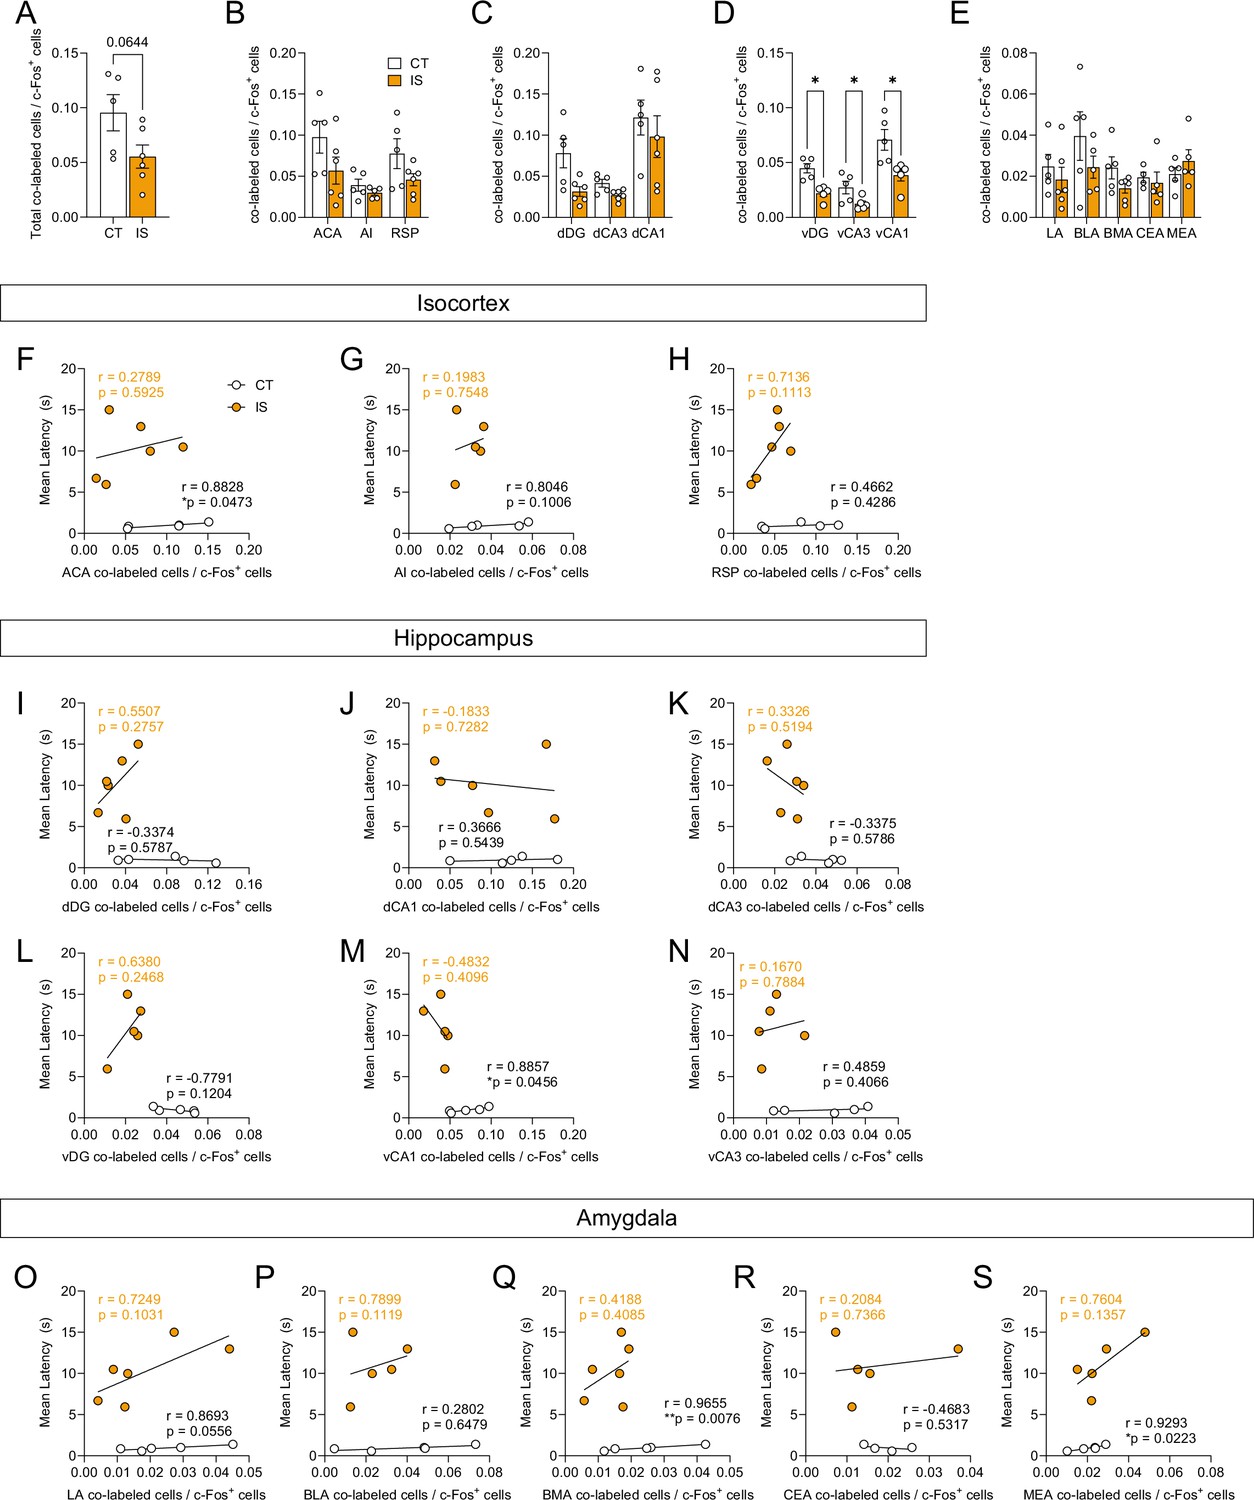
Figure 5 with 6 supplements
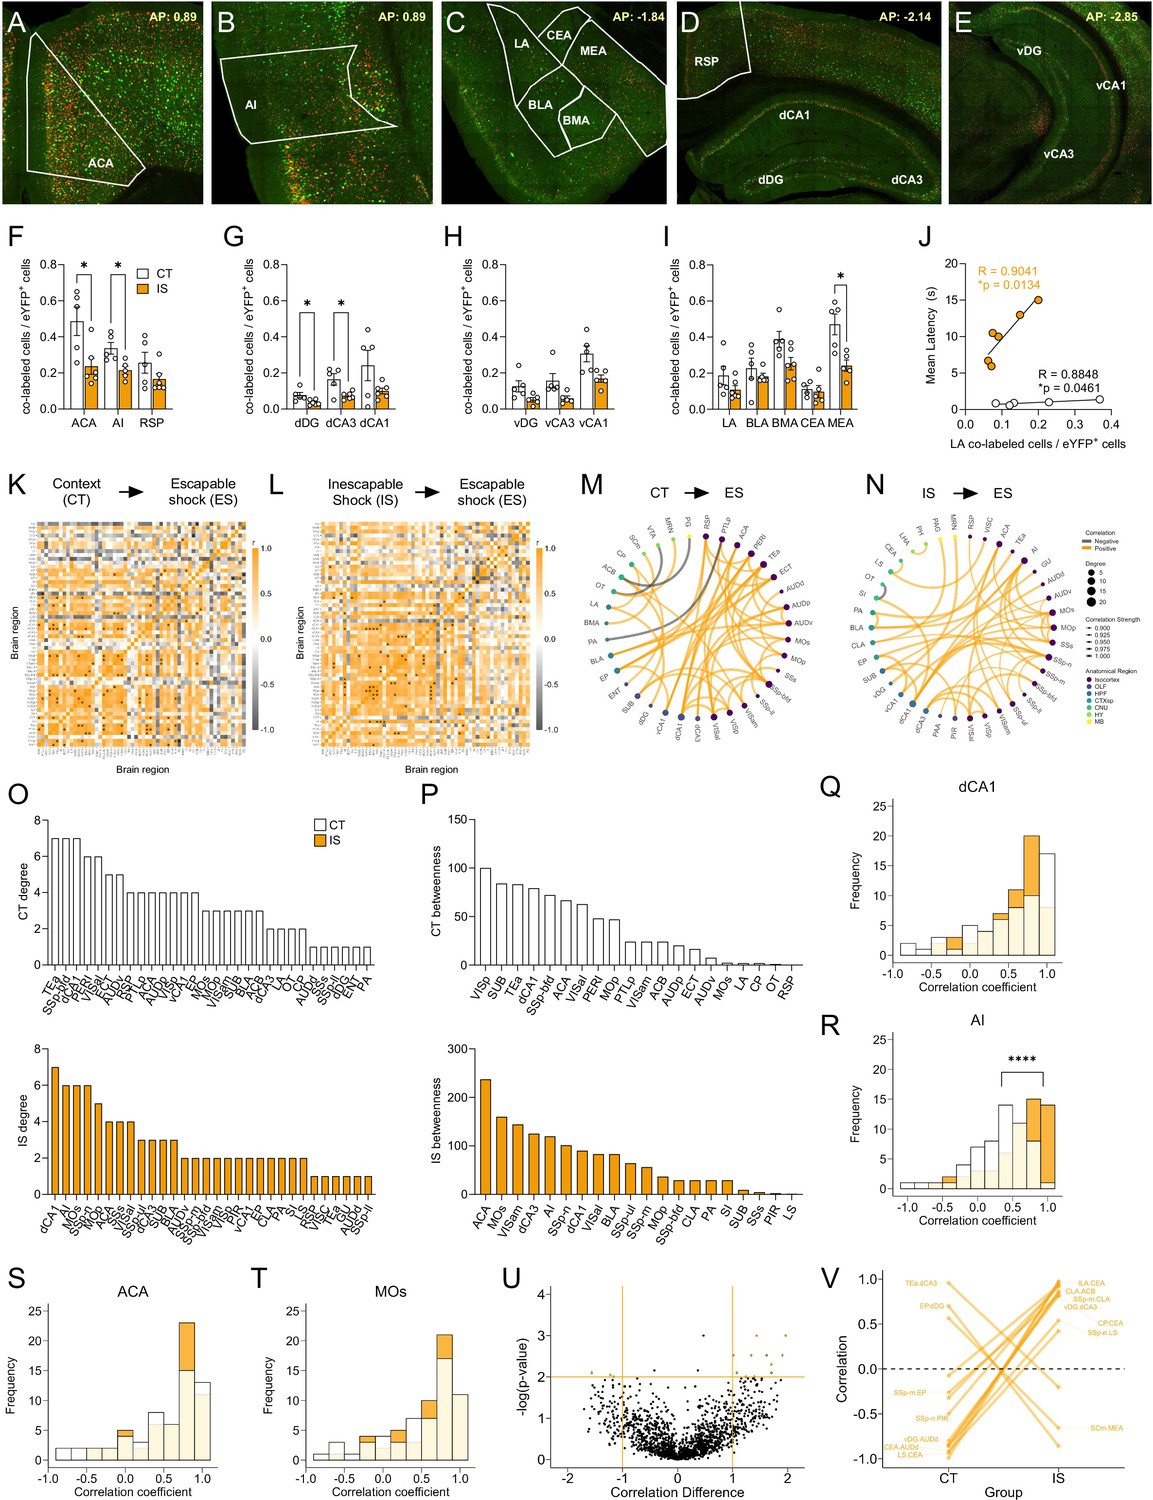
Network analysis of reactivated inescapable shock (IS) ensembles during learned helplessness reveals altered functional connectivity.
(A–E) Representative images of regions identified for targeted analysis, including isocortical regions (anterior cingulate area, ACA; agranular insula, AI; and retrosplenial area, RSP), dorsal hippocampal regions (dorsal dentate gyrus, dDG; dorsal CA3, dCA3; and dorsal CA1, dCA1), ventral hippocampal regions (ventral dentate gyrus, vDG; ventral CA3, vCA3; and ventral CA1, vCA1), and amygdalar areas (lateral amygdalar nucleus, LA; basolateral amygdalar nucleus, BLA; basomedial amygdalar nucleus, BMA; central amygdalar nucleus, and CEA; medial amygdalar nucleus, MEA). Representative region overlays were manually drawn. (F–I) The ACA, AI, dDG, dCA3, and MEA show significantly decreased reactivation activity (co-labeled cells/eYFP+ cells) in the mice exposed to IS compared to context training, multiple t-test (Holm-Sidak method for multiple comparisons). (J) LA reactivation activity in both context trained (CT, n=5) and IS mice (n=6) shows positive correlation to escape latency. (K, L) Correlation heatmaps of reactivation activity in CT and IS mice. (M, N) Functional networks constructed after thresholding for the strongest and most significant correlated or anti-correlated connections (r > 0.9, p < 0.01). (O) Top individual node degree values in descending for the CT (white, top) and IS (yellow, bottom) networks. (P) Highest node betweenness values in descending for the CT (white, top) and IS (yellow, bottom) networks. (Q–T) Pearson correlation distributions of the dCA1, AI, ACA, secondary motor area (MOs), and substantia nigra, reticular part (SNr). Distributions between CT and IS groups significantly differ in the AI, two-sample Kolmogorov-Smirnov test. (U,V) Volcano plot and parallel coordinate plots highlighting the permuted correlation differences (rIS – rCT) of functional connections of reactivated activity showing the greatest change (|correlation difference| >1), and are most significant (p < 0.01) between the CT and IS groups. *p < 0.05, ****p < 0.0001. Error bars represent ± SEM.
Figure 5—figure supplement 1
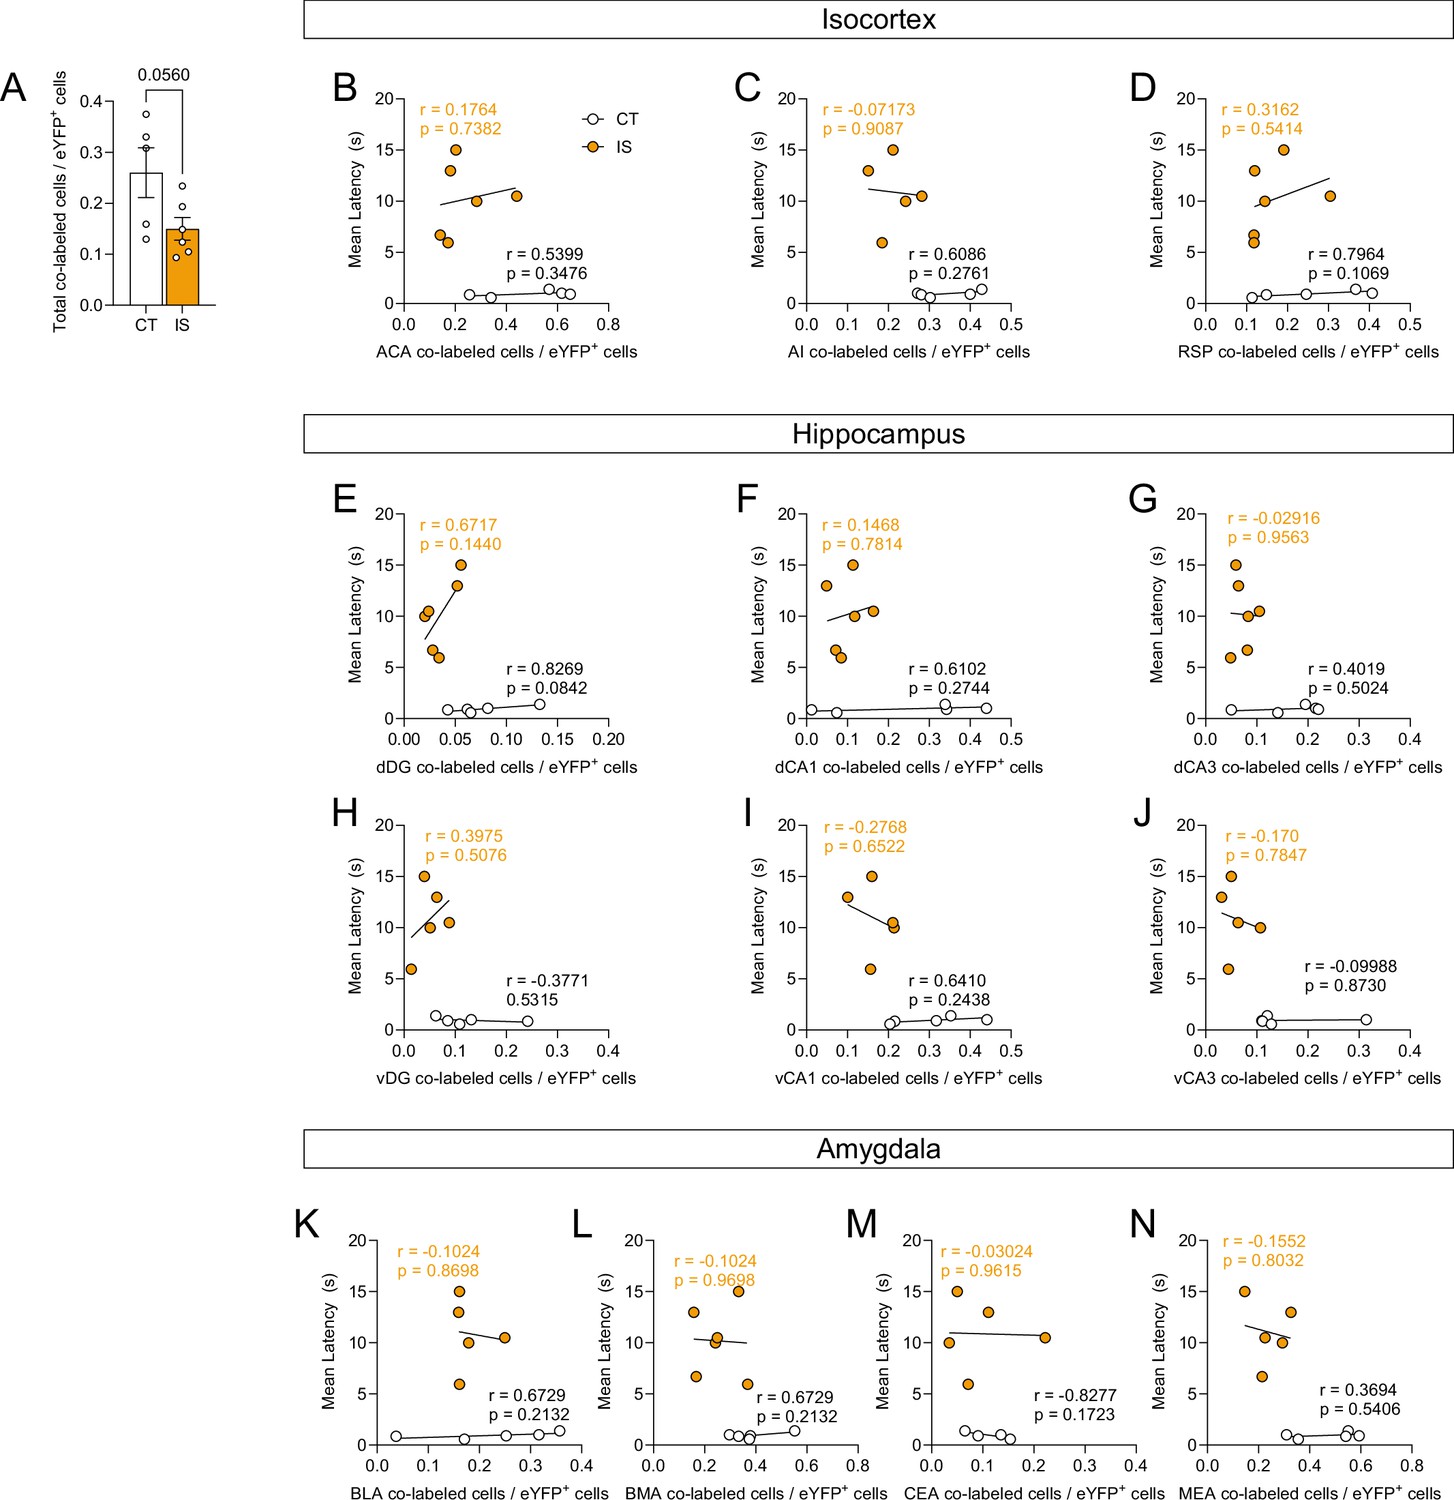
Global reactivation activity during escapable shock is dampened in mice previously exposed to inescapable shock (IS).
(A) There is a trending global decrease of proportion of reactivated cells (co-labeled cells/eYFP+ cells) in IS mice compared to context trained (CT) mice, unpaired t-test. Reactivation activity of targeted isocortical areas, such as the (B) ACA, (C) AI, and (D) RSP, is not correlated to escape latency in IS or CT mice. Reactivation activity of targeted dorsal hippocampal regions, such as the (E) dDG, (F) dCA1, and (G) dCA3, and of targeted ventral hippocampal regions, such as the (H) vDG, (I) vCA1, and (J) vCA3, is not correlated to escape latency in IS or CT mice. Reactivation activity of targeted amygdalar areas, such as the (K) BLA, (L) BMA, (M) CEA, and (N) MEA, is not correlated to escape latency in IS or CT mice. Error bars represent ± SEM. Per brain region analyzed, n = 4–5 mice for the CT group and n = 5–6 for the IS group. ACA, anterior cingulate area; AI, agranular insula; RSP, retrosplenial area; dDG, dorsal dentate gyrus; dCA3, dorsal CA3; dCA1, dorsal CA1; vDG, ventral dentate gyrus; vCA3, ventral CA3; vCA1, ventral CA1; LA, lateral amygdalar nucleus; BLA, basolateral amygdalar nucleus; BMA, basomedial amygdalar nucleus; CEA, central amygdalar nucleus; MEA, medial amygdalar nucleus. Error bars represent ± SEM.
Figure 5—figure supplement 2
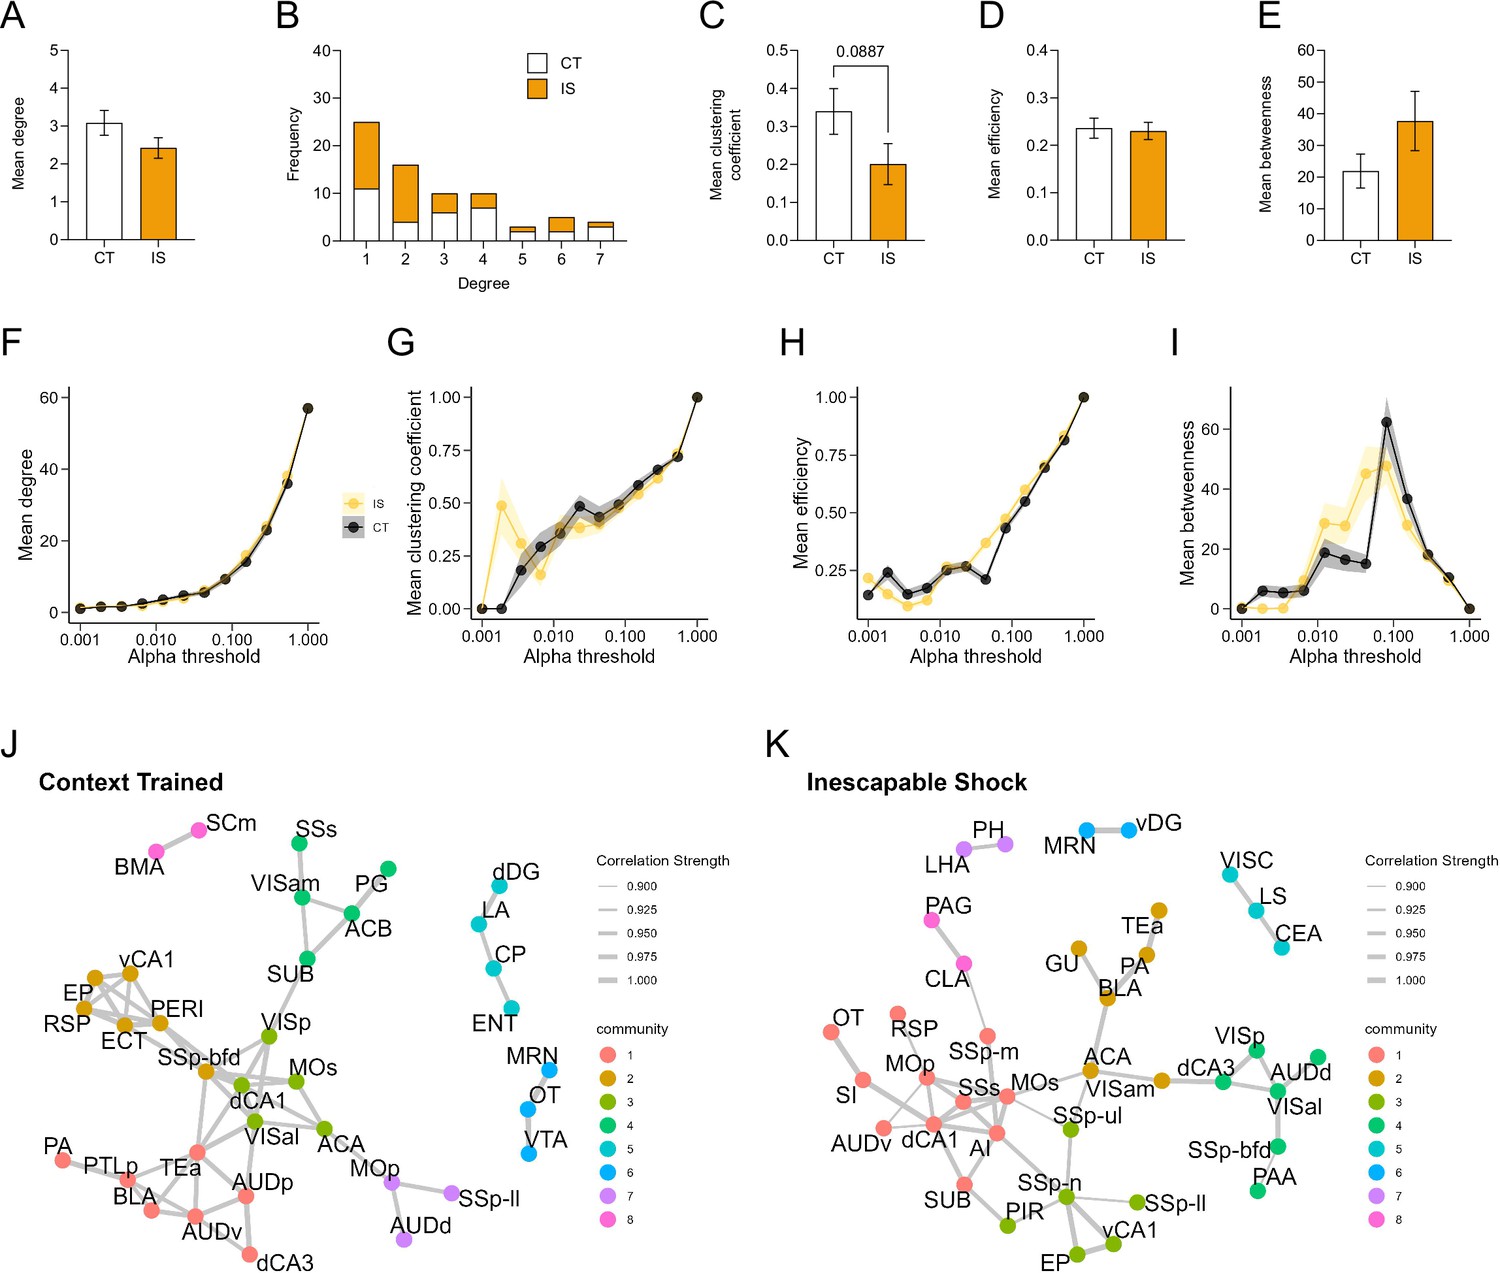
Properties of networks constructed from functional connections between reactivated ensembles (co-labeled/eYFP+ cells).
Global topology characteristics of CT and IS reactivation networks were calculated after thresholding for important regional correlations using an r > 0.9 and p < 0.01. (A) Average degree does not differ between groups, unpaired t-test. (B) Degree frequency distribution shows a right-tailed distribution for both groups. (C–E) Mean clustering coefficient, global efficiency, and mean betweenness centrality do not differ between groups, unpaired t-test. Trajectories of global network topology metrics, including (F) mean degree, (G) mean clustering coefficient, (H) mean efficiency, and (I) mean betweenness, were calculated based off a wide range of possible significance thresholds. Exploratory community detection analysis applied to (J) CT and (K) IS reactivation networks based on calculation of the leading non-negative eigenvector of the modularity matrix. Gray lines indicate retained network connections between nodes. Nodes belonging to the same detected communities are identically colored. Error bars and shading represent ± SEM; n = 5 mice for the CT group and n = 6 for the IS group.
Figure 5—figure supplement 3
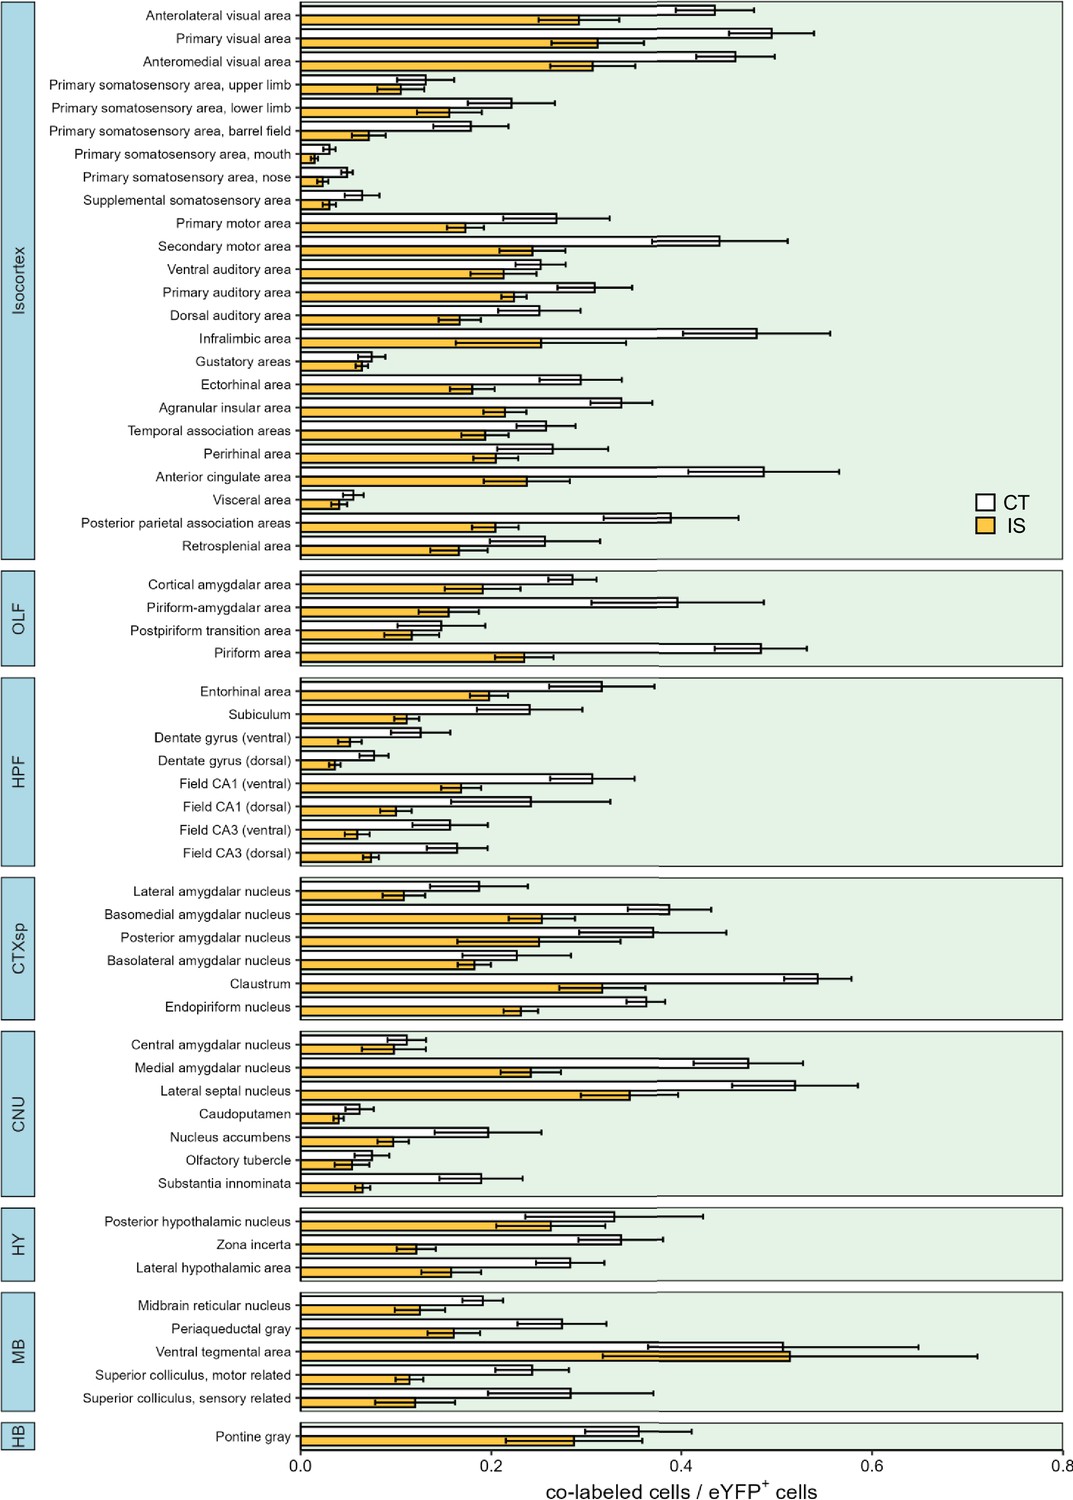
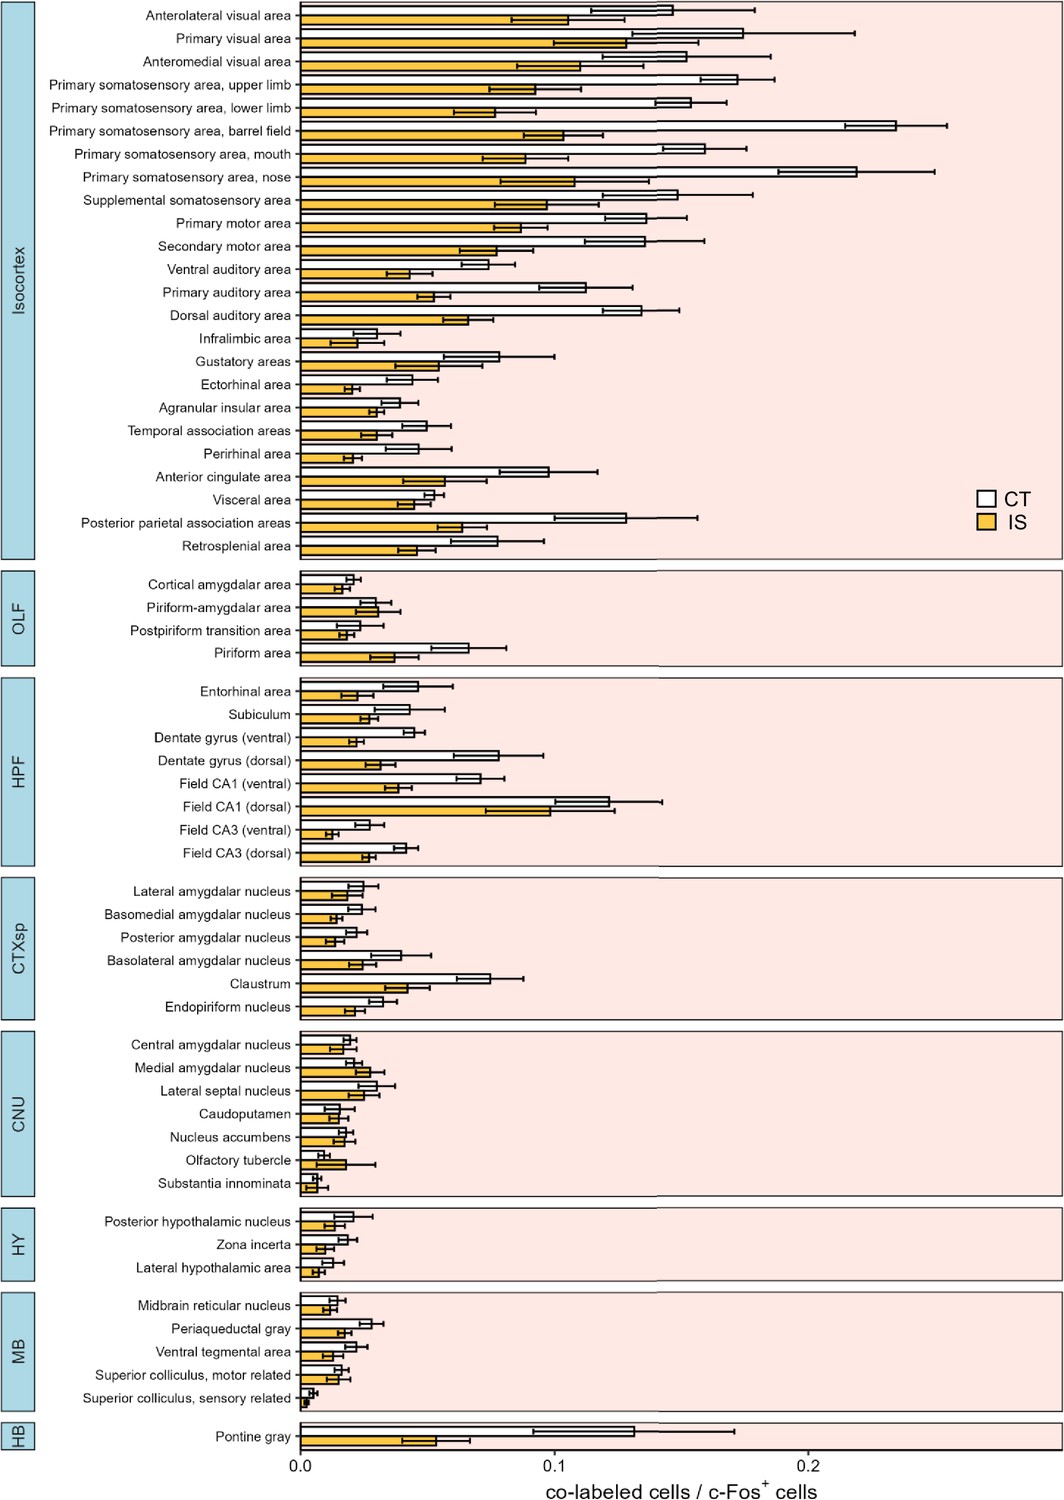
Differential reactivation proportions across all mapped regions.
Reactivation activity (co-labeled cells/eYFP+ cells) between context trained (CT, white bars) or inescapable shock (IS, yellow bars) mice across all regions mapped. Subregion activity expression patterns are organized by parent anatomical divisions. Error bars represent ± SEM. OLF, olfactory areas; HPF, hippocampal formation; CTXsp, cortical subplate; CNU, cerebral nuclei; TH, thalamus; HY, hypothalamus; MB, midbrain; HB, hindbrain. Error bars represent ± SEM; n = 5 mice for the CT group and n = 6 for the IS group.
Figure 5—figure supplement 4
Reactivated activity proportions are decreased in targeted ventral hippocampal regions following inescapable shock (IS).
(A) There is a trending decrease in global co-labeled/c-Fos+ cell proportions between context trained (CT) or IS groups, unpaired t-test. Regional activation analysis of targeted (B) isocortical areas (ACA, AI, and RSP), (C) dorsal hippocampal regions (dDG, dCA3, and dCA1), (D) ventral hippocampal regions (vDG, vCA3, and vCA1), and (E) amygdalar areas (LA, BLA, BMA, and CEA) reveals that vDG, vCA3, and vCA1 activity is significantly decreased in IS mice compared to CT mice, multiple t-test (Holm-Sidak method for multiple comparisons). Correlation analysis of co-labeled/c-Fos+ activity of targeted isocortical areas, such as the (F) ACA, (G) AI, and (H) RSP, reveals that ACA activity is significantly correlated with crossing latency in the CT group. Analysis of targeted dorsal and ventral hippocampal regions, such as the (I) dDG, (J) dCA1, (K) dCA3, (L) vDG, (M) vCA1, and (N) vCA3, reveals that vCA1 co-labeled/c-Fos+ is significantly correlated with crossing latency in the CT group. Analysis of targeted amygdalar regions, such as (O) LA, (P) BLA, (Q) BMA, (R) CEA, and (S) MEA, reveals that co-labeled/c-Fos+ activity in the BMA and MEA is significantly correlated with crossing latency in the CT group. ACA, anterior cingulate area; AI, agranular insula; RSP, retrosplenial area; dDG, dorsal dentate gyrus; dCA3, dorsal CA3; dCA1, dorsal CA1; vDG, ventral dentate gyrus; vCA3, ventral CA3; vCA1, ventral CA1; LA, lateral amygdalar nucleus; BLA, basolateral amygdalar nucleus; BMA, basomedial amygdalar nucleus; CEA, central amygdalar nucleus; MEA, medial amygdalar nucleus. Per brain region, n = 4–5 mice for the CT group and n = 5–6 for the IS group. *p < 0.05. Error bars represent ± SEM.
Figure 5—figure supplement 5
Supplementary network-level analysis of co-labeled/c-Fos+ activity reveals high sensory functional connectivity.
(A, B) Regional cross-correlation heatmaps of co-label/c-Fos+ proportions in context trained (CT) and learned helpless (IS) mice. Significant values are p < 0.01. In the IS heatmaps, an especially high co-activation among somatosensory regions, visual, and auditory regions is observed. (C) Functional networks constructed after thresholding for the strongest and most significantly correlated or anti-correlated connections (r > 0.9, p < 0.01). (D) Average degree centrality does not differ between IS and CT groups, unpaired t-test. (E) Degree frequency distributions are right-tailed. (F) Mean clustering coefficient does not differ between the CT and IS networks, unpaired t-test. (G, H) Mean global efficiency and betweenness centrality are significantly lower in IS networks, likely due to overall lower interconnectivity among regions, unpaired t-test. (I) The top node degree values in descending order for the CT (white, top) and IS (yellow, bottom) networks indicate which regions are most highly connected. (J) The top node betweenness values in descending order for the CT (white, top) and IS (yellow, bottom) networks. (K) Volcano plot of the Pearson correlation differences (rIS – rCT) for all individual regional connections against their p-values calculated from a permutation analysis. Points intersecting or within the upper left or right quadrant represent the regional relationships with the greatest change (|correlation difference| >1), that were most significant (p < 0.01). (L) A parallel coordinate plot highlighting individual significantly changed regional correlations between groups, as well as the direction of their change. (M–P) Trajectories of global c-Fos+ network topology metrics of mean degree, mean efficiency, mean betweenness centrality, and mean clustering coefficients are calculated based off a wide range of possible significance thresholds. *p < 0.05, ***p < 0.001. Error bars represent ± SEM; n = 5 mice for the CT group and n = 6 for the IS group.
Figure 5—figure supplement 6
Differential co-labeled/c-Fos+ proportions across all mapped regions.
Co-labeled/c-Fos+ proportions between context trained (CT, white bars) or inescapable shock (IS, yellow bars) mice across all regions mapped. Subregion activity expression patterns are organized by parent anatomical divisions. Error bars represent ± SEM. OLF, olfactory areas; HPF, hippocampal formation; CTXsp, cortical subplate; CNU, cerebral nuclei; TH, thalamus; HY, hypothalamus; MB, midbrain; HB, hindbrain. Error bars represent ± SEM; n = 5 mice for the CT group and n = 6 for the IS group.
Author response image 1
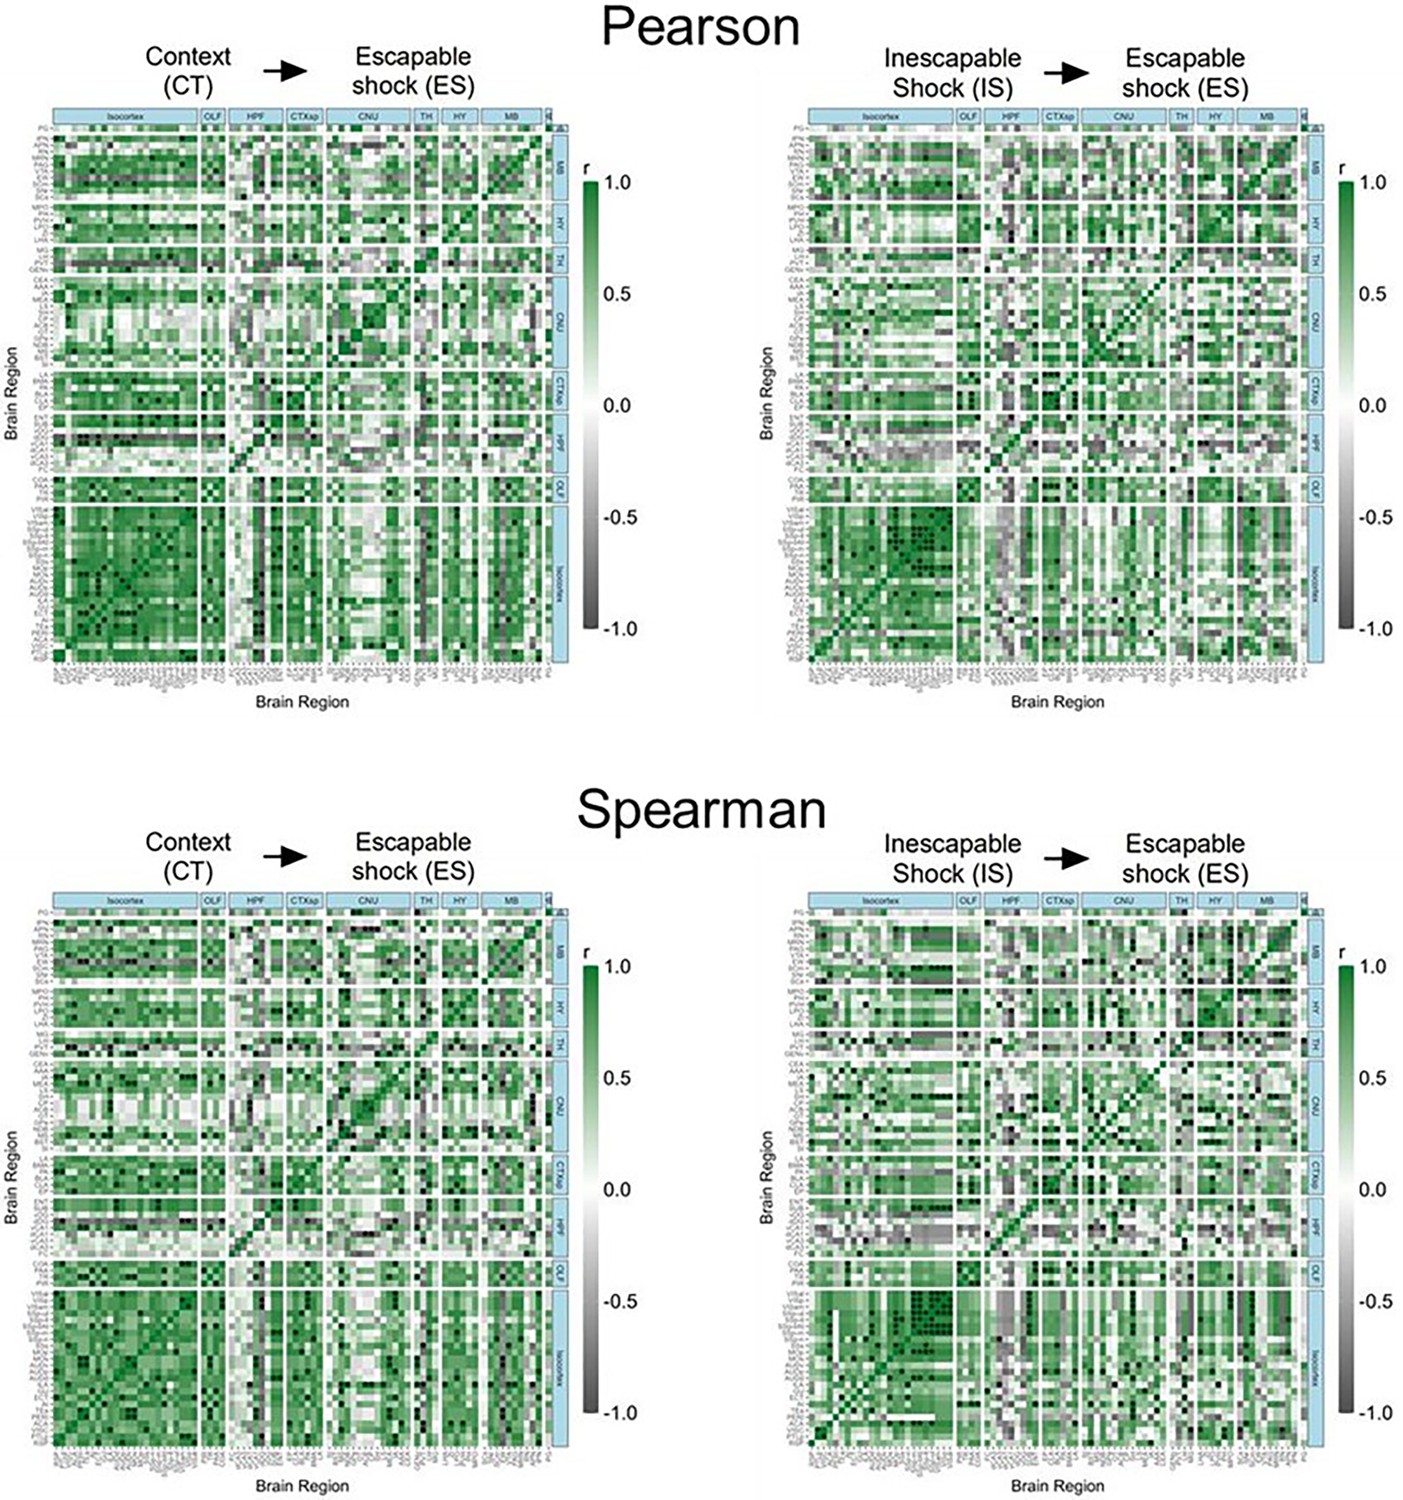
Pearson and Spearmen regional correlations of eYFP+ ensembles activity in the CT and IS groups.
Tables
Key resources table
| Reagent type (species) or resource | Designation | Source or reference | Identifiers | Additional information |
|---|---|---|---|---|
| Strain, strain background (mouse, male) | 129S6/SvEv | Taconic | RRID:MGI:3044417 129S6/SvEvTac | |
| Genetic reagent (mouse) | ArcCreERT2(+) × eYFP | Denny et al., 2014; Srinivas et al., 2001 | RRID:IMSR_JAX:039977 (Stock no. 039977); RRID:IMSR_JAX:006148 (Stock no. 006148) | Bred in-house on 129S6/SvEv background |
| Antibody | anti-GFP (chicken polyclonal) | Abcam, Cambridge, MA | RRID:AB_2936447, Cat.#ab13970 | IF (1:2000) |
| Antibody | IgG anti-c-Fos (Rabbit polyclonal) | SySy, Goettingen, Germany | RRID:AB_2231974, Cat.#226 003 | IF (1:5000) |
| Antibody | Alexa 647 (conjugated Donkey Anti-Rabbit IgG) | Life Technologies, Carlsbad, CA | RRID:AB_2536183, Cat.#A-31573 | IF (1:500) |
| Antibody | Cy2 (conjugated Donkey Anti-Chicken IgG) | Jackson ImmunoResearch, West Grove, PA | RRID:AB_2340370, Cat.#703-225-155 | IF (1:250) |
| Chemical compound, drug | 4-Hydroxytamoxifen | Sigma-Aldrich, St. Louis, MO | Cat.#H6278 | |
| Software, algorithm | ImageJ | http://fiji.sc/ | (v.1.52p) | |
| Software, algorithm | R | https://www.r-project.org/ | (v 3.6.3) | |
| Software, algorithm | RStudio | https://posit.co/download/rstudio-desktop/ | (2022.07.2) | |
| Software, algorithm | SMARTTR | https://github.com/mjin1812/SMARTTR, copy archived at Jin and Ogundare, 2025 | Maintainer: Michelle Jin (mj2947@cumc.columbia.edu) | |
| Other | Fluoromount G | Electron Microscopy Sciences, Hatfield, PA | RRID:AB_2572296, Cat.#17984-25 | See Immunohistochemistry section |
Additional files
-
Supplementary file 1
Statistical analysis summary for all behavioral tests.
- https://cdn.elifesciences.org/articles/101327/elife-101327-supp1-v1.xlsx
-
Supplementary file 2
Comprehensive list of acronyms used.
- https://cdn.elifesciences.org/articles/101327/elife-101327-supp2-v1.xlsx
-
Supplementary file 3
Statistical analysis summary for targeted brain region analyses.
- https://cdn.elifesciences.org/articles/101327/elife-101327-supp3-v1.xlsx
-
Supplementary file 4
Statistical analysis summary for eYFP activity across all mapped regions.
False discovery rate correction of p-values can be found under the p.adj column.
- https://cdn.elifesciences.org/articles/101327/elife-101327-supp4-v1.xlsx
-
Supplementary file 5
Statistical analysis summary for c-Fos activity across all mapped regions.
False discovery rate correction of p-values can be found under the p.adj column.
- https://cdn.elifesciences.org/articles/101327/elife-101327-supp5-v1.xlsx
-
Supplementary file 6
Statistical analysis summary for reactivation proportion (co-labeled cells/eYFP+ cells) across all mapped regions.
False discovery rate correction of p-values can be found under the p.adj column.
- https://cdn.elifesciences.org/articles/101327/elife-101327-supp6-v1.xlsx
-
Supplementary file 7
Statistical analysis summary for proportion of reactivation activity (co-labeled cells/c-Fos+ cells) across all mapped regions.
False discovery rate correction of p-values can be found under the p.adj column.
- https://cdn.elifesciences.org/articles/101327/elife-101327-supp7-v1.xlsx
-
Source code 1
Batch creation of TIF files.
- https://cdn.elifesciences.org/articles/101327/elife-101327-code1-v1.zip
-
Source code 2
Batch creation of maximum projection images.
- https://cdn.elifesciences.org/articles/101327/elife-101327-code2-v1.zip
-
Source code 3
Batch creation of segmentation of c-Fos+ cells.
- https://cdn.elifesciences.org/articles/101327/elife-101327-code3-v1.zip
-
Source code 4
Batch creation of segmentation of eYFP+ cells.
- https://cdn.elifesciences.org/articles/101327/elife-101327-code4-v1.zip
-
Source code 5
Batch detection of co-labeled cells.
- https://cdn.elifesciences.org/articles/101327/elife-101327-code5-v1.zip
-
MDAR checklist
- https://cdn.elifesciences.org/articles/101327/elife-101327-mdarchecklist1-v1.docx
Download links
A two-part list of links to download the article, or parts of the article, in various formats.
Downloads (link to download the article as PDF)
Open citations (links to open the citations from this article in various online reference manager services)
Cite this article (links to download the citations from this article in formats compatible with various reference manager tools)
A SMARTTR workflow for multi-ensemble atlas mapping and brain-wide network analysis
eLife 13:RP101327.
https://doi.org/10.7554/eLife.101327.3


