Responses to membrane potential-modulating ionic solutions measured by magnetic resonance imaging of cultured cells and in vivo rat cortex
- Department of Electrical and Computer Engineering, Seoul National University, Republic of Korea
- Department of Physiology, Sungkyunkwan University School of Medicine, Republic of Korea
- Department of Biomedical Engineering, Sungkyunkwan University, Republic of Korea
- Department of Intelligent Precision Healthcare Convergence, Sungkyunkwan University, Republic of Korea
- National Cancer Center, Republic of Korea
eLife Assessment
The authors show MRI relaxation time changes that are claimed to originate from cell membrane potential changes. This would be a substantial contribution if true because it may provide a mechanism whereby membrane potential changes could be inferred noninvasively. However, the membrane potential manipulations applied here are performed on a slow time scale and are known to induce cell swelling. Cell swelling has been previously shown to affect relaxation time. Experiments could be performed to rule out this hypothesis, but the authors have chosen not to perform these experiments. The study is therefore useful, but the evidence is incomplete.
https://doi.org/10.7554/eLife.101642.3.sa0Significance of the findings:
Useful: Findings that have focused importance and scope
- Landmark
- Fundamental
- Important
- Valuable
- Useful
Strength of evidence:
Incomplete: Main claims are only partially supported
- Exceptional
- Compelling
- Convincing
- Solid
- Incomplete
- Inadequate
During the peer-review process the editor and reviewers write an eLife Assessment that summarises the significance of the findings reported in the article (on a scale ranging from landmark to useful) and the strength of the evidence (on a scale ranging from exceptional to inadequate). Learn more about eLife Assessments
Abstract
Membrane potential plays a crucial role in various cellular functions. However, existing techniques for measuring membrane potential are often invasive or have limited recording depth. In contrast, MRI offers noninvasive imaging with desirable spatial resolution over large areas. This study investigates the feasibility of utilizing MRI to detect responses of cultured cells and in vivo rat cortex to membrane potential-modulating ionic solutions by measuring magnetic resonance parameters. Our findings reveal that depolarizing (or hyperpolarizing) ionic solutions increase (or decrease) the T2 relaxation time, while the ratio of bound to free water protons shows the opposite trend. These findings also suggest a potential approach to noninvasively detect changes in membrane potential using MRI.
Introduction
Membrane potential is a fundamental property of all living cells, influencing crucial cell functions (Abdul Kadir et al., 2018) such as neuronal and myocyte excitability, volume control, cell proliferation, and secretion. In the fields of neuroscience, membrane potential is of significant importance, as neural activities arise from the dynamic propagation of this electric potential. From a clinical perspective, deviations from normal membrane potential levels contribute to various diseases, including seizures (Jefferys, 1995), arrhythmia (Helfant, 1986), and hypoglycemia (Kane et al., 1996). Given its scientific and clinical importance, effective methods to detect changes in membrane potential have long been sought.
The intracellular recording technique using sharp glass electrodes is a commonly used method to detect changes in membrane potential (Ling and Gerard, 1949; Neher and Sakmann, 1976). It provides real-time absolute recordings of membrane potential. Optical imaging is another major approach to detect changes in membrane potential. Voltage-sensitive dyes enable voltage imaging at the cellular level (Tasaki et al., 1968). Fluorescent calcium indicators detect calcium transients associated with neuronal activation (Tsien, 1980). Label-free optical imaging techniques (Zhou et al., 2021) utilize various contrast mechanisms such as cell membrane deformation, which are directly coupled with changes in membrane potential. Despite their efficacy, these methods have limitations when applied to intact biological systems due to their invasive nature, requiring procedures such as craniotomy.
As noninvasive techniques for directly or indirectly detecting brain activation in vivo, several imaging modalities have been developed, including EEG (Berger, 1929), MEG (Cohen, 1968), and MRI (Mansfield, 1977). EEG and MEG detect electric potentials on the scalp and extracranial magnetic fields, respectively, which are directly induced by neuronal activity in the brain. Although these techniques are noninvasive and provide excellent temporal resolution of milliseconds or less, they are constrained by shallow imaging depth and spatial localization challenges (He et al., 2018).
In contrast, MRI enables noninvasive imaging with good spatial resolution of millimeters over a large brain volume, making it an appropriate tool for in vivo functional brain imaging. To date, the mainstream of functional MRI (fMRI) utilizes hemodynamic responses driven by brain activation, such as the blood oxygen level-dependent (BOLD) effect (Ogawa et al., 1990). However, while the BOLD contrast mechanism reflects dynamic changes in neuronal activity through neurovascular coupling, it provides inherently indirect and relatively slow, hemodynamic-responsive information of brain function (Logothetis et al., 2001). On the other hand, many studies have attempted to explore the possibility of using MRI to directly detect neuronal activity (Bandettini et al., 2005; Roth, 2023). These studies utilized neuronal current-dependent signal phase shifts (Petridou et al., 2006; Wijesinghe and Roth, 2009; Sundaram et al., 2016) and magnitude decay (Kamei et al., 1999; Xiong et al., 2003; Chow et al., 2006; Truong et al., 2019), the Lorentz effect (Truong and Song, 2006), high temporal resolution (Sundaram et al., 2010; Toi et al., 2022), ghost artifacts (Paley et al., 2009), or cell swelling (Le Bihan et al., 2006; Bai et al., 2016), while concerns about sensitivity exist (Chu et al., 2004; Konn et al., 2004; Parkes et al., 2007; Miller et al., 2007; Roth and Basser, 2009; Luo et al., 2009).
In this study, we investigated the possibility of using MRI to detect membrane potential changes induced by modulating ionic solutions. Specifically, we explored how T2 relaxation time and magnetization transfer (MT) correlate with membrane potential changes, both in vitro and in vivo. In vitro experiments utilized two homogeneous and electrically non-active cells, that is neuroblastoma (SH-SY5Y) and leukemia (Jurkat) cell lines, providing a controlled environment free from hemodynamic effects. This aided in accurately evaluating changes in MR parameters with membrane potential. In vivo experiments, conducted on a rat model with a craniotomy-exposed cortex, aimed to reproduce the in vitro findings.
Results
In vitro changes in MR parameters induced by membrane potential
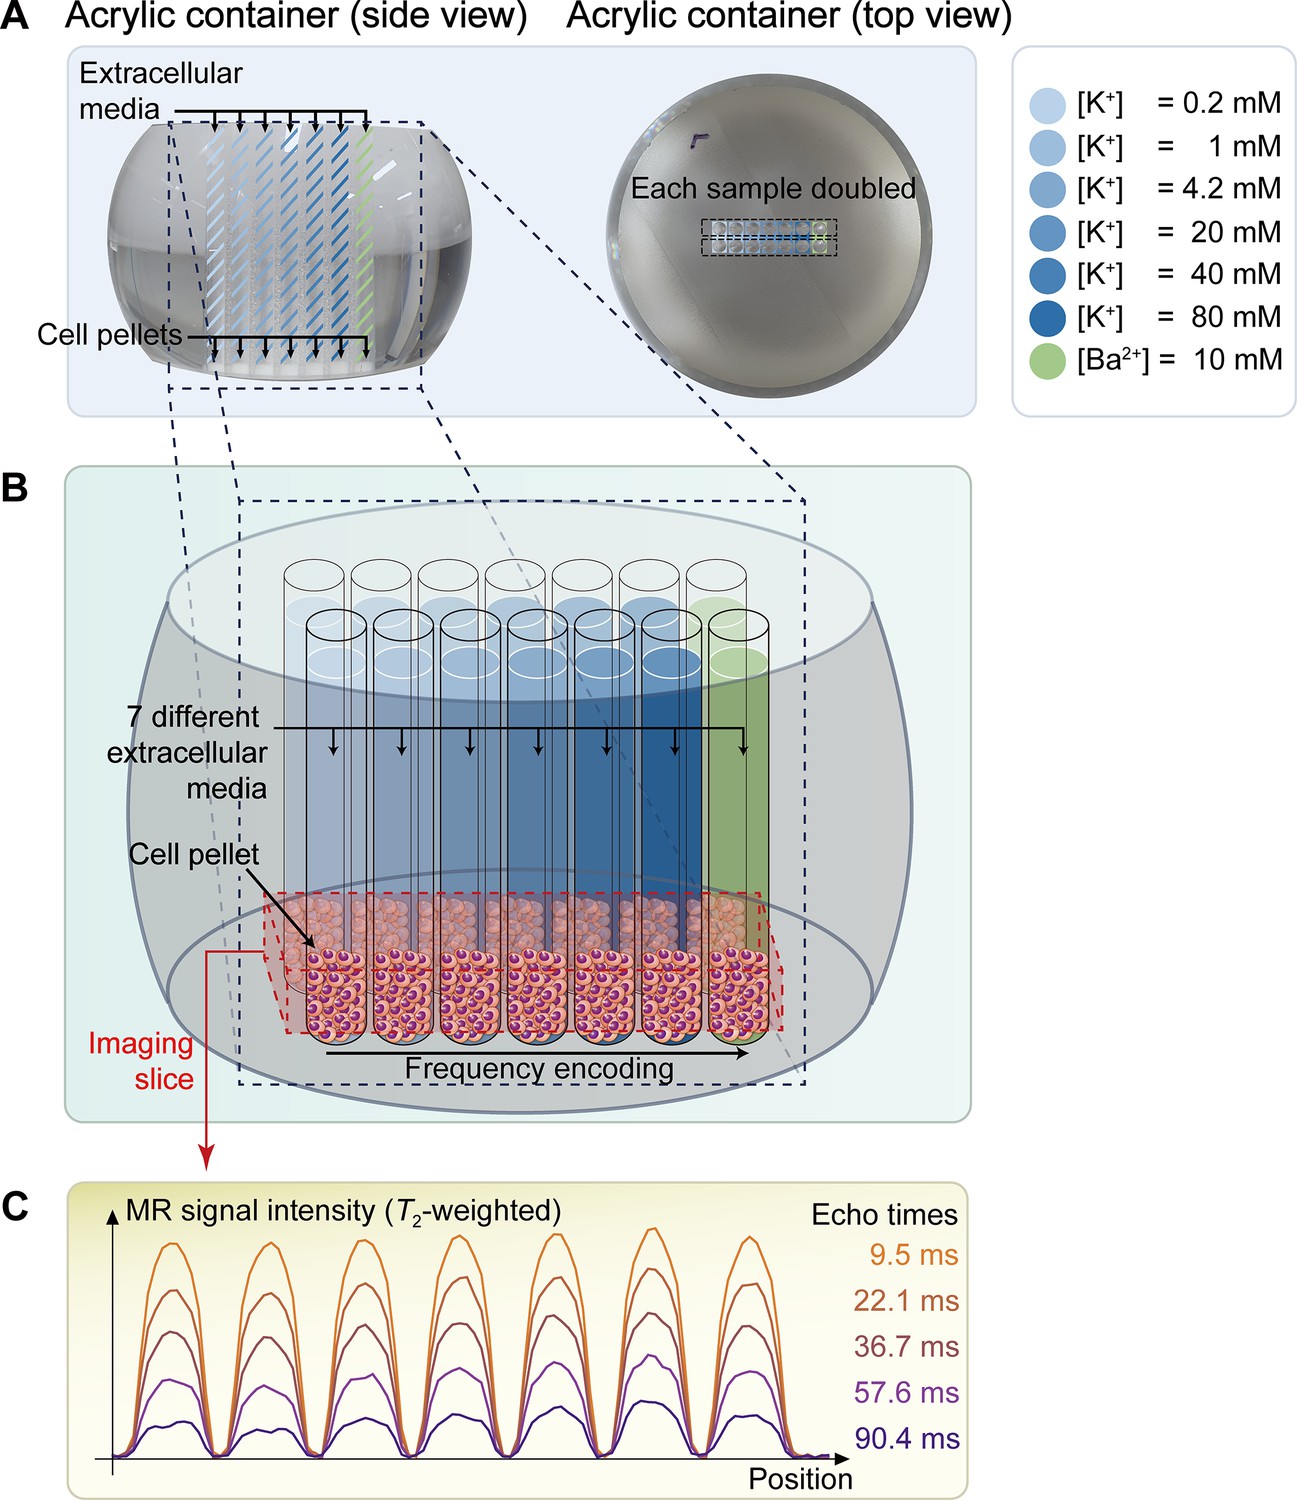
A non-excitable neuroblastoma cell line, SH-SY5Y, was selected to investigate the relationship between MR parameters and membrane potential modulated by ionic solutions. After culturing SH-SY5Y cells, they were suspended in extracellular media with various potassium ion concentrations ([K+]), while maintaining constant osmolarity by adjusting [Na+]. As the control condition, [K+]=4.2 mM was selected. For depolarization conditions, [K+]=20, 40, and 80 mM were used. For hyperpolarization conditions, [K+]=0.2 and 1 mM were used. The suspended cells were concentrated with centrifugation in an acrylic container and scanned in a 9.4T preclinical MRI system. The imaging slice was positioned 0.5 mm below the pellet-extracellular media interface to ensure that signals were acquired from the cell pellet. Under each condition, T2 and MT parameters such as pool size ratio (PSR) and magnetization transfer rate (kmf) were measured (Figure 1). The PSR value represents the ratio of hydrogen protons in macromolecules and free water, and kmf represents the magnetization transfer rate of hydrogen protons from macromolecules to free water. In addition, the membrane potential of SH-SY5Y cells in each condition was separately measured via patch clamp recording.
Figure 1
The schematic diagram of the in vitro experiment.
(A) The picture on the left displays a side view of a double-sided cut spherical acrylic container with fabricated wells filled with extracellular media and cell pellets. As depicted in the top-view picture on the right, fourteen wells (matrix = 2 × 7) were created on the acrylic container, allowing each of the seven samples with six different K+ concentrations ([K+]=0.2–80 mM) and one Ba2+ concentration ([Ba2+]=10 mM) to be doubled in the same column for improved signal-to-noise ratio (SNR) in MR signal acquisition. (B) The image illustrates the configuration after loading cells into the wells and pelleting them at the bottom of the wells. The imaging slice was positioned 0.5 mm below the pellet-media interface to acquire signals predominantly from the cell pellets. (C) Representative one-dimensional T2-weighted MR signals with 5 selected echo times out of a total of 50 acquired echo times.
The changes of T2, PSR, and kmf in SH-SY5Y cells when the membrane potential (Vm) was modulated by varying [K+] are shown in Figure 2, alongside the actual Vm measured via patch clamp recordings. We conducted statistical analyses to assess the effect of changes in Vm from the control condition (ΔVm) on the MR parameters. A linear mixed-effect model was applied to account for inter-sample variability and repeated measurements. This model included MR parameters as dependent variables, ΔVm as a fixed effect, and cell batch as a random effect. The analysis yielded the following relationships:
(1)
(2)
(3)
Figure 2
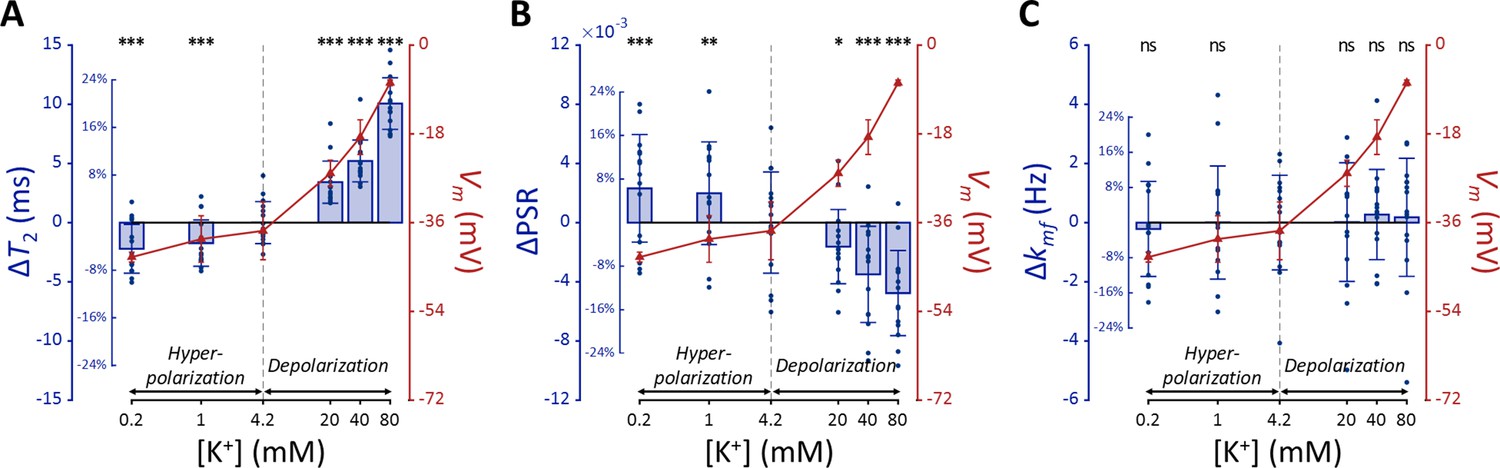
MR parameters and membrane potential (Vm) of SH-SY5Y cells versus extracellular K+ concentrations ([K+]).
Changes in (A) T2, (B) PSR, and (C) kmf are displayed with blue bars (n=15). Membrane potentials are plotted with red triangles (n=3). The abscissa is in logarithmic scale. Error bars denote standard deviation. Statistical significance of changes in MR parameters is marked with asterisks (ns: p>0.05, *: p<0.05, **: p<0.01, ***: p<0.001).
The effects of ΔVm on T2 and PSR were both significant (p<0.0001), indicating an increase in T2 and a decrease in PSR during depolarization at high [K+], with the opposite trend during hyperpolarization at low [K+]. On the other hand, the effect of ΔVm on kmf was not significant (P=0.360).
Subsequent post-hoc analyses compared each experimental condition to the control using Dunnett’s test to account for multiple comparisons (Figure 2). During depolarization induced by the highest [K+] (80 mM, ΔVm = 30.0 mV), changes in MR parameters were observed as a 20.0% increase in T2 (ΔT2=10.1ms, p<0.0001) and a 12.9% decrease in PSR (ΔPSR = −0.00476, p<0.0001). Conversely, during hyperpolarization induced by the lowest [K+] (0.2 mM, ΔVm = −5.33 mV), T2 decreased by 4.40% (ΔT2 = −2.21ms, p<0.0001) and PSR increased by 6.28% (ΔPSR = 0.00231, p<0.0005). However, changes in kmf were not significant across all conditions (p>0.05). These findings from in vitro SH-SY5Y cell experiments suggest that MR parameters, such as T2 and PSR, exhibit sufficient sensitivity to detect alterations in membrane potential induced by varying [K+], including both depolarization and hyperpolarization.
Using a K+ channel blocker
In this experiment, we investigated whether depolarization induced by altering potassium permeability with barium ions (Ba2+) would affect MR parameters similarly to depolarization induced by varying [K+], thereby further validating our findings. For this purpose, we administered barium ions (Ba2+) at a concentration of 10 mM to induce depolarization while maintaining constant osmolarity by adjusting [Na+]. Ba2+ was chosen because it inhibits several types of two-pore-domain potassium channels (Lesage and Lazdunski, 2000; Ma et al., 2011), which predominantly regulate the resting membrane potential. Previous studies have confirmed that Ba2+ depolarizes the membrane potential in SH-SY5Y and Jurkat cells (Vaughan et al., 1995; Pottosin et al., 2008).
The Ba2+-induced depolarization condition was compared with K+-induced depolarization and hyperpolarization conditions (Figure 3). To compare the effects of [Ba2+] and [K+] on MR parameters, a linear mixed-effect model was utilized. This model included MR parameters as dependent variables, ΔVm and its interaction with a group variable (indicating whether ΔVm was induced by [Ba2+] or [K+]) as fixed effects, and cell batch as a random effect. This analysis revealed no significant interactions for all MR parameters assessed (p=0.182 for T2, p=0.788 for PSR, and p=0.0890 for kmf). These findings suggest that changes in T2 and PSR by membrane potential do not depend on the specific method of altering the membrane potential, whether by varying [K+] or applying [Ba2+]. This implies that if the changes in MR parameters observed with varying [K+] were not primarily due to membrane potential but were due to a unique K+-related mechanism, then experiments using [Ba2+] would not result in similar changes.
Figure 3
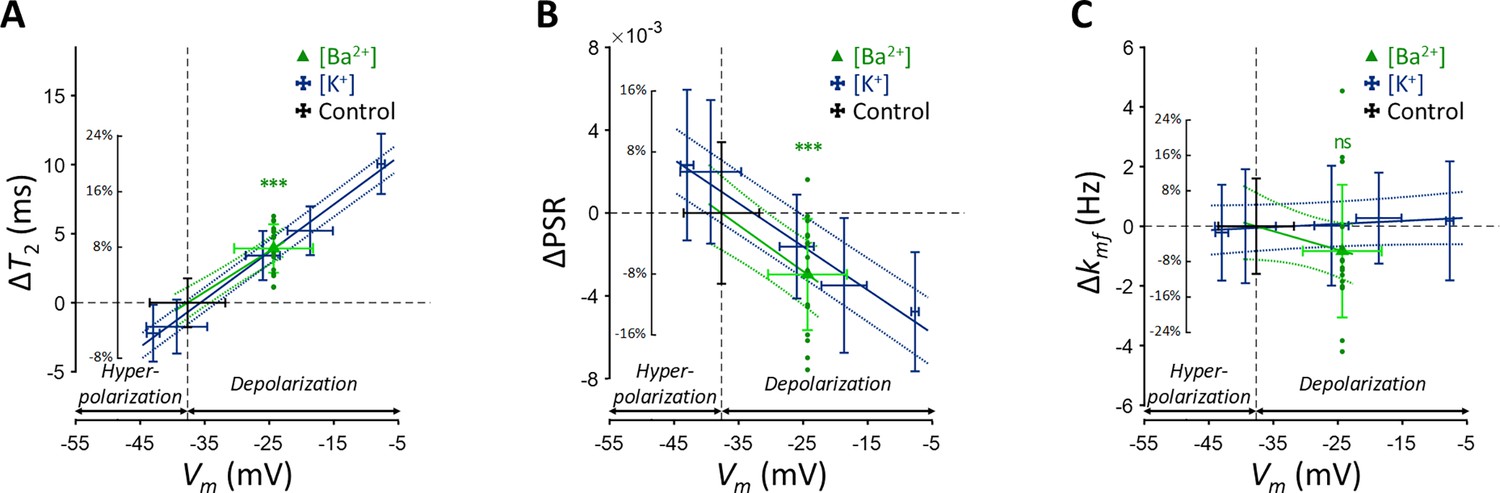
Changes in (A) T2, (B) PSR, and (C) kmf of SH-SY5Y cells across experimental conditions: [K+]=0.2–80 mM (blue cross) and [Ba2+]=10 mM (green triangle), compared to the control condition (black cross).
Data from fifteen experiments (n=15) are displayed. Linear regression lines for [K+] data (blue solid line) and [Ba2+] data (green solid line) are drawn along with dotted lines representing 95% confidence intervals. Error bars denote standard deviation. Statistical significance of changes in MR parameters with [Ba2+]=10 mM is marked with asterisks (ns: p>0.05, *: p<0.05, **: p<0.01, ***: p<0.001).
Subsequent post-hoc analyses compared the [Ba2+]-induced depolarization to the control using Dunnett’s test to account for multiple comparisons (Figure 3). In response to depolarization caused by [Ba2+]=10 mM, T2 increased by 7.82% (ΔT2=3.93ms, p<0.0001) and PSR decreased by 8.06% (ΔPSR = −0.00297, p<0.0001). The change in kmf was not significant (Δkmf = −0.832 Hz, p=0.263). The depolarization of membrane potential induced by [Ba2+] was measured as ΔVm = 13.3 mV by patch clamp recording.
Using another cell type
To investigate whether membrane potential-modulating ionic solutions produce similar changes in MR parameters across different cell types, we assessed another cell line, Jurkat, under the same experimental conditions applied to SH-SY5Y cells. These conditions included a control condition ([K+]=4.2 mM), hyperpolarization under decreased [K+] conditions ([K+]=0.2 and 1 mM), depolarization under increased [K+] conditions ([K+]=20, 40, and 80 mM), and a Ba2+-induced depolarization condition ([Ba2+]=10 mM), all maintaining consistent osmolarity by adjusting [Na+].
Each experimental condition was compared to the control using Dunnett’s test to account for multiple comparisons (Figure 4). As observed with SH-SY5Y cells, Jurkat cells showed significant positive changes in T2 and negative changes in PSR under increased [K+] conditions. For example, at [K+]=80 mM, T2 increased by 16.9% (ΔT2=9.26ms, p<0.0001), PSR decreased by 21.9% (ΔPSR = −0.00347, p<0.01). In contrast, during hyperpolarization at the lowest [K+]=0.2 mM, T2 decreased by 18.1% (ΔT2 = −9.93ms, p<0.0001), whereas PSR increased by 17.6% (ΔPSR = 0.00280, p<0.05). The depolarization induced by [Ba2+]=10 mM resulted in a similar pattern, with T2 increasing by 11.5% (ΔT2=6.3ms, p<0.0005), although the decrease in PSR was not significant (ΔPSR = −0.00212, p=0.211). Changes in kmf remained non-significant across all conditions (p>0.05). In summary, these findings indicate that detecting membrane potential changes induced by ionic solutions using MR parameters such as T2 and PSR is not specific to a single cell type, although the magnitude of these changes may differ between cell types.
Figure 4
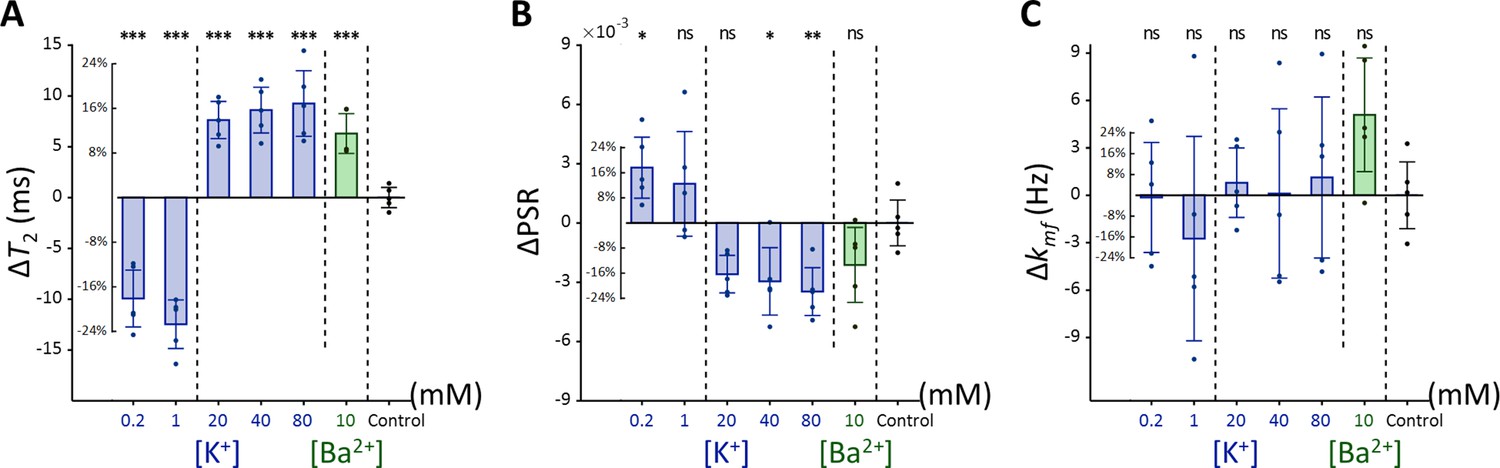
Changes in (A) T2, (B) PSR, and (C) kmf of Jurkat cells across experimental conditions: [K+]=0.2–80 mM (blue bar) and [Ba2+]=10 mM (green bar), compared to the control condition of [K+]=4.2 mM (n=5).
Error bars denote standard deviation. Statistical significance of changes in MR parameters is marked with asterisks (ns: p>0.05, *: p<0.05, **: p<0.01, ***: p<0.001).
In vivo changes in T2 by membrane potential
The relationship of T2 values and membrane potential modulated by [K+], observed in the aforementioned SH-SY5Y and Jurkat cell studies, was further explored in an in vivo rat model to validate these findings under physiological conditions. As depicted in Figure 5, a craniotomy was performed to expose a 3-mm-diameter region of the rat cerebral cortex, followed by perfusion with artificial cerebrospinal fluid (aCSF) to modulate the membrane potential. Hemodynamic responses were pharmacologically suppressed. MRI scans were performed using a 7T preclinical MRI system to measure T2 in the exposed cortical area. A total of seven rats were used in the experiment that involved modulation of [K+]. The experimental protocol included sequential application of four conditions, each lasting 12 min: a baseline condition at [K+]=3 mM, a depolarization condition at [K+]=40 mM, further depolarization at [K+]=80 mM, followed by a recovery condition using baseline aCSF. The recovery condition was applied to two of the seven rats. To distinguish the effect of aCSF perfusion on T2 from the effect of changes in membrane potential, a control experiment was also conducted using only baseline aCSF for the entire duration (48 min) with another group of five rats.
Figure 5
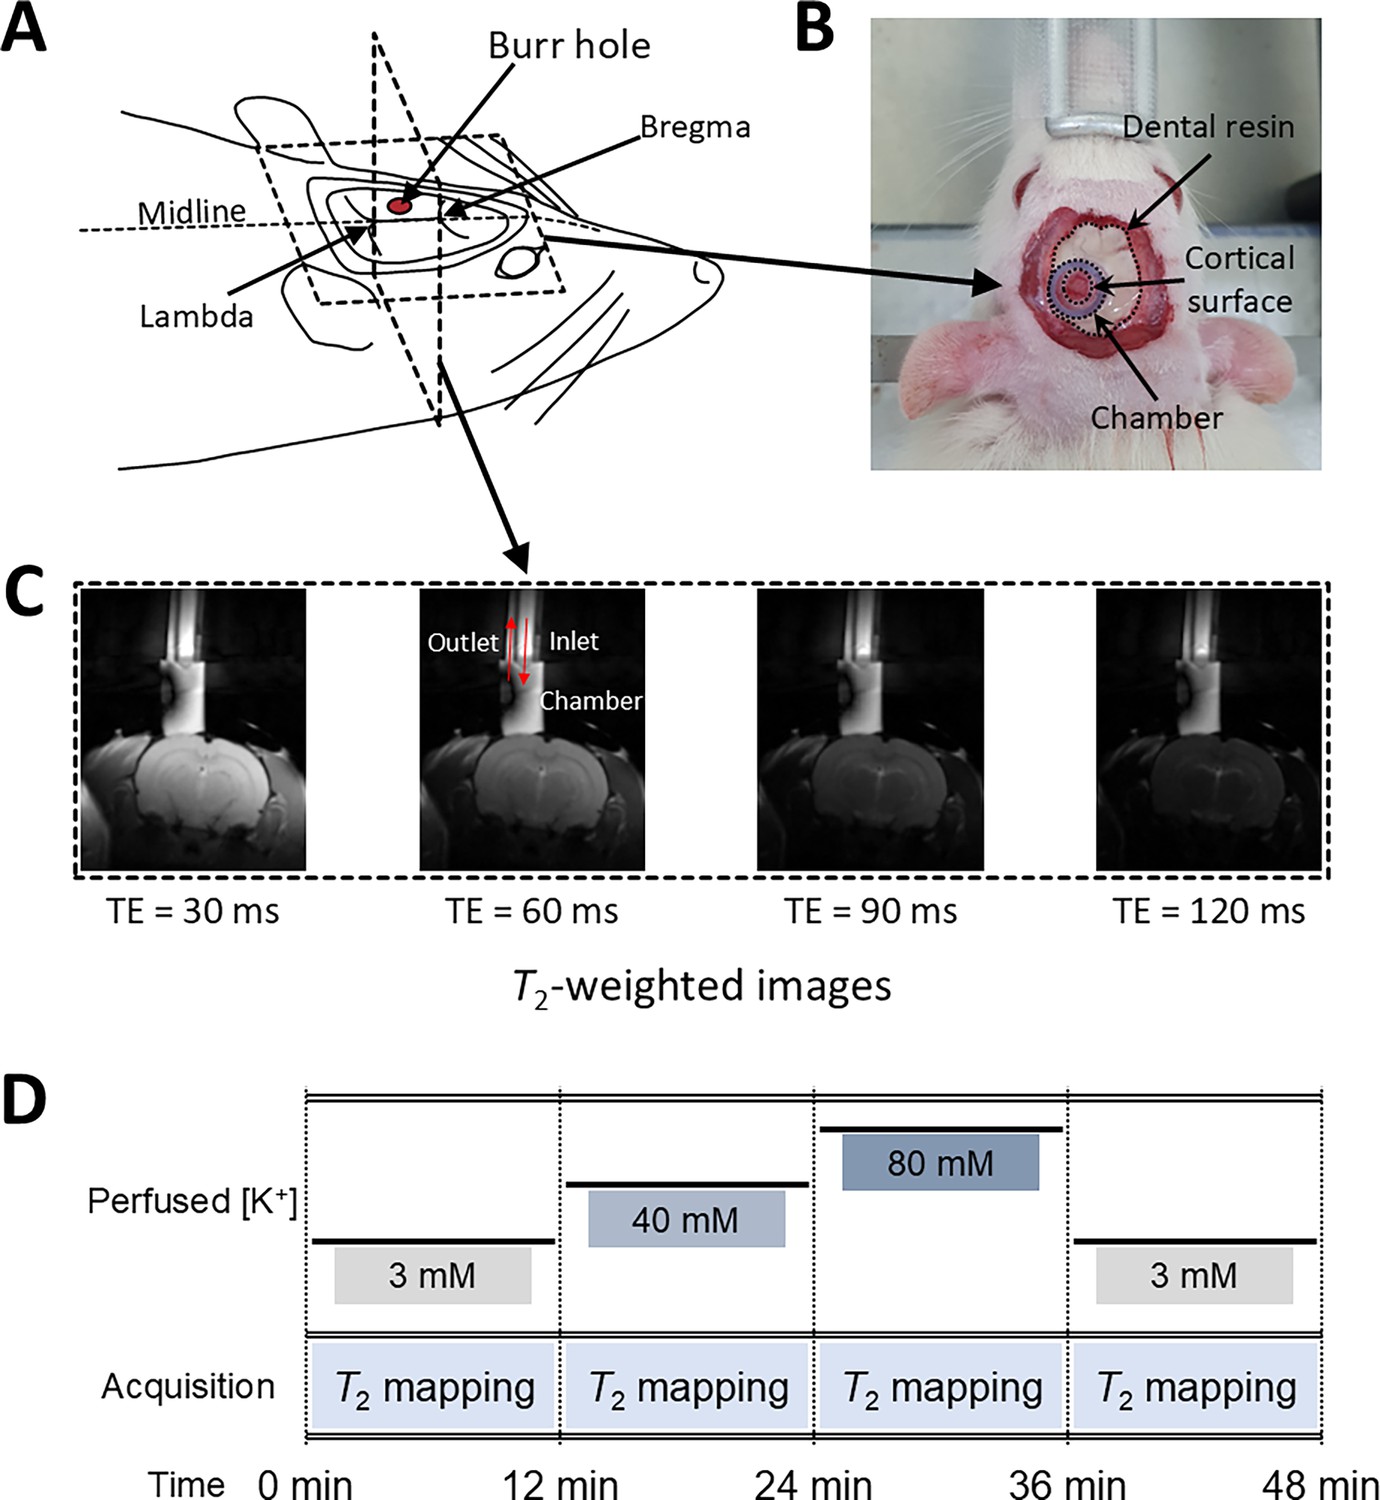
Experimental setup for in vivo manipulation of membrane potential.
(A) A schematic diagram of the rat head post-craniotomy, showing the burr hole centered at 2.5 mm anterior and 2.0 mm lateral to the lambda. (B) Photograph of the rat head with a cylindrical chamber fixed over the burr hole, filled with artificial cerebrospinal fluid. (C) A representative series of T2-weighted MR images for T2 mapping. The chamber was connected to inlet and outlet perfusion tubes. (D) The experimental paradigm of the in vivo rat MR imaging. Four conditions were sequentially applied: control, depolarization, further depolarization, and recovery. Each condition lasted 12 min during which T2 mapping was conducted.
In Figure 6A, a representative T2 map is displayed with an enlarged image defining the ROI beneath the perfusion chamber (width = 1.8 mm, depth = 0.6 mm). The average T2 value within this ROI was estimated from the spatially averaged multi-echo spin-echo signal. A detailed analysis of the quality of these T2 maps is presented in Appendix 3. Changes in T2 value (ΔT2) were statistically analyzed using a linear mixed-effect model to account for inter-sample variability and repeated measurements. This model included ΔT2 as a dependent variable, elapsed time and its interaction with the experiment type (i.e. [K+]-modulation or control) as fixed effects, and a random effect for inter-sample variability.
Figure 6
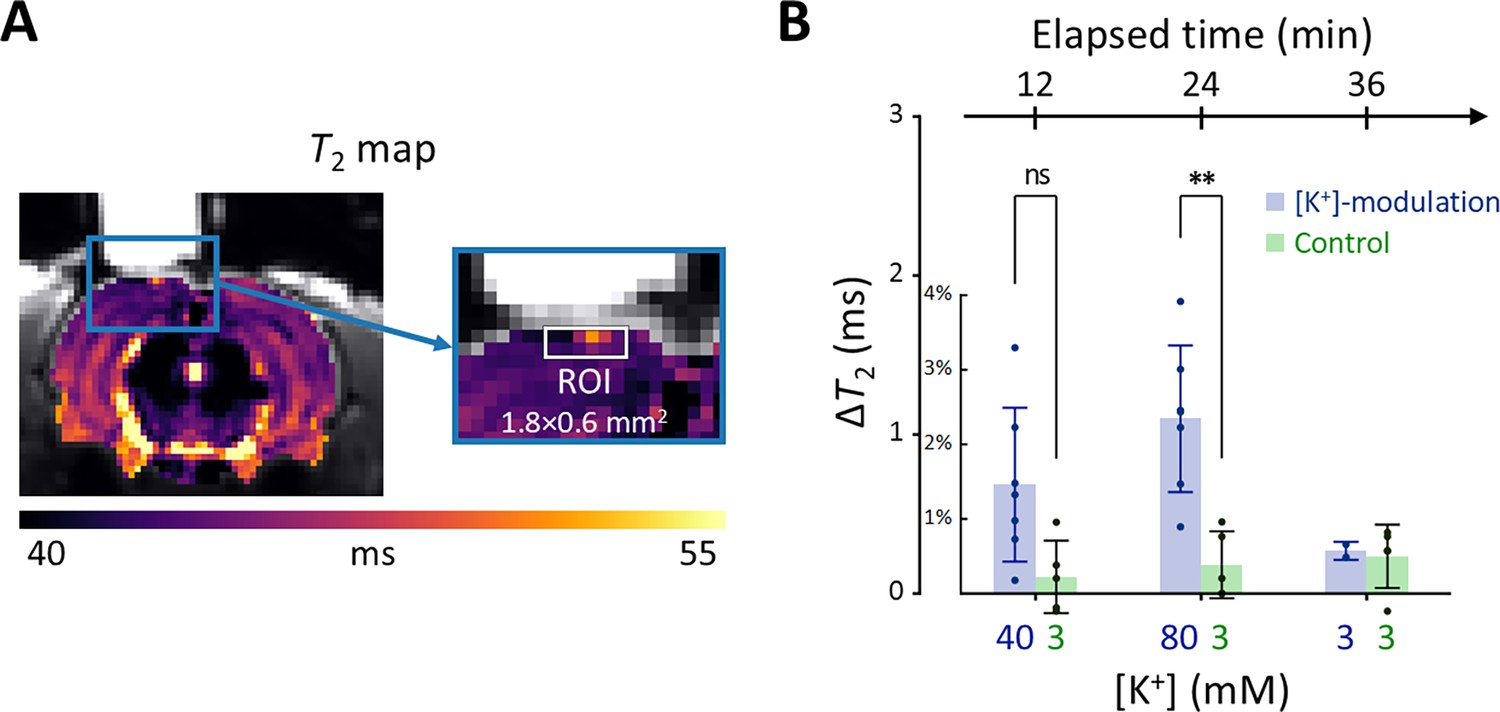
Results of the in vivo experiment results in rat models.
(A) A representative T2 map from a single rat with an enlarged image depicting the ROI for estimating average T2 in the exposed cortical area, marked by a white rectangle (width = 1.8 mm, depth = 0.6 mm). (B) The changes in T2 values within the ROI is plotted against elapsed time from the initial conditions. [K+] in the perfused artificial cerebrospinal fluid are indicated on the bottom abscissa. Results from the [K+]-modulation experiments are shown with blue bars, and those from the control experiments are shown with green bars. Statistical significance of the T2 changes is marked with asterisks (ns: p > 0.05, *: p < 0.05, **: p< 0.01).
Figure 6B shows the results of the statistical analysis. ΔT2 values were plotted against elapsed time for [K+]-modulation and control experiments. After 12 mins from the initial condition, T2 increased by 1.46% (ΔT2=0.684ms) in the [K+]-modulation experiment ([K+]=40 mM) and by 0.223% (ΔT2=0.104ms) in the control experiment ([K+]=3 mM); the ΔT2 difference (=0.580ms) between these experiments was not statistically significant (p=0.0711). After 24 min, T2 increased by 2.34% (ΔT2=1.10ms) in the [K+]-modulation experiment ([K+]=80 mM) and by 0.386% (ΔT2=0.181ms) in the control experiment ([K+]=3 mM), with a significant difference in ΔT2 (=0.918ms) between them (p=0.00172). Due to the limited sample size in the recovery phase (n=2 out of 7 for [K+]-modulation), comparisons between experiments were not conducted for this recovery phase.
Our observations indicate that in vivo manipulation of membrane potential results in similar trends of T2 changes as those observed in vitro, albeit with a smaller magnitude in the rat cortex. This discrepancy may be attributed to several factors: [K+]-modulation affecting only a small portion of cells within the ROI; limited diffusion of aCSF through the leptomeninges; removal of excessive K+ through clearing mechanisms; and differences in cell types (see the Discussion for more details).
Discussion
In this study, we demonstrated that MR parameters, specifically T2 relaxation time and pool size ratio (PSR), can detect responses to membrane potential changes modulated by ionic solutions. Our in vitro experiments with cultured cells were designed to exclude physiological factors such as hemodynamic responses and respiration. We observed that depolarization increases T2 and decreases PSR, while hyperpolarization has the opposite effect. In vivo, we pharmacologically suppressed hemodynamic responses to minimize their impact on T2 measurements. The trend of T2 dependence on membrane potential in vivo was consistent with in vitro findings. However, the magnitude of T2 changes in rat cortex was approximately one-ninth of that observed in SH-SY5Y cells in vitro at [K+]=80 mM.
Other studies have also reported MR-detectable changes in response to extracellular [K+] modulation. For instance, research on spreading depression, which was induced by significantly high [K+] (~1 M) applied topically to rat cortex, has revealed detectable changes in T1, T2, and magnetization transfer ratio changes (Stanisz et al., 2002) and spin-lock fMRI signals (Autio et al., 2014). Similarly, increased [K+] has been studied in vitro with brain slices, linking cell volume changes to proton density-weighted MR signal changes (Stroman et al., 2008). T2 mapping in Jurkat cells with increased [K+] conditions has also been investigated (Toi et al., 2022) and linked to cell volume change (Phi Van et al., 2024). Our study complements these findings by employing direct membrane potential measurement via patch clamp, testing additional ionic agents such as Ba2+, and demonstrating the phenomenon in vivo. Further reinforcement of these findings could be achieved by simultaneous recording of cell volume and other cellular characteristics to elucidate the underlying mechanisms more completely.
Interestingly, the MR responses in Jurkat cells differed from those in SH-SY5Y cells. While SH-SY5Y cells showed a near-linear dependence of MR parameters on log [K+], Jurkat cells displayed more step-like behavior. The reasons for this discrepancy remain unclear, but it suggests that the relationship between membrane potential and MR parameters may not strictly follow a simple log [K+] relationship.
Several factors may contribute to discrepancies between in vivo and in vitro results. For instance, the actual extracellular [K+] experienced by cells in the rat cortex may be lower than that of the perfused aCSF due to diffusion-limiting barriers such as the leptomeninges (Bradbury et al., 1972; Filippidis et al., 2012), even after the removal of the dura mater. Additionally, removal of excessive K+ by clearing mechanisms (Walz, 2000; O’Donnell, 2009) may further reduce the [K+] experienced by the cells. Partial volume effects and cell type differences may also contribute to the discrepancy.
From a biophysical perspective, the sensitivity of T2 and PSR to membrane potential likely arises from alterations in cell volume, hydration water, and bulk water. Depolarization or hyperpolarization can lead to cell swelling or shrinking (Lang et al., 1998; Fraser and Huang, 2004; Hoffmann et al., 2009), influencing the proportion of cellular contents within the imaging voxel and thereby affecting MR parameters. Notably, neuronal or glial cell swelling has been proposed as a possible mechanism underlying diffusion fMRI (Le Bihan et al., 2006; Le Bihan, 2012; Mangia et al., 2012) and previous MRI studies (Stroman et al., 2008; Phi Van et al., 2024). Although not as sensitive as T2, our T1 measurements (Appendix 2—figures 1–3) also exhibited similar trends in response to membrane potential changes. Moreover, hydration water, which has a significantly shorter T2 than bulk water due to slower re-orientational and diffusive motions (Mathur-De Vré, 1980), may contribute to the observed MR changes. In particular, the correlation between PSR and membrane potential indicates that depolarization decreases the density of hydration water on the cell membrane within a voxel, thereby reducing PSR and simultaneously increasing T2 due to a corresponding increase in free water, as well as cell swelling. Conversely, hyperpolarization may increase hydration water density, elevating PSR and lowering T2. These interpretations are supported by recent optical studies showing reduced membrane hydration water during depolarization (Didier et al., 2018).
Several challenges and considerations in this study warrants discussion. First, maintaining the desired environment (37 °C and 5% CO2) for in vitro cells during MRI scans is challenging. In addition, intracellular accumulation of Ba2+ in the Ba2+-induced depolarization experiment may affect cellular integrity. In this study, high cell viability (>97.6%) was confirmed using cell viability assays under experimental conditions (Appendix 4—figure 1). Second, differences in T2 value among the extracellular media may bias T2 measurements due to the partial volume effect. However, in this study, the differences in T2 among the extracellular media were found to be negligible compared to the observed T2 changes (Appendix 2—figure 4). Third, while our findings show that membrane potential-modulating ionic solutions can affect MR parameters, it is important to note that these changes do not measure the membrane potential itself. Fourth, other factors such as pH, energy depletion, or extracellular osmolarity may affect MR parameters by altering cell volume. To minimize the effects of these other contributors, we matched osmolarity across all conditions, provided sufficient glucose to prevent energy depletion, and regulated pH levels by buffering with HEPES. Additionally, to mitigate possible changes in intra/extracellular volume fraction changes caused by cell movements, potentially due to agitation, we centrifuged the cells and imaged the bottom portion of the cell pellet, where cell movement was restricted due to close packing. Fifth, in the in vivo study, we attempted to suppress hemodynamic responses through pharmacological means, using a combination of Nω-Nitro-L-arginine and nifedipine, both of which are known to inhibit hemodynamic responses in different ways (Dreier et al., 1995; Redmond et al., 2002), but their effects were not directly confirmed in this study. Future studies that simultaneously evaluate hemodynamic responses would strengthen our conclusions. Finally, our experimental paradigm was based on clamping the membrane potential at a specific level, thus measuring changes in T2 and PSR during static depolarization or hyperpolarization rather than dynamic changes such as those seen during action potentials. Future research could explore temporally varying membrane potential to evaluate the dynamic correlation between membrane potential and MR parameters with high temporal resolution MRI (Sundaram et al., 2010; Toi et al., 2022).
In summary, our study demonstrates that MR parameters such as T2 relaxation time can detect responses to membrane potential-modulating ionic solutions both in vitro and in vivo. This finding proposes a potential approach for noninvasively detecting changes in membrane potential using MRI.
Materials and methods
Key resources table
| Reagent type (species) or resource | Designation | Source or reference | Identifiers | Additional information |
|---|---|---|---|---|
| Strain, strain background (Rattus norvegicus) | Wistar | Orient Bio | Cat #: CrlOri:WI; RRID:RGD_13508588 | |
| Cell line (Homo sapiens) | SH-SY5Y | American Type Cell Collection | Cat #: CRL-2266; RRID:CVCL_0019 | |
| Cell line (Homo sapiens) | Jurkat E6.1 | American Type Cell Collection | Cat #: TIB-152; RRID:CVCL_0367 |
In vitro cell culture
Request a detailed protocolTwo human cell lines were utilized for the experiments: SH-SY5Y, an immortalized neuroblastoma line, and Jurkat, a leukemia cell line. Both cell lines were sourced from the American Type Culture Collection (ATCC), where their identities were authenticated by STR analysis and confirmed to be negative for mycoplasma contamination, as documented in the certificate of analysis provided at the time of purchase. The SH-SY5Y cells were cultured in DMEM/F12 medium supplemented with 10% (v/v) fetal bovine serum (FBS) and 100 U/ml penicillin/streptomycin. The cells were maintained at a constant temperature of 37 °C in a humidified atmosphere containing 5% CO2. Similarly, the Jurkat cells were cultured in RPMI-1640 medium, also supplemented with 10% (v/v) FBS and 100 U/ml penicillin/streptomycin, under the same conditions of temperature and CO2 concentration.
In vitro manipulation of membrane potential with extracellular media
Request a detailed protocolThe baseline extracellular medium was prepared with the following components: KCl = 4.2 mM; NaCl = 145.8 mM; HEPES = 20 mM; glucose = 4.5 g/l; EGTA = 10 µM; pH = 7.2. This baseline medium was considered a control condition for various extracellular media used to adjust membrane potential. Two extracellular media with low K+ concentrations (KCl = 0.2 and 1 mM) were prepared to hyperpolarize the membrane potential. Three extracellular media with high K+ concentrations (KCl = 20, 40, and 80 mM) were prepared to depolarize the membrane potential. A Ba2+ medium containing 10 mM BaCl2 was also prepared to depolarize the membrane potential in a different way, i.e., as a K+ channel blocker. These seven extracellular media were used for both MR imaging and patch clamp recording in vitro. Sodium ion concentrations ([Na+]) in all media were controlled to match the osmolarity with the baseline medium. The composition of all extracellular media is detailed in Appendix 1—table 3.
Preparation of cells for in vitro MR measurement
Request a detailed protocolSH-SY5Y cells were dissociated from their culture plates using 0.5 mM EDTA solution, then concentrated into a pellet (~70 µl) by centrifugation at 250×g for two minutes. The pellet was resuspended in the culture medium and divided evenly into seven aliquots. Each cell suspension was centrifuged and resuspended in each of the seven different media specified in Appendix 1—table 3. Centrifugation and resuspension were repeated three more times to completely clear out the culture medium. Each cell suspension with a different extracellular medium was then loaded into two wells on the same column of an acrylic container with 14 wells (matrix = 2 × 7) and centrifuged again to concentrate into pellets (Figure 1). The acrylic container was purposely formed into a spherical segment to enhance the homogeneity of the static magnetic field (Lee et al., 2020). The preparation of Jurkat cell samples was the same as for the SH-SY5Y cell samples. The preparation required 40–60 min, followed by an incubation period of 20–30 min.
In vitro MRI experiment
Request a detailed protocolIn vitro MRI experiments were performed on a 9.4T MRI system (BioSpec 94/30 USR, Bruker BioSpin) at room temperature. A volume coil with an inner diameter of 86 mm was utilized for both radiofrequency (RF) pulse transmission and signal reception. Within the acrylic container, two wells on the same column (matrix = 2 × 7) contained identical cell pellets with the same extracellular media. MRI signals from seven different cell samples in the horizontal direction were separated by one-dimensional frequency encoding along that direction (Figure 1). The MRI pulse sequence employed for mapping the T2 value was a single-echo spin-echo (SESE) sequence with 50 variable echo times (TE) spaced between 9.5 and 290.5ms on a logarithmic scale. For mapping the MT parameters, an inversion recovery multi-echo spin-echo (IR-MESE) sequence was used. The inversion times (TI) for the IR-MESE sequence were optimized using the theory of Cramér-Rao lower bounds (Li et al., 2010). The optimized TIs ranged from 4 to 10,079.4ms. After each TI, 16 spin-echo trains were acquired with an echo spacing of 9.5ms. Total scan time for both sequences was 23 min. Experiments were repeated 15 times for SH-SY5Y cells and 7 times for Jurkat cells, replacing cells in each repetition. Other scan parameters are detailed in Appendix 1—table 1.
Animals
Male Wistar rats aged 8 weeks (250–300 g, Orient Bio) were used for MRI experiments after undergoing a craniotomy. All animal experiments were approved by the Institutional Animal Care and Use Committee at the National Cancer Center Korea (NCC-22–740). The rats were housed in ventilated cages under a 12 hr/12 hr light/dark cycle and provided with ad libitum access to food and water.
In vivo manipulation of membrane potential with artificial cerebrospinal fluid (aCSF)
Request a detailed protocolThe membrane potential of the exposed cortex was manipulated by directly perfusing the region of interest of the cerebral cortex with aCSF after a craniotomy. The baseline aCSF was prepared with the following components: KCl = 3 mM; NaCl = 135 mM; MgCl2 = 3 mM; HEPES = 20 mM; glucose = 4.5 g/l; EGTA = 2 mM; Nω-Nitro-L-arginine=1 mM; Nifedipine = 0.1 mM; pH = 7.4. Hemodynamic effects were pharmacologically suppressed using Nω-Nitro-L-arginine, Nifedipine, and EGTA. Nω-Nitro-L-arginine suppresses depolarization-induced hemodynamic response by blocking the synthesis of nitric oxide, which acts as a vasodilator (Dreier et al., 1995). Nifedipine blocks voltage-sensitive Ca2+ channels, and EGTA chelates free Ca2+ to inhibit the hemodynamic response (Redmond et al., 2002). To induce depolarization, aCSF with high [K+] (KCl = 40 and 80 mM) was prepared. The osmolarity of the aCSF was matched with the concentration of NaCl.
Rat surgery
Request a detailed protocolA craniotomy was performed on a Wistar rat. The experimental setup after a surgical procedure is illustrated in Figure 5. The surgery was performed following an established protocol (Mostany and Portera-Cailliau, 2008) alike to that used in other MRI studies (Stanisz et al., 2002; Autio et al., 2014). Anesthesia was induced with 3% isoflurane in O2 and maintained with 2–3% isoflurane during the surgical procedure. Body temperature was maintained at 36.5–37.5°C with an infrared lamp. The head was fixed with a small animal stereotaxic frame. The hair on the scalp was shaved with a veterinary clipper. The skin and periosteum over the skull were removed using a scalpel and surgical scissors. A 3.0-mm-diameter burr hole was opened using a dental drill with its center at the coordinates of 2.5 mm anterior and 2.0 mm lateral to the lambda. Then, a cylindrical chamber was implanted upon the burr hole with cyanoacrylate glue and dental composite resin. The chamber was filled with the baseline aCSF and connected to inlet and outlet perfusion tubes. The exposed cerebral cortex inside the chamber was perfused with the baseline aCSF at a flow rate of 0.6 ml/min using peristaltic pumps.
In vivo MRI experiment
Request a detailed protocolThe rat with a cranial chamber installed on the cortical surface was placed on a 7T MRI system (BioSpec 70/20 USR, Bruker BioSpin), fixed in a customized cradle with two ear-bars and a bite-bar. A customized surface coil (rectangular, 35 mm × 20 mm) was used for RF pulse transmission and signal reception. Body temperature was maintained at 36.5–37.5°C using a warm air blower. Anesthesia was maintained with 2% isoflurane in O2 (0.6 l/min). Respiration rate and body temperature were monitored throughout the MRI experiment. MR images were acquired in a 2 mm coronal slice through the center of the burr hole (Figure 5), using a multi-echo spin-echo (MESE) sequence with 20 TEs (7.5–150ms). Other scan parameters are detailed in Appendix 1—table 2.
A total of seven rats were subjected to four sequential experimental conditions, as depicted in Figure 5. First, the exposed cerebral cortex was perfused with baseline aCSF ([K+]=3 mM). Second, as a depolarizing condition, the perfusion media was switched to depolarizing aCSF of [K+]=40 mM. Third, membrane potential was further depolarized by perfusion with aCSF of [K+]=80 mM. Finally, as a recovery condition, the perfused aCSF was changed back to baseline aCSF. During each condition, MR images were acquired with MESE sequences for 12 min. Two rats underwent the whole four conditions, while five other rats did not undergo the recovery condition. As a control experiment, another set of rats (n=5) underwent perfusion with the baseline aCSF for the same duration (48 min) as the previous experiment, and MR images were acquired with four MESE sequences, each for 12 min. Throughout the experiment, the perfusion rate was maintained at 0.6 ml/min.
Quantification of MR parameters
Request a detailed protocolFor the in vivo MR images acquired with a MESE sequence, echo trains were matched with a simulated dictionary of decay curves of multi-echo spin-echo signals created with the stimulated echo and slice profile correction (McPhee and Wilman, 2017) to estimate T2 values. For the in vitro one-dimensional MR images acquired with the SESE sequence, signals were fitted to a mono-exponential function to estimate T2 values. For the in vitro one-dimensional MR images acquired with the IR-MESE sequence, signals were fitted to a bi-exponential function (Edzes and Samulski, 1977; Gochberg and Gore, 2003) to estimate MT parameters. 16 spin echoes acquired after each TI were averaged to improve SNR. The MT parameters such as PSR and kmf were derived from this fitting process.
A 1ms hard inversion pulse selectively inverted the magnetization of free water protons, leading to cross-relaxation between the longitudinal magnetization of free water protons (Mz,f) and macromolecular protons (Mz,m). This interaction resulted in a bi-exponential magnetization recovery characterized by a fast longitudinal relaxation rate and a slow relaxation rate (=1 /T1), with the latter corresponding to the conventional spin-lattice relaxation rate (Gochberg and Gore, 2003; Xu et al., 2014):
(4)
where M∞,f denotes the equilibrium magnetization of free water protons, and and denote the amplitudes for the exponential terms associated with and ,respectively. By fitting this bi-exponential model to the inversion recovery signals using least squares, estimates of , , , and were obtained. These parameters are related to the MT parameters, PSR and kmf, by the following equations:
(5)
(6)
(7)
where R1,f and R1,m denote the longitudinal relaxation rates of free water and macromolecular protons, respectively, in the absence of cross-relaxation. kfm and kmf denote the magnetization transfer rates from free water to macromolecules and vice versa, respectively, Mz,m (0) denotes the longitudinal magnetization of macromolecular protons immediately after the inversion pulse. M∞,m denotes the equilibrium magnetization of macromolecular protons. According to previous studies (Gochberg and Gore, 2003; Gochberg et al., 1999), Mz,m (0)/M∞,m can be determined numerically by the Bloch equations. Assuming R1,f = R1,m (Li et al., 2010; Cabana et al., 2015), the equations [Equations 5–7] can be simplified to explicitly calculate PSR and kmf .
(8)
(9)
Patch clamp recordings
Request a detailed protocolThe membrane potential of SH-SY5Y cells was recorded at room temperature using the whole-cell mode of the patch clamp technique (Hamill et al., 1981). The bath solution was the same as the extracellular medium used in the MRI experiment and was constantly perfused at a flow rate of 2 ml/min. The composition of the pipette solution was as follows: KCl = 140 mM; NaCl = 5 mM; MgCl2=3 mM; HEPES = 10 mM; Mg-ATP=1 mM; Na-GTP=0.5 mM. The pH of the pipette solution was adjusted to 7.4 using KOH. Calcium ions (Ca2+) were not included in the pipette solution to minimize Ca2+-dependent currents. The resistance of the electrode was 3–5 MΩ with the internal solution filled. Recordings were performed with a patch amplifier (Axopatch-1D; Axon Instruments) and a current clamp was also used to monitor the membrane potential. The experiment was repeated three times, with cells replaced at each repetition.
Appendix 1
This appendix provides detailed information on the experimental parameters and conditions used in both in vitro and in vivo MRI studies, as well as the composition of extracellular media applied to modulate cellular membrane potential.
Appendix 1—table 1
The scan parameters of the sequences used in the in vitro MR experiments.
The cell samples were scanned with two types of sequences, single-echo spin-echo (SESE) and inversion recovery multi-echo spin-echo (IR-MESE) sequences, on a 9.4 T MRI. T2 was estimated from the SESE sequence. T1, PSR, and kmf were estimated from the IR-MESE sequence, and its inversion times (TIs) were optimized using the theory of Cramér-Rao low bounds: TIs = 4, 4, 4, 4, 4, 4, 4, 4, 17.91, 18.18, 18.18, 18.2, 18.2, 18.21, 18.21, 18.24, 18.24, 18.24, 18.24, 18.24, 18.31, 18.31, 18.32, 18.46, 55.18, 55.26, 55.53, 55.98, 163.5, 164.83, 164.92, 164.93, 164.96, 165.25, 165.25, 165.62, 197.68, 1976.77, 2280.95, and 10076.4 ms. The recovery time or repetition time was set long enough to ensure full relaxation of nuclear magnetization.
| Sequence type | SESE | IR-MESE |
|---|---|---|
| Recovery time (ms) | N/A | 15000 |
| Repetition time (ms) | 15000 | N/A |
| Inversion time (ms) | N/A | 4–10,079.4 (40 steps) |
| Echo time (ms) | 9.5–290.5 (linear, 50 steps) | 9.5–152 (linear, 16 steps) |
| Resolution (mm) | 0.5 | |
| Slice thickness (mm) | 1 | |
| Estimated parameters | T2 | T1, PSR, and kmf |
Appendix 1—table 2
The scan parameters of the sequence used in the in vivo rat MR experiments.
The rats were scanned with a multi-echo spin-echo (MESE) sequence on a 7 T MRI.
| Sequence type | MESE |
|---|---|
| Repetition time (ms) | 1000 |
| Inversion time (ms) | N/A |
| Echo time (ms) | 7.5–150 (linear, 20 steps) |
| Resolution (mm2) | 0.3×0.3 |
| FOV (mm2) | 28.8×28.8 |
| Slice thickness (mm) | 2 |
| Estimated parameters | T2 |
Appendix 1—table 3
The composition of the extracellular media used to modulate membrane potential in vitro.
The sodium chloride concentrations were adjusted to maintain the same osmolarity across all media. Besides the inorganic salts listed in this table, all media commonly contained HEPES = 20 mM; glucose = 4.5 g/l; EGTA = 10 μM; pH = 7.2.
| Medium type | KCl (mM) | BaCl2 (mM) | NaCl (mM) |
|---|---|---|---|
| Baseline | 4.2 |  | 145.8 |
| Low [K+] | 0.2 | 149.8 | |
| 1 | 149 | ||
| High [K+] | 20 | 130 | |
| 40 | 110 | ||
| 80 | 70 | ||
| [Ba2+] | 4.2 | 10 | 130.8 |
Appendix 2
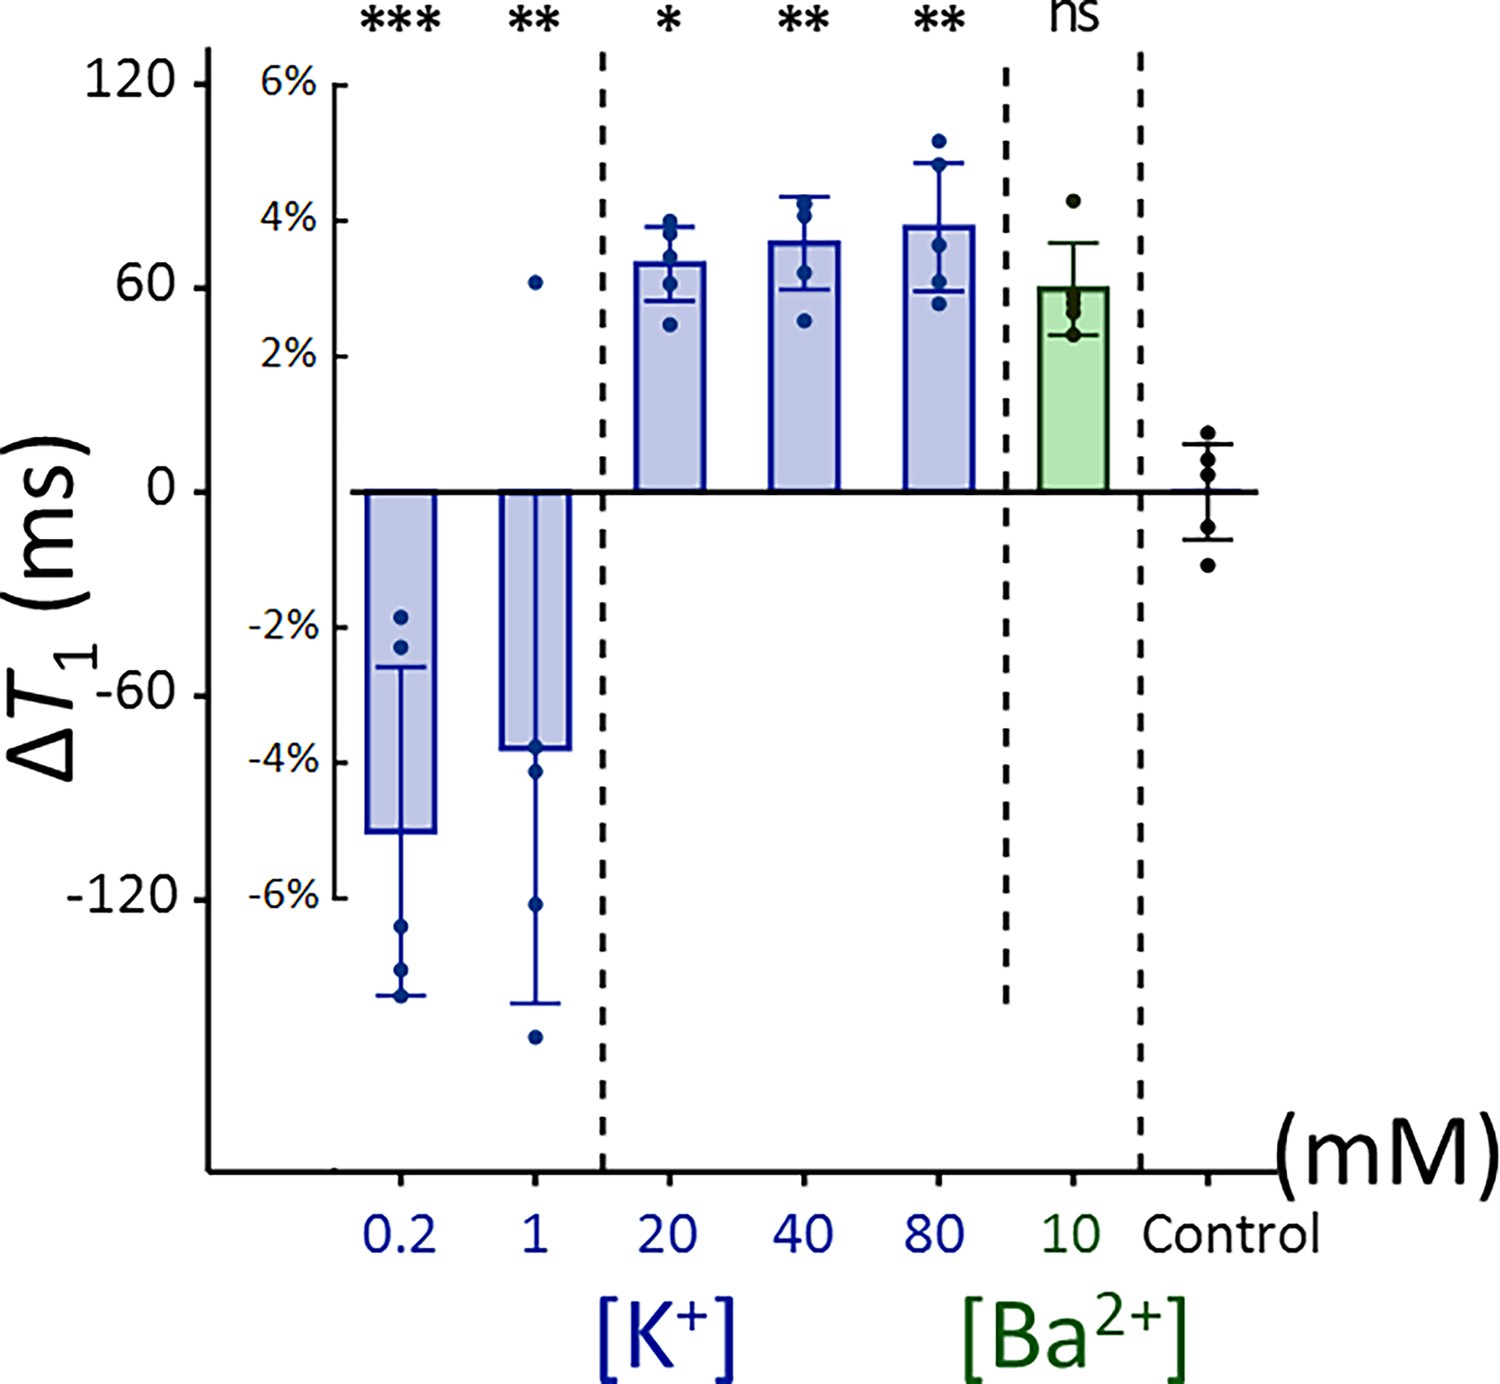
Membrane potential-induced changes in T1: SH-SY5Y cells
The changes of T1 in SH-SY5Y cells when the membrane potential (Vm) was modulated by varying [K+] = 0.2–80 mM or adding [Ba2+] = 10 mM are shown in Appendix 2—figures 1 and 2. A linear mixed-effect model was employed to analyze the effect of changes in Vm (ΔVm) on T1. This model included T1 as a dependent variable, ΔVm and its interaction with a group variable (indicating whether ΔVm is induced by [Ba2+] or [K+]) as fixed effects, and cell batch as a random effect. The analysis revealed no significant interaction term (p = 0.188), showing that changes in T1 do not depend on the specific method of membrane potential modulation. The model yielded the following relationship:
(A2.1)
The effect ΔVm on T1 was significant (p < 0.0001), indicating an increase in T1 during depolarization and a decrease during hyperpolarization. This trend is the same with T2 regarding membrane potential, while the sensitivity is 3.5 times smaller compared to T2. Subsequent post-hoc analysis compared each experimental condition to the control using Dunnett’s test to account for multiple comparisons, showing significant changes in T1 across all conditions tested (p < 0.0001).
Membrane potential-induced changes in T1: Jurkat cells
The changes in T1 were also evaluated using a different cell line, the Jurkat, under the same experimental conditions applied to SH-SY5Y cells. Each experimental condition was compared to the control using Dunnett’s test to account for multiple comparisons (Appendix 2—figure 3). As the same with observation in SH-SY5Y cells, Jurkat cells showed positive changes in T1 during hyperpolarization and negative changes during depolarization, indicating that the detectability of membrane potential changes by T1 does not appear specific to cell type.
Quantification of T1 and T2 of extracellular media
To estimate the T1 and T2 of extracellular media specified in Appendix 1—table 3, 200 μl of each media sample was loaded into two wells on the same column of the acrylic container with 14 wells (Figure 1A) and placed in a 9.4 T preclinical MRI system (BioSpec 94/30 USR, Bruker BioSpin). T1 and T2 were measured using an adiabatic inversion recovery multi-echo spin-echo sequence. 20 variable inversion times (TI) were spaced between 600 and 15,000 ms on a logarithmic scale. After each TI, 50 multi-echo spin-echo trains were acquired with an echo spacing of 9.5 ms (echo time (TE) = 9.5 to 475 ms). For the T1 estimation, the 50 multi-echo spin-echo signals acquired after each TI were averaged and fitted to a mono-exponential function:
(A2.2)
where S(t) denotes the averaged signal after an inversion time of t, and A and B denote the coefficients of the fitting. For T2 estimation, the 20 spin-echo signals at the same TE but different 20 TIs were averaged. These averaged 50 multi-echo spin-echo trains were then matched with a simulated dictionary of decay curves. This dictionary was constructed from simulation of multi-echo spin-echo signals, incorporating corrections for stimulated echoes and slice profile effects (McPhee and Wilman, 2017).
Appendix 2—figure 1
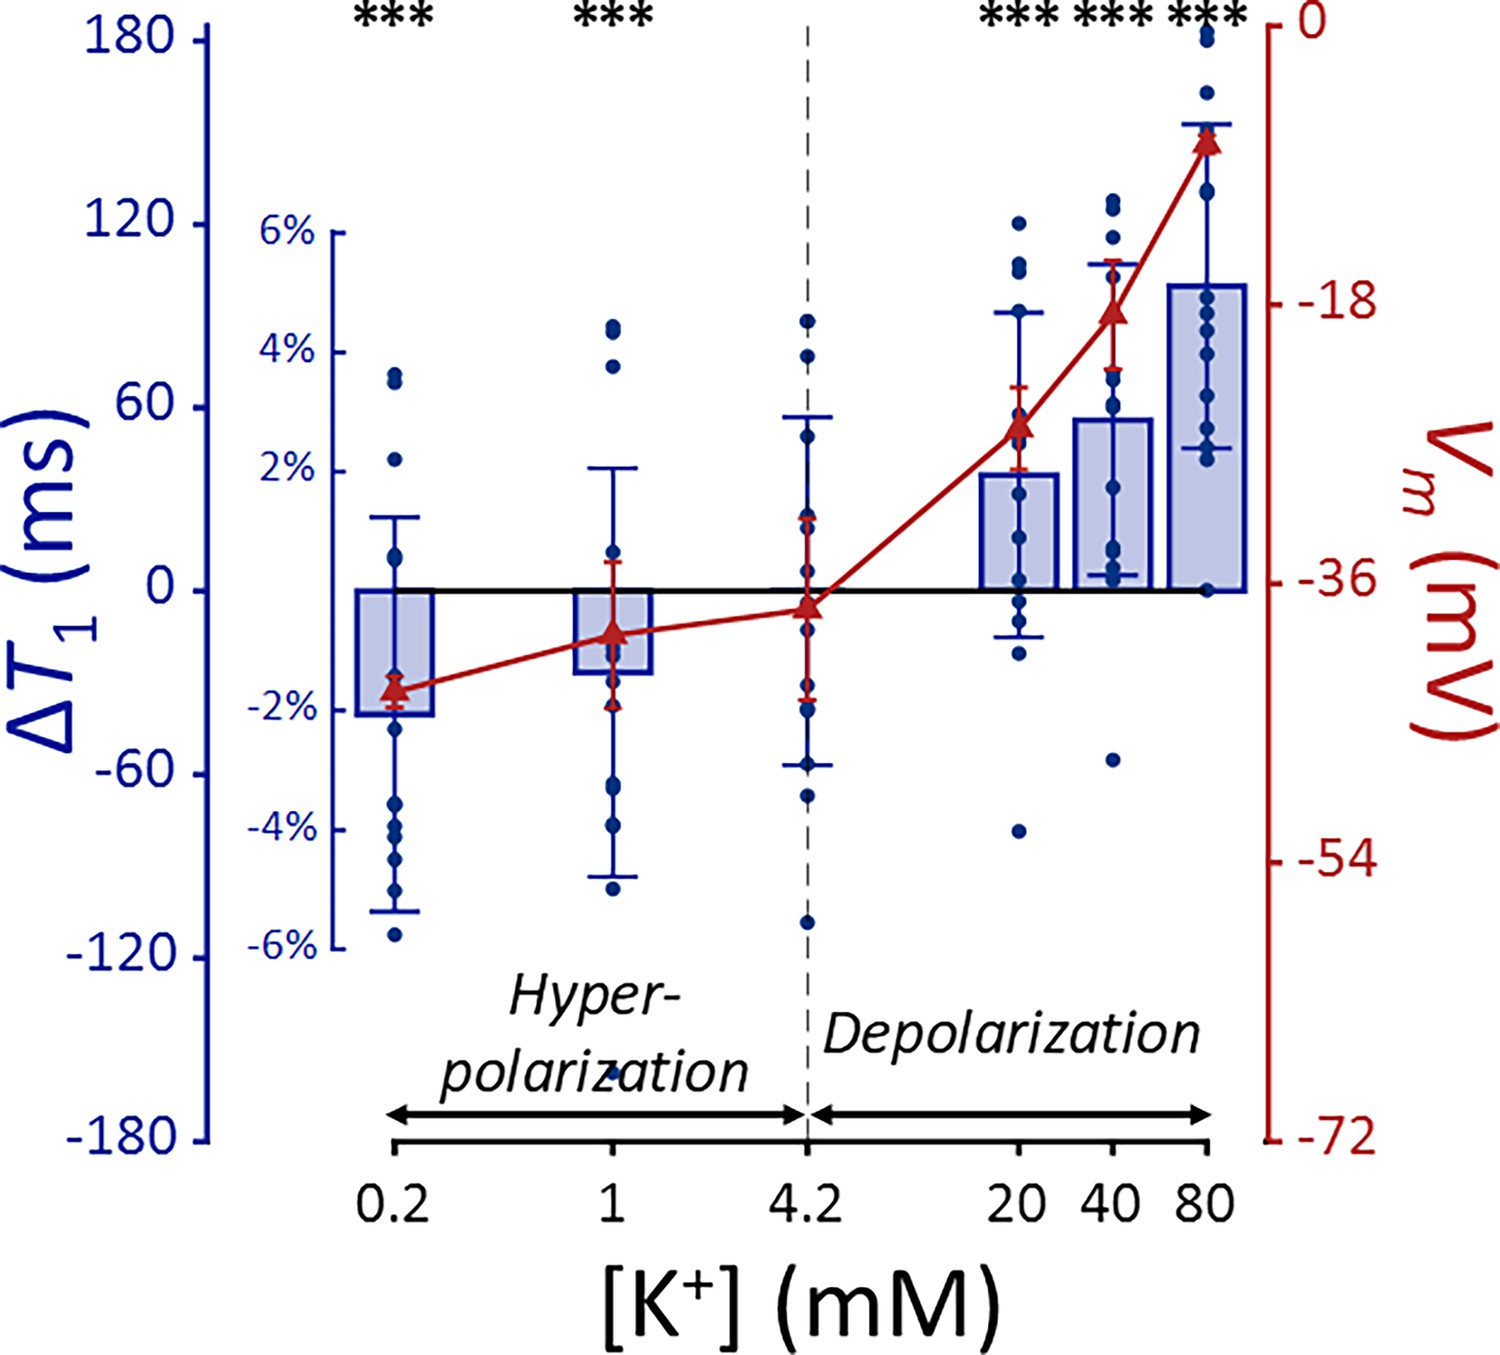
T1 and membrane potential (Vm) of SH-SY5Y cells versus extracellular K+ concentrations ([K+]).
Changes in T1 are displayed with blue bars (n = 15). Membrane potentials are plotted with red triangles (n = 3). The abscissa is in logarithmic scale. Error bars denote standard deviation. Statistical significance of changes in T1 is marked with asterisks (***: p < 0.001).
Appendix 2—figure 2
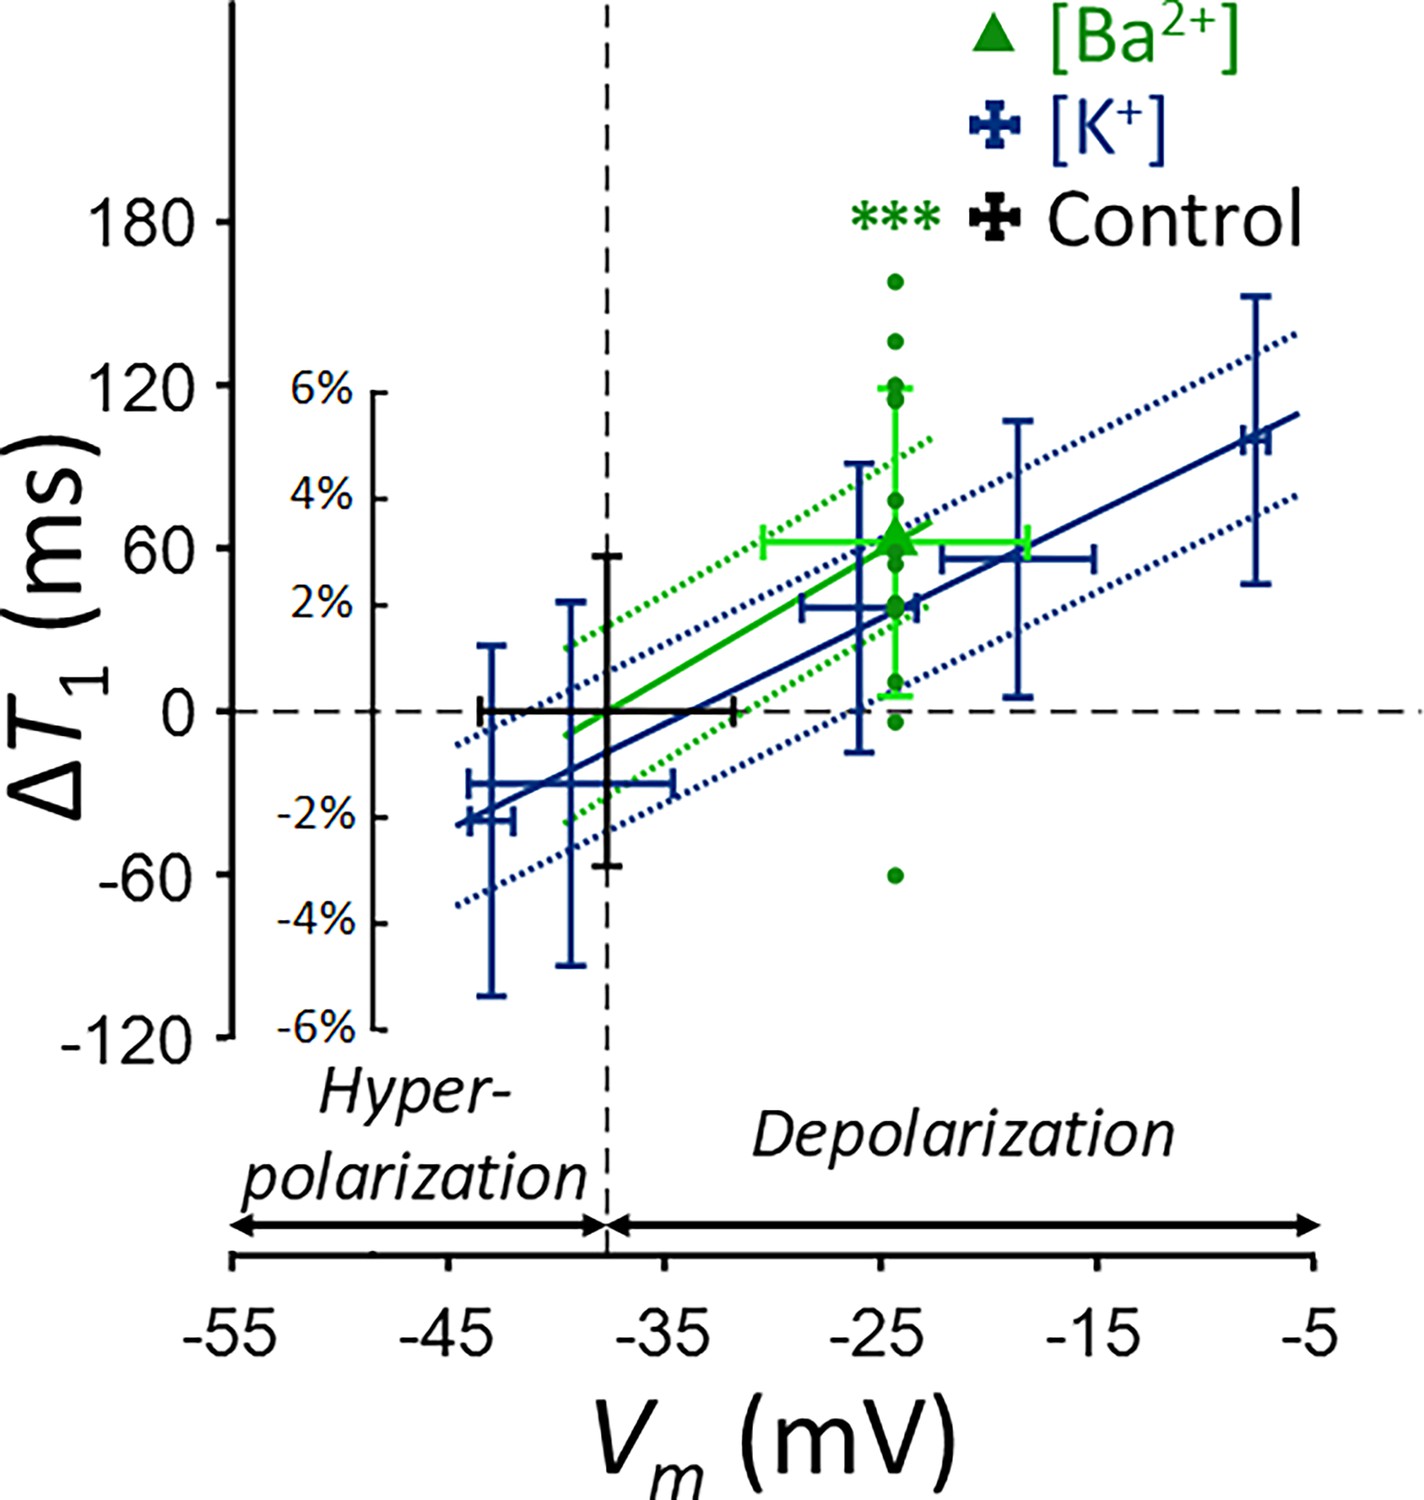
Changes in T1 of SH-SY5Y cells across experimental conditions: [K+] = 0.2–80 mM (blue cross) and [Ba2+] = 10 mM (green triangle), compared to the control condition (black cross).
Data from fifteen experiments (n = 15) are displayed. Linear regression lines for [K+] data (blue solid line) and [Ba2+] data (green solid line) are drawn along with 95% confidence intervals. Error bars denote standard deviation. Statistical significance of changes in T1 with [Ba2+] = 10 mM is marked with asterisks (***: p < 0.001).
Appendix 2—figure 3
Changes in T1 of Jurkat cells across experimental conditions: [K+] = 0.2–80 mM (blue bar) and [Ba2+] = 10 mM (green bar), compared to the control condition of [K+] = 4.2 mM (n = 5).
Error bars denote standard deviation. Statistical significance of changes in T1 is marked with asterisks (ns: p > 0.05, *: p < 0.05, **: p < 0.01, ***: p < 0.001).
Appendix 2—figure 4
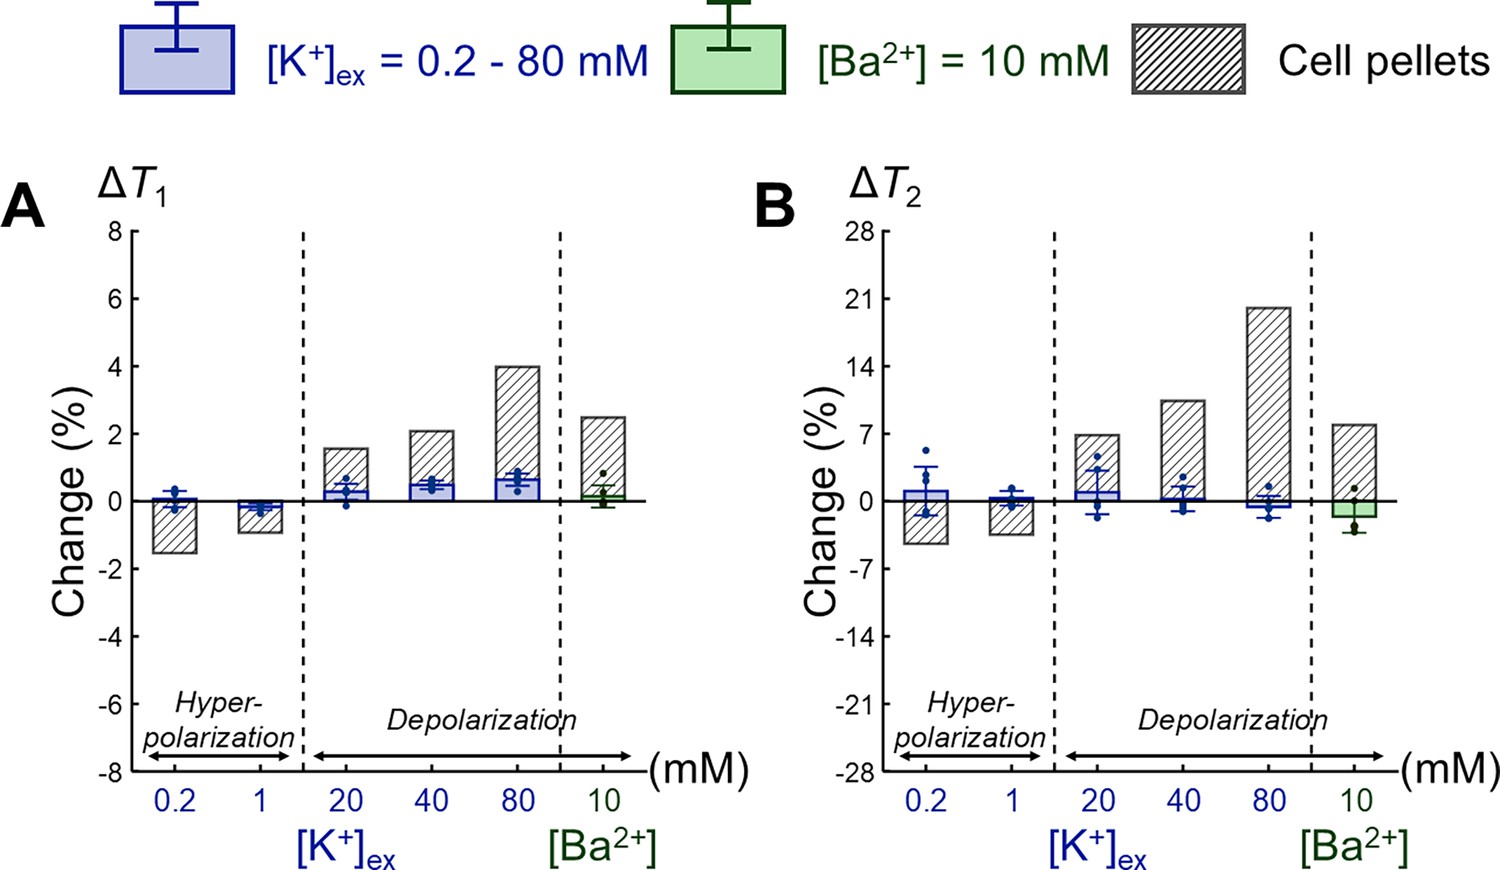
Comparison of changes in relaxation times between extracellular media and SH-SY5Y cell pellets.
Changes in (A) T1 and (B) T2 are expressed as percentage changes relative to the control condition of [K+] = 4.2 mM. The results for extracellular media are displayed as blue bars for the extracellular K+ concentrations ([K+]) and green bars for the Ba2+ concentration ([Ba2+]) (n = 6). For comparison, the results for SH-SY5Y cell pellets corresponding to each extracellular medium are plotted. Error bars denote standard deviation.
Appendix 3
Quantitative assessment of in vivo T2 mapping
In this study, in vivo T2 mapping was conducted using a multi-echo spin-echo (MESE) sequence. MESE signals exhibit nonexponential decay patterns due to stimulated echoes and imperfect slice profiles (Hennig, 1991). To correct for these effects, the MESE signals were fitted to a simulated dictionary of MESE signals, which was created using the extended phase graph (EPG) method (McPhee and Wilman, 2017). This dictionary included 360,000 MESE signal curves, spanning T2 ranges from 20 to 200 ms and B1 ranges from 0.5 to 1.5.
Appendix 3—figure 1 illustrates the procedure to assess the SNR and fitting quality for T2 mapping using an example MESE image from the in vivo rat experiment. First, the background noise of the MESE image was calculated. When a complex MR image contains Gaussian noise with a standard deviation of σ, the resulting magnitude image will exhibit Rician noise. This can be approximated as Gaussian noise if the SNR (= A/σ) is greater than 3, where A is the magnitude of signal in the absence of noise (Gudbjartsson and Patz, 1995). Rician noise was sampled from 64 voxels in the background of the magnitude image and the noise level σ was calculated from the average of the sampled Rician noise M using the formulaxels in the background of the magnitude (Gudbjartsson and Patz, 1995):
(A3.1)
Subsequently, a mask was created by thresholding the magnitude image at SNR > 3. T2 mapping was performed by fitting the MESE signal to the simulated dictionary across the masked region. The fit quality was assessed using the normalized root mean squared error (NRMSE) and adjusted R2, calculated as follows:
(A3.2)
(A3.3)
where is the mean of the signals, yi is the ith signal, fi is the ith fitted value, n is the sample size (number of echoes), and p is the number of variables.
Finally, the magnitude signal in the ROI beneath the perfusion chamber (width = 1.8 mm, depth = 0.6 mm) was analyzed. After averaging the magnitude signals over the ROI, it is confirmed that the signal is well above the noise floor (3σ). After performing T2 fitting, the fit quality was examined with NRMSE and adjusted R2.
This analysis was conducted across all seven in vivo rat models. Source data 1 contains the fitted T2 and B1 value, NRMSE and adjusted R2 value, the signal intensity of the last echo in the ROI, and the noise level σ. Notably, the maximum NRMSE was 0.043 and the minimum adjusted R2 was 0.995, indicating a high degree of alignment between the observed magnitude signals and the fitting curves.
Appendix 3—figure 1
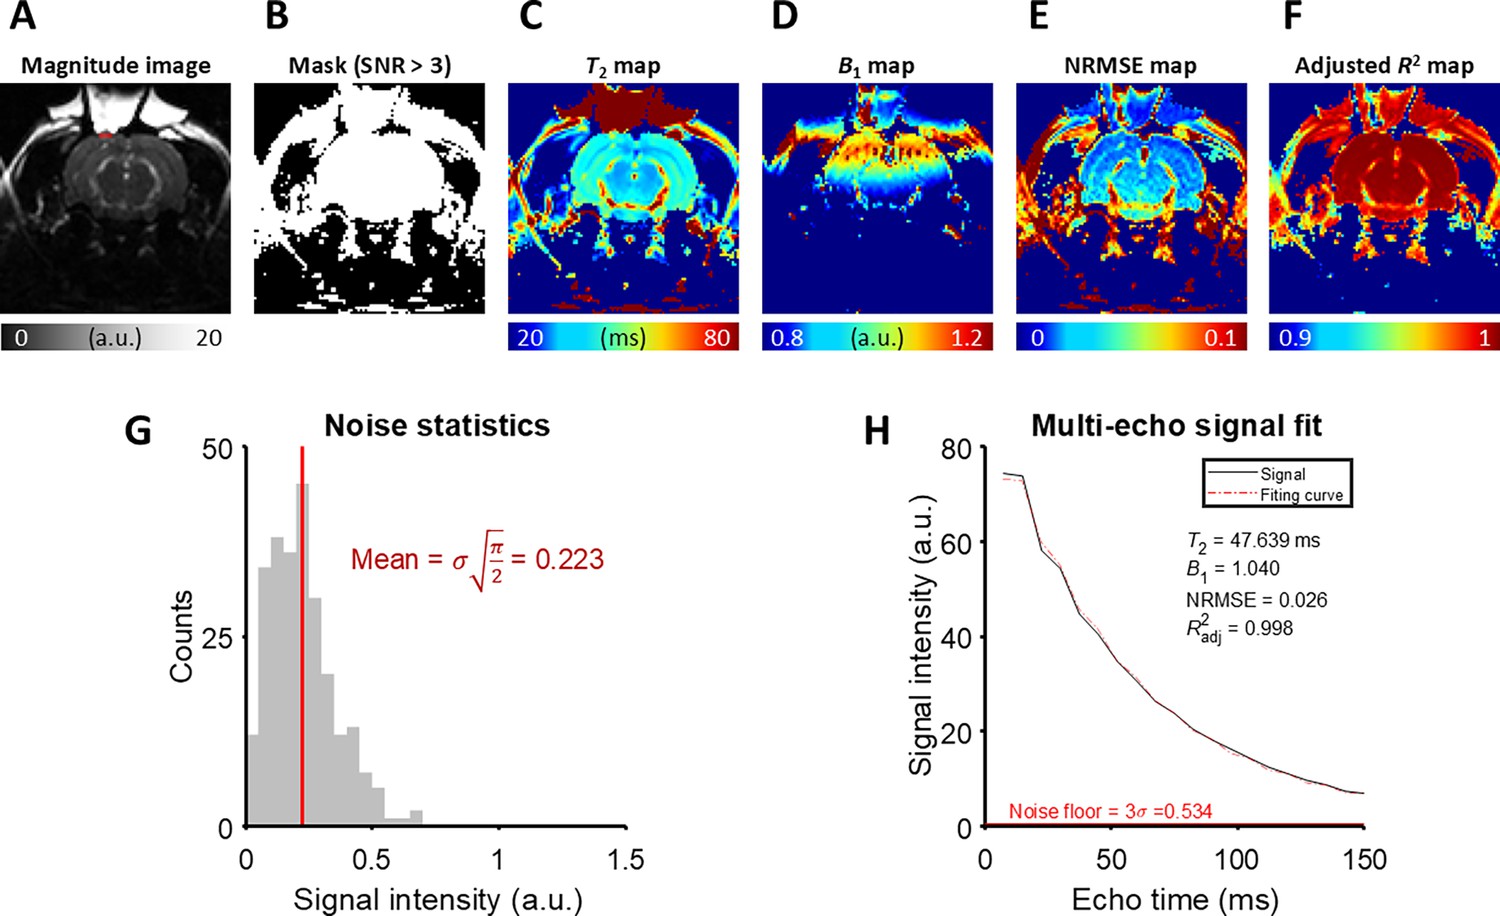
The detailed analysis of T2 fitting on an example MESE image from the in vivo rat experiment.
(A) A magnitude image at the last echo time. The ROI is marked with a red rectangle. (B) A mask generated by thresholding the magnitude image with SNR > 3. (C) T2 map, (D) B1 map, (E) NRMSE map, and (F) Adjusted R2 map produced by the fitting procedure. (G) The noise statistics of the background of the magnitude image. (H) The magnitude signal averaged over the ROI and its fitting curve.
Appendix 4
Viability assay of SH-SY5Y cells with live/dead staining
SH-SY5Y cells were cultured, harvested, and centrifuged to obtain a cell pellet. This cell pellet was resuspended in the culture medium and divided into seven equal aliquots. Each aliquot was centrifuged and resuspended three times using one of the seven different media specified in Appendix 1—table 3. For the viability assay, staining media were prepared by adding 2 μM calcein-AM and 4 μM Ethidium homodimer-1 to each of the seven media. The cell suspensions were then centrifuged and resuspended again using the staining media. Following this, each cell suspension was transferred to separate wells in a chambered coverglass and incubated at room temperature for 20 minutes. After another round of centrifugation, cell pellets were obtained and analyzed using a confocal microscope (Leica TCS SP8 STED, Leica Microsystems). Cell viability was assessed based on green fluorescence indicating live cells and red fluorescence indicating dead cells, under excitation wavelengths of 488 and 543 nm, respectively. Live and dead cells were manually counted with QuPath (Bankhead et al., 2017), and the cell viability was calculated as the ratio of live cells to total cells.
Appendix 4—figure 1
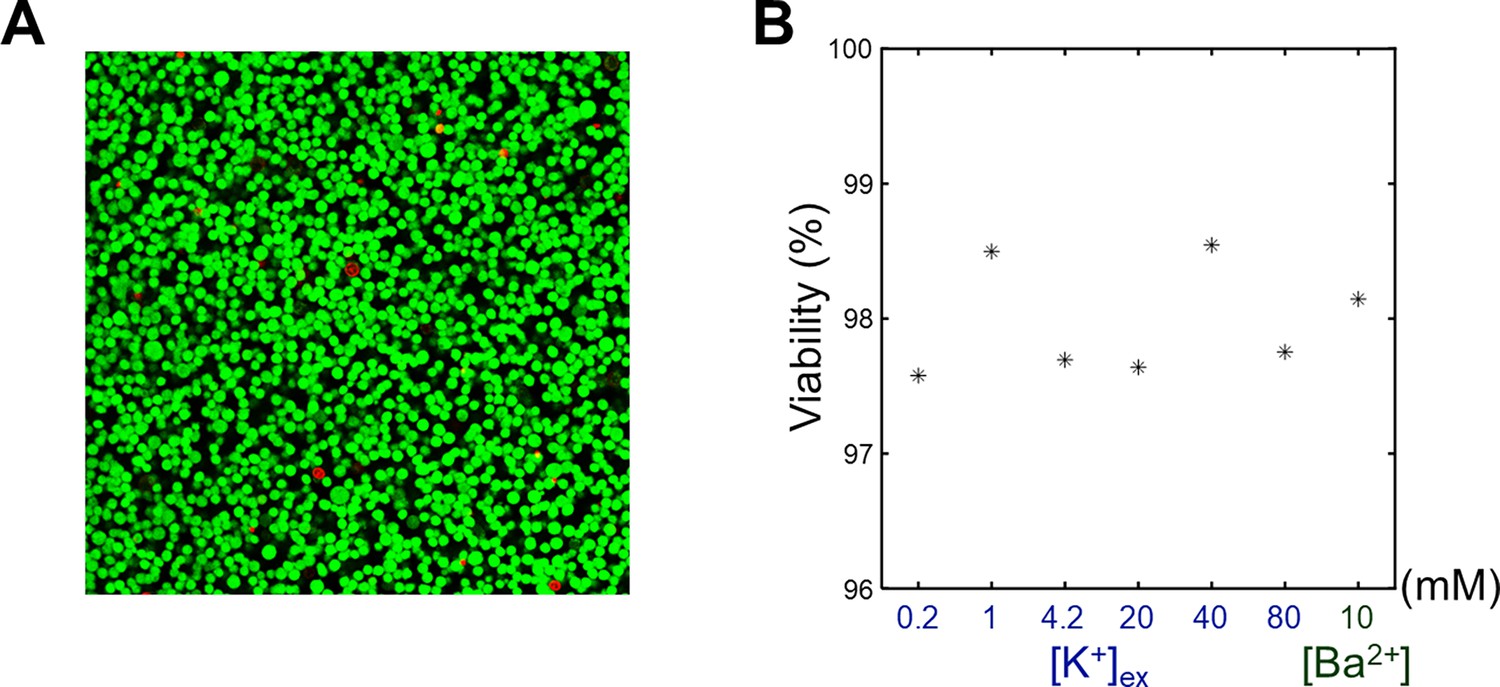
The viability assay of SH-SY5Y cells.
(A) A representative confocal microscopy image of an SH-SY5Y pellet. [K+] of extracellular medium was 4.2 mM. Live cells (green) were stained with calcein-AM, and dead cells (red) were stained with EthD-1. (B) The viabilities of SH-SY5Y cells versus the extracellular K+ concentrations ([K+]) and Ba2+ concentration ([Ba2+]).
Data availability
The source data used to generate the figures are included in Source data 1.
References
-
Emerging roles of the membrane potential: action beyond the action potentialFrontiers in Physiology 9:1661.https://doi.org/10.3389/fphys.2018.01661
-
Parenchymal spin-lock fmri signals associated with cortical spreading depressionJournal of Cerebral Blood Flow & Metabolism 34:768–775.https://doi.org/10.1038/jcbfm.2014.16
-
Direct detection of neuronal activity with MRI: fantasy, possibility, or reality?Applied Magnetic Resonance 29:65–88.https://doi.org/10.1007/BF03166956
-
Über das elektrenkephalogramm des menschenArchiv Für Psychiatrie Und Nervenkrankheiten 87:527–570.https://doi.org/10.1007/BF01797193
-
Transport of potassium at the blood—brain barrierThe Journal of Physiology 221:617–632.https://doi.org/10.1113/jphysiol.1972.sp009771
-
Nitric oxide modulates the cbf response to increased extracellular potassiumJournal of Cerebral Blood Flow & Metabolism 15:914–919.https://doi.org/10.1038/jcbfm.1995.116
-
Quantitative imaging of magnetization transfer using multiple selective pulsesMagnetic Resonance in Medicine 41:1065–1072.https://doi.org/10.1002/(SICI)1522-2594(199905)41:5<1065::AID-MRM27>3.0.CO;2-9
-
Quantitative imaging of magnetization transfer using an inversion recovery sequenceMagnetic Resonance in Medicine 49:501–505.https://doi.org/10.1002/mrm.10386
-
The rician distribution of noisy MRI dataMagnetic Resonance in Medicine 34:910–914.https://doi.org/10.1002/mrm.1910340618
-
Electrophysiological source imaging: a noninvasive window to brain dynamicsAnnual Review of Biomedical Engineering 20:171–196.https://doi.org/10.1146/annurev-bioeng-062117-120853
-
Hypokalemia and arrhythmiasThe American Journal of Medicine 80:13–22.https://doi.org/10.1016/0002-9343(86)90336-0
-
Physiology of cell volume regulation in vertebratesPhysiological Reviews 89:193–277.https://doi.org/10.1152/physrev.00037.2007
-
Neuronal current distribution imaging using magnetic resonanceIEEE Transactions on Magnetics 35:4109–4111.https://doi.org/10.1109/20.800771
-
Initial attempts at directly detecting alpha wave activity in the brain using MRIMagnetic Resonance Imaging 22:1413–1427.https://doi.org/10.1016/j.mri.2004.10.012
-
Functional significance of cell volume regulatory mechanismsPhysiological Reviews 78:247–306.https://doi.org/10.1152/physrev.1998.78.1.247
-
Diffusion, confusion and functional MRINeuroImage 62:1131–1136.https://doi.org/10.1016/j.neuroimage.2011.09.058
-
Molecular and functional properties of two-pore-domain potassium channelsAmerican Journal of Physiology. Renal Physiology 279:F793–F801.https://doi.org/10.1152/ajprenal.2000.279.5.F793
-
Optimized inversion recovery sequences for quantitative T1 and magnetization transfer imagingMagnetic Resonance in Medicine 64:491–500.https://doi.org/10.1002/mrm.22440
-
The normal membrane potential of frog sartorius fibersJournal of Cellular and Comparative Physiology 34:383–396.https://doi.org/10.1002/jcp.1030340304
-
External Ba2+ block of the two-pore domain potassium channel TREK-1 defines conformational transition in its selectivity filterThe Journal of Biological Chemistry 286:39813–39822.https://doi.org/10.1074/jbc.M111.264788
-
ConferenceFunctional MRI with SWIFTProceedings of International Society of Magnetic Resonance in Medicine.
-
Multi-planar image formation using NMR spin echoesJournal of Physics C 10:L55–L58.https://doi.org/10.1088/0022-3719/10/3/004
-
The NMR studies of water in biological systemsProgress in Biophysics and Molecular Biology 35:103–134.https://doi.org/10.1016/0079-6107(80)90004-8
-
Transverse relaxation and flip angle mapping: Evaluation of simultaneous and independent methods using multiple spin echoesMagnetic Resonance in Medicine 77:2057–2065.https://doi.org/10.1002/mrm.26285
-
A craniotomy surgery procedure for chronic brain imagingJournal of Visualized Experiments e680:680.https://doi.org/10.3791/680
-
BookIon and water transport across the blood-brain barrierIn: Alvarez-Leefmans FJ, Delpire E, editors. In Physiology and Pathology of Chloride Transporters and Channels in the Nervous System. Academic Press. pp. 585–606.https://doi.org/10.1016/B978-0-12-374373-2.00030-3
-
Oxygenation‐sensitive contrast in magnetic resonance image of rodent brain at high magnetic fieldsMagnetic Resonance in Medicine 14:68–78.https://doi.org/10.1002/mrm.1910140108
-
Modelling of axonal fields in the optic nerve for direct MR detection studiesImage and Vision Computing 27:331–341.https://doi.org/10.1016/j.imavis.2008.05.001
-
Inability to directly detect magnetic field changes associated with neuronal activityMagnetic Resonance in Medicine 57:411–416.https://doi.org/10.1002/mrm.21129
-
A different interpretation of the DIANA fMRI signalScience Advances 10:adl2034.https://doi.org/10.1126/sciadv.adl2034
-
TRESK-like potassium channels in leukemic T cellsPflugers Archiv 456:1037–1048.https://doi.org/10.1007/s00424-008-0481-x
-
Mechanical model of neural tissue displacement during Lorentz effect imagingMagnetic Resonance in Medicine 61:59–64.https://doi.org/10.1002/mrm.21772
-
Why does MTR change with neuronal depolarization?Magnetic Resonance in Medicine 47:472–475.https://doi.org/10.1002/mrm.10071
-
Magnetic resonance imaging of neuronal and glial swelling as an indicator of function in cerebral tissue slicesMagnetic Resonance in Medicine 59:700–706.https://doi.org/10.1002/mrm.21534
-
Fast human brain magnetic resonance responses associated with epileptiform spikesMagnetic Resonance in Medicine 64:1728–1738.https://doi.org/10.1002/mrm.22561
-
Toward direct MRI of neuro‐electro‐magnetic oscillations in the human brainMagnetic Resonance in Medicine 81:3462–3475.https://doi.org/10.1002/mrm.27654
-
The effect of barium on [3H]noradrenalin release from the human neuroblastoma SH-SY5YThe European Journal of Neuroscience 7:875–880.https://doi.org/10.1111/j.1460-9568.1995.tb01074.x
-
Role of astrocytes in the clearance of excess extracellular potassiumNeurochemistry International 36:291–300.https://doi.org/10.1016/s0197-0186(99)00137-0
-
Detection of peripheral nerve and skeletal muscle action currents using magnetic resonance imagingAnnals of Biomedical Engineering 37:2402–2406.https://doi.org/10.1007/s10439-009-9762-6
-
Optical electrophysiology: toward the goal of label-free voltage imagingJournal of the American Chemical Society 143:10482–10499.https://doi.org/10.1021/jacs.1c02960
Article and author information
Author details
Funding
National Research Foundation of Korea (2019M3C7A1031993)
- Phan Tan Toi
- Jang-Yeon Park
National Research Foundation of Korea (2019M3C7A1031994)
- Kyeongseon Min
- Jongho Lee
National Research Foundation of Korea (2023R1A2C3007075)
- Jang-Yeon Park
Commercializations Promotion Agency for R and D Outcomes (NTIS1711198890)
- Daehong Kim
The funders had no role in study design, data collection and interpretation, or the decision to submit the work for publication.
Acknowledgements
We thank Dr. Silvia Mangia for insightful discussions on the role of hydration water in functional MRI. Animal molecular imaging facility at the National Cancer Center Korea contributed to supportive animal magnetic resonance imaging. We thank Minsun Kim and Soyeon Jeon (National Cancer Center) for helping with rat craniotomies and MRI experiments. This work was supported by the National Research Foundation of Korea grant funded by the Ministry of Science and ICT (NRF-2019M3C7A1031993, NRF-2019M3C7A1031994, and NRF-2023R1A2C3007075). This work was supported by the Commercialization Promotion Agency for R&D Outcomes (COMPA) funded by the Ministry of Science and ICT (NTIS1711198890).
Ethics
All animal experiments were approved by the Institutional Animal Care and Use Committee at the National Cancer Center Korea (NCC-22-740).
Version history
- Preprint posted:
- Sent for peer review:
- Reviewed Preprint version 1:
- Reviewed Preprint version 2:
- Version of Record published:
Cite all versions
You can cite all versions using the DOI https://doi.org/10.7554/eLife.101642. This DOI represents all versions, and will always resolve to the latest one.
Copyright
© 2024, Min et al.
This article is distributed under the terms of the Creative Commons Attribution License, which permits unrestricted use and redistribution provided that the original author and source are credited.
Metrics
-
- 1,705
- views
-
- 100
- downloads
-
- 3
- citations
Views, downloads and citations are aggregated across all versions of this paper published by eLife.
Citations by DOI
-
- 1
- citation for umbrella DOI https://doi.org/10.7554/eLife.101642
-
- 1
- citation for Reviewed Preprint v1 https://doi.org/10.7554/eLife.101642.1
-
- 1
- citation for Reviewed Preprint v2 https://doi.org/10.7554/eLife.101642.2
Download links
A two-part list of links to download the article, or parts of the article, in various formats.
Downloads (link to download the article as PDF)
Open citations (links to open the citations from this article in various online reference manager services)
Cite this article (links to download the citations from this article in formats compatible with various reference manager tools)
Responses to membrane potential-modulating ionic solutions measured by magnetic resonance imaging of cultured cells and in vivo rat cortex
eLife 13:RP101642.
https://doi.org/10.7554/eLife.101642.3


