Disruption of the novel nested gene Aff3ir mediates disturbed flow-induced atherosclerosis in mice
- Province and Ministry Co-sponsored Collaborative Innovation Center for Medical Epigenetics; NHC Key Laboratory of Hormones and Development; Department of Physiology and Pathophysiology, Tianjin Medical University, China
- Department of Heart Center, The Third Central Hospital of Tianjin; Tianjin Universiy Central Hospital; Tianjin Key Laboratory of Extracorporeal Life Support for Critical Diseases; Artificial Cell Engineering Technology Research Center; Tianjin Institute of Hepatobiliary Disease; Nankai University Affinity the Third Central Hospital, China
- School of Cardiovascular and Metabolic Medicine and Sciences, King's College London British Heart Foundation Centre of Excellence, Faculty of Life Sciences and Medicine, King's College London, United Kingdom
Figures
Figure 1 with 1 supplement
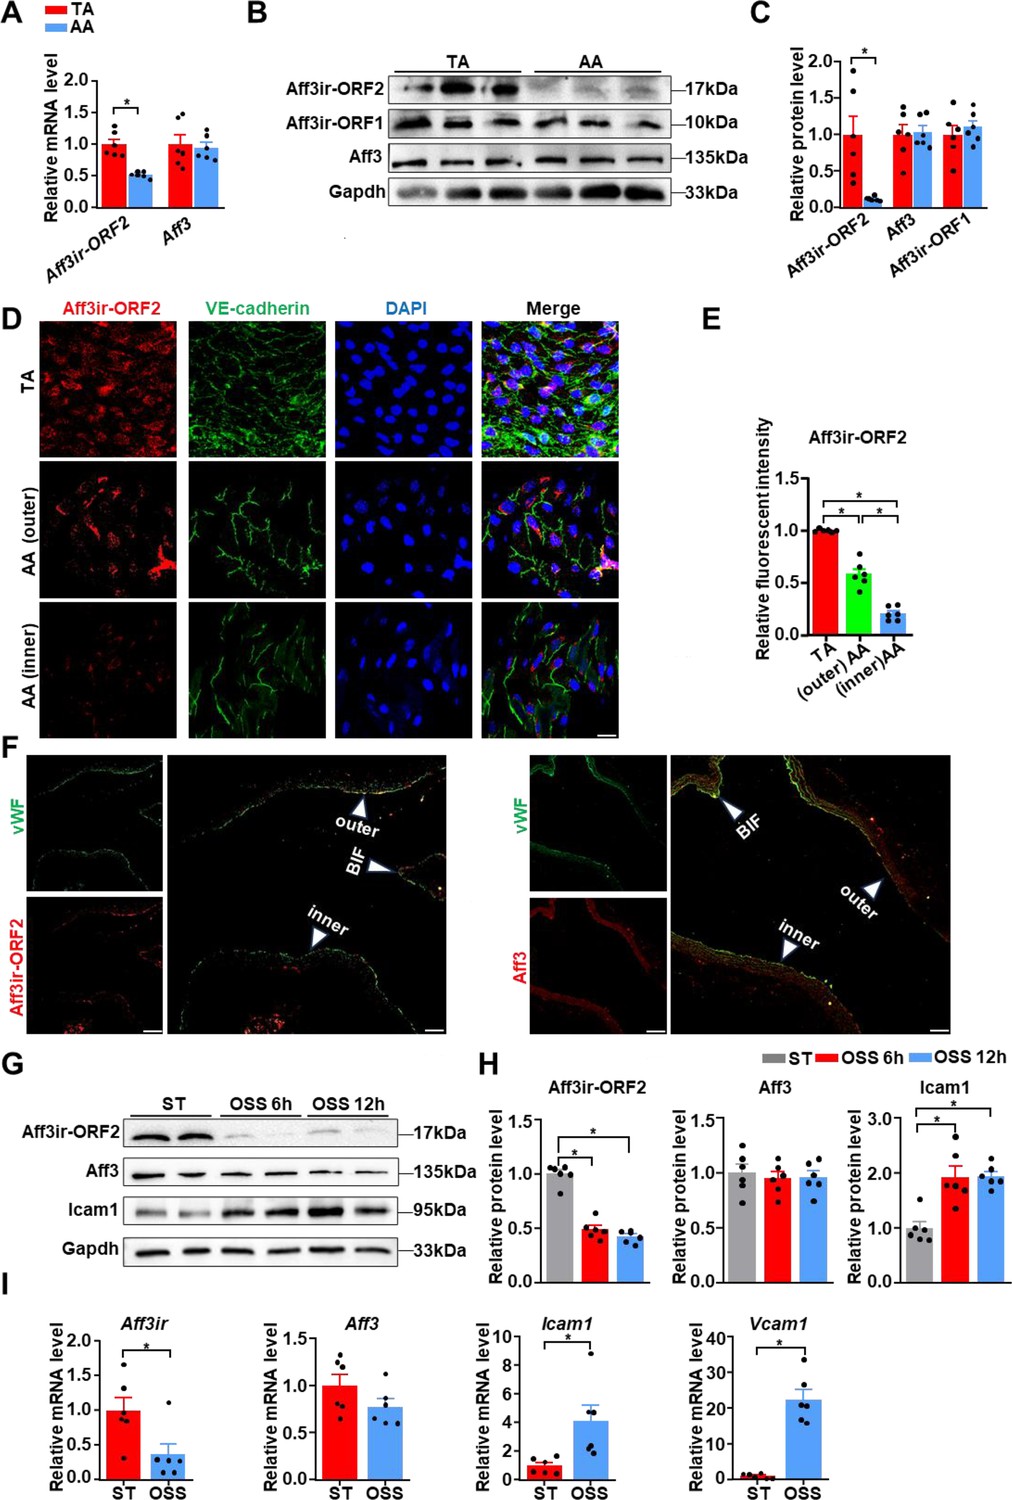
Disturbed shear stress reduces the expression of Aff3ir-ORF2 in vivo and in vitro.
(A) RT-PCR analysis of the mRNA levels of Aff3ir-ORF2 and AF4/FMR2 family member 3 (Aff3) in the intima of thoracic aorta (TA) and aortic arch (AA) of C57BL/6 mice. Data are presented as mean ± SEM (n=6 mice per group). *p<0.05, unpaired two-tailed t-test. (B, C) Western blot analysis of the expression of the indicated proteins in the intima of TA and AA of C57BL/6 mice. Protein levels were normalized to those of Gapdh, and the relative expression values were compared to those of the TA group. Data are presented as mean ± SEM (n=6 mice per group). *p<0.05, unpaired two-tailed t-test. (D, E) En-face immunofluorescence staining of Aff3ir-ORF2, VE-cadherin, and DAPI, and quantification of Aff3ir-ORF2 expression in inner curvature of the AA (AA inner), outer curvature of the AA (AA outer), and TA of C57BL/6 mice. Scale bar, 20 μm. The immunofluorescence intensity of Aff3ir-ORF2 was normalized to that of DAPI, and the relative expression values were compared to that of the TA group. Data are presented as mean ± SEM (n=6 mice per group). *p<0.05, one-way ANOVA with Tukey post-test. (F) Representative immunofluorescent staining for von Willebrand factor (vWF), Aff3ir-ORF2, and Aff3 in longitudinal aortic sections of C57BL/6 mice. n=6 mice per group. Scale bar, 25 μm. Inner, inner curvature of the AA; outer, outer curvature of the AA; BIF, Bifurcation. (G, H) Mouse embryonic fibroblasts (MEFs) isolated from the embryo of C57BL/6 mice were subjected to static (ST) or oscillatory shear stress (OSS, 0.5±4 dyn/cm2, 1 Hz) for indicated time. Western blot analysis of the indicated proteins. Protein levels were normalized to Gapdh and the relative expression values were compared to that of the ST group. Data are mean ± SEM (n=6 independent experiments). *p<0.05, one-way ANOVA with Tukey post-test. (I) MEFs were subjected to ST or oscillatory shear stress (OSS) treatment for 6 hr. RT-PCR analysis of the mRNA levels of Aff3ir, Aff3, intercellular adhesion molecule 1 (Icam1), and vascular cell adhesion molecule 1 (Vcam1) in MEFs. Data are mean ± SEM (n=6 independent experiments). *p<0.05, unpaired two-tailed t-test.
-
Figure 1—source data 1
The table summarizes the data in the statistical graph for Figure 1A, C, E, H and I.
- https://cdn.elifesciences.org/articles/103413/elife-103413-fig1-data1-v1.xlsx
-
Figure 1—source data 2
The original file of the full raw uncropped, unedited polyacrylamide gels for Figure 1B.
- https://cdn.elifesciences.org/articles/103413/elife-103413-fig1-data2-v1.zip
-
Figure 1—source data 3
Figures with the uncropped polyacrylamide gels with the relevant bands clearly labeled for Figure 1B.
- https://cdn.elifesciences.org/articles/103413/elife-103413-fig1-data3-v1.zip
-
Figure 1—source data 4
The original file of the full raw uncropped, unedited polyacrylamide gels for Figure 1G.
- https://cdn.elifesciences.org/articles/103413/elife-103413-fig1-data4-v1.zip
-
Figure 1—source data 5
Figures with the uncropped polyacrylamide gels with the relevant bands clearly labeled for Figure 1G.
- https://cdn.elifesciences.org/articles/103413/elife-103413-fig1-data5-v1.zip
Figure 1—figure supplement 1
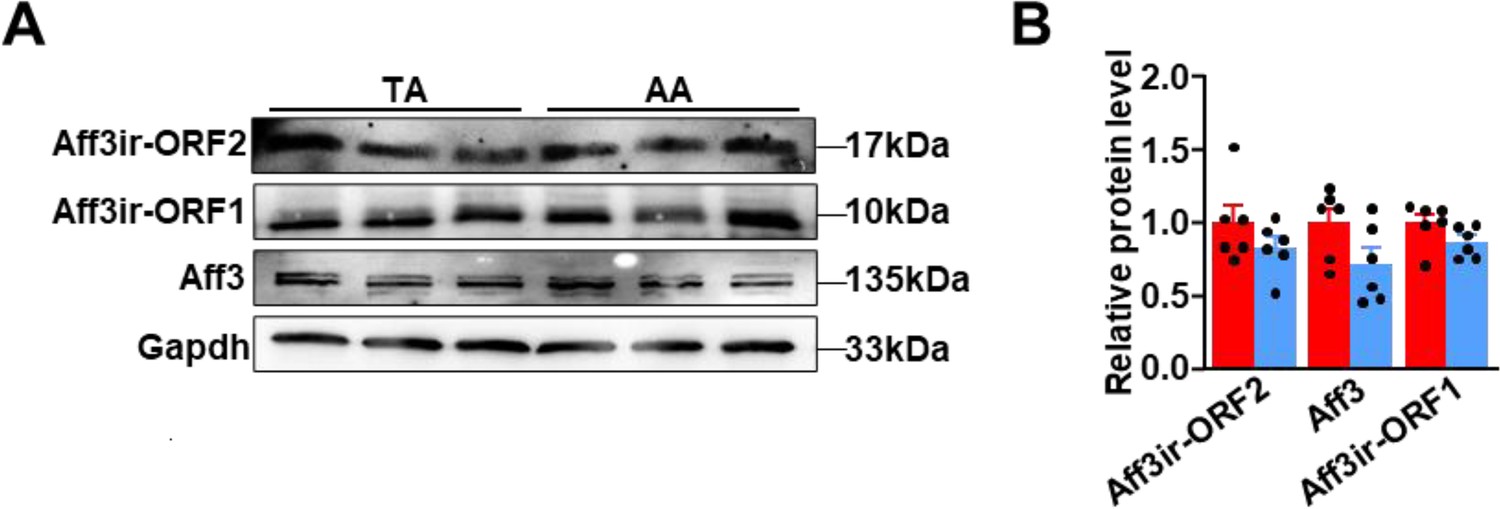
Disturbed shear stress does not reduce the expression of A3ir-ORF2 in the media and adventitia.
(A–B) Media and adventitia of aortas were isolated from the C57BL/6 mice. Western blot analysis of the expression of the indicated proteins in the media and adventitia of TA (thoracic aorta) and AA (aortic arch). Protein levels were normalized to Gapdh, and the relative expression values were compared to the TA group. Data are presented as mean ± SEM (n=6 mice per group). *p<0.05, unpaired two-tailed t-test.
-
Figure 1—figure supplement 1—source data 1
The table summarizes the data in the statistical graph for Figure 1—figure supplement 1B.
- https://cdn.elifesciences.org/articles/103413/elife-103413-fig1-figsupp1-data1-v1.xlsx
-
Figure 1—figure supplement 1—source data 2
The original file of the full raw uncropped, unedited polyacrylamide gels for Figure 1—figure supplement 1A.
- https://cdn.elifesciences.org/articles/103413/elife-103413-fig1-figsupp1-data2-v1.zip
-
Figure 1—figure supplement 1—source data 3
Figures with the uncropped polyacrylamide gels with the relevant bands clearly labeled for Figure 1—figure supplement 1A.
- https://cdn.elifesciences.org/articles/103413/elife-103413-fig1-figsupp1-data3-v1.zip
Figure 2 with 1 supplement
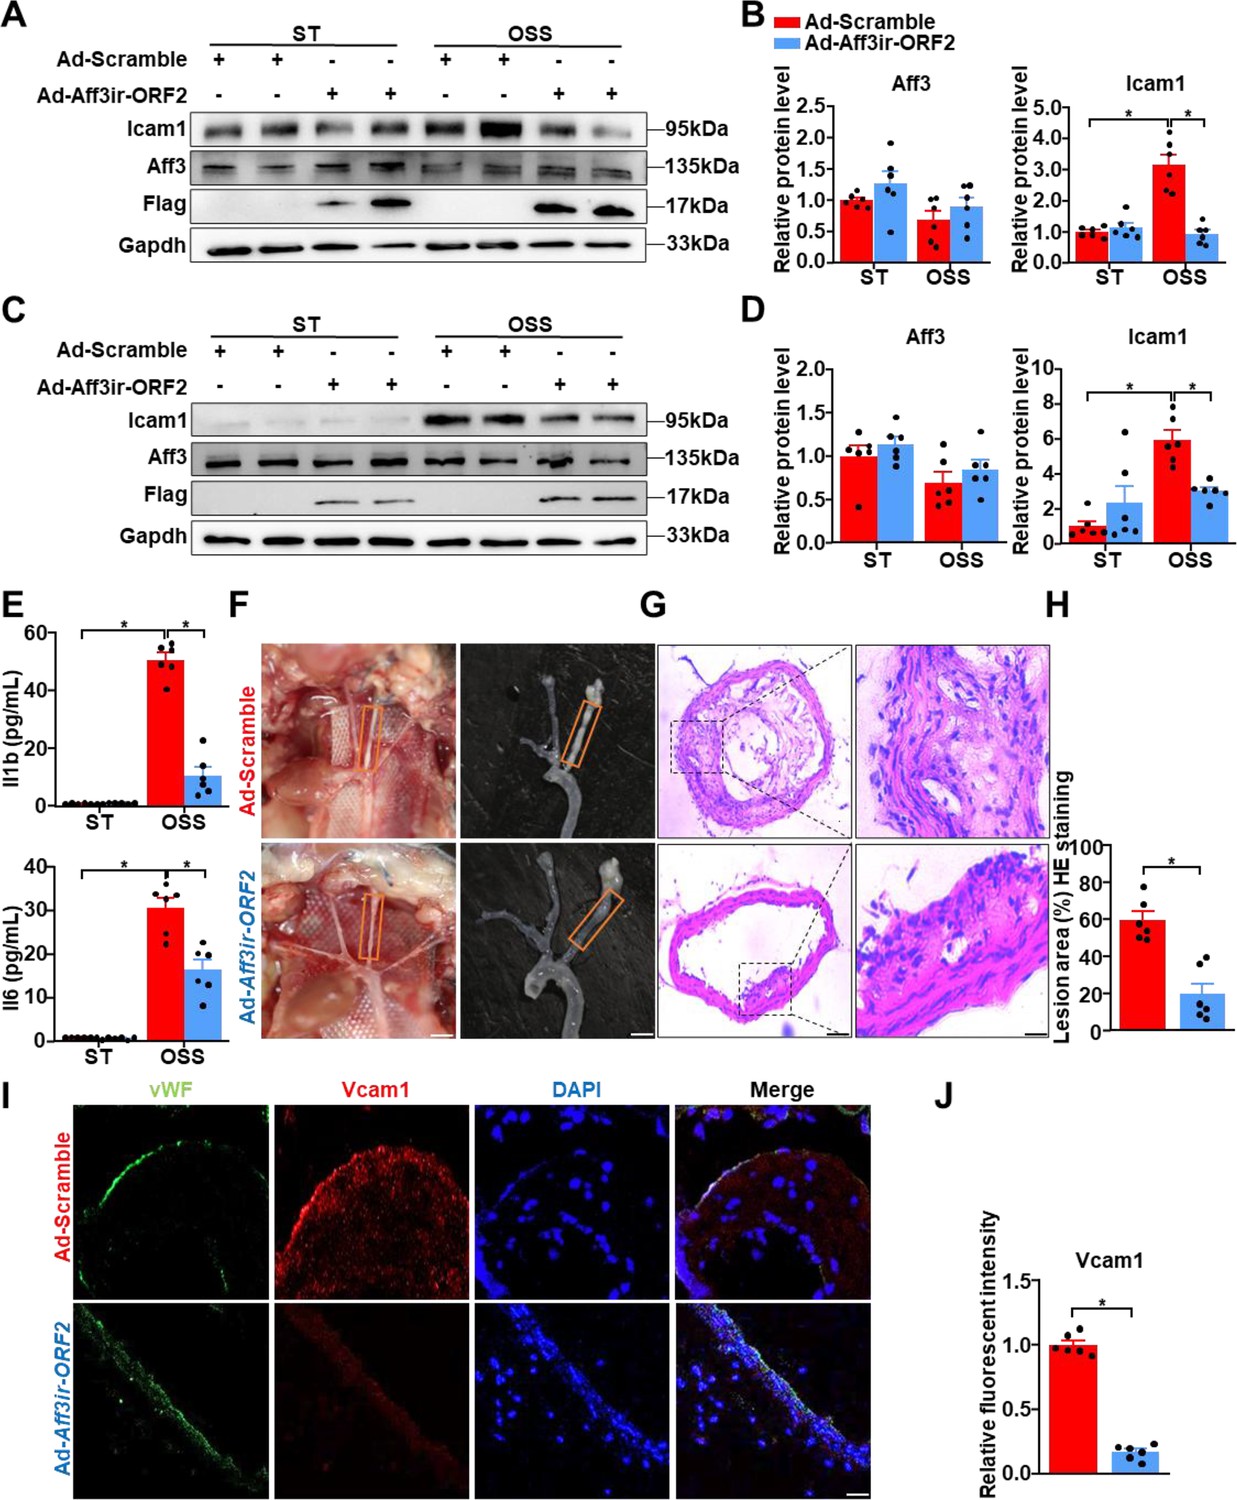
Aff3ir-ORF2 overexpression alleviates disturbed flow-induced inflammation and atherosclerosis.
(A–B) Mouse embryonic fibroblasts (MEFs) isolated from C57BL/6 mice were infected with indicated adenoviruses (Ad-Scramble or Ad-Aff3ir-ORF2) for 48 h and then exposed to static (ST) or oscillatory shear stress (OSS, 0.5±4 dyn/cm2, 1 Hz) for another 6 hr. Western blot analysis of the indicated proteins and quantification of their relative expression levels are shown. The protein levels were normalized to Gapdh and the relative expression values were compared to MEFs infected with Ad-Scramble and treated with ST. Data are presented as mean ± SEM (n=6 independent experiments). *p<0.05, two-way ANOVA with Tukey post-test. (C–D) Human umbilical vein endothelial cells (HUVECs) were infected with Ad-Scramble or Ad-Aff3ir-ORF2 for 48 h and then exposed to ST or OSS for an additional 6 hr. Western blot analysis of the indicated proteins and quantification of their relative expression levels are shown. The protein levels were normalized to Gapdh and the relative expression values were compared to HUVECs infected with Ad-Scramble and treated with ST. Data are presented as mean ± SEM (n=6 independent experiments). *p<0.05, two-way ANOVA with Tukey post-test. (E) MEFs were infected with Ad-Scramble or Ad-Aff3ir-ORF2 for 48 h and then exposed to ST or OSS for another 6 hr. The concentration of Il6 and Il1b in cell culture medium were detected with ELISA. The relative cytokine levels are relative to MEFs infected with Ad-Scramble and treated with ST. Data are presented as mean ± SEM (n=6 independent experiments). *p<0.05, two-way ANOVA with Tukey post-test. (F–J) Eight-wk-old male Apoe−/− mice were subjected to partial ligation of the carotid artery along with 10 μL of adenovirus suspension at 1×10⁸ transducing units (TU)/mL was instilled into the left carotid artery (LCA). The mice were then fed high-fat diet for 4 wk. (F) Arterial tissues were isolated to examine the atherosclerotic lesions. Scale bar, 2 mm. (G, H) LCAs were sectioned for hematoxylin and eosin staining. Quantification of the lesion area in LCAs was shown. Scale bar, 25 μm. Data are presented as mean ± SEM (n=6 mice per group). *p<0.05, unpaired two-tailed t-test. (I, J) Immunofluorescence staining for vWF, Vcam1, and DAPI in the LCAs, and quantification of the relative fluorescent intensity of Vcam1. The immunofluorescence intensity of Vcam1 was normalized to DAPI, and the relative expression values were compared to that of the Ad-Scramble group. Scale bar, 50 μm. Data are presented as mean ± SEM (n=6 mice per group). *p<0.05, unpaired two-tailed t-test.
-
Figure 2—source data 1
The table summarizes the data in the statistical graph for Figure 2B, D, E, H and J.
- https://cdn.elifesciences.org/articles/103413/elife-103413-fig2-data1-v1.xlsx
-
Figure 2—source data 2
The original file of the full raw uncropped, unedited polyacrylamide gels for Figure 2A.
- https://cdn.elifesciences.org/articles/103413/elife-103413-fig2-data2-v1.zip
-
Figure 2—source data 3
Figures with the uncropped polyacrylamide gels with the relevant bands clearly labeled for Figure 2A.
- https://cdn.elifesciences.org/articles/103413/elife-103413-fig2-data3-v1.zip
-
Figure 2—source data 4
The original file of the full raw uncropped, unedited polyacrylamide gels for Figure 2C.
- https://cdn.elifesciences.org/articles/103413/elife-103413-fig2-data4-v1.zip
-
Figure 2—source data 5
Figures with the uncropped polyacrylamide gels with the relevant bands clearly labeled for Figure 2C.
- https://cdn.elifesciences.org/articles/103413/elife-103413-fig2-data5-v1.zip
Figure 2—figure supplement 1
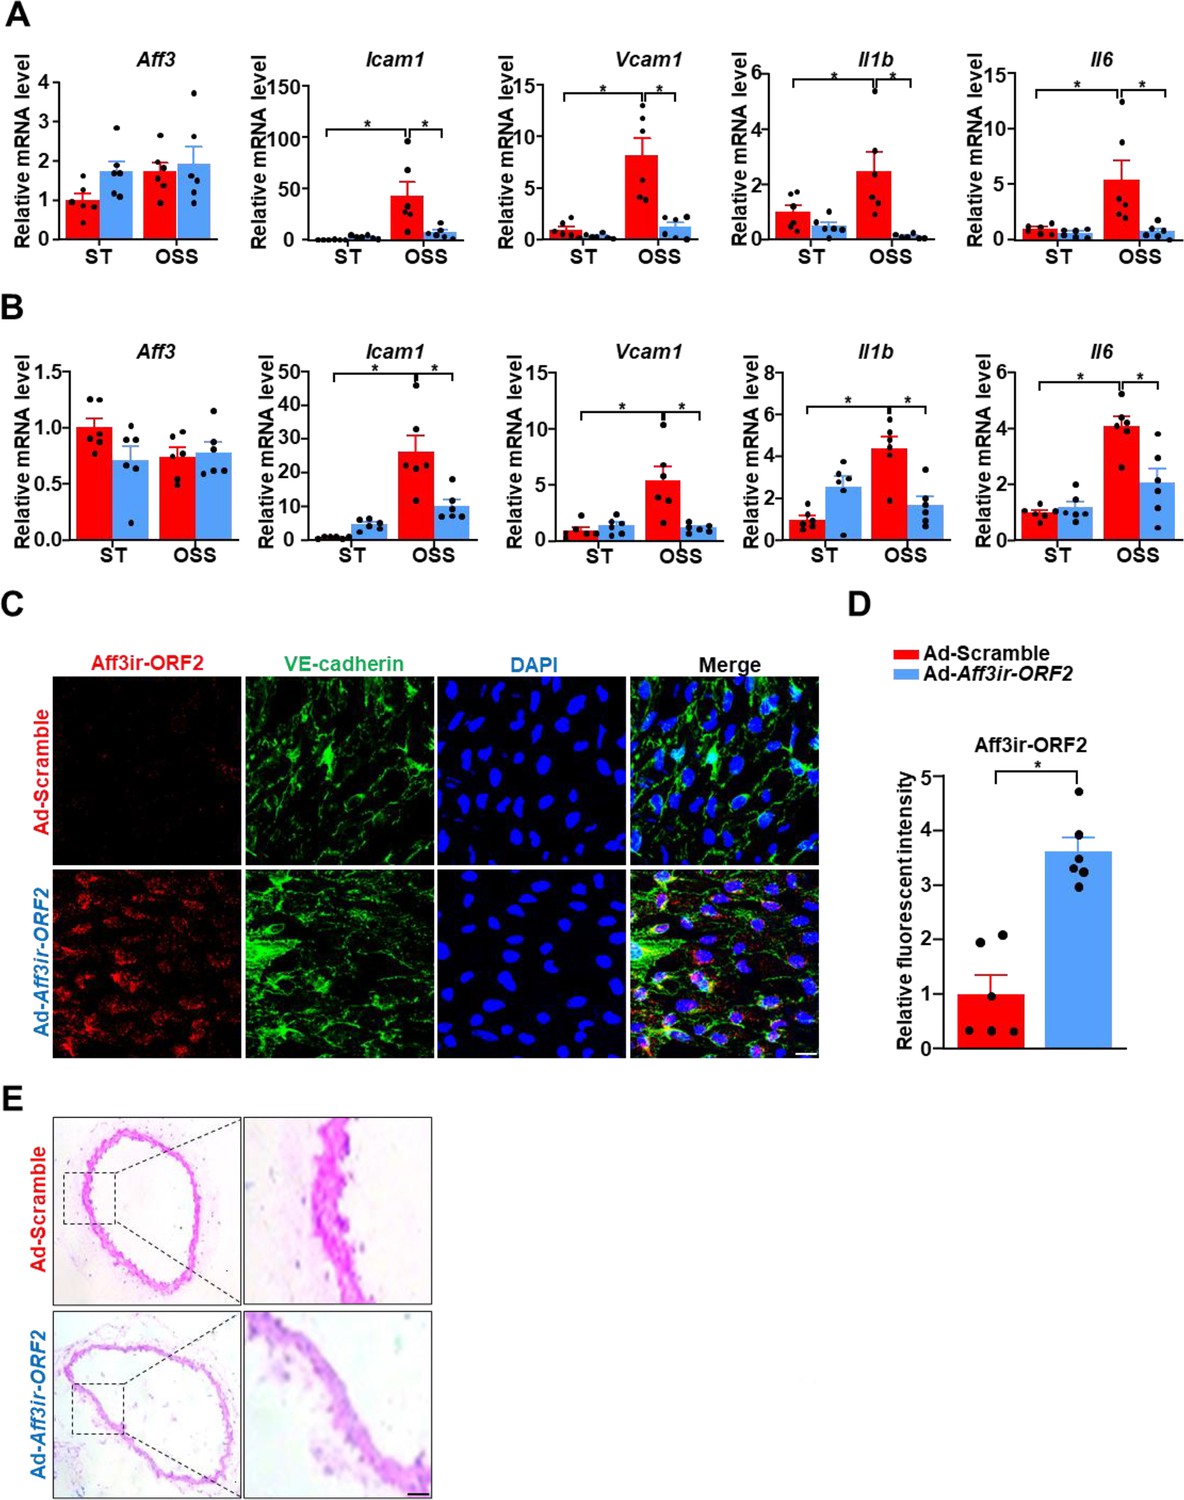
Aff3ir-ORF2 overexpression alleviates disturbed flow-induced inflammation in endothelial cells (ECs).
(A) Mouse embryonic fibroblasts (MEFs) isolated from C57BL/6 mice were infected with indicated adenoviruses (Ad-Scramble or Ad-Aff3ir-ORF2) for 48 hr and then exposed to static (ST) or oscillatory shear stress (OSS, 0.5±4 dyn/cm2, 1 Hz) for another 6 hr. RT-PCR analysis of mRNA levels of Aff3, Vcam1, Icam1, interleukin-6 (Il6), and interleukin-1 beta (Il1b). The relative expression values were compared to MEFs infected with Ad-Scramble and treated with ST. Data are presented as mean ± SEM (n=6 independent experiments). *p<0.05, two-way ANOVA with Tukey post-test. (B) Human umbilical vein endothelial cells (HUVECs) were infected with Ad-Scramble or Ad-Aff3ir-ORF2 for 48 hr and then exposed to ST or OSS for another 6 hr. RT-PCR analysis of mRNA levels of Aff3, Vcam1, Icam1, Il6, and Il1b. The relative expression values were compared to HUVECs infected with Ad-Scramble and treated with ST. Data are presented as mean ± SEM (n=6 independent experiments). *p<0.05, two-way ANOVA with Tukey post-test. (C–D) Enface immunofluorescence staining of Aff3ir-ORF2, VE-cadherin, and DAPI and quantification of Aff3ir-ORF2 expression. Scale bar, 20 μm. The immunofluorescence intensity of Aff3ir-ORF2 was normalized to DAPI and the relative expression values were compared to that of the Ad-Scramble group. Data are presented as mean ± SEM (n=6 mice per group). *p<0.05, unpaired two-tailed t-test. (E), Eight-wk-old male Apoe−/− mice were subjected to partial ligation of the carotid artery along with 10 μL of adenovirus suspension at 1×10⁸ transducing units (TU)/mL was instilled into the left carotid arteries. The mice were then fed high-fat diet for 4 wk. Right carotid arteries were sectioned for hematoxylin and eosin staining.
-
Figure 2—figure supplement 1—source data 1
The table summarizes the data in the statistical graph for Figure 2—figure supplement 1A, B and D.
- https://cdn.elifesciences.org/articles/103413/elife-103413-fig2-figsupp1-data1-v1.xlsx
Figure 3 with 2 supplements
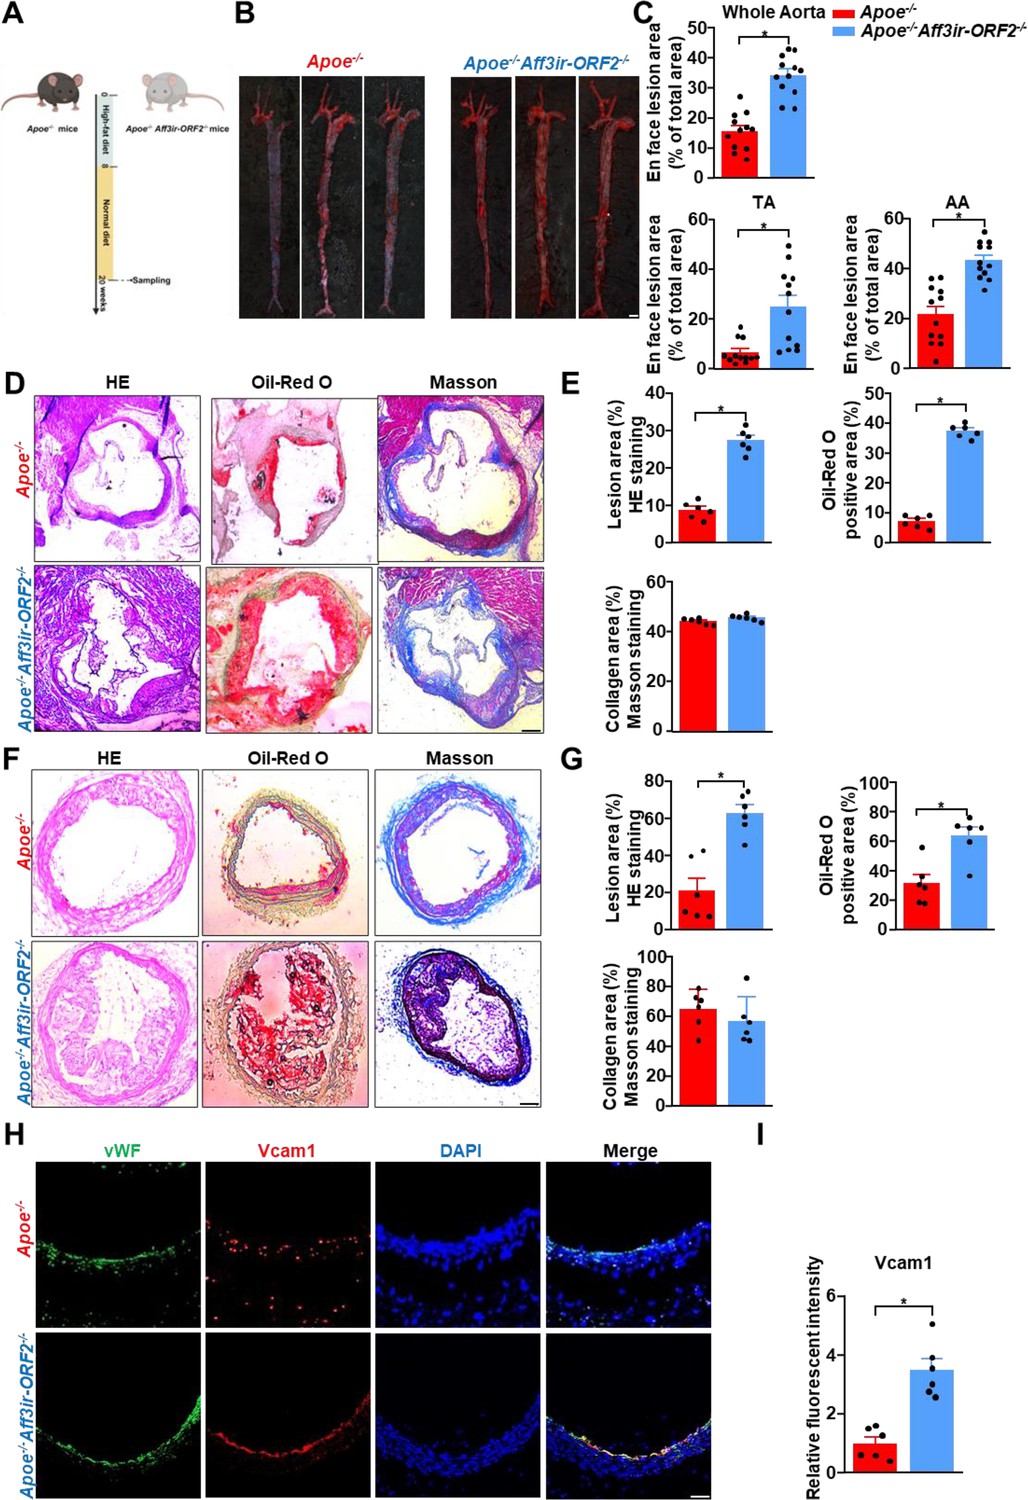
Aff3ir-ORF2 deletion aggravates inflammation and atherosclerotic lesions in Apoe-/- mice.
Eight-wk-old male Apoe-/- and Apoe-/-Aff3ir-ORF2-/- mice were fed a high-fat diet for 12 wk. Arterial tissues and aortic roots were isolated to examine atherosclerotic lesions. (A) Schematic of experimental strategy. (B) Representative images of en face Oil-Red O staining of the aortas. Scale bar, 4 mm. (C) Quantification of the plaque area in the whole aorta, aortic arch (AA), and thoracic aorta (TA). Data are presented as mean ± SEM (n=12 mice per group). *p<0.05, unpaired two-tailed t-test. (D) Oil-Red O, hematoxylin and eosin (HE), and Masson staining of the aortic roots. Scale bars, 500 μm. (E) Quantification of plaque size, Oil-Red O-positive area, and collagen fiber content in aortic root sections. Data are presented as mean ± SEM (n=6 mice per group). *p0.05, unpaired two-tailed t-test. (F), left carotid arteries (LCAs) were sectioned and stained with Oil-Red O, HE, and Masson’s trichrome. Scale bars, 500 μm. (G) Quantification of plaque size, Oil-Red O-positive area, and collagen fiber content in the LCA sections. Data are presented as mean ± SEM (n=6 mice per group). *p<0.05, unpaired two-tailed t-test. (H) Representative immunofluorescence images of vWF, Vcam1, and DAPI in the aortic roots. Scale bar, 500 μm. (I), Quantification of the relative fluorescence intensity of Vcam1. The immunofluorescence intensity of Vcam1 was normalized to that of DAPI, and the relative expression values were compared to that of the Apoe-/- group. Data are presented as mean ± SEM (n=6 mice per group). *p<0.05, unpaired two-tailed t-test.
-
Figure 3—source data 1
The table summarizes the data in the statistical graph for Figure 3A, E, G and I.
- https://cdn.elifesciences.org/articles/103413/elife-103413-fig3-data1-v1.xlsx
Figure 3—figure supplement 1
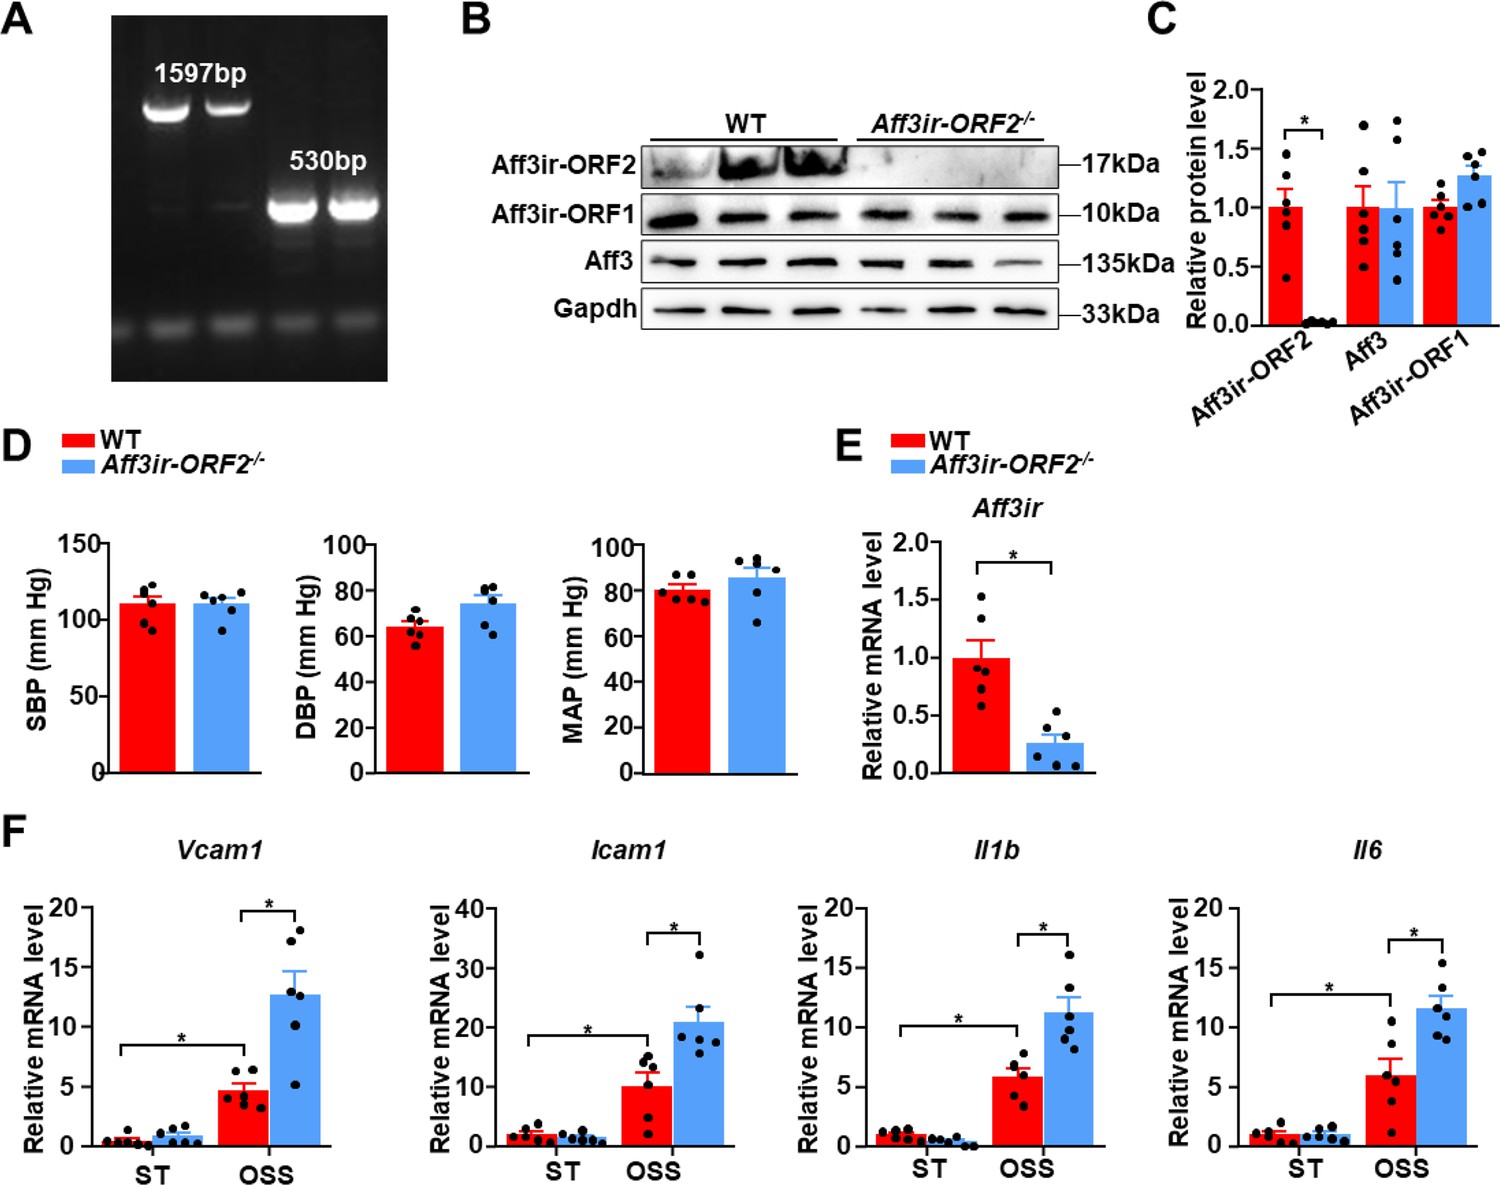
Aff3ir-ORF2 is dispensable for physiological blood pressure maintenance.
(A) Genetic typing of the Aff3ir-ORF2 mice by the PCR-RFLP assay. Lanes 1–2: Wild-type (1597 bp); Lanes 3–4: Aff3ir-ORF2-/- (530 bp). (B–C) Western blot analysis of the expression of the indicated proteins in the intima of WT and Aff3ir-ORF2-/- mice. Protein levels were normalized to Gapdh, and relative expression values were compared to the WT group. Data are presented as mean ± SEM (n=6 mice per group). *p<0.05, unpaired two-tailed t-test. (D) Quantification of systolic blood pressure (SBP), diastolic blood pressure (DBP), and mean artery pressure (MAP) in 8-wk-old male wild-type (WT) and Aff3ir-ORF2-/- mice. Data are presented as mean ± SEM (n=6 mice per group). *p<0.05, unpaired two-tailed t-test. (E) Mouse embryonic fibroblasts (MEFs) isolated from WT and Aff3ir-ORF2-/- mice, and RT-PCR analysis of the mRNA levels of Aff3ir-ORF2. Data are presented as mean ± SEM (n=6 mice per group). *p<0.05, unpaired two-tailed t-test. (F) MEFs isolated from WT and Aff3ir-ORF2-/- mice were exposed to static (ST) or oscillatory shear stress (OSS, 0.5±4 dyn/cm2, 1 Hz) for 6 h. RT-PCR analysis of the mRNA levels of Aff3ir-ORF2, Icam1, and Vcam1, Il6, and Il1b. The relative expression values were compared to that of WT MEFs treated with ST. Data are presented as mean ± SEM (n=6 independent experiments). *p<0.05, two-way ANOVA with Tukey post-test.
-
Figure 3—figure supplement 1—source data 1
The table summarizes the data in the statistical graph for Figure 3—figure supplement 1C, D, E and F.
- https://cdn.elifesciences.org/articles/103413/elife-103413-fig3-figsupp1-data1-v1.xlsx
-
Figure 3—figure supplement 1—source data 2
The original file of the full raw uncropped, unedited polyacrylamide gels for Figure 3—figure supplement 1B.
- https://cdn.elifesciences.org/articles/103413/elife-103413-fig3-figsupp1-data2-v1.zip
-
Figure 3—figure supplement 1—source data 3
Figures with the uncropped polyacrylamide gels with the relevant bands clearly labeled for Figure 3—figure supplement 1B.
- https://cdn.elifesciences.org/articles/103413/elife-103413-fig3-figsupp1-data3-v1.zip
-
Figure 3—figure supplement 1—source data 4
The original file of the full raw uncropped, unedited agarose gels for Figure 3—figure supplement 1A.
- https://cdn.elifesciences.org/articles/103413/elife-103413-fig3-figsupp1-data4-v1.zip
-
Figure 3—figure supplement 1—source data 5
Figures with the uncropped agarose gels with the relevant bands clearly labeled for Figure 3—figure supplement 1A.
- https://cdn.elifesciences.org/articles/103413/elife-103413-fig3-figsupp1-data5-v1.zip
Figure 3—figure supplement 2
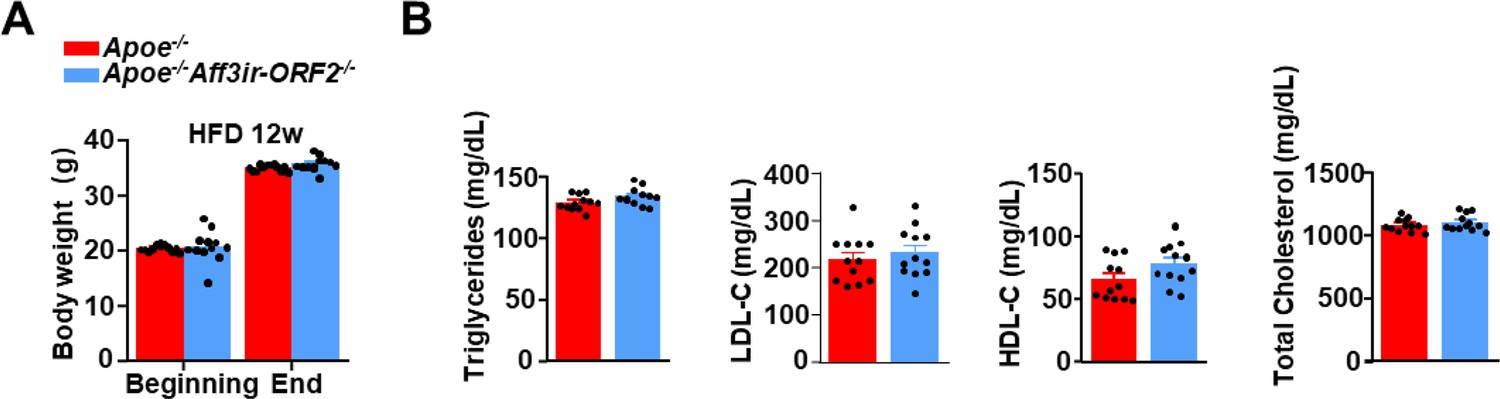
Aff3ir-ORF2 is dispensable for lipid metabolism maintenance.
Eight-wk-old male Apoe-/- and Apoe-/-ORF2-/- mice were fed a high-fat diet (HFD) for 12 wk. (A) Quantification of body weight at the beginning and end of the experiment. Data are presented as mean ± SEM (n=12 mice per group). *p<0.05, two-way ANOVA with Tukey post-test. (B) Quantification of plasma levels of triglycerides, total cholesterol, low-density lipoprotein cholesterol (LDL-C), and high-density lipoprotein cholesterol (HDL-C). Data are presented as mean ± SEM (n=12 mice per group). *p<0.05, unpaired two-tailed t-test.
-
Figure 3—figure supplement 2—source data 1
The table summarizes the data in the statistical graph for Figure 3—figure supplement 2A, B.
- https://cdn.elifesciences.org/articles/103413/elife-103413-fig3-figsupp2-data1-v1.xlsx
Figure 4 with 1 supplement
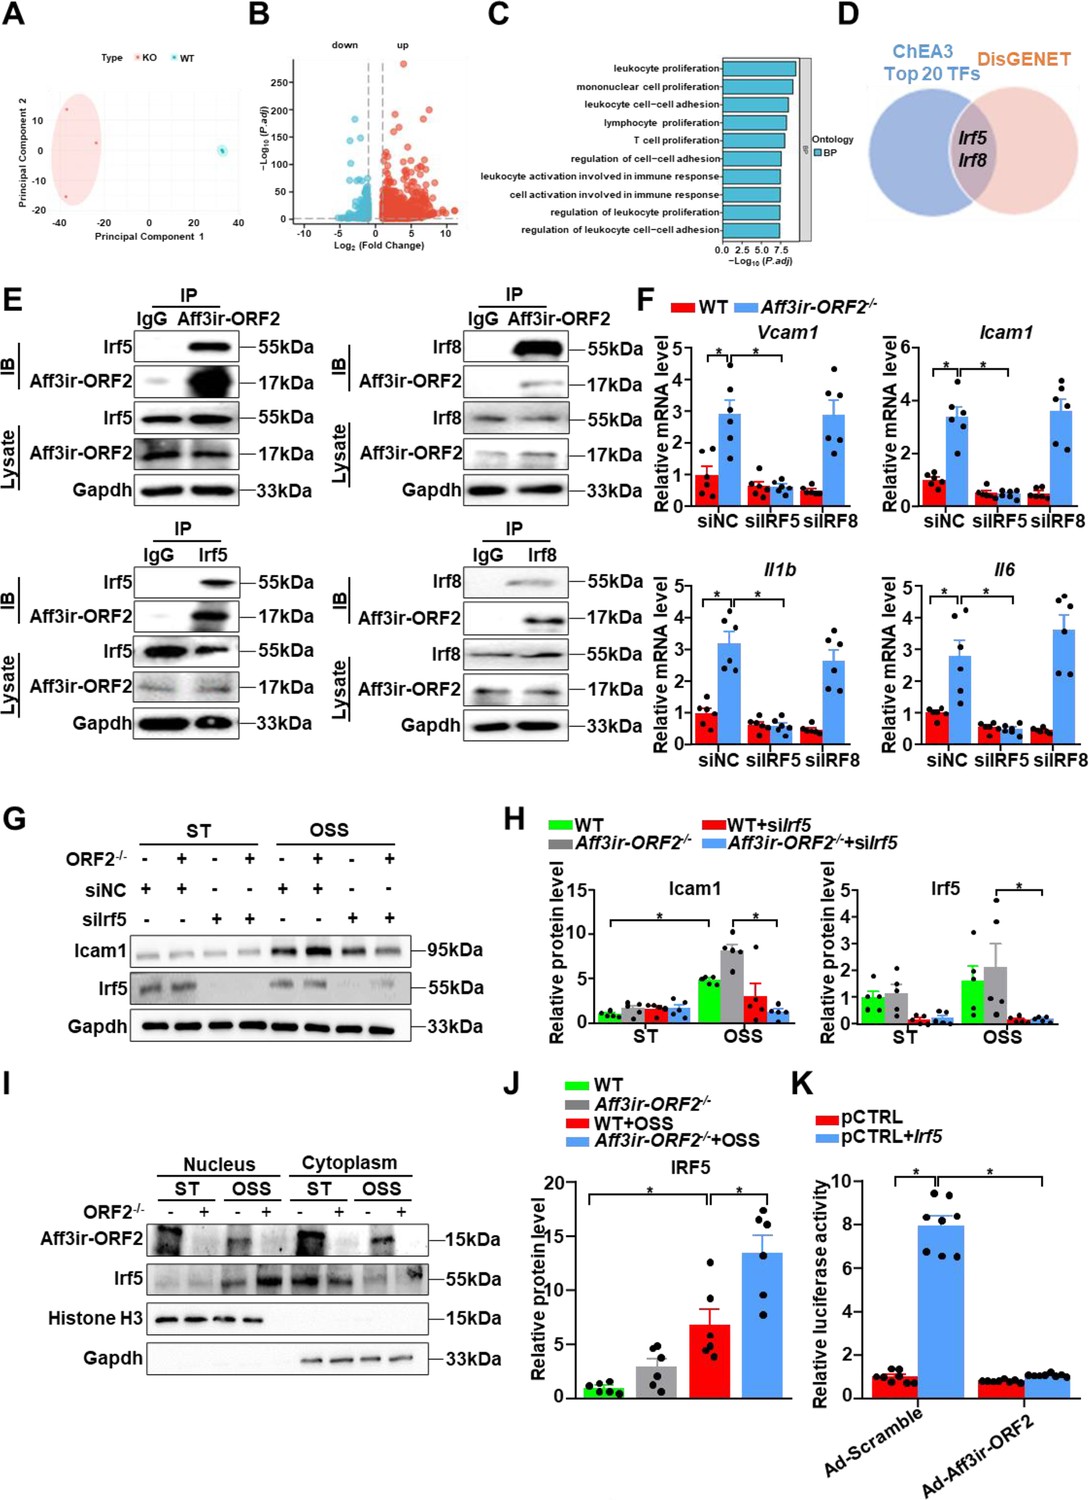
Aff3ir-ORF2 mitigates disturbed shear stress-induced inflammation by interacting with Irf5 and retaining it within the cytosol.
(A–D) Mouse embryonic fibroblasts (MEFs) were isolated from wild-type (WT) and Aff3ir-ORF2-/- mice. (A) Principal component analysis (PCA) analysis of RNA-seq data to visualize sample-to-sample variation. (B) Volcano map showing mRNA profiles of WT and Aff3ir-ORF2-/- MEFs (n=3). (C) Gene Ontology enrichment pathway analysis of the differentially expressed genes. (D) Venn diagrams of the top 20 transcription factors from the ChEA3 and DisGENET analysis related to atherosclerosis. (E) Immunoprecipitation performed using antibodies against Aff3ir-ORF2, Irf5, and Irf8. n=3 independent experiments. (F–H), WT and Aff3ir-ORF2-/- MEFs were subjected to silence of Control (siNC), Irf5 (siIrf5), or Irf8 (siIrf8) with siRNAs for 24 hr, followed by exposure to static (ST) or oscillatory shear stress (OSS, 0.5±4 dyn/cm2, 1 Hz) for another 6 hr. (F) RT-PCR analysis of the mRNA levels of Vcam1, Icam1, Il6, and Il1b. The relative expression values were compared to WT MEFs transfected with siNC and treated with ST. Data are mean ± SEM (n=6 independent experiments). *p<0.05, two-way ANOVA with Tukey post-test. (G–H), Representative western blots of Irf5 and Icam1 expression. Data are mean ± SEM (n=5 independent experiments). *p<0.05, two-way ANOVA with Tukey post-test. (I–J), WT, and Aff3ir-ORF2-/- MEFs were exposed to ST or OSS for 6 hr. Nuclear and cytoplasmic proteins were extracted from the cells. Representative western blots of the indicated proteins and quantification of Irf5 expression in nucleus are shown. The expression of these proteins was relative to the level of nuclear Irf5 in ST-treated WT MEFs. Data are mean ± SEM (n=6 independent experiments). *p<0.05, one-way ANOVA with Tukey post-test. (K) HEK293 cells were transfected with the firefly luciferase reporter plasmid containing the Irf5-responsive ZNF217 promoter along with a β-galactosidase reporter plasmid for 24 hr. Cells were infected with the indicated adenoviruses (Ad-Scramble or Ad-Aff3ir-ORF2) for 24 h. Promoter activity was measured using luciferase, which was normalized to β-gal. Data are mean ± SEM (n=6 independent experiments). *p<0.05, two-way ANOVA with Tukey post-test.
-
Figure 4—source data 1
The table summarizes the data in the statistical graph for Figure 4F, H, J and K.
- https://cdn.elifesciences.org/articles/103413/elife-103413-fig4-data1-v1.xlsx
-
Figure 4—source data 2
The original file of the full raw uncropped, unedited polyacrylamide gels for Figure 4E.
- https://cdn.elifesciences.org/articles/103413/elife-103413-fig4-data2-v1.zip
-
Figure 4—source data 3
Figures with the uncropped polyacrylamide gels with the relevant bands clearly labeled for Figure 4E.
- https://cdn.elifesciences.org/articles/103413/elife-103413-fig4-data3-v1.zip
-
Figure 4—source data 4
The original file of the full raw uncropped, unedited polyacrylamide gels for Figure 4G.
- https://cdn.elifesciences.org/articles/103413/elife-103413-fig4-data4-v1.zip
-
Figure 4—source data 5
Figures with the uncropped polyacrylamide gels with the relevant bands clearly labeled for Figure 4G.
- https://cdn.elifesciences.org/articles/103413/elife-103413-fig4-data5-v1.zip
-
Figure 4—source data 6
The original file of the full raw uncropped, unedited polyacrylamide gels for Figure 4I.
- https://cdn.elifesciences.org/articles/103413/elife-103413-fig4-data6-v1.zip
-
Figure 4—source data 7
Figures with the uncropped polyacrylamide gels with the relevant bands clearly labeled for Figure 4I.
- https://cdn.elifesciences.org/articles/103413/elife-103413-fig4-data7-v1.zip
Figure 4—figure supplement 1
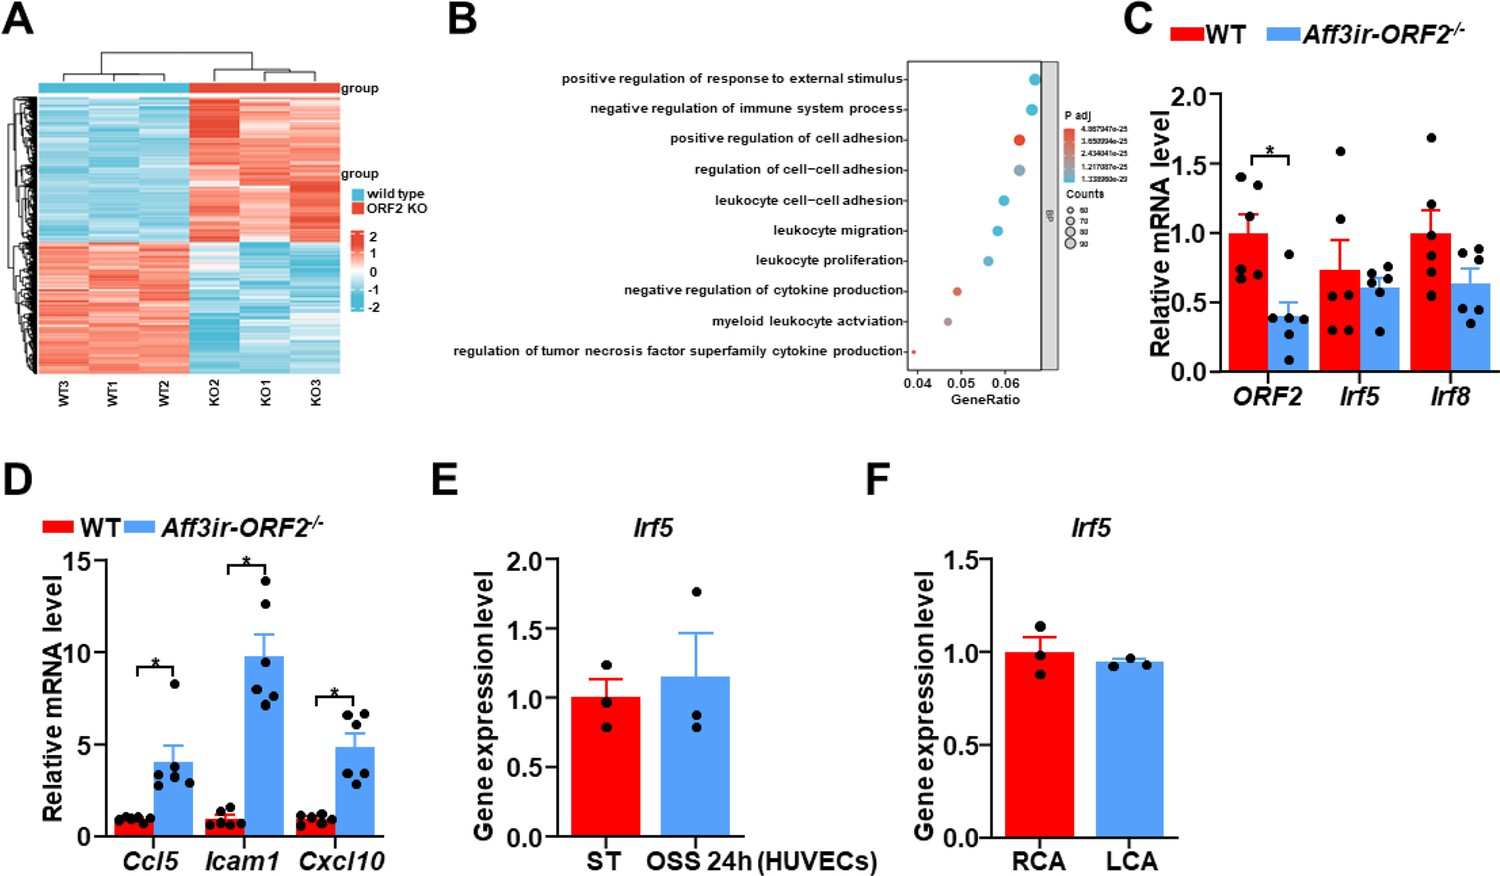
Aff3ir-ORF2 deficiency significantly increased the expression of Irf5-targeted genes.
(A) Heat map showing profiles of all the differentially expressed genes from the RNA-seq analysis of wild-type (WT) and Aff3ir-ORF2-/- mouse embryonic fibroblasts (MEFs) (n=3). (B) All the differentially expressed genes from the RNA-seq data were mapped onto the atherosclerosis-related gene dataset. The overlapping genes were then subjected to Gene Ontology enrichment pathway analysis. (C), RT-PCR analysis of the mRNA levels of ORF2, Irf5, and Irf8 in WT and Aff3ir-ORF2-/- MEFs. The relative expression values were normalized to WT MEFs. Data are mean ± SEM (n=6 independent experiments). *p<0.05, unpaired two-tailed t-test. (D) RT-PCR analysis of the mRNA levels of Ccl5, Icam1, and Cxcl10 in WT and Aff3ir-ORF2-/- MEFs. The relative expression values were compared to WT MEFs. Data are mean ± SEM (n=6 independent experiments). *p<0.05, unpaired two-tailed t-test. (E), Irf5 mRNA levels in HUVECs under static (ST) and oscillatory shear stress (OSS, 0.5±4 dyn/cm2, 1 Hz) conditions for 24 hr were shown. The mRNA expression levels were sourced from the GEO database (GSE276195). Data are mean ± SEM (n=3). (F), Partial carotid ligation was performed on the left carotid artery (LCA) of the mouse while the right carotid artery (RCA) was left untouched. Irf5 mRNA levels in LCAs and RCAs were shown. The mRNA expression levels were sourced from the GEO database (GSE222583). Data are mean ± SEM (n=3).
-
Figure 4—figure supplement 1—source data 1
Figures with the uncropped agarose gels with the relevant bands clearly labeled for Figure 4—figure supplement 1C, D, E and F.
- https://cdn.elifesciences.org/articles/103413/elife-103413-fig4-figsupp1-data1-v1.xlsx
Figure 5 with 1 supplement

Irf5 knockdown prevents the aggravation of atherosclerosis in Aff3ir-ORF2 deficient mice.
Eight-wk-old male Apoe-/- mice were subjected to partial ligation of the left carotid artery (LCA) along with 10 μL of lentivirus suspension at 1×10⁸ transducing units (TU)/mL was instilled into the LCA. The mice were then fed a high-fat diet for 4 wk. (A–B) Arterial tissues were isolated to examine the atherosclerotic lesions. LCAs were sectioned for hematoxylin and eosin staining. Quantification of the lesion area in LCAs was shown. Data are mean ± SEM (n=6 mice per group). *p<0.05, two-way ANOVA with Tukey post-test. Scale bar: 2 mm for gross images, 25 μm for staining images. (C–D) Immunofluorescence staining for vWF, Vcam1, and DAPI in the LCAs and quantification of the relative fluorescent intensity of Vcam1. Scale bar, 50 μm. The immunofluorescence intensity of Vcam1 was normalized to DAPI, and the relative expression values were compared to that of the group of Apoe-/- mice infected with Ad-scramble. Data are presented as mean ± SEM (n=6 mice per group). *p<0.05, two-way ANOVA with Tukey post-test.
-
Figure 5—source data 1
The table summarizes the data in the statistical graph for Figure 5B and D.
- https://cdn.elifesciences.org/articles/103413/elife-103413-fig5-data1-v1.xlsx
Figure 5—figure supplement 1
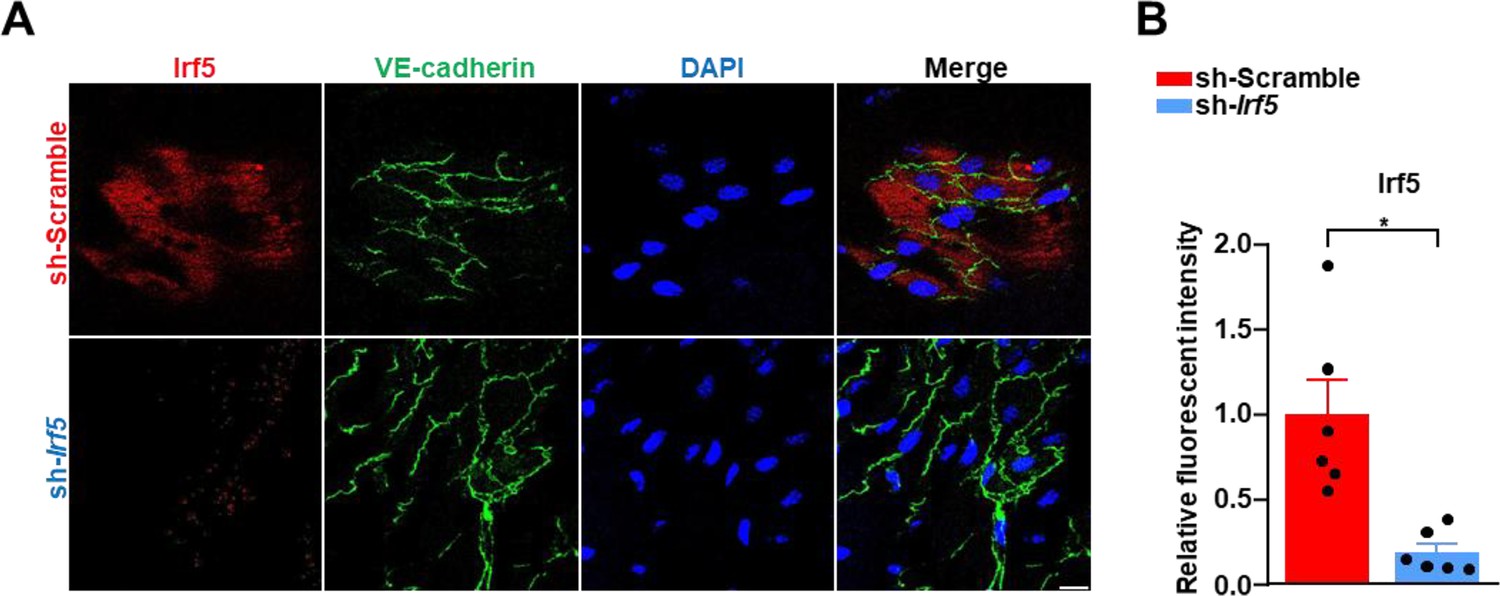
Irf5 deletion in the left carotid artery successfully.
(A–B) Enface immunofluorescence staining of Irf5, VE-cadherin, and DAPI and quantification of Irf5 expression. Scale bar, 20 μm. The immunofluorescence intensity of Irf5 was normalized to DAPI, and the relative expression values were compared to that of sh-Scramble group. Data are presented as mean ± SEM (n=6 mice per group). *p<0.05, unpaired two-tailed t-test.
-
Figure 5—figure supplement 1—source data 1
Figures with the uncropped agarose gels with the relevant bands clearly labeled for Figure 5—figure supplement 1B.
- https://cdn.elifesciences.org/articles/103413/elife-103413-fig5-figsupp1-data1-v1.xlsx
Figure 6 with 1 supplement
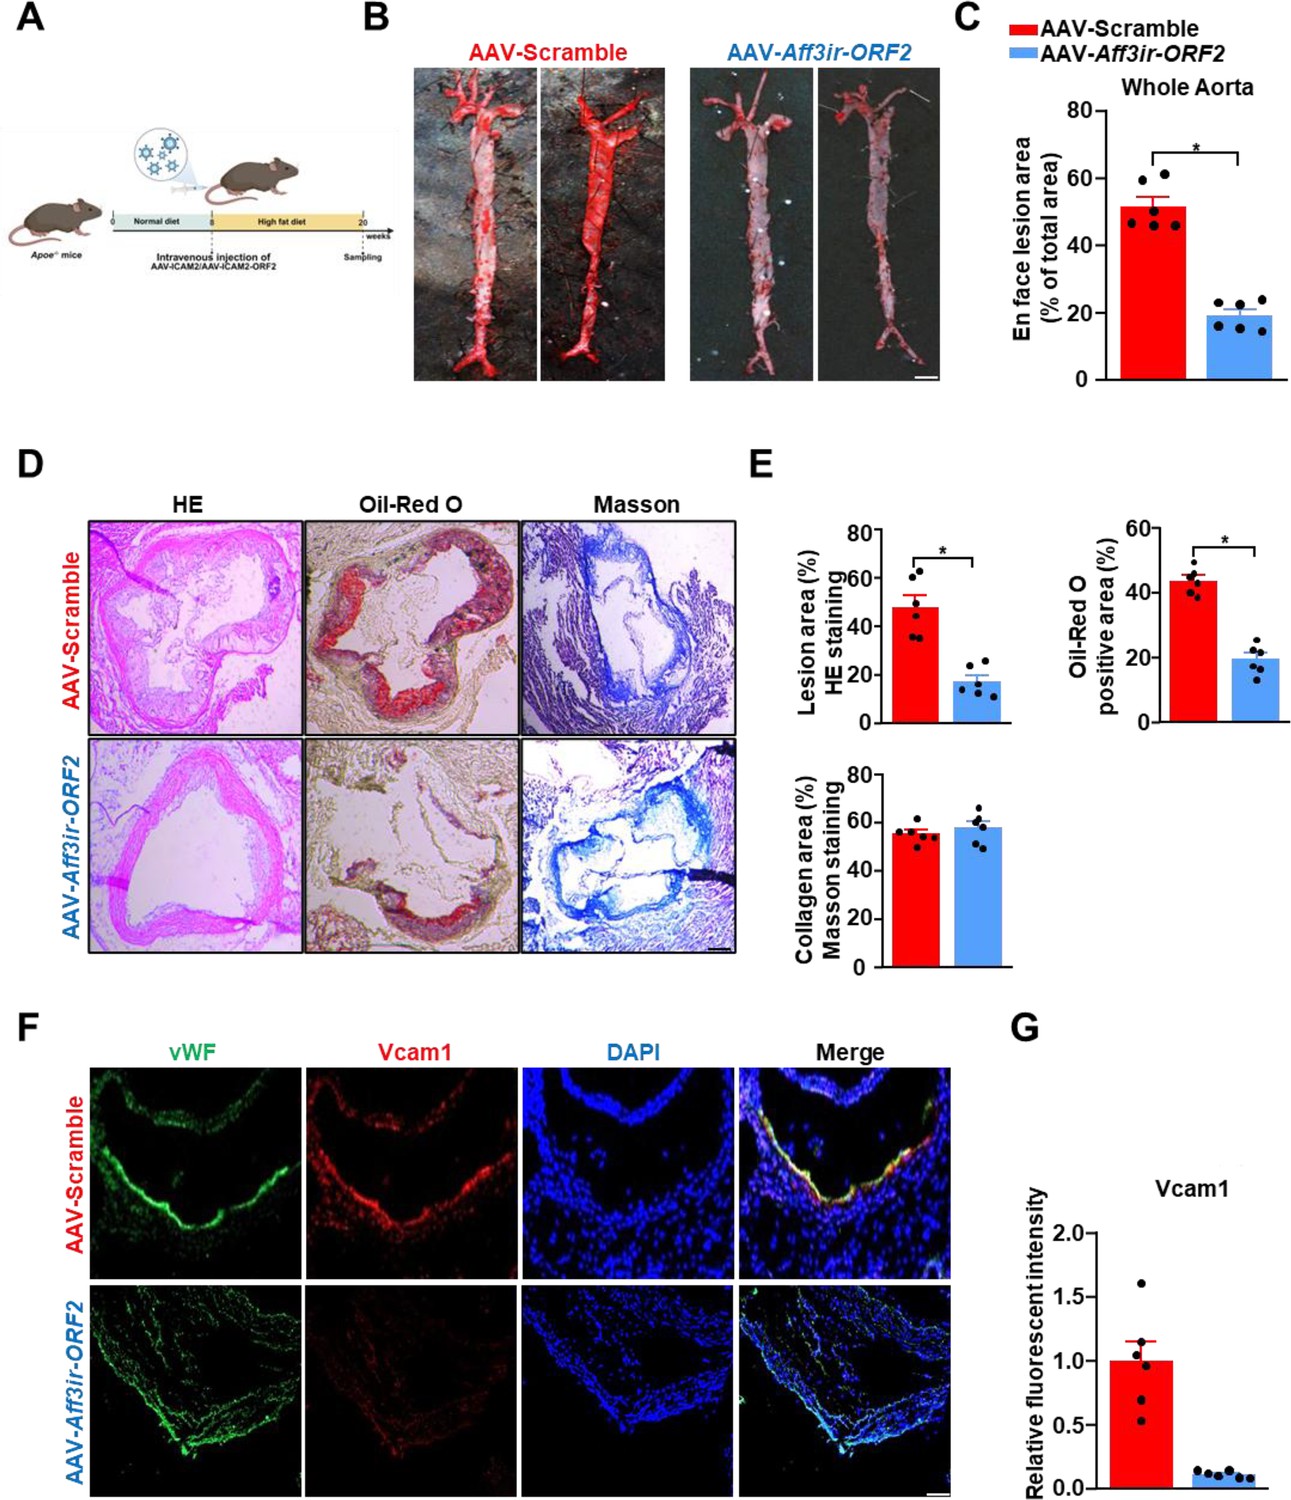
Endothelial-specific Aff3ir-ORF2 supplementation alleviates EC activation and atherosclerosis in Apoe-/- mice.
Eight-wk old Apoe-/- male mice were infused with the indicated adeno-associated virus (AAV) and then fed a high-fat diet for 12 wk. (A) Schematic of the experimental strategy. (B) Representative images of enface Oil-Red O staining of the aortas. Scale bar, 4 mm. (C) Quantification of the plaque area in the entire aortas. Data are presented as mean ± SEM (n=6 mice per group). *p<0.05, unpaired two-tailed t-test. (D) Hematoxylin and eosin (HE), Oil-Red O, and Masson staining of the aortic roots. Scale bars, 500 μm. (E) Quantification of plaque size, Oil-Red O-positive area, and collagen fiber content in aortic root sections. Data are presented as mean ± SEM (n=6 mice per group). *p<0.05, unpaired two-tailed t-test. (F) Representative immunofluorescence image of vWF, Vcam1, and DAPI in the aortic roots. Scale bar, 500 μm. (G) Quantification of the relative fluorescent intensity of Vcam1. The immunofluorescence intensity of Vcam1 was normalized to that of DAPI, and the relative expression values were compared to that of the AAV-Scramble group. Data are presented as mean ± SEM (n=6 mice per group). *p<0.05, unpaired two-tailed t-test.
-
Figure 6—source data 1
The table summarizes the data in the statistical graph for Figure 6C, E and G.
- https://cdn.elifesciences.org/articles/103413/elife-103413-fig6-data1-v1.xlsx
Figure 6—figure supplement 1
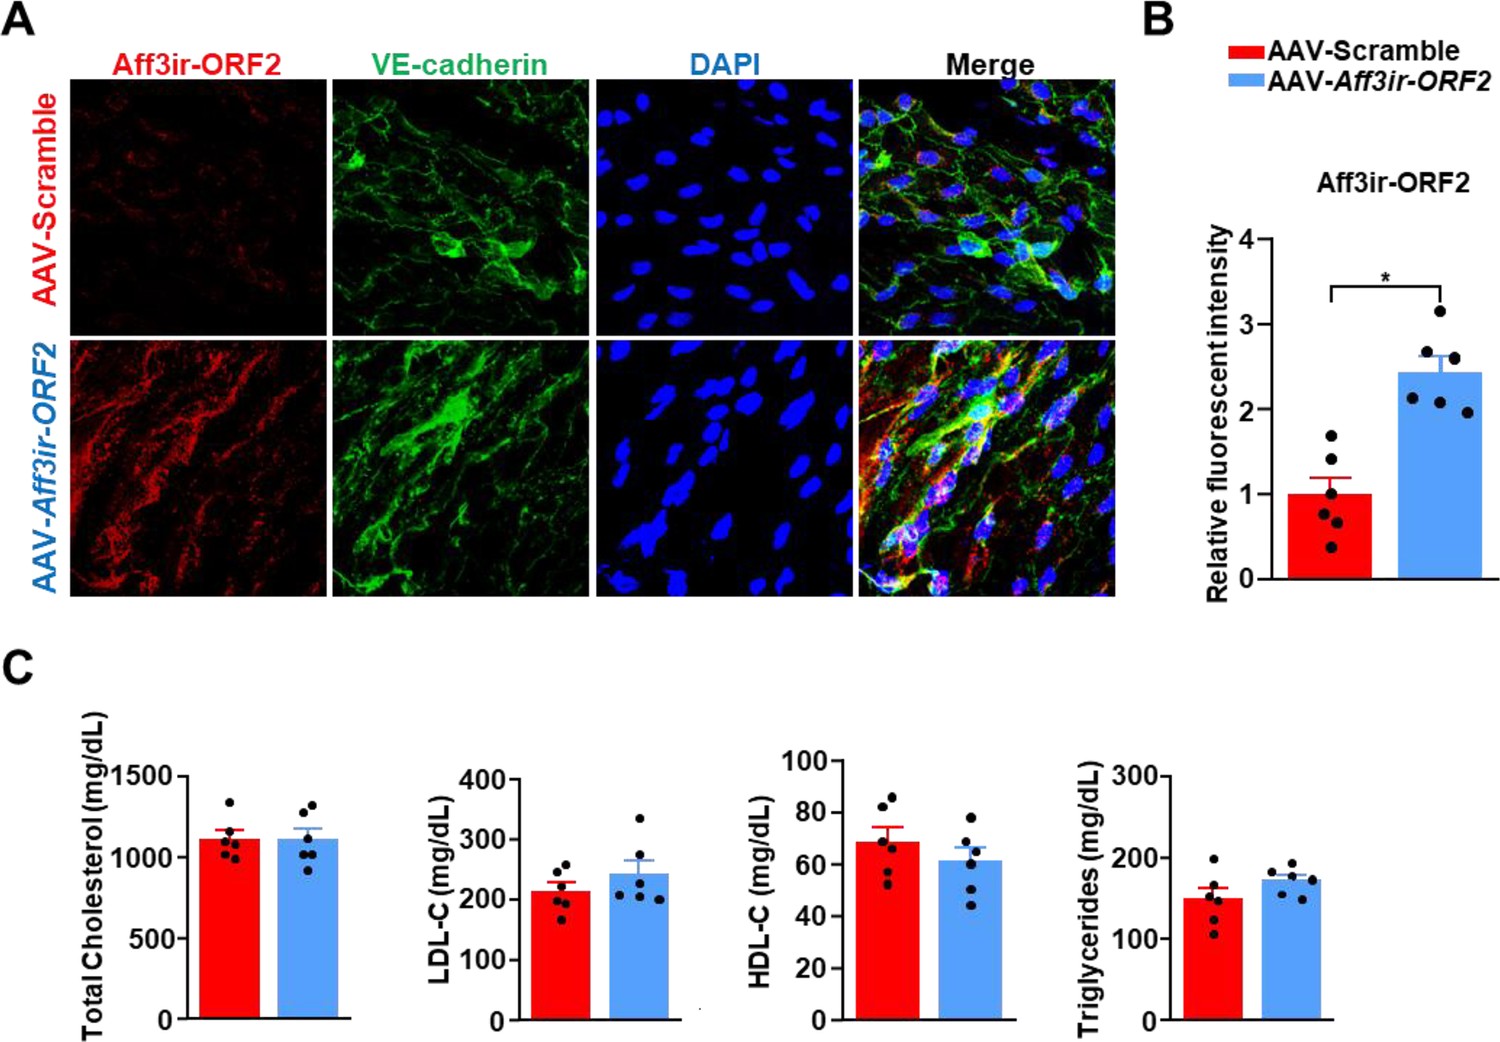
Aff3ir-ORF2 overexpression in endothelial cells (ECs) successfully.
(A–B) Enface immunofluorescence staining of Aff3ir-ORF2, VE-cadherin, and DAPI and quantification of Aff3ir-ORF2 expression. Scale bar, 20 μm. The immunofluorescence intensity of Aff3ir-ORF2 was normalized to DAPI, and the relative expression values were compared to that of the AAV-Scramble group. Data are presented as mean ± SEM (n=6 mice per group). *p<0.05, unpaired two-tailed t-test. (C) Quantification of plasma levels of triglycerides, total cholesterol, low-density lipoprotein cholesterol (LDL-C), and high-density lipoprotein cholesterol (HDL-C). Data are presented as mean ± SEM (n=6 mice per group). *p<0.05, unpaired two-tailed t-test.
-
Figure 6—figure supplement 1—source data 1
Figures with the uncropped agarose gels with the relevant bands clearly labeled for Figure 6—figure supplement 1B and C.
- https://cdn.elifesciences.org/articles/103413/elife-103413-fig6-figsupp1-data1-v1.xlsx
Figure 7
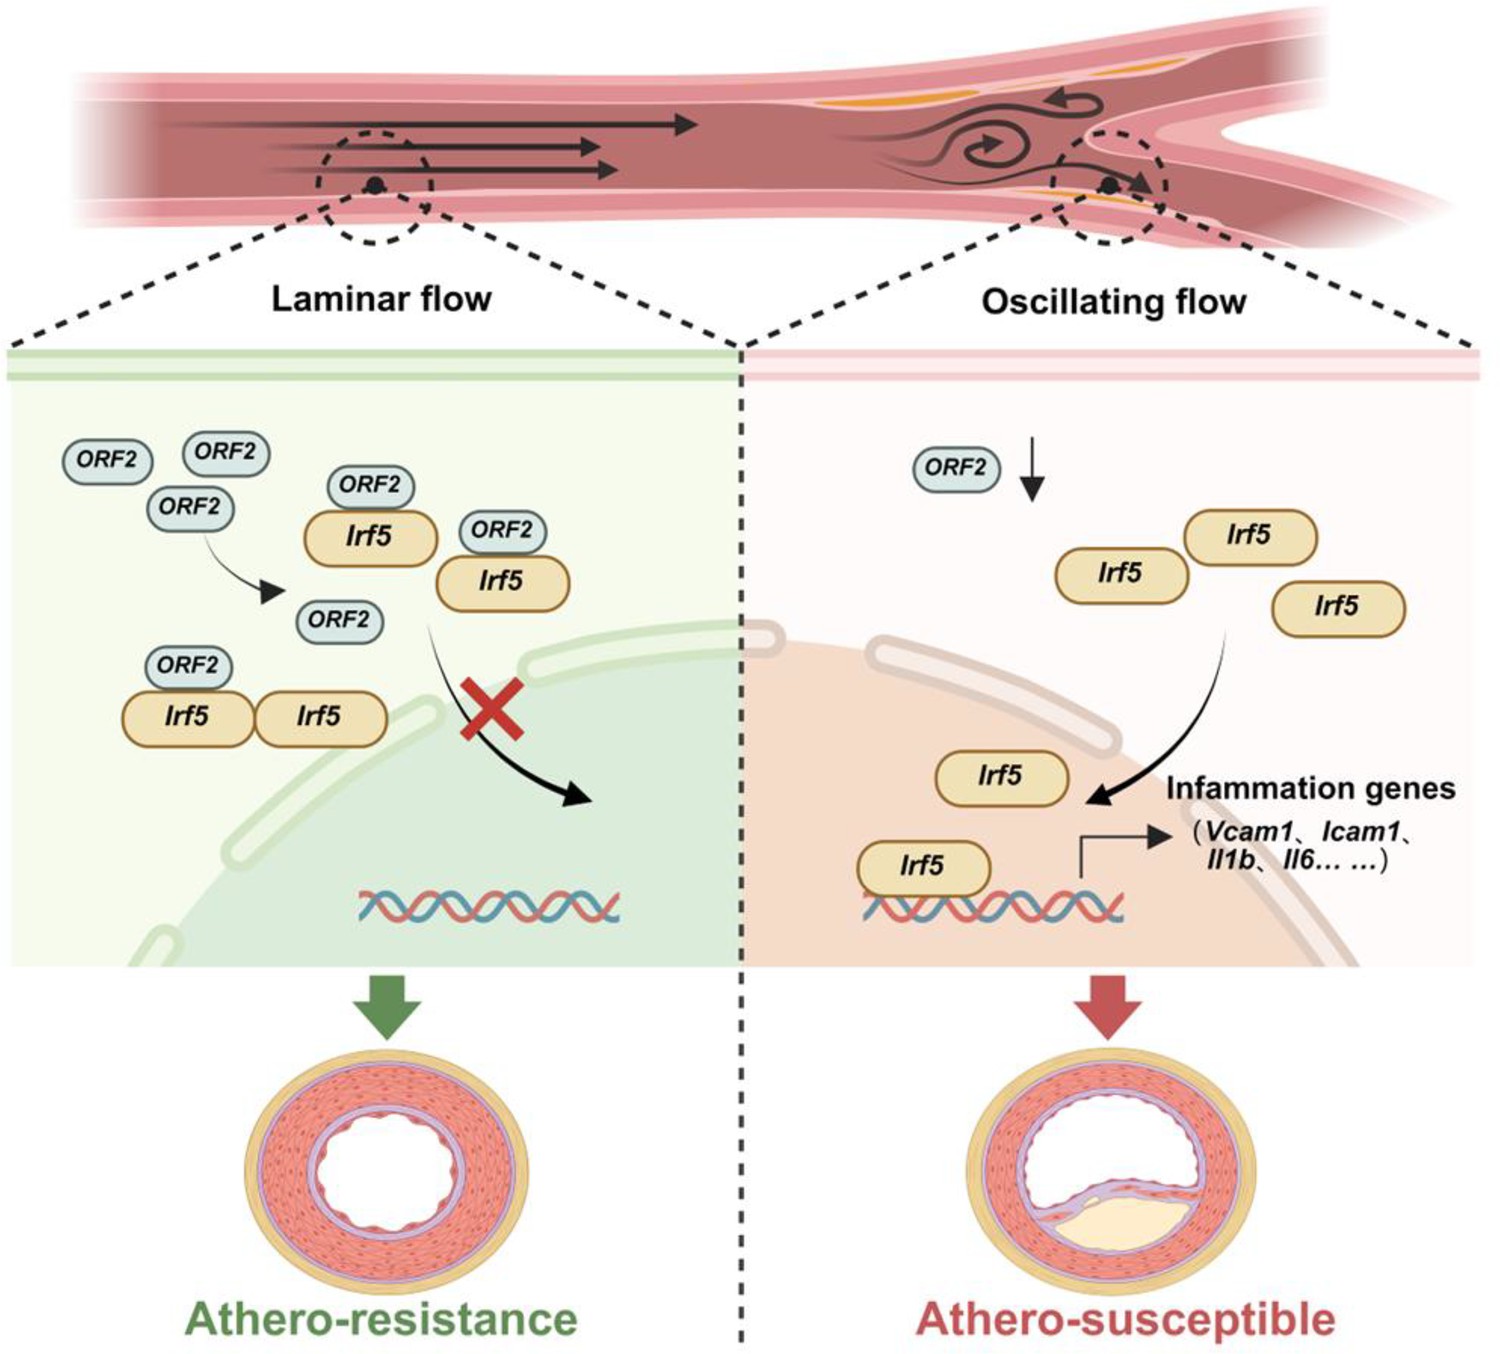
Schematic illustration of the Aff3ir-ORF2/Irf5 cascade in disturbed flow-induced endothelial activation and atherosclerosis.
Disturbed flow induced a down-regulation of Aff3ir-ORF2, which could interact with Irf5 and promote the latter’s retention in the cytoplasm, thereby boosting Irf5-dependent inflammatory pathways in endothelial cells and leading to atherogenesis.
Additional files
-
MDAR checklist
- https://cdn.elifesciences.org/articles/103413/elife-103413-mdarchecklist1-v1.docx
-
Supplementary file 1
The sequences of siRNAs.
- https://cdn.elifesciences.org/articles/103413/elife-103413-supp1-v1.docx
-
Supplementary file 2
Primers for qRT-PCR.
- https://cdn.elifesciences.org/articles/103413/elife-103413-supp2-v1.docx
-
Supplementary file 3
Expression of all differentially expressed genes from RNA-seq.
- https://cdn.elifesciences.org/articles/103413/elife-103413-supp3-v1.xlsx
Download links
A two-part list of links to download the article, or parts of the article, in various formats.
Downloads (link to download the article as PDF)
Open citations (links to open the citations from this article in various online reference manager services)
Cite this article (links to download the citations from this article in formats compatible with various reference manager tools)
Disruption of the novel nested gene Aff3ir mediates disturbed flow-induced atherosclerosis in mice
eLife 13:RP103413.
https://doi.org/10.7554/eLife.103413.3


