Selectively driving cholinergic fibers optically in the thalamic reticular nucleus promotes sleep
- Zhejiang University School of Medicine, China
- Fuzhou Children's Hospital, China
- University of California, San Diego, United States
- Zhejiang University, China
Figures
Figure 1
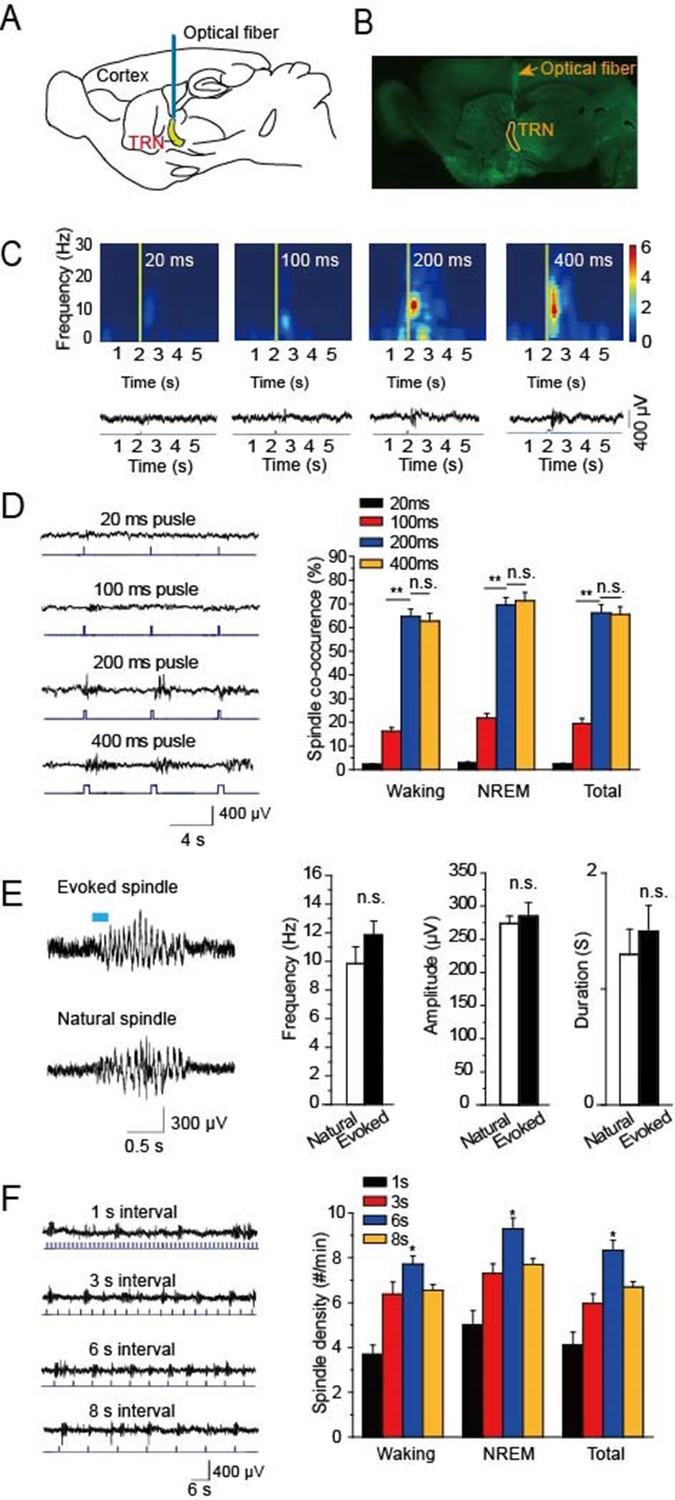
Optical driving of cholinergic fibers in the TRN generated spindle oscillations.
(A) Placement of optical fiber above the TRN in ChAT-ChR2 mice. (B) Histological imaging of implant location of optical fibers. (C) Upper, power spectrograms of EEG following stimulation for 20 ms, 100 ms, 200 ms, or 400 ms, respectively. Lower, representative spindle traces evoked by stimulation for 20 ms, 100 ms, 200 ms, or 400 ms, respectively. (D) Left, spindles evoked by different stimulation intensity. Right, average spindle co-occurrence rates during waking, NREM, and total recording periods. (E) Left, representative evoked spindle oscillation and natural spindle oscillation. Right, statistical analysis of spindle frequency, amplitude and duration. (F) Average spindle density induced by 200 ms stimulation of 1 s, 3 s, 6 s, 8 s intervals during waking, NREM, and total recording periods. Data represent mean ± SEM (n = 8 mice; **p < 0.01, two-tailed t-test between 200 ms stimulation and 400 ms stimulation or 100 ms stimulation).
Figure 2 with 1 supplement
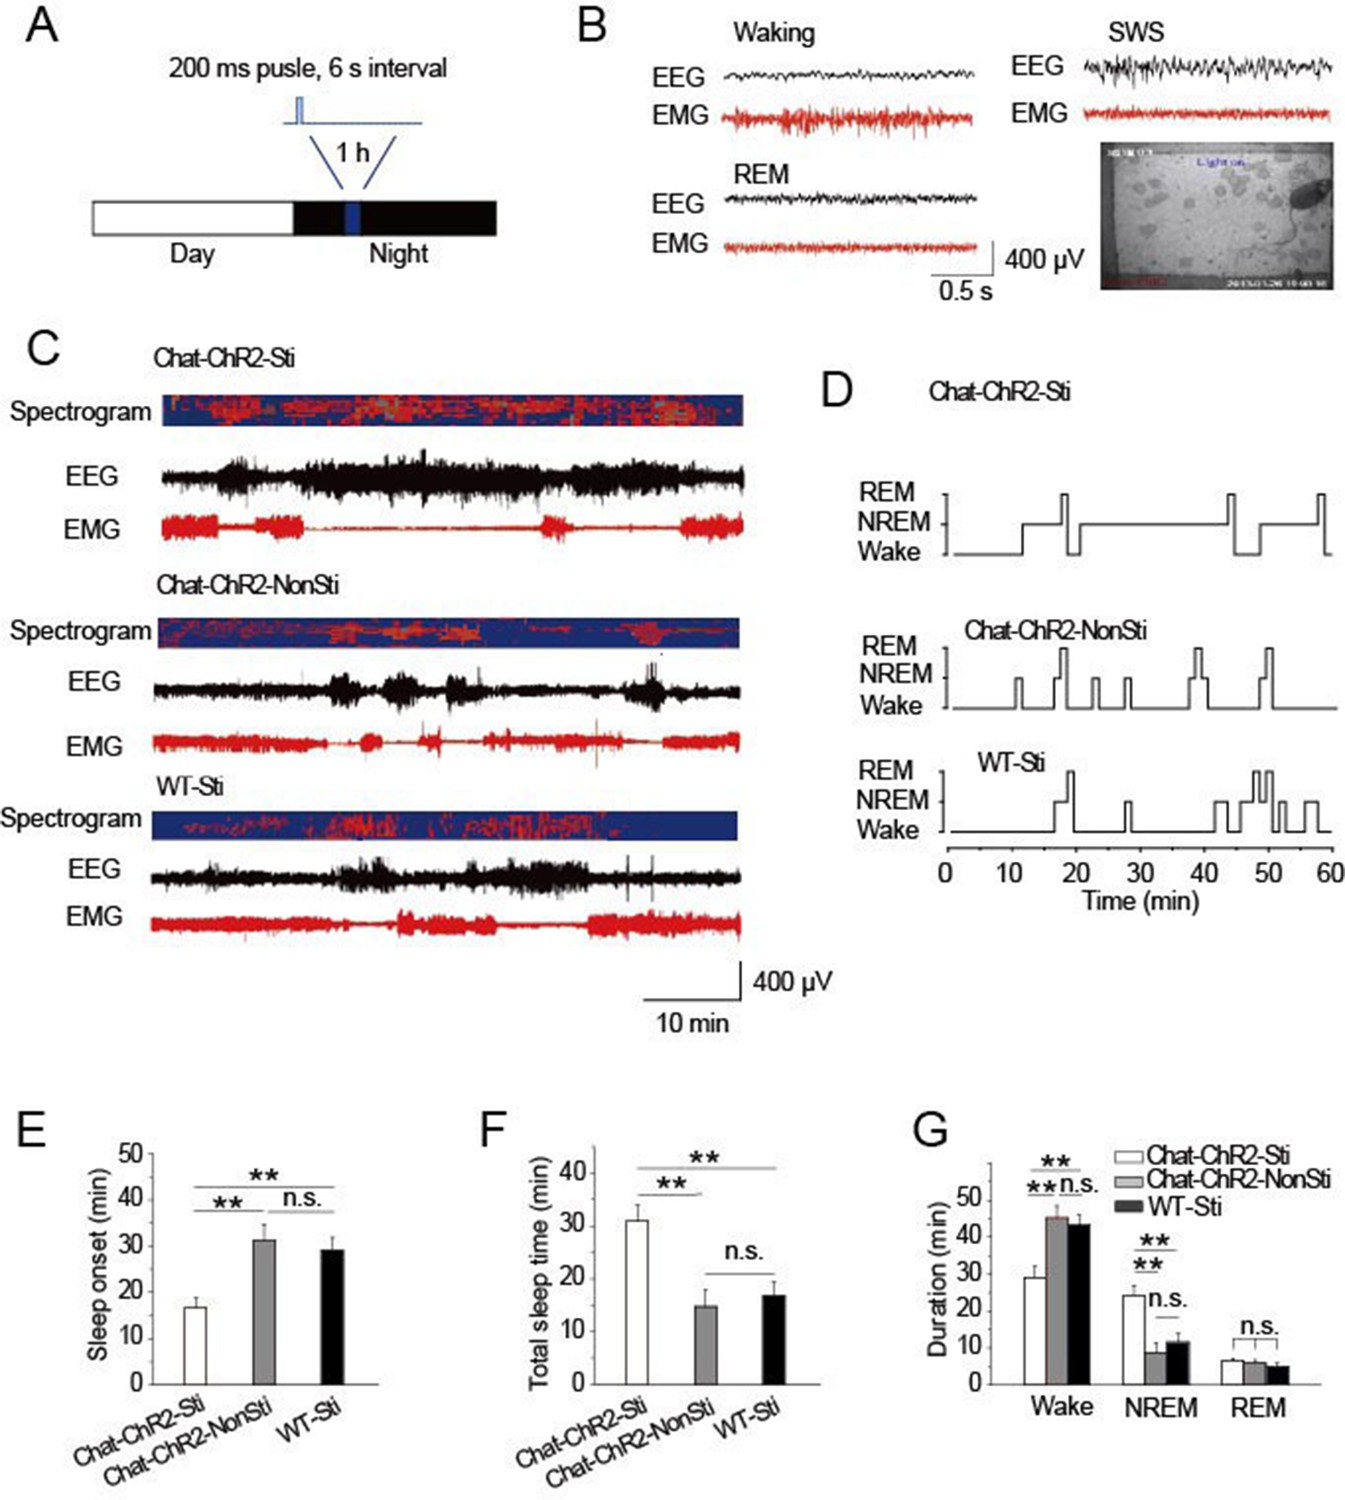
Activation of cholinergic fibers promoted sleep.
(A) Stimulation protocol in the TRN of ChAT-ChR2 mice. A 473 nm laser was used at 1.5 mW to deliver 200-ms pulses at 6 s intervals for 1 hr. (B) EEG, EMG, and video recordings were used to determine sleep-waking patterns and examine sleep architecture; examples of states (Waking, SWS, REM). (C) EEG trace during 1 hr stimulation period. (D) Representative hypnograms for ChAT-ChR2-Sti, ChAT-ChR2-NonSti and WT-Sti mice over 1 hr test period. Optical stimulation given to ChAT-ChR2 and WT-Sti mice consisted of 200-ms pulses. (E) Latency to sleep in ChAT-ChR2-Sti, ChAT-ChR2-NonSti and WT-Sti mice. (F) Total sleep time of ChAT-ChR2-Sti, ChAT-ChR2-NonSti and WT-Sti mice during 1 hr stimulation. (G) Time spent in NREM stage for ChAT-ChR2-Sti, ChAT-ChR2-NonSti and WT-Sti mice. In (E, F, G), all data represent mean ± SEM (n = 8 mice, *p < 0.05, **p < 0.01, two-tailed t-test between ChAT-ChR2-Sti mice and ChAT-ChR2-NonSti or WT-Sti mice). See also Figure 2—figure supplement 1.
Figure 2—figure supplement 1
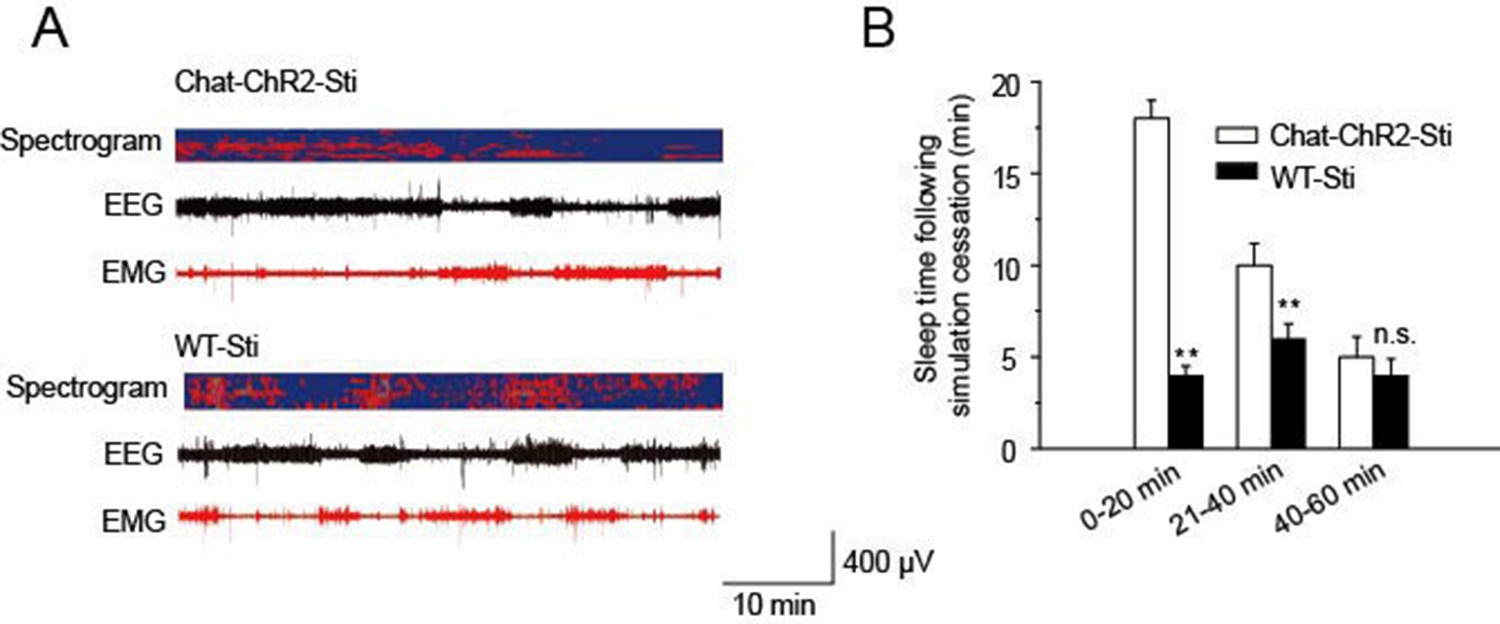
Recovery time of normal function following cessation of stimulation.
(A) EEG and EMG trace during 1 hr period after stimulation. (B) Sleep time duration 1 hr following stimulation cessation. (n = 6 mice, *p < 0.05, **p < 0.01, two-tailed t-test between ChAT-ChR2-Sti and WT-Sti mice).
Figure 3
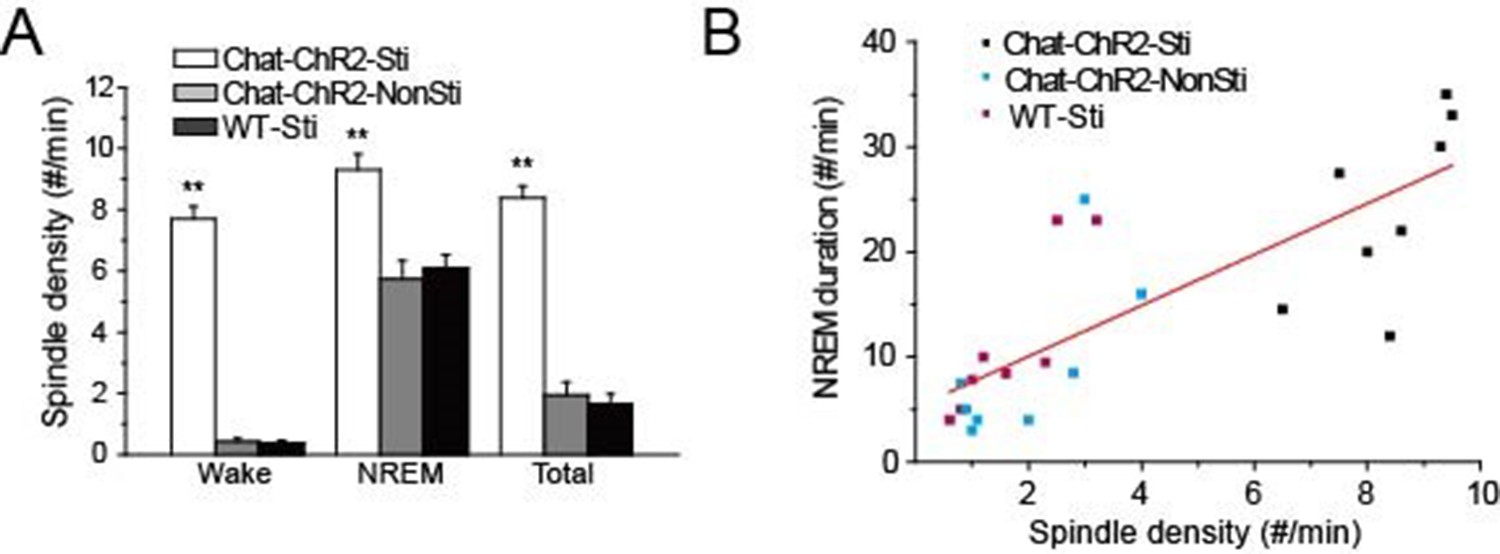
Correlation of spindle oscillation density and NREM sleep duration.
(A) Spindle density of ChAT-ChR2-Sti, ChAT-ChR2-NonSti and WT-Sti mice during waking, NREM, and entire period (Total). Data represent mean ± SEM (n = 8 mice, *p < 0.05, **p < 0.01, two-tailed t-test between ChAT-ChR2-Sti mice and ChAT-ChR2-NonSti or WT-Sti mice). (B) Correlation shows a positive relationship between spindle oscillation density and NREM duration (n = 8).
Figure 4 with 1 supplement
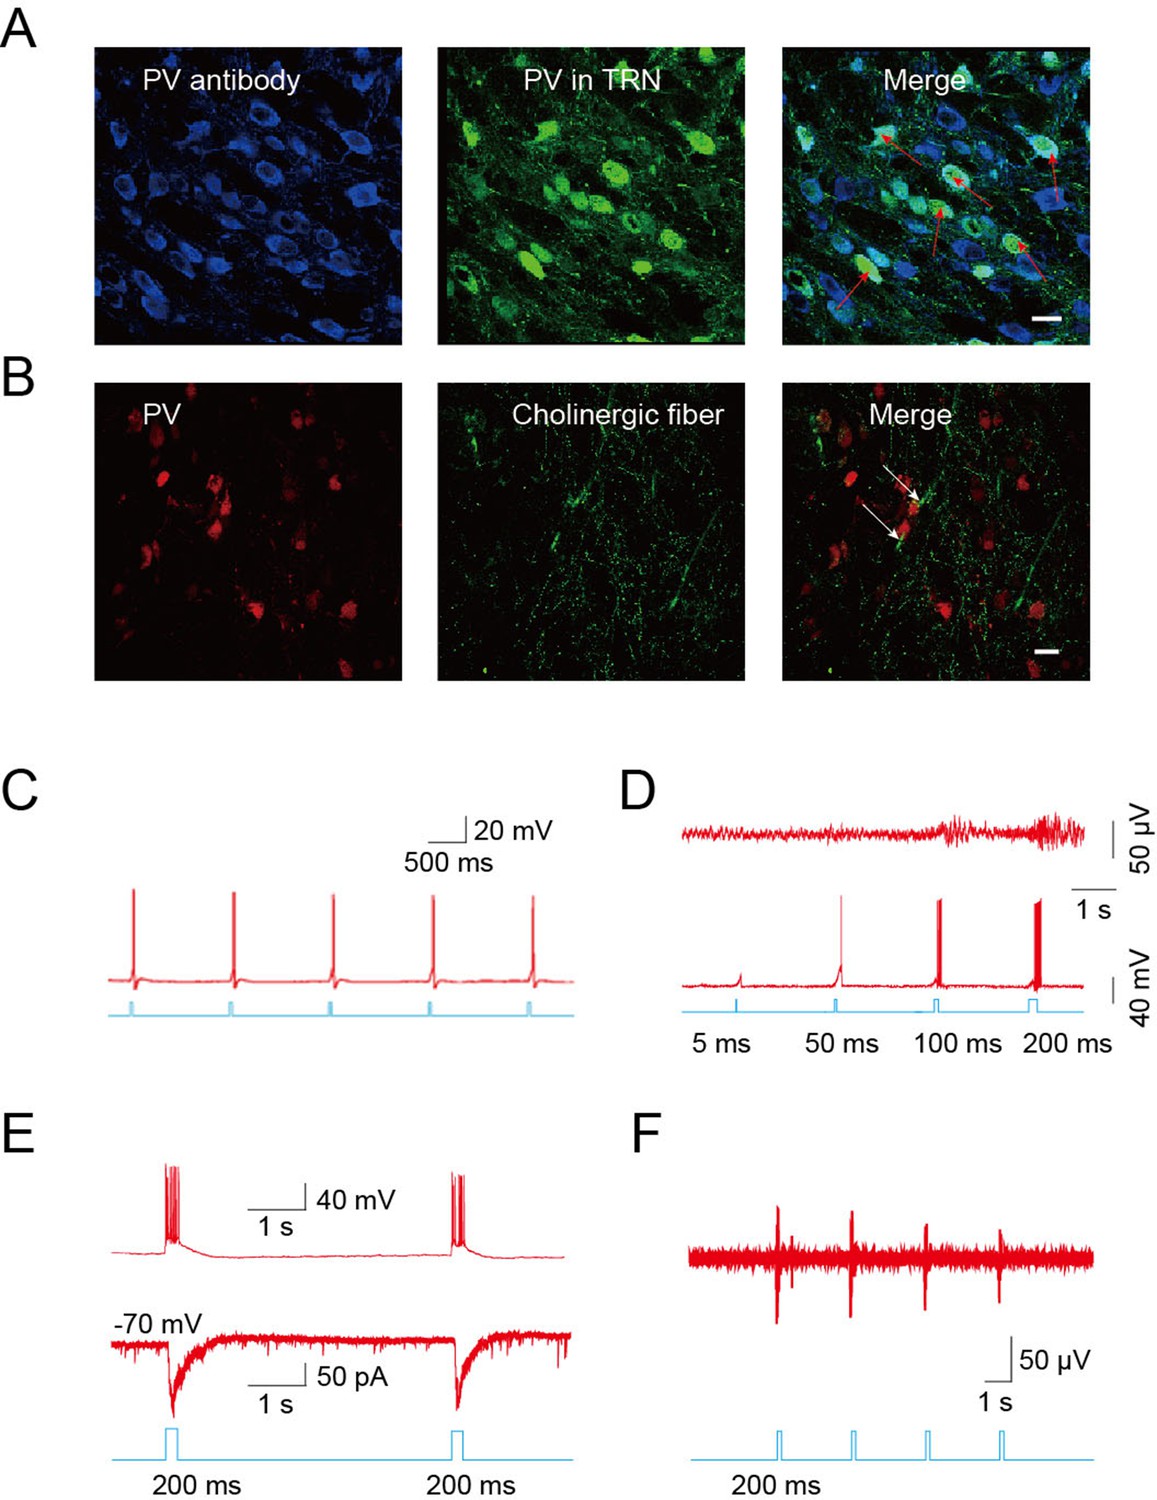
Cholinergic fibers excited GABAergic neurons in the TRN.
(A) Confocal imaging of brain slices from B13 mice showing densely distributed PV-positive Figure 2—figure supplements 1A,3B,4A neurons in the TRN. (B) Histological staining showing numerous cholinergic fibers surrounding PV-positive neurons in the TRN of ChAT-ChR2 mice. In A, B, scale bar: 20 μm; n = 3 mice. (C) Action potentials in cholinergic neurons induced by 5-ms pulse stimulation. (D) Action potentials in GABAergic neurons evoked by 5 ms, 50 ms, 100 ms, and 200 ms stimulation of cholinergic fibers in TRN (bottom). Spindles could only be induced by 100 ms or 200 ms stimulation, but not by 5 ms or 50 ms (top). (E) Light pulse stimulation of 200 ms evoked EPSCs (bottom) and rhythmic high-frequency bursts of APs (top) in PV neurons of the TRN. (F) In vivo extracellular recording of the TRN in an anesthetized ChAT-ChR2 mouse showing light-evoked spikes on GABAergic neurons. In C, D, E, F, n = 8 neurons of 3 mice. See also Figure 4—figure supplement 1.
Figure 4—figure supplement 1
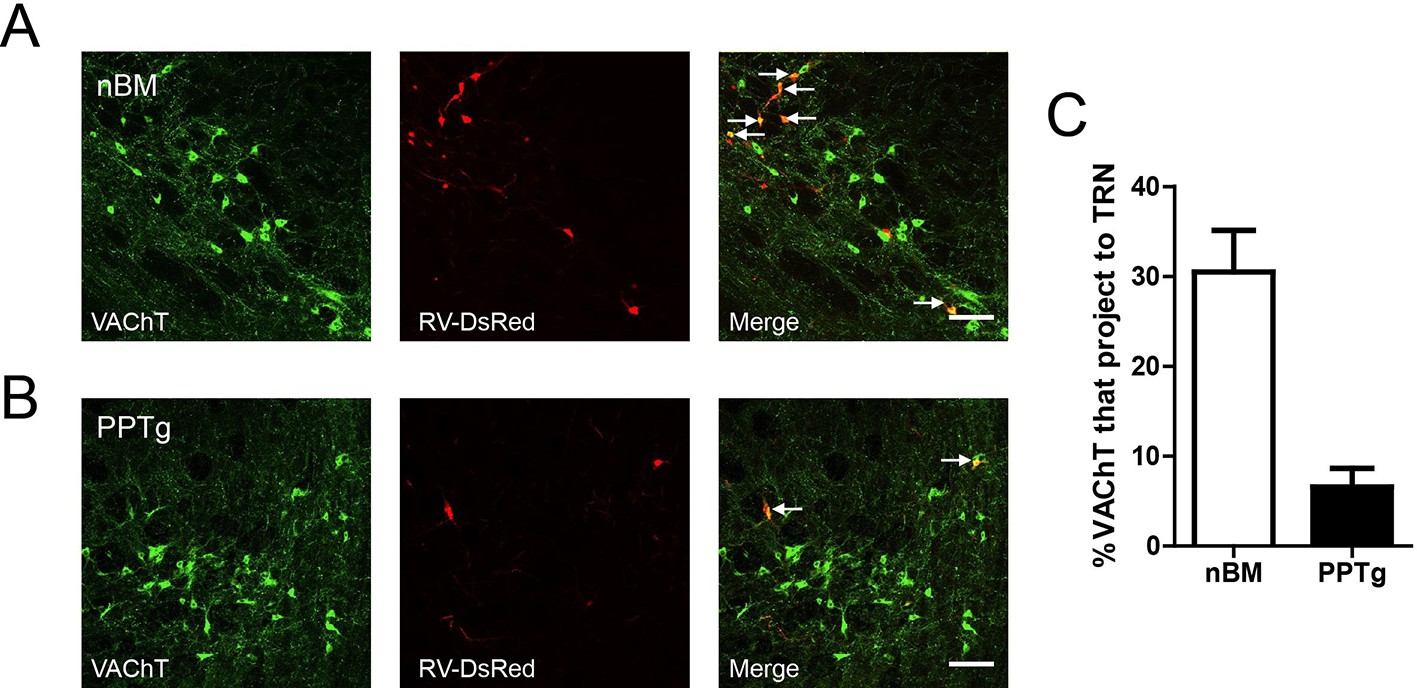
The TRN received cholinergic projections from both the basal forebrain and brain stem.
(A) The DsRed signal was detected in some cholinergic neurons of the nBM. Scale bar: 100 μm. (B) The DsRed signal was detected in some cholinergic neurons of the PPTg. Scale bar: 100 μm; n = 4 mice. (C) Percentage of VAChT and RV-ΔG-DsRed-labelled neurons in the nBM and PPTg.
Figure 5
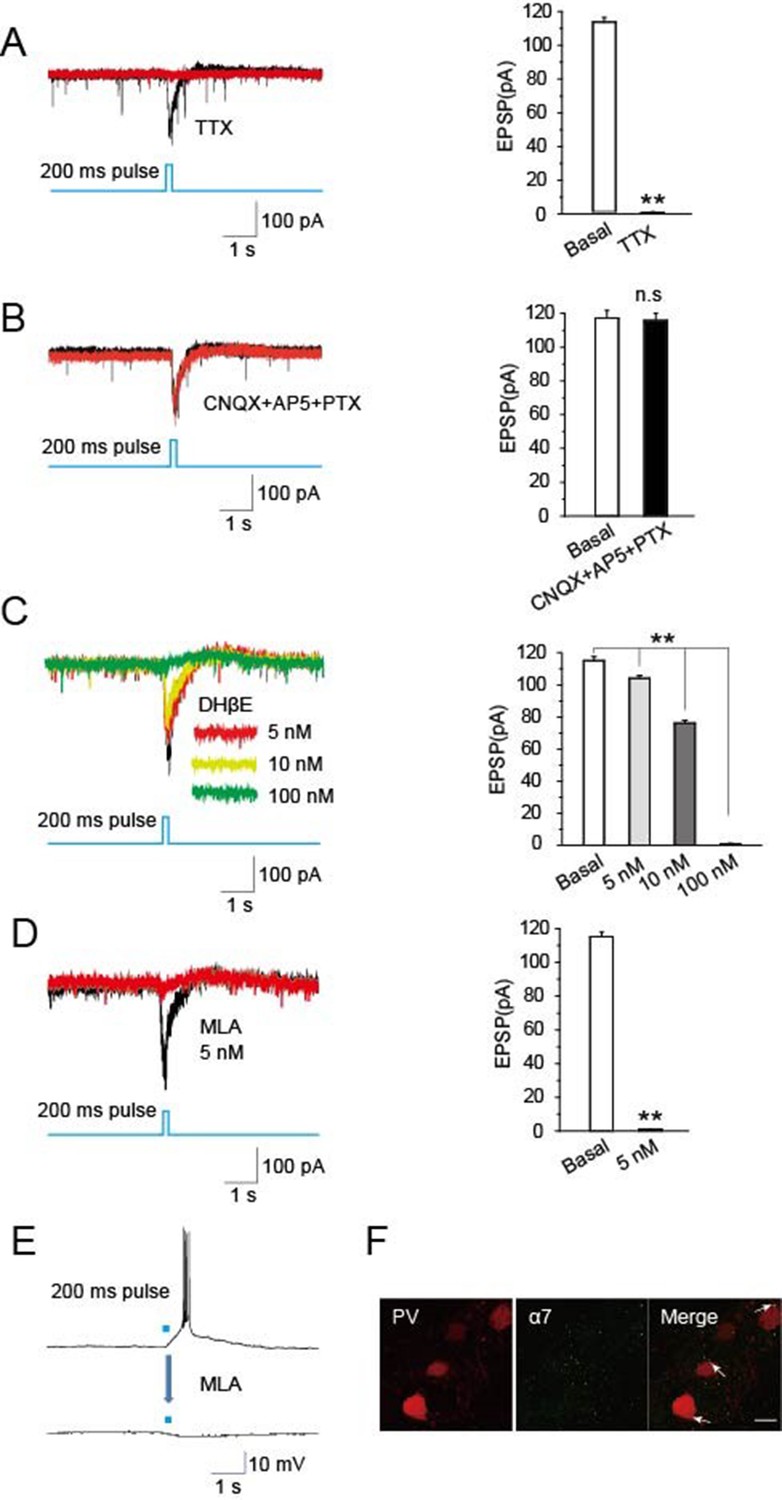
Optically induced EPSCs were blocked by MLA.
(A) TTX (1 μM) blocked the induced EPSCs in PV neurons evoked by optical stimulation of cholinergic fibers in the TRN (n = 6). (B) CNQX (20 μM), AP5 (50 μM), and PTX (100 μM) together failed to block the induced EPSCs (n = 6). (C) DHβE (5, 10 nM) only partially blocked the evoked EPSCs. (D,E) MLA (5 nM) completely blocked the evoked EPSCs and bursts of APs (n = 6). For voltage clamp recording in (A, B, C, D), the membrane potential was held at -70 mV. (F) Immunostaining with an antibody specific for α7-nAChRs showed substantial levels of the receptors on PV-positive neurons. Scale bar: 20 μm (n = 4). Data represent mean ± SEM (*p < 0.05, **p < 0.01, one-way ANOVA was used).
Figure 6 with 1 supplement
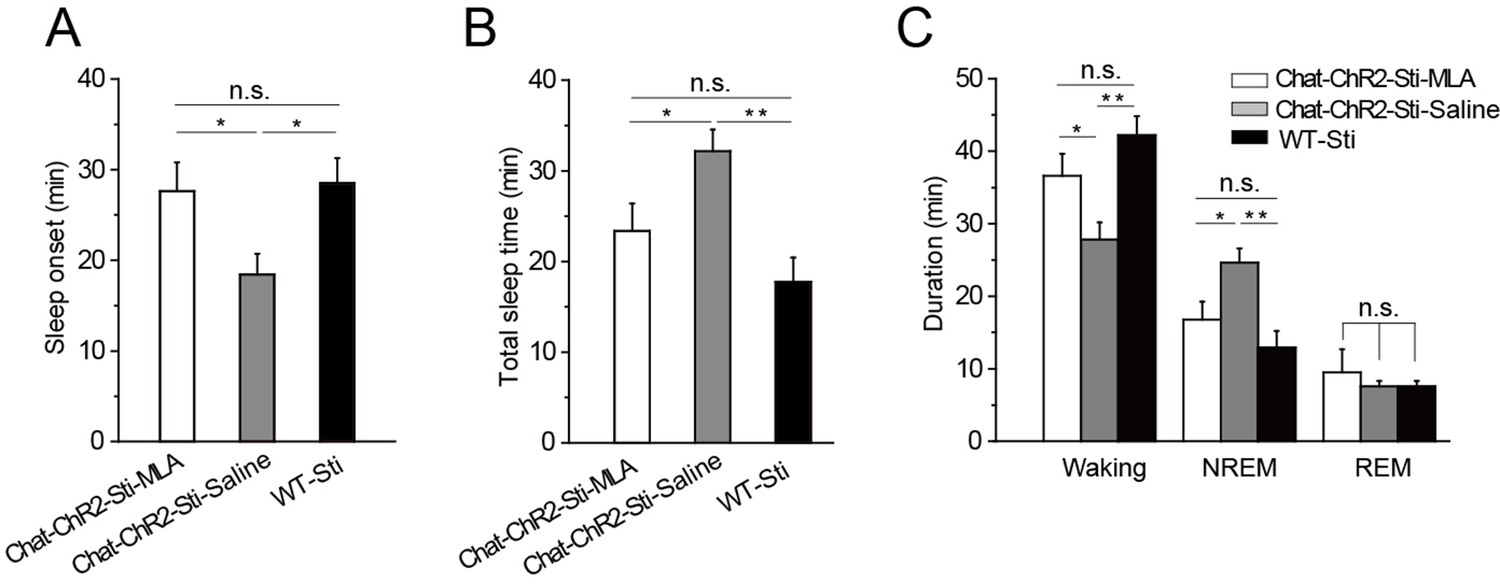
MLA blocked the decrease in sleep onset time and the increase in sleep duration induced by cholinergic activation.
(A) Time to sleep onset for ChAT-ChR2-Sti-MLA, ChAT-ChR2-Sti-Saline, and WT-Sti mice. (B) Total sleep time of ChAT-ChR2-Sti, ChAT-ChR2-NonSti, and WT-Sti mice during 1 hr stimulation period. (C) Duration of waking, NREM, and REM for ChAT-ChR2-Sti-MLA, ChAT-ChR2-Sti-Saline and WT-Sti mice in 1 hr recording. Data represent mean ± SEM (n = 8 mice, *p < 0.05, **p < 0.01, two-tailed t-test between ChAT-ChR2-Sti-MLA mice and either ChAT-ChR2-Sti-Saline or WT-Sti mice). See also Figure 6—figure supplement 1.
Figure 6—figure supplement 1
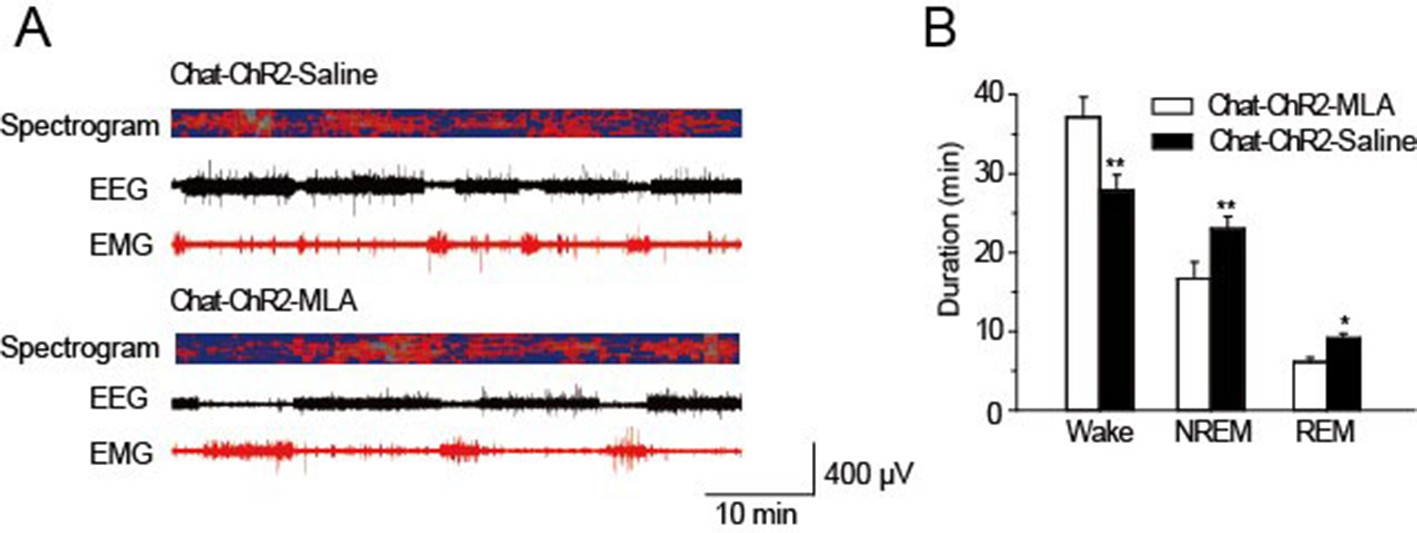
MLA decreased spontaneous sleep in the daytime.
(A) EEG and EMG trace during 1 hr in the daytime of Chat-ChR2-Saline and Chat-ChR2-MLA mice. (B) Time spent in the wake, NREM and REM stages for Chat-ChR2-Saline and Chat-ChR2-MLA mice. In vivo injection of MLA could decrease spontaneous activity. All data represent mean ± SEM (n = 6 mice, *p < 0.05, **p < 0.01, two-tailed t-test between ChAT-ChR2-MLA and ChAT-ChR2-Saline mice).
Figure 7
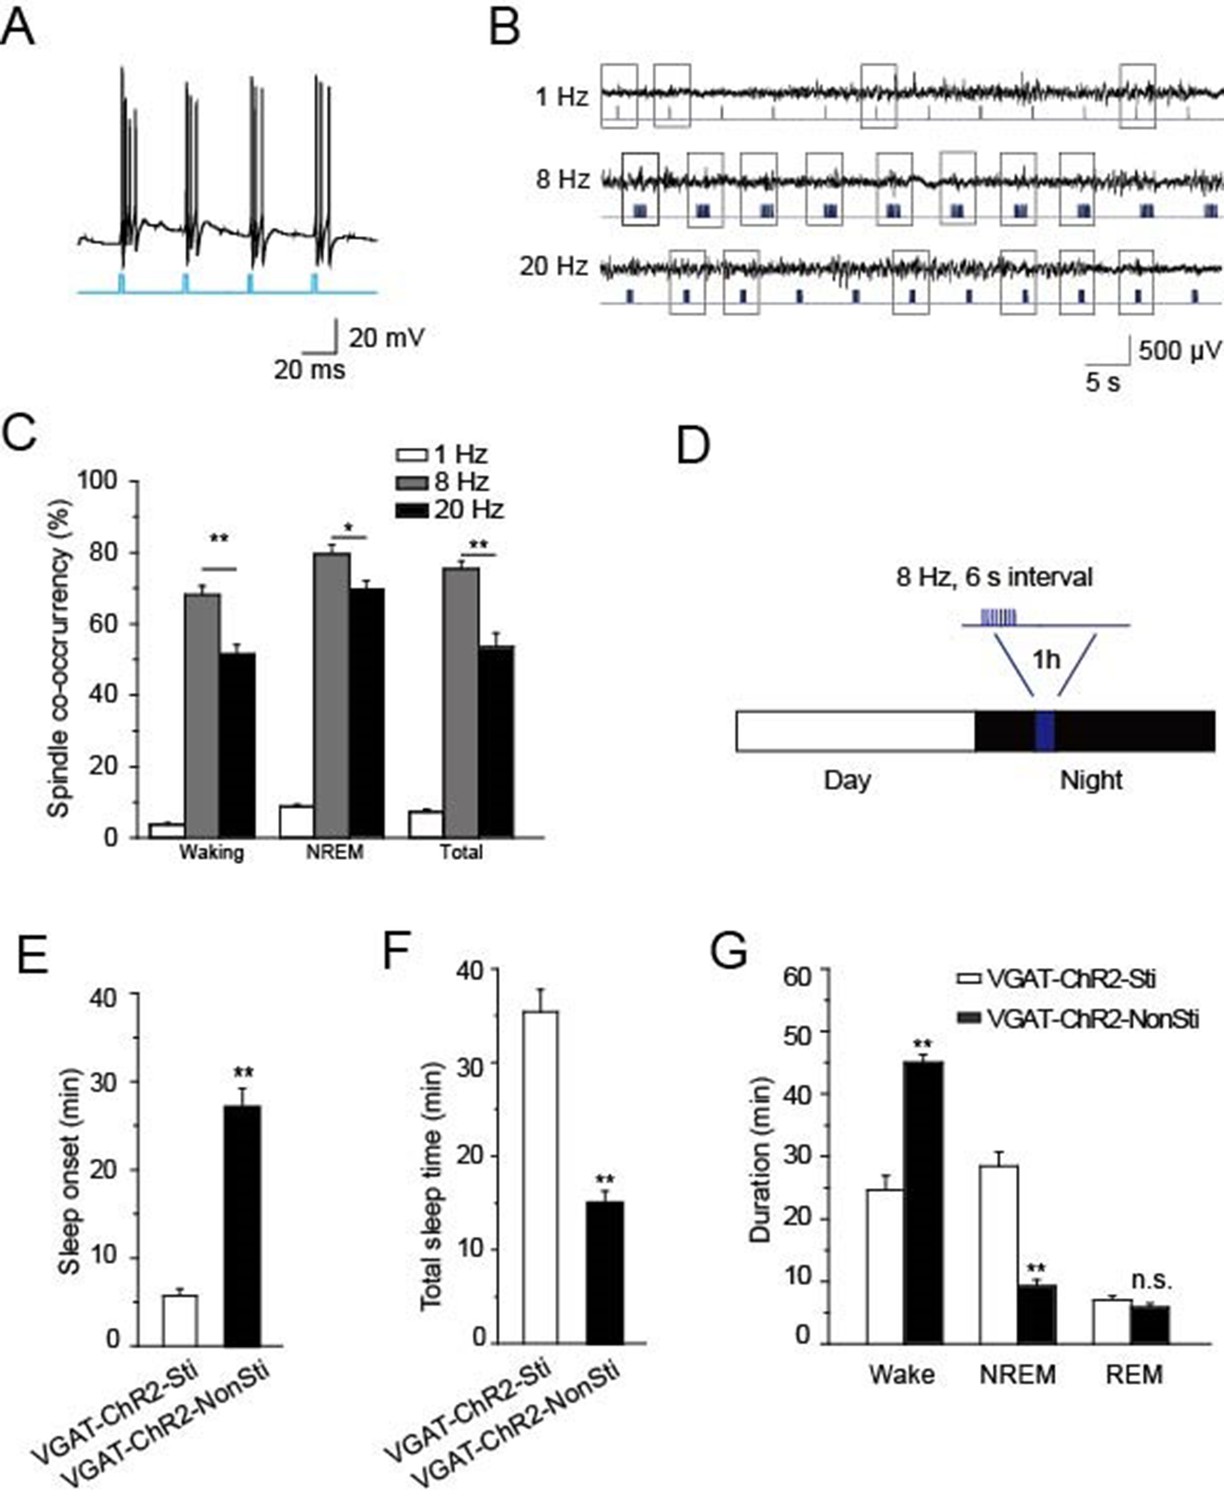
Direct stimulation of GABAergic neurons in the TRN promoted sleep onset and altered sleep architecture.
(A) Direct optical drive (10-ms pulses, lower) induced bursts of APs in GABAergic neurons (upper). (B) Representative spindle oscillations evoked by different optical stimulation paradigms (1, 8, or 20 Hz). (C) Probability of spindle waves induced by 1 Hz, 8 Hz, and 20 Hz. (D) Stimulation protocol in the TRN of VGAT-ChR2 mice. A 473 nm laser (1.5 mW) was given at 8 Hz for 1 s at 6-s intervals for 1 hr. (E) Sleep onset time of VGAT-ChR2-Sti and VGAT-ChR2-NonSti mice. (F) Total sleep time evoked by direct optical stimulation of GABAergic neurons in the TRN of VGAT-ChR2 mice and unstimulated controls. (G) Durations of time in waking, NREM, and REM states for VGAT-ChR2 mice with and without direct optical stimulation of GABAergic neurons in the TRN. Stimulation substantially decreased the duration of wake time, while increasing the duration of NREM time; it had no effect on REM time. In (C, E, F, G), data represent mean ± SEM (n = 7 mice, *p < 0.05, **p < 0.01, two-tailed t-test between VGAT-ChR2 mice with spindle-like stimulation and VGAT-ChR2 mice without stimulation).
Download links
A two-part list of links to download the article, or parts of the article, in various formats.
Downloads (link to download the article as PDF)
Open citations (links to open the citations from this article in various online reference manager services)
Cite this article (links to download the citations from this article in formats compatible with various reference manager tools)
Selectively driving cholinergic fibers optically in the thalamic reticular nucleus promotes sleep
eLife 5:e10382.
https://doi.org/10.7554/eLife.10382


