Mapping translation 'hot-spots' in live cells by tracking single molecules of mRNA and ribosomes
- Albert Einstein College of Medicine, United States
- Salk Institute for Biological Studies, United States
- Janelia Research Campus, Howard Hughes Medical Institute, United States
- Massachusetts Institute of Technology, United States
Figures
Figure 1 with 2 supplements
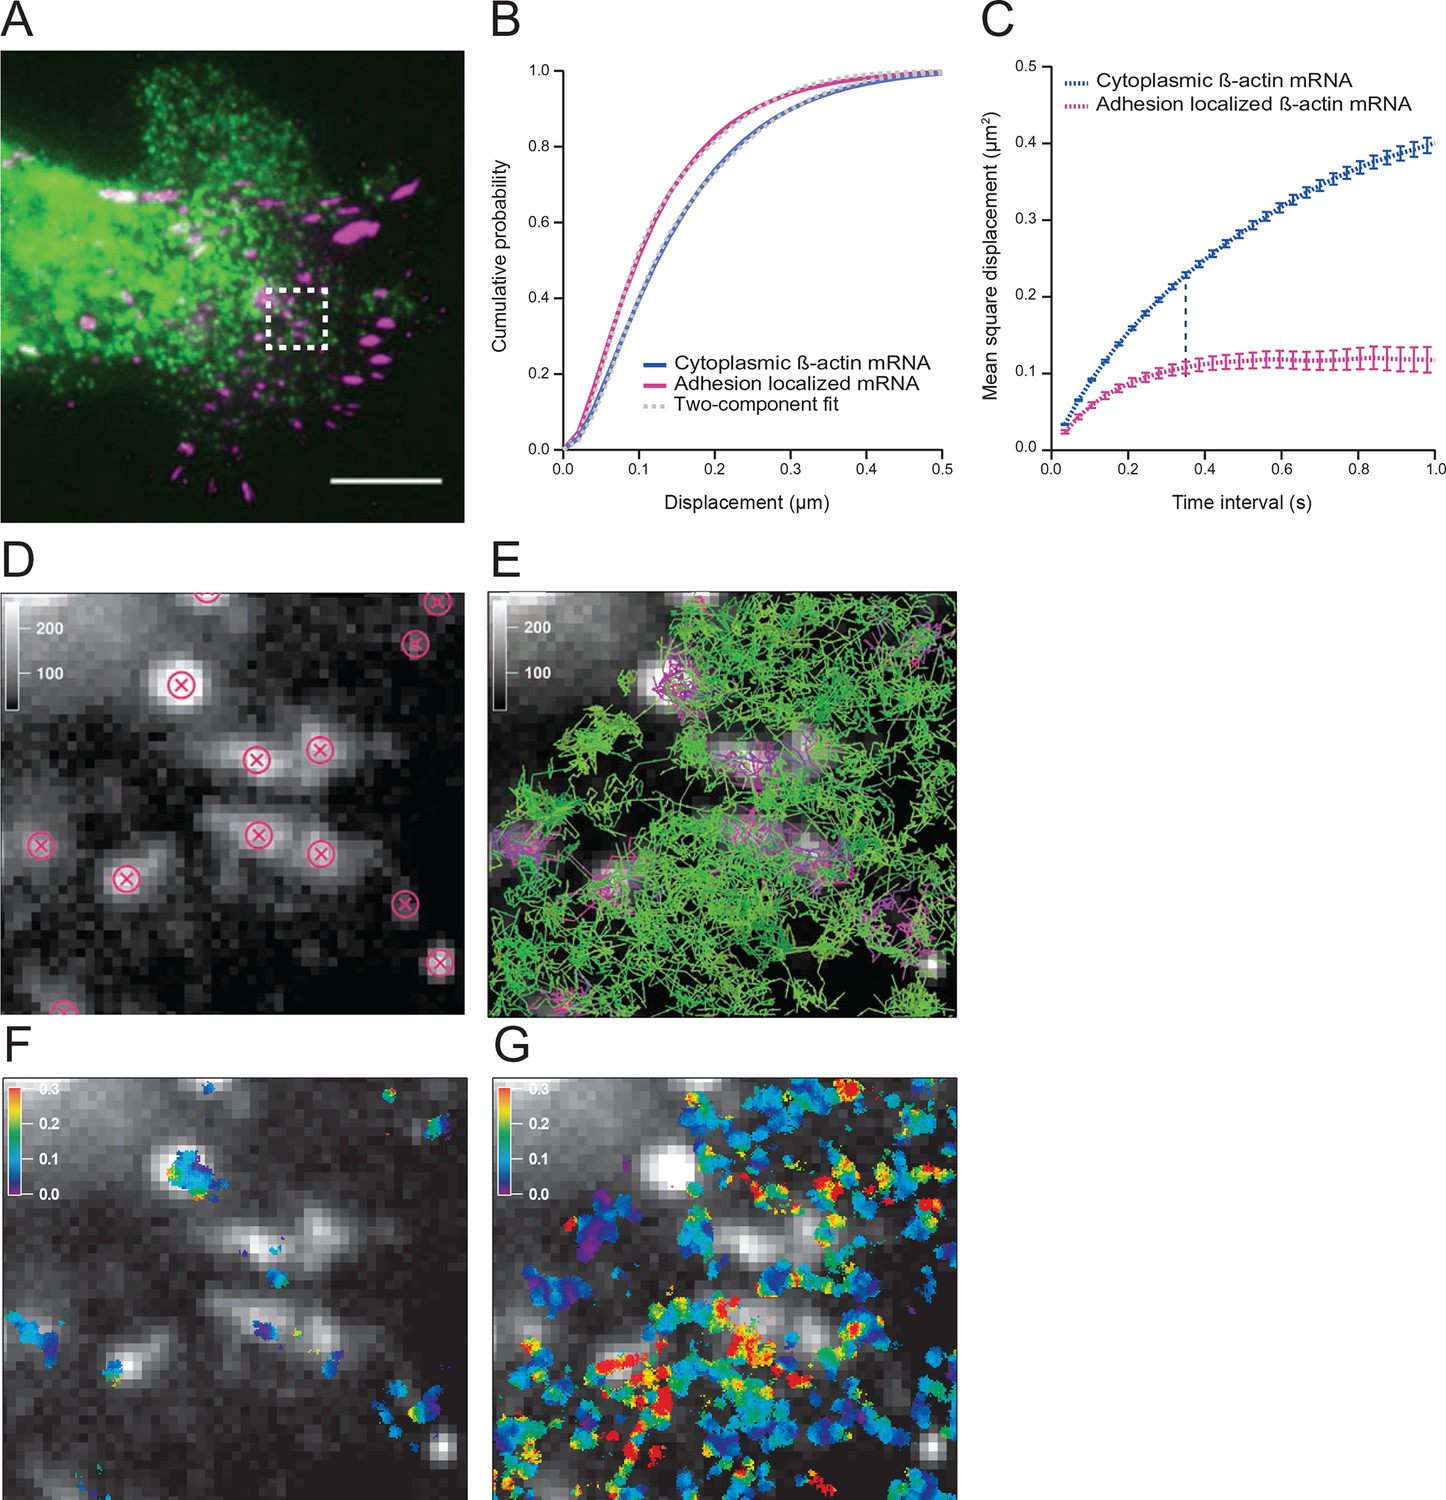
The diffusion properties of β-actin mRNA molecules around focal adhesions are slower and more corralled.
(A) Overlay of a single frame from Video 1 of β-actin mRNA labeled with MS2-GFP and focal adhesions labeled with paxillin-mCherry. (B) The cumulative distribution function of all single molecule displacements for β-actin mRNA localized to focal adhesions is shifted left when compared to all other mRNA, which indicates a shift towards slower diffusion. (C) The mean square displacement (MSD) curves depict increased corralling of mRNAs localized at focal adhesions and reveal an exploration area of 0.1 μm2. (D) Adhesion coordinates were localized relative to the tracked mRNAs displayed in panel (E) in order to define a population of mRNA tracks in the vicinity of adhesions. (F) The mRNA diffusion heat map indicates a shift towards slower diffusion at adhesions when compared to the total cytoplasmic population of mRNA trajectories (G).
Figure 1—figure supplement 1
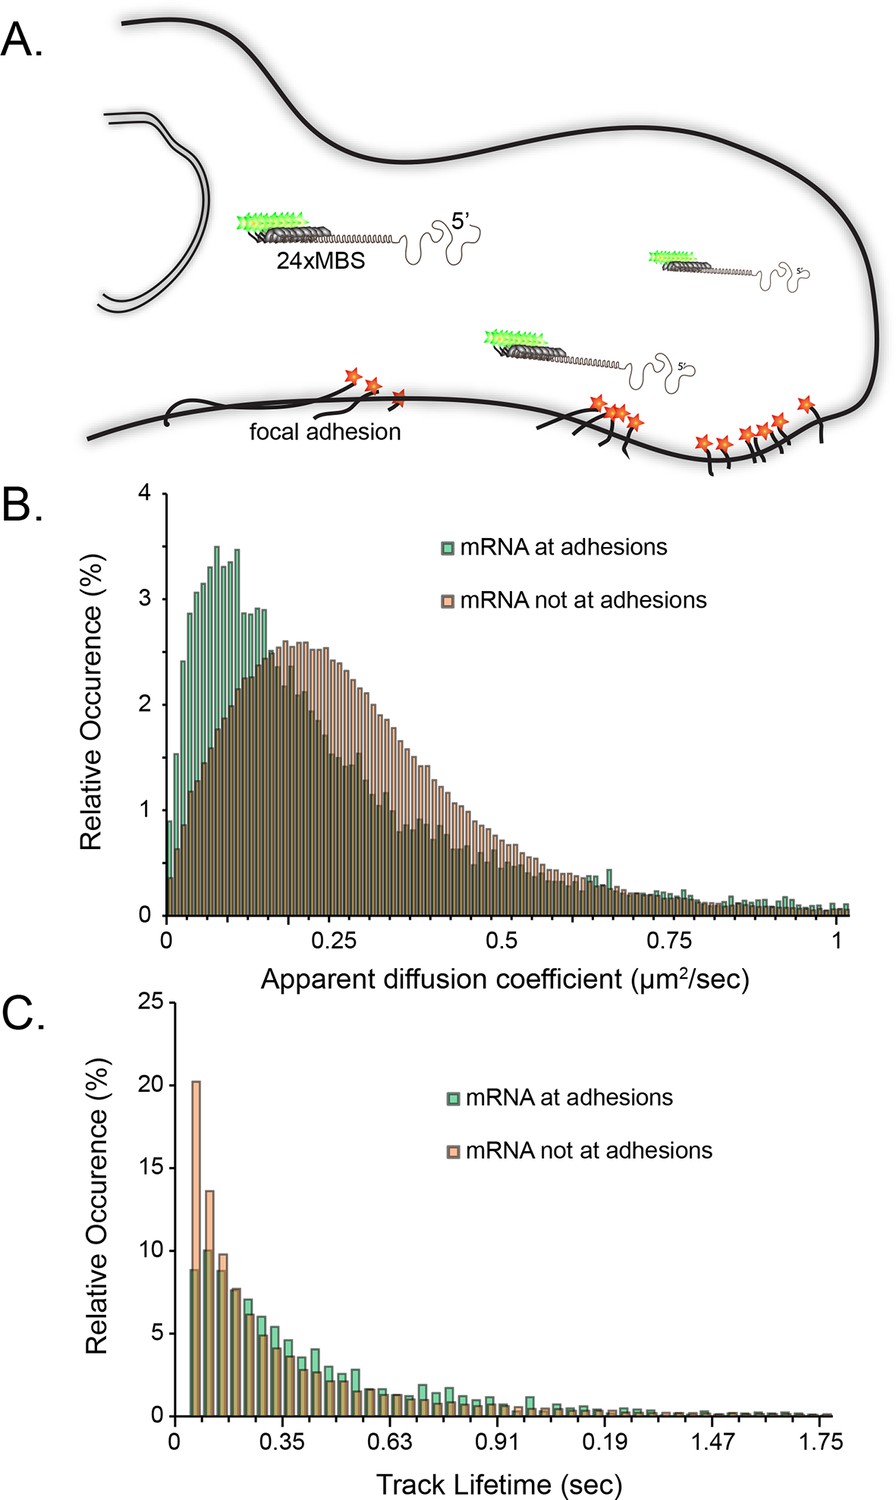
Tracking of individual β-actin mRNA molecules at adhesion compartments.
(A) The schematic depicts the side view of a fibroblast leading edge with focal adhesions labeled with paxillin-mCherry (red stars) and β-actin mRNA labeled with GFP tagged MS2 capsid proteins on 24 repeats of the MS2 stem-loop in the 3'UTR. (B) The distribution of mRNA apparent diffusion coefficients measured by single molecule tracking shifts significantly slower for mRNAs at adhesion compartments. (C) The distribution of single mRNA track lifetimes both near and away from focal adhesions. mRNAs near adhesions exhibit a shift towards longer track lifetimes, indicating a dwelling population near adhesions.
Figure 1—figure supplement 2

Cumulative distribution function analysis of β-actin mRNA localized to focal adhesions.
(A) β-actin mRNA localized to focal adhesions: The cumulative distribution function of all single molecule displacements for β-actin mRNA localized to focal adhesions is fit to a one component fit: . An apparent diffusion coefficient is obtained from the fit. (B) Cytoplasmic β-actin mRNA not localized to focal adhesions: The cumulative distribution function of all cytoplasmic β-actin mRNA not localized to focal adhesions is fit to a one component fit, resulting in an apparent diffusion coefficient . (C) β-actin mRNA localized to focal adhesions: A two-component fit of (dashed curve) fits the experimentally obtained CDFs (solid curve) much better. A=0.51 is determined from the two-component fit (51% slow component and 49% fast component, dash-dotted curves). (D) Cytoplasmic β-actin mRNA not localized to focal adhesions: A two-component fit (dotted curve) fits the experimentally obtained CDFs (solid curve) much better. A=0.42 is determined from the two-component fit (42% slow component and 58% fast component, dash-dotted curves).
Figure 2 with 2 supplements
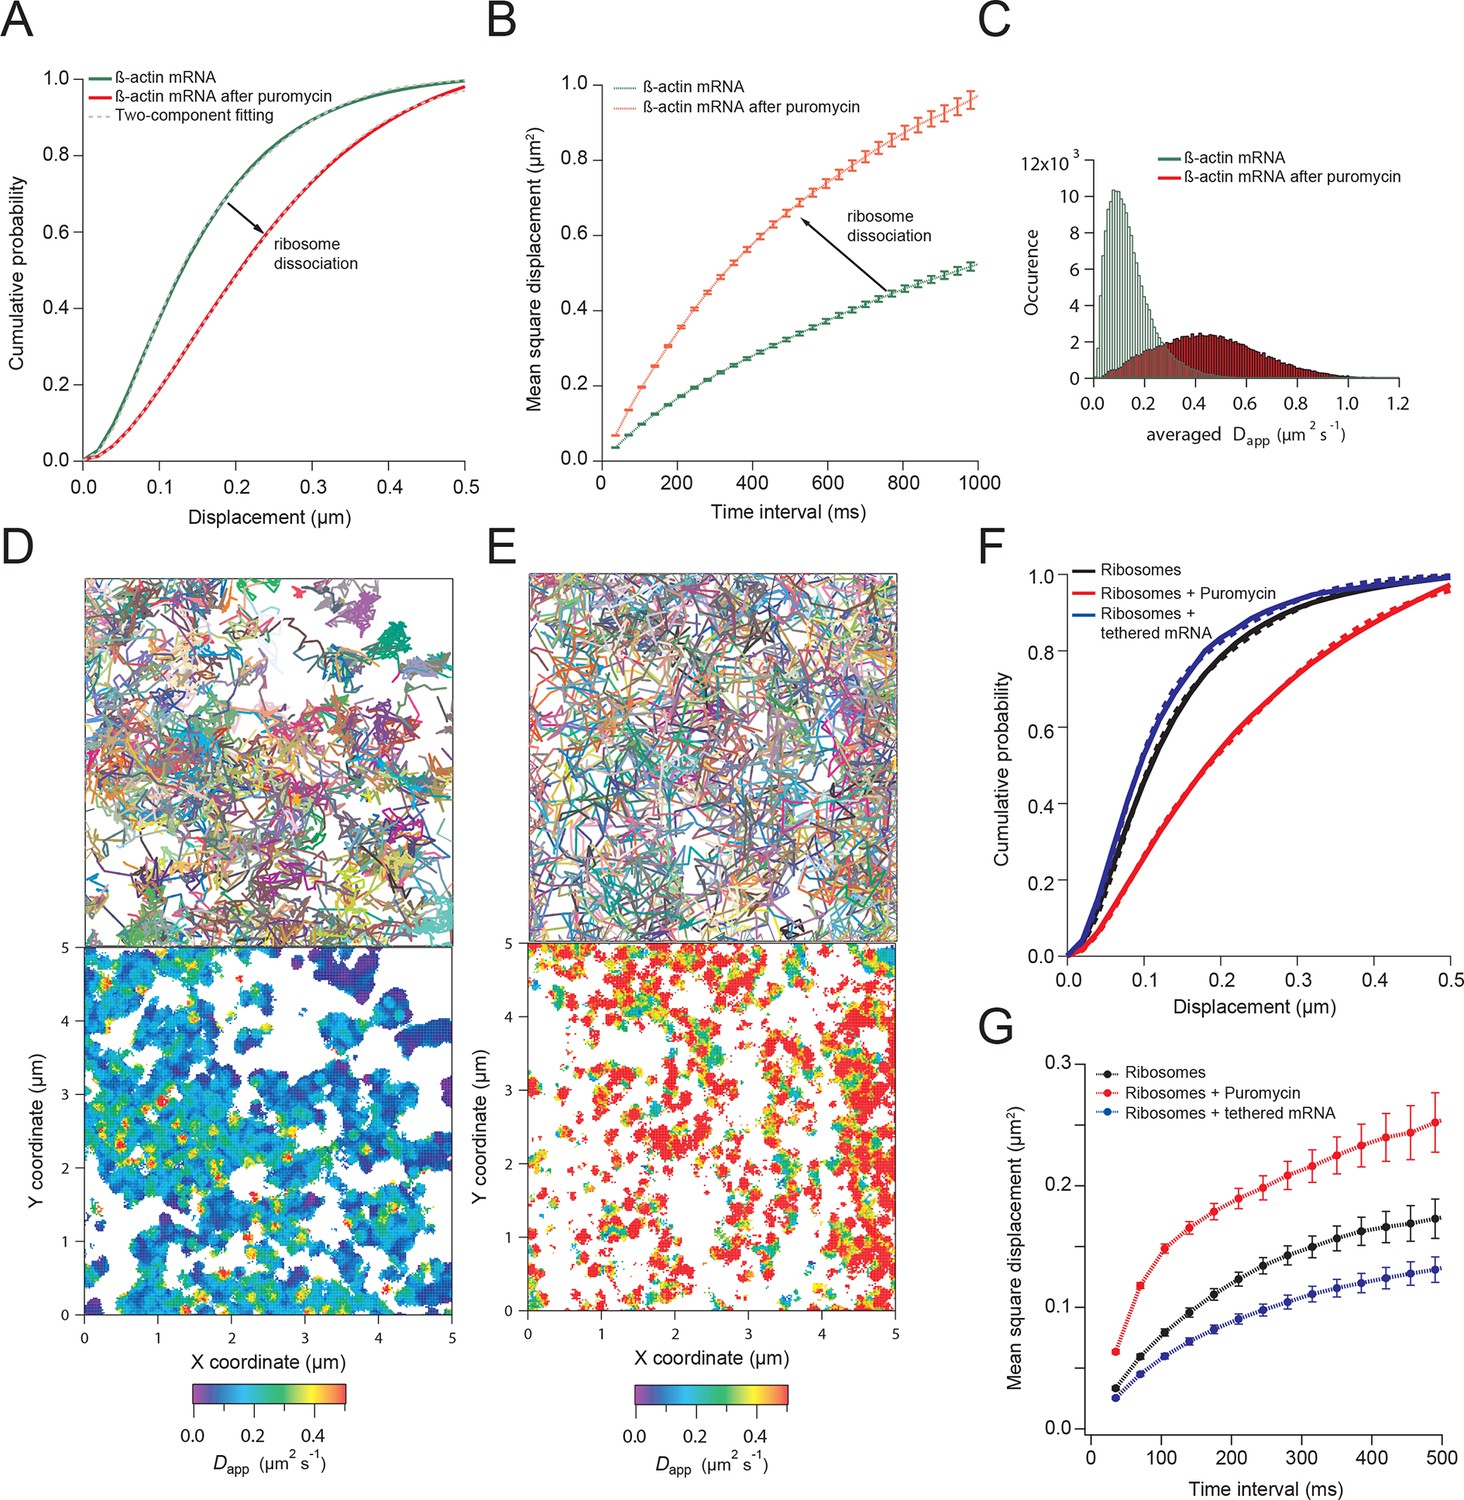
β-actin mRNA trajectories are faster and less-corralled after ribosome dissociation via puromycin treatment.
(A) Treatment with puromycin dissociates ribosomes from mRNA and shifts β-actin mRNA trajectories significantly towards faster diffusion (arrow). (B) Mean square displacement curves also indicate a shift towards faster movement (arrow) after puromycin treatment. (C) The histogram of average apparent diffusion coefficients shows the transition of the population to a faster movement profile of β-actin mRNA after ribosome dissociation. (D) A subset of trajectories from mRNA tracking and the resulting diffusion map indicates areas of slower movement. (E) After puromycin treatment most trajectories shift towards faster movement as reflected in the diffusion heat map. (F) sptPALM of ribosomes reflects similar movement changes after puromycin treatment. Immobilizing a subset of β-actin mRNA at focal adhesions with MS2-vinculin tethering shifts the ribosome CDF curve to the left, signifying tracked ribosomes are interacting with β-actin mRNA in the adhesion compartment. (G) The ribosome trajectory changes after puromycin and in mRNA tethering experiments are likewise reflected in MSD curves.
Figure 2—figure supplement 1
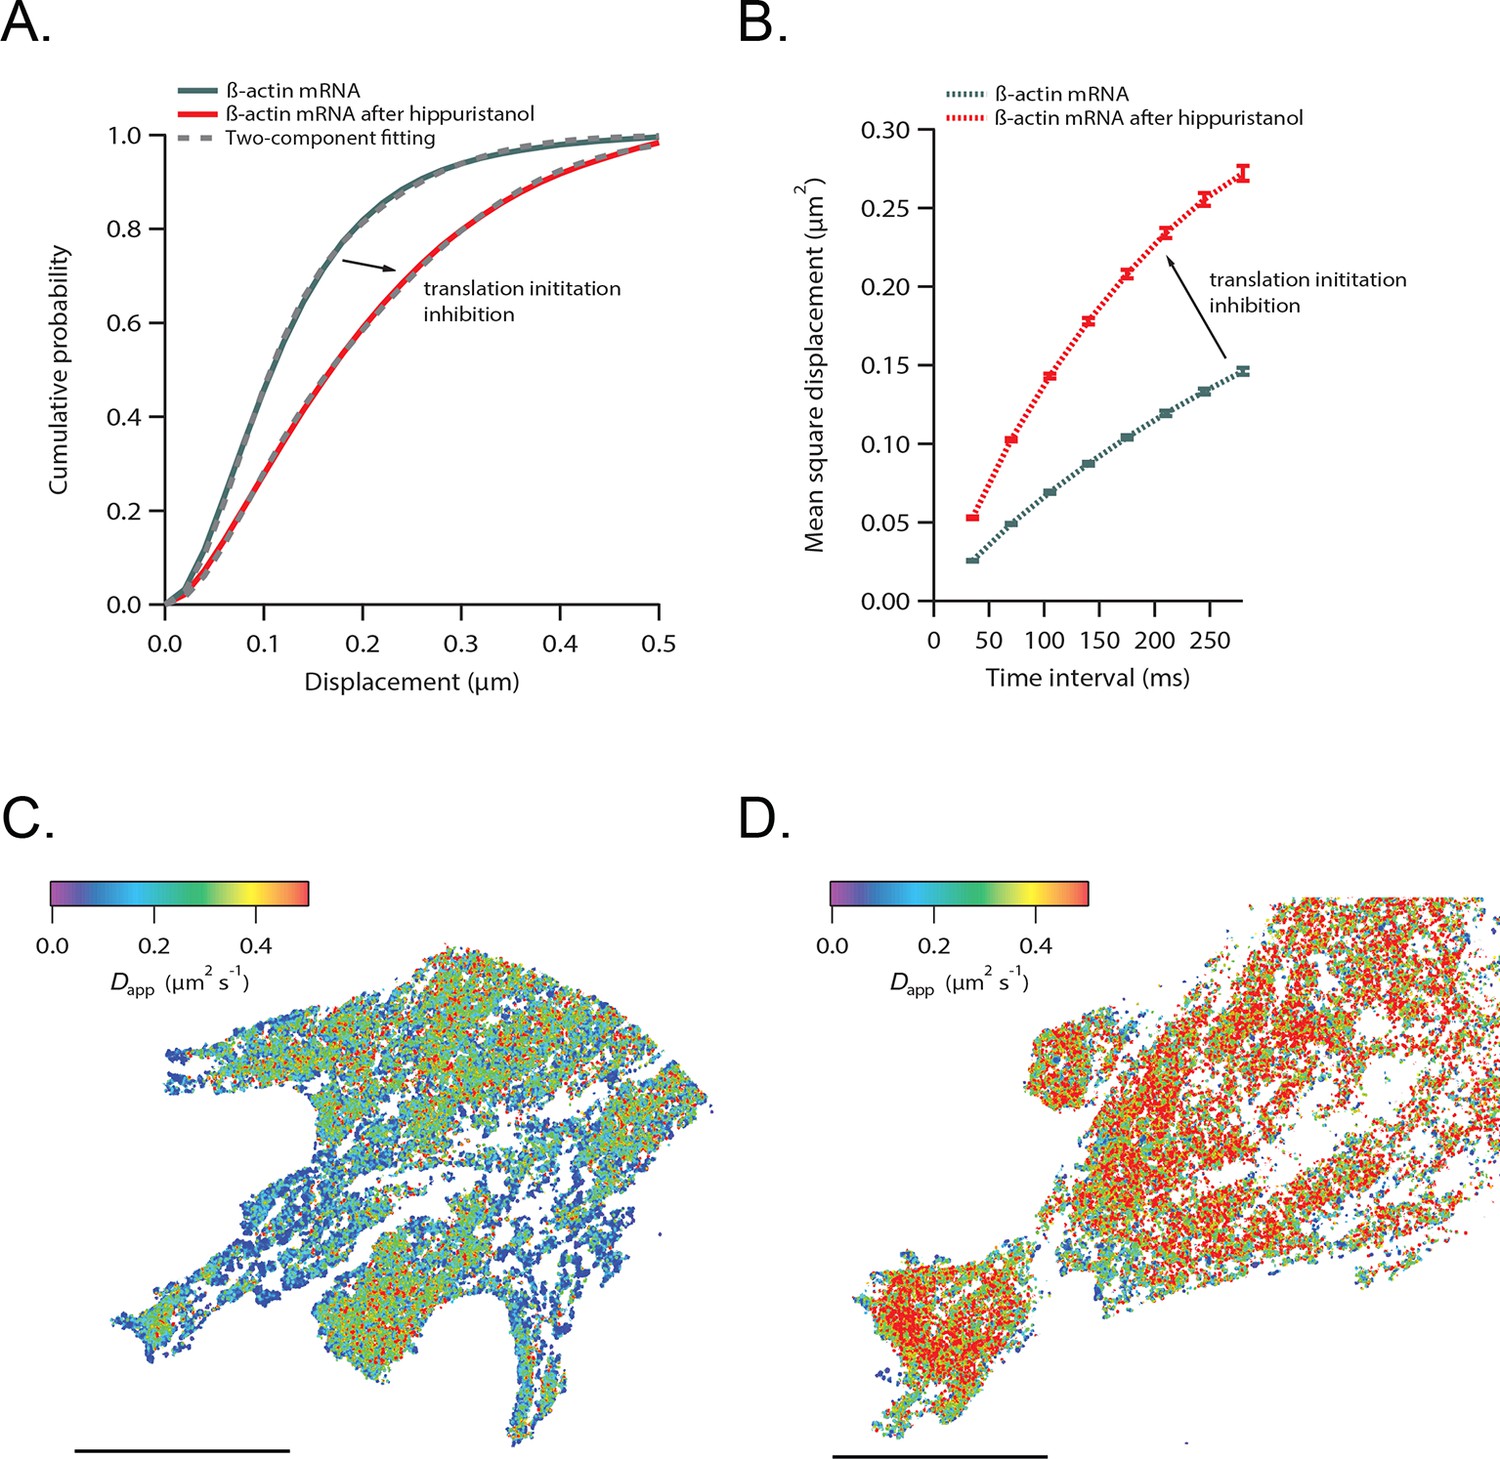
β-actin mRNA trajectories are faster and less-corralled after addition of hippuristanol.
(A) Treatment with hippuristanol inhibits translational initiation and shifts β-actin mRNA trajectories significantly towards faster diffusion (arrow). The cumulative distribution function of all 28,065 trajectories obtained from three cells in steady state (green curve) is best fit by a two-component fit (dashed curve, 43% in fast component). The cumulative distribution function of 26,921 β-actin mRNA trajectories of the same three cells after addition of hippuristanol (red curve) is best fit by a two-component fit with a shift towards the faster component (dashed curve, 72% in fast component). (B) The corresponding mean square displacement curves also indicate a shift towards faster movement after hippuristanol addition (arrow). (C) A map of the local apparent diffusion coefficients from all 10,084 β-actin mRNA trajectories. (D) A map of the local apparent diffusion coefficients from all 11,851 β-actin mRNA trajectories of the same cell as in (C) recorded 20 min after hippuristanol addition reflects the global shift towards faster β-actin mRNA movement after inhibition of translational initiation.
Figure 2—figure supplement 2
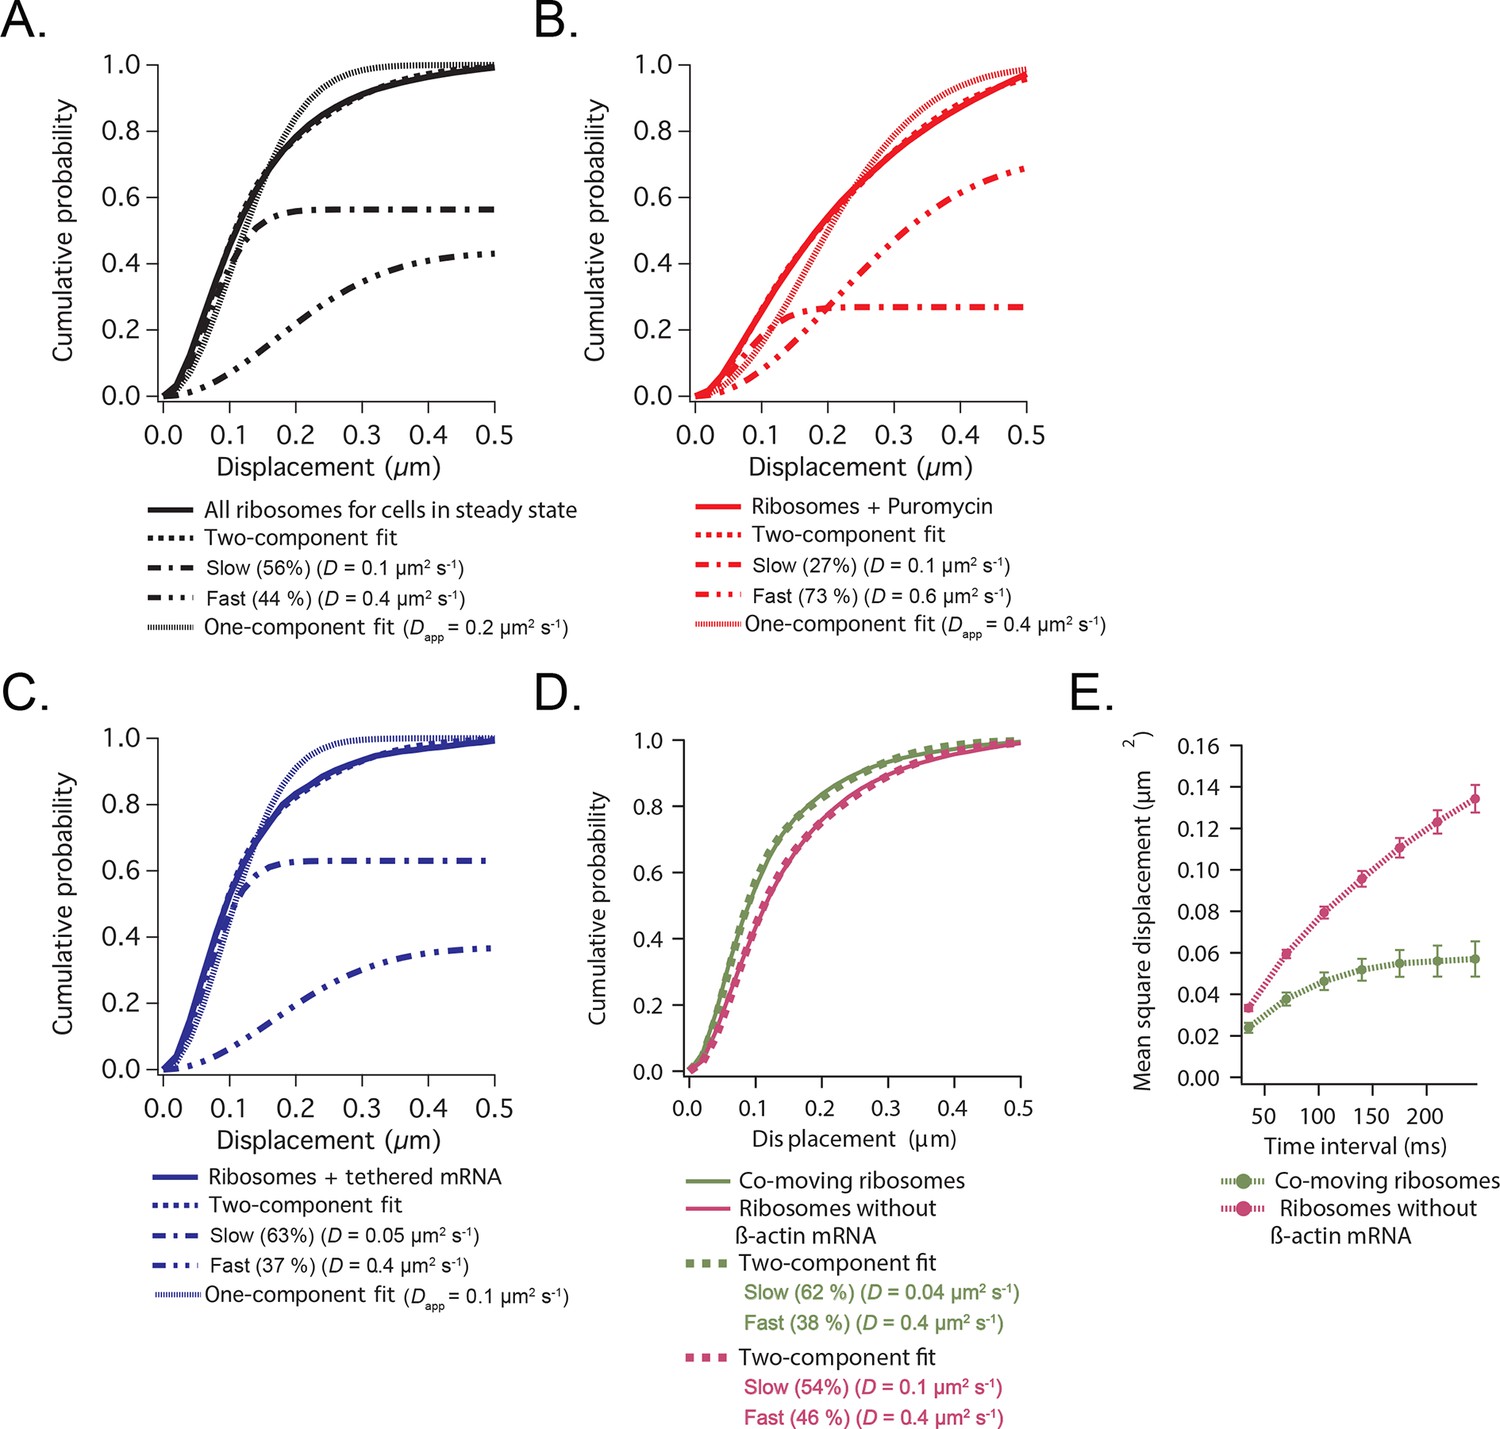
Cumulative distribution function analysis of ribosome diffusion.
(A) The cumulative distribution function of ribosomes for cells in steady state (solid curve) is best fit by two-components (dashed curve) composed of a slow (56%) and a fast (44%) diffusion component (dash-dotted curves). A one-component single-exponential fit (dotted curve) does not adequately fit the experimentally obtained CDFs. (B) The cumulative distribution function of ribosomes after addition of puromycin is best fit by a two-component fit with a shift towards the faster component (73% fast). (C) The cumulative distribution function of ribosomes with β-actin mRNA tethered to focal adhesions (see Figure 3—figure supplement 1) is best fit by a two-component fit with a shift towards the slower component (63% slow). (D) The cumulative distribution function of ribosomes co-moving with β-actin mRNA (green curve) is best fit by a two-component fit (62% slow). Ribosomes that were not co-moving with ribosomes are also best fit by a two-component fit (in purple), but the ratio shifts towards the faster diffusion component (54% slow). (E) MSD curves of co-moving ribosomes (in green) depict increased corralling and an exploration area of 0.06 μm2. MSD curves of non-co-moving ribosomes depict faster diffusion behavior and are less corralled (purple curve).
Figure 3 with 3 supplements
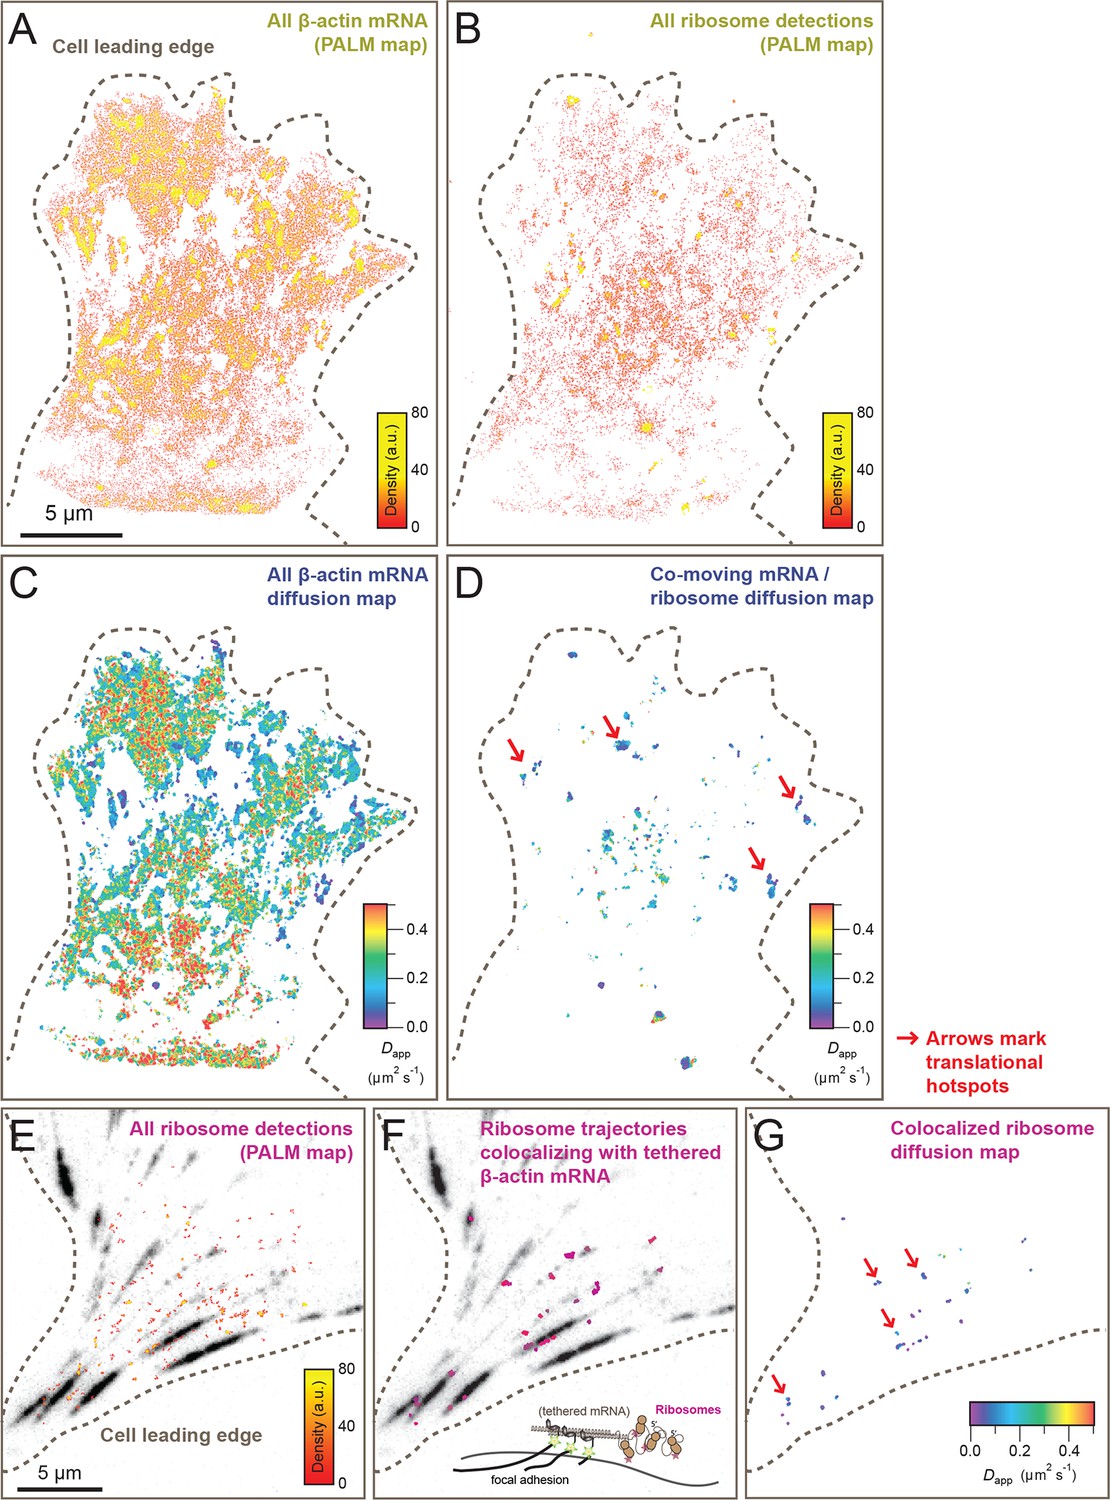
Cellular maps of areas with increased β-actin translation.
(A) Super-resolution PALM density map composed of all 63,940 β-actin mRNA localizations from 6,235 trajectories. The PALM density plot was generated with VISP (El Beheiry and Dahan, 2013) from a simultaneous two-color movie with 500 consecutive frames. (B) Corresponding super-resolution PALM density map of all 19,420 ribosome localizations from 2,811 trajectories. (C) A map of the local apparent diffusion coefficients from all 6,235 β-actin mRNA trajectories. (D) A map of the local apparent diffusion coefficients from the 300 trajectories that were observed to be co-moving. The red arrows mark areas of enriched ribosome association with slowly diffusing β-actin mRNA. (E) Tracking of ribosome trajectories in cells where β-actin mRNA is tethered to focal adhesions. Super-resolution PALM density map composed of all detected localizations (1827) from 215 trajectories from 500 consecutive frames of ribosome imaging (see Video 7). (F) In shades of pink, overlay of the 33 trajectories (15.4% ) that co-localize with the focal-adhesion marker with tethered β-actin mRNA. (G) A map of the apparent diffusion coefficients of co-localized ribosome trajectories exhibits predominately slow diffusion characteristics when mRNA is tethered to focal adhesions. The red arrows mark the hotspots where the tethered mRNA is being actively translated.
Figure 3—figure supplement 1
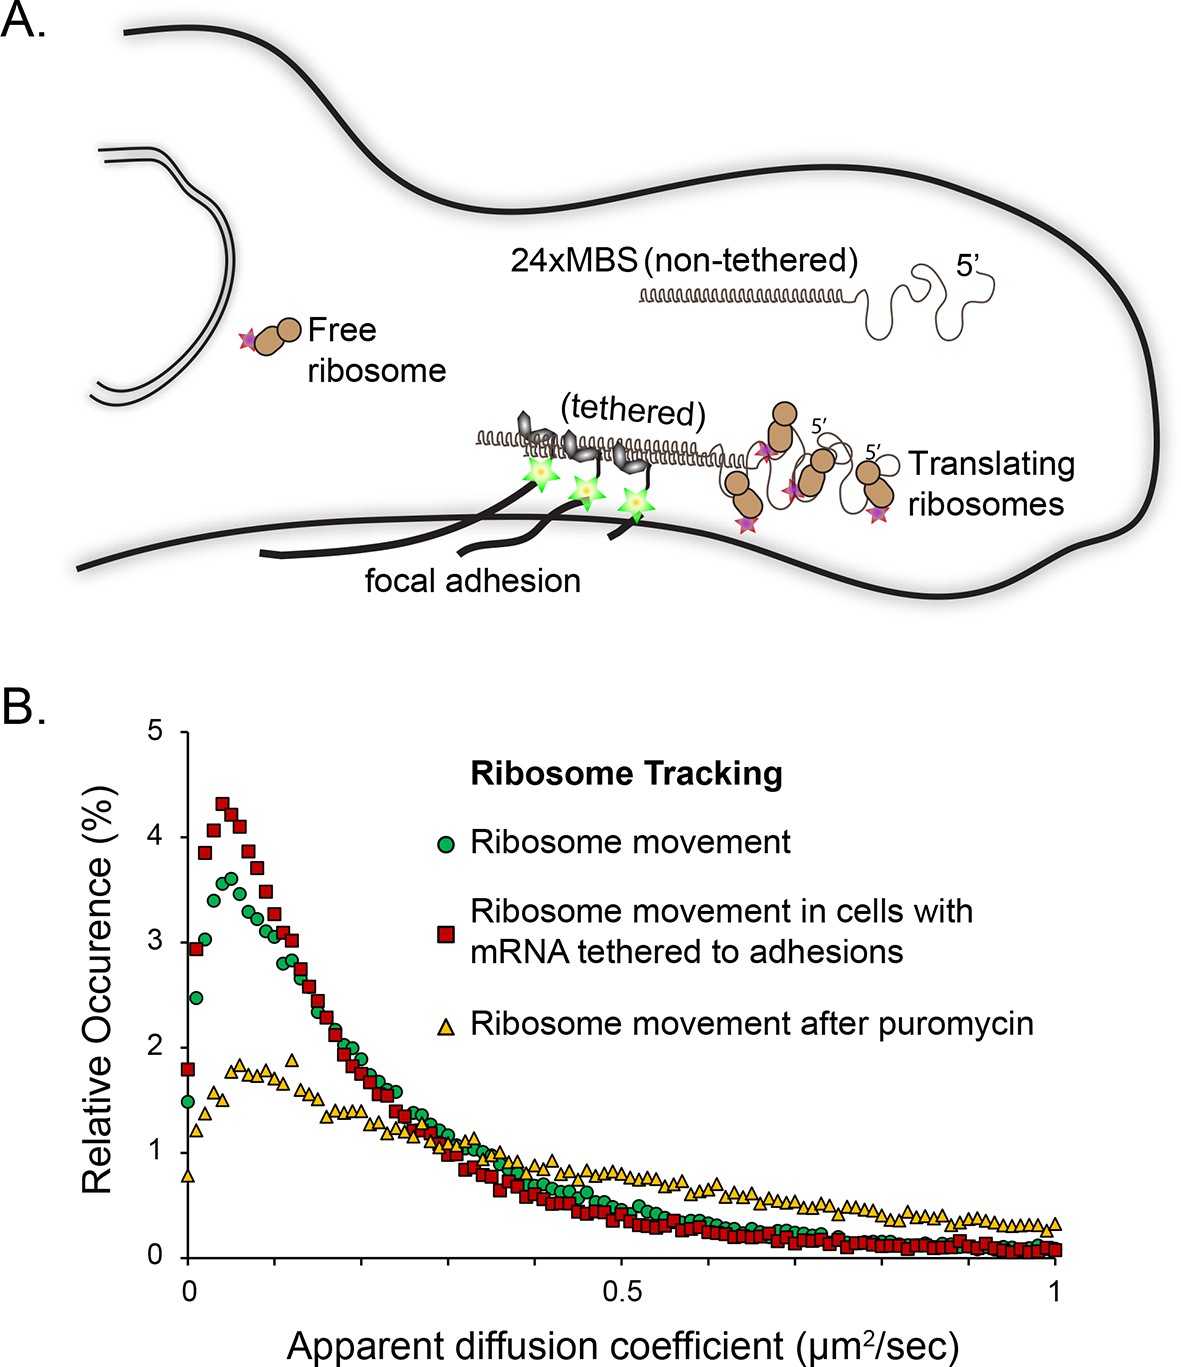
Tracking of individual ribosome molecules with β-actin mRNA tethered to focal adhesions.
(A) The schematic depicts the side view of a fibroblast leading edge with focal adhesions integrating the mRNA tethering construct (vinculin fused to the MS2 capsid protein). All β-actin mRNA tagged with 24 MS2 binding sites will tether directly to the adhesions. Ribosomes tagged with PATagRFP were visualized and tracked at tethering sites. (B) The distribution of apparent diffusion coefficients shifts to a slower population when β-actin mRNA is tethered to focal adhesions. This implies that a substantial fraction of ribosomes interacts with β-actin mRNAs. This population significantly decreases after puromycin treatment.
Figure 3—figure supplement 2
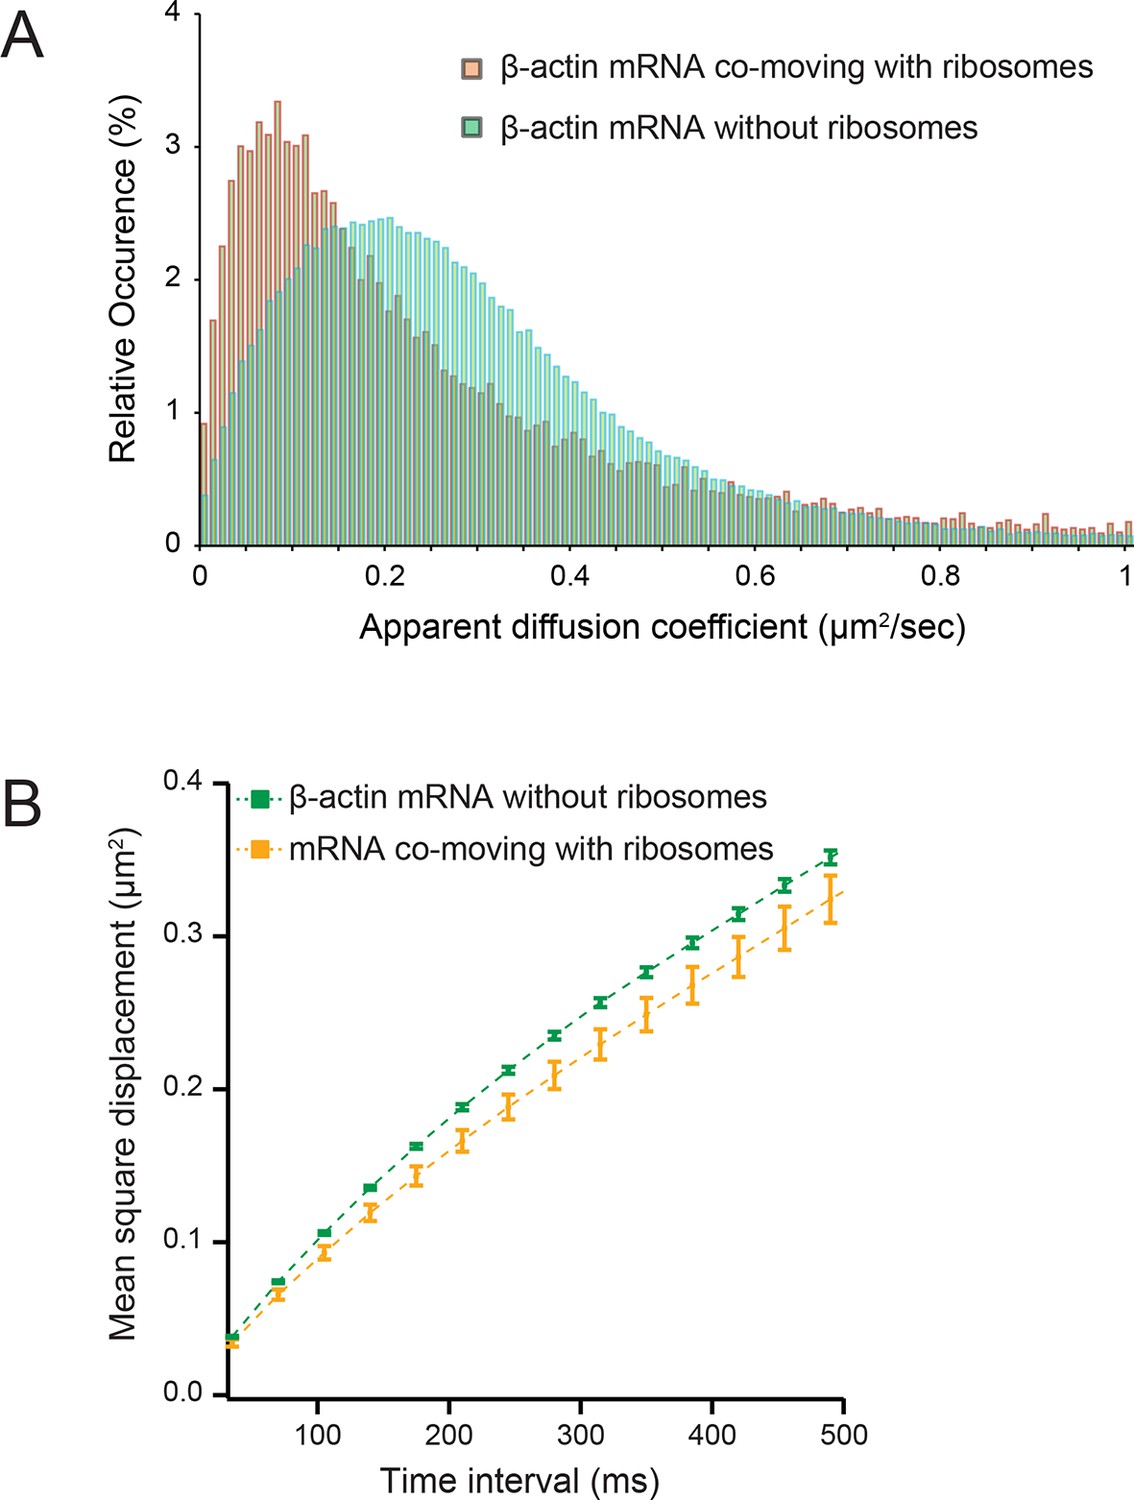
Diffusion characteristics of β-actin mRNA co-moving with ribosomes and without ribosomes.
(A) β-actin mRNAs that co-move with ribosomes exhibitslower apparent diffusion coefficients. (B) The mean square displacement curve of co-moving β-actin mRNA trajectories displays a shift towards corralled movement.
Figure 3—figure supplement 3
mRNA/ribosome colocalization statistics in the absence and presence of puromycin.
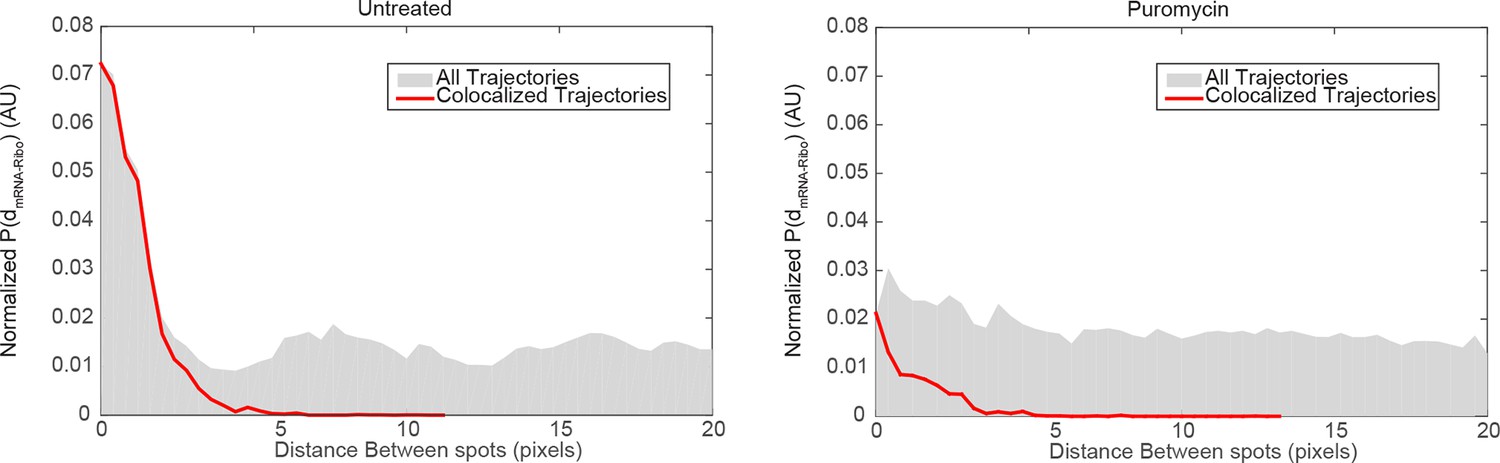
We generated a matrix of the distances between all detected mRNA particles and all detected ribosome particles, and computed the corresponding histogram . We then normalized the distance histogram to account for the fact the area covered by each distance bin grows with , and plotted the resulting normalized distribution of , equivalent to the average density of ribosome spots observed as a function of distance from an mRNA detection. If mRNAs and ribosomes do not colocalize, we would randomly detect ribosomes at all positions in the cell without regard for mRNA positions and therefore we would expect to observe a flat distribution for . In the case of mRNA/ribosome colocalization, we would expect an enrichment of short distances corresponding to comoving trajectories. Left panel: distribution of distances in the vicinity of focal adhesions observed in untreated cells (dataset from Figure 4). The distribution for the entire dataset (gray histogram) consists of a peak of short values (<3 pixels) above a flat baseline. The peak at short distances is the signature of colocalized mRNA/Ribosome trajectories, while the baseline reflects the concentration of fluorescent ribosomes non-associated with detected Actin mRNA molecules. We overlaid the distribution of distances generated from the colocalized trajectories selected by our co-movement algorithm (red line). The algorithm efficiently selects the peak of colocalized trajectories. Right panel: distribution of distances observed in cells treated with puromycin (dataset from Figure 2). The distribution for the entire dataset (gray histogram) consists of essentially a flat baseline, with a modest increase at short distances. This result reflects the almost entire dissociation of ribosomes from mRNAs following puromycin treatment. The co-movement algorithm accordingly selects a very small fraction of colocalized trajectories.
Figure 4 with 3 supplements
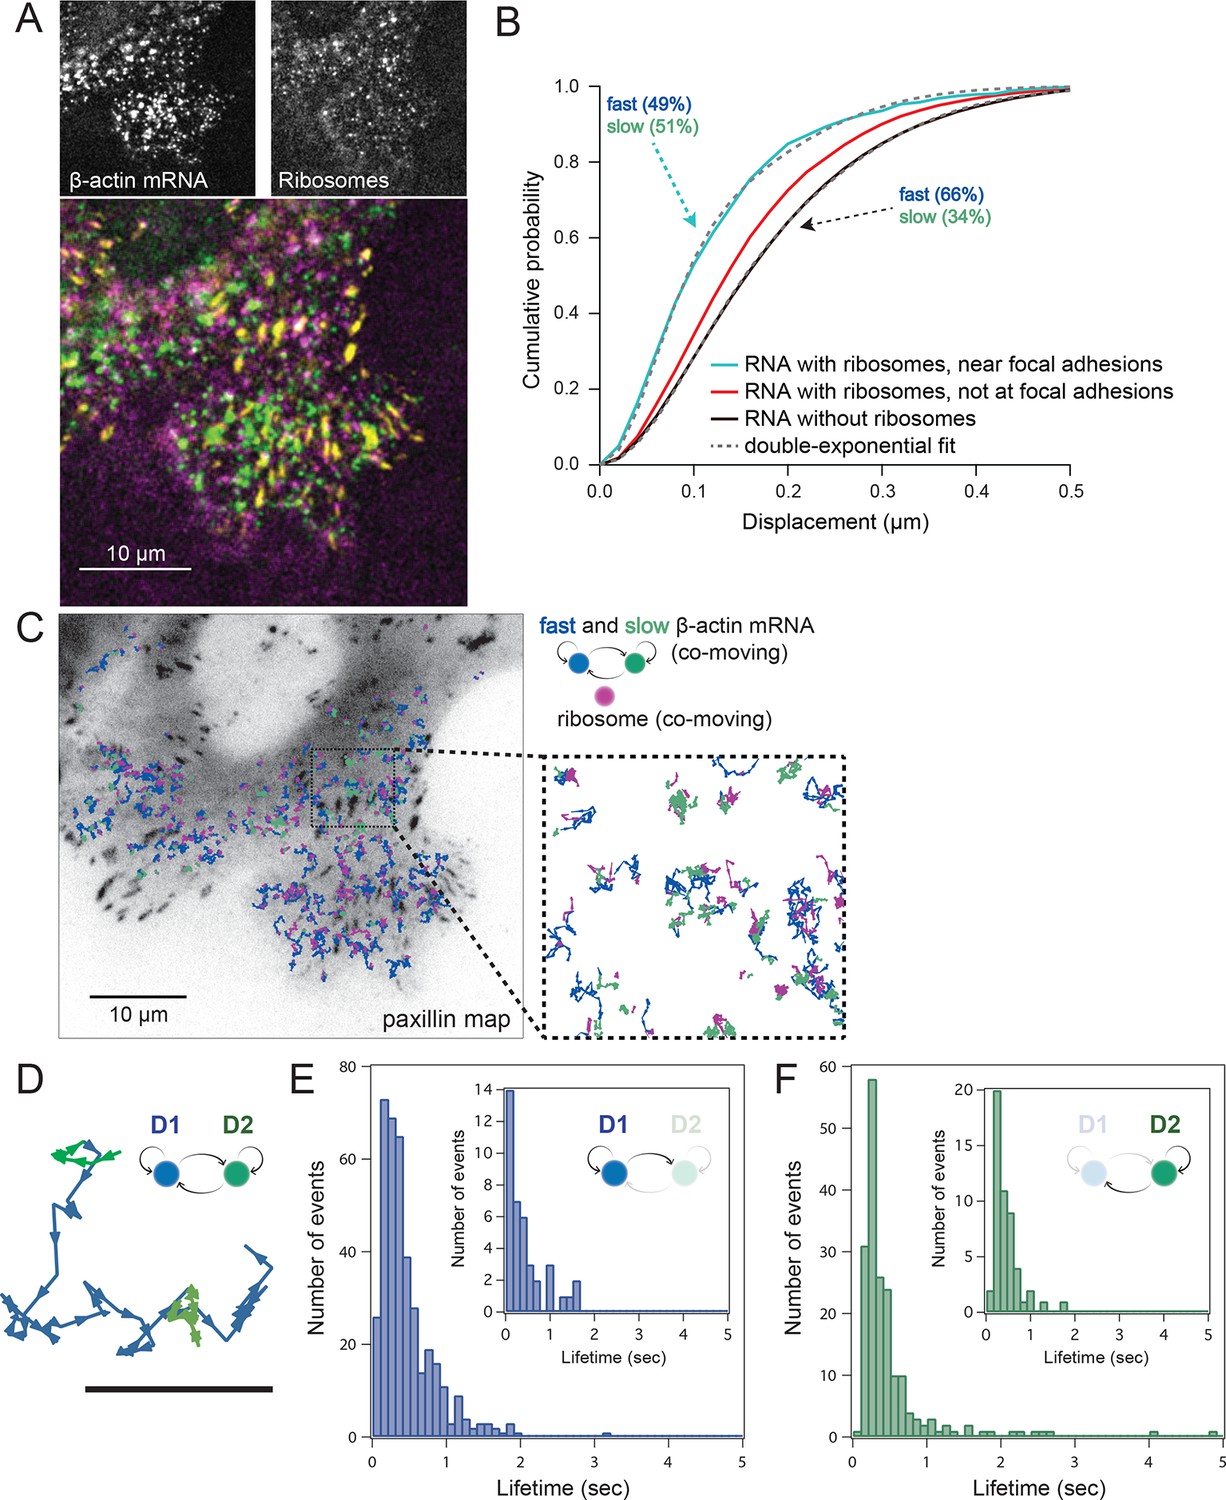
Multi-color live cell imaging and simultaneous tracking of β-actin mRNA and ribosomes at focal adhesions.
(A) The image from a single frame from Video 10 depicts simultaneous tracking of β-actin mRNA (green) and ribosomes (magenta) in live mouse embryonic fibroblasts with focal adhesions labeled with paxillin-mCherry (yellow). The adhesions were bleached prior to tracking mRNA and ribosomes. (B) Compartmentalized co-movement analysis of β-actin mRNA and ribosomes elucidates a shift in the displacement towards slower diffusion of mRNA visualized with ribosomes at adhesions. (C) β-actin mRNA trajectories were assessed by HMM-Bayesian analysis to identify diffusive state switching (fast = blue, slow = green) relative to ribosome trajectories (magenta) near adhesion proteins mapped in black. (D) One co-moving β-actin mRNA trajectory from C) is displayed at higher magnification. HMM-Bayesian analysis clearly visualizes that the trajectory interconverts between the D1 and D2 states multiple times. Scale bar: 1 μm. (E) State-duration histogram for all fast states D1 as determined from all co-moving β-actin mRNA trajectories that sampled the state D1 (from 382 state visits by co-moving mRNA trajectories). Insert: Histogram of only internal state durations of D1 (excluding states at start and end of each track). (F) Corresponding state-duration histogram of all the slow state (D2) durations as determined from 187 visits by co-moving β-actin mRNA trajectories to the state D2. The insert depicts the internal state durations (excluding states at start and end of each track) for D2.
Figure 4—figure supplement 1
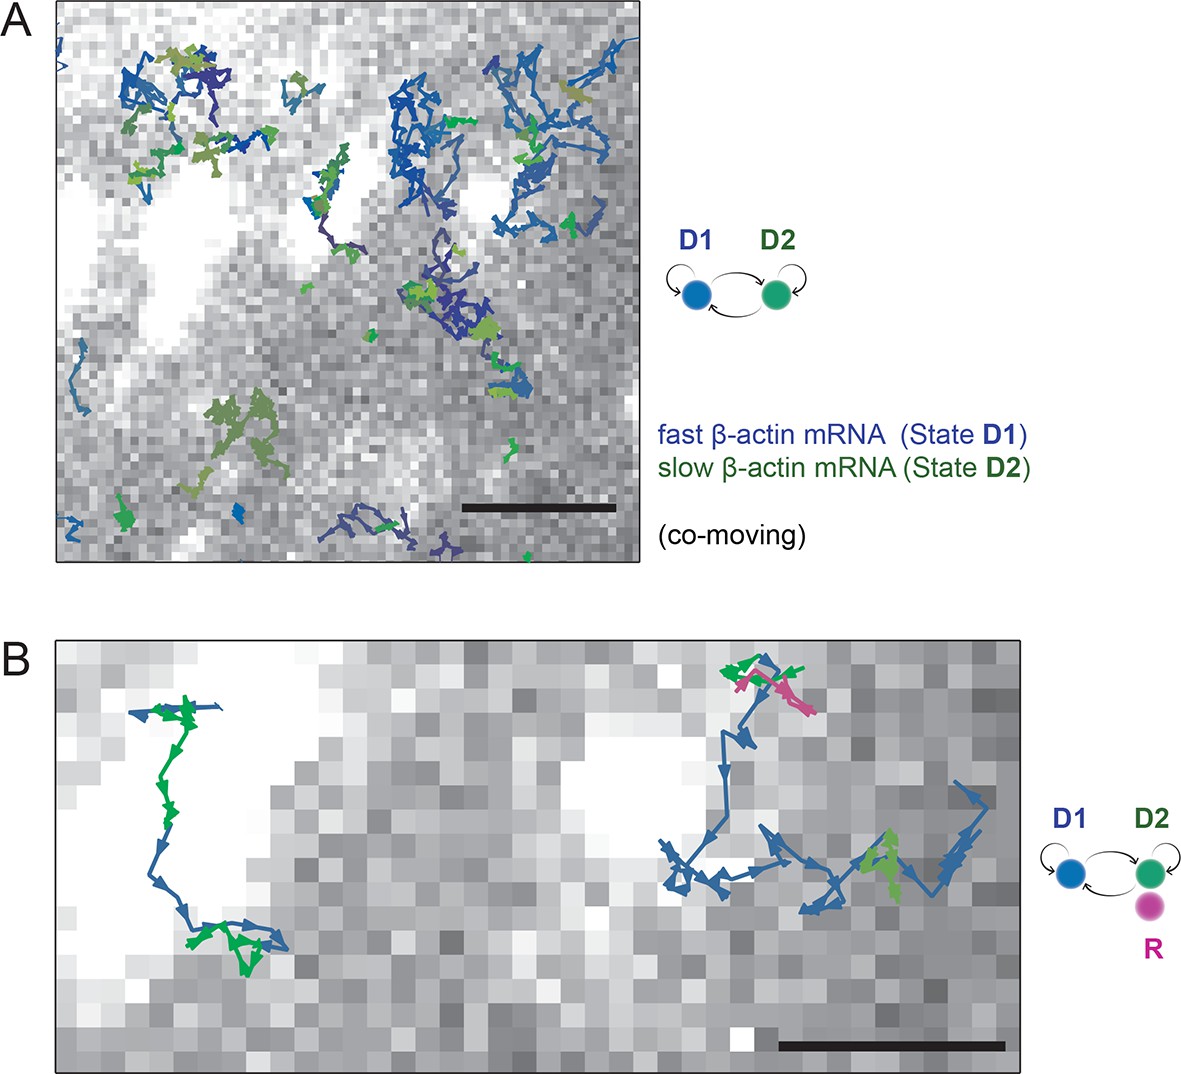
HMM-Bayesian analysis of co-moving mRNAs.
(A) mRNAs that co-move with ribosomes are color-coded according to their diffusive state, as determined by HMM-Bayesian analysis (co-moving ribosomes not shown). The fast state D1 (individual states in shades of blue) and the slow state D2 (shades of green) are displayed. Focal adhesions are depicted in white. Scale bar: 2 μm. (B) Two co-moving mRNA trajectories (from A) are highlighted and displayed at higher magnification. HMM-Bayesian analysis clearly visualizes that both trajectories interconvert between the D1 and D2 states multiple times. Also displayed is one of the co-moving ribosome trajectories (in purple). For a map of all co-moving ribosomes please see Figure 4C and Figure 4—figure supplement 2. Adhesions are depicted in white. Scale bar: 1 μm.
Figure 4—figure supplement 2

HMM-Bayesian analysis of co-moving ribosomes.
(A) Ribosomes that co-move with β-actin mRNA are color-coded according to their diffusive state, as determined by HMM-Bayesian analysis. The fast state D1 (individual trajectories in shades of yellow) and the slow state D2 (shades of purple) are displayed. Focal adhesions are depicted in white. Scale bar: 5 μm. (B) State-duration histogram for all fast states D1 as determined from 329 visits by co-moving ribosome trajectories to the state D1. Insert: histogram of only internal state durations of D1 (excluding states at start and end of each track). (C) Corresponding state-duration histogram of all slow state (D2) durations as determined from 149 visits by co-moving ribosome trajectories to the state D2. The insert depicts the internal state durations (excluding states at start and end of each track) for D2.
Figure 4—figure supplement 3
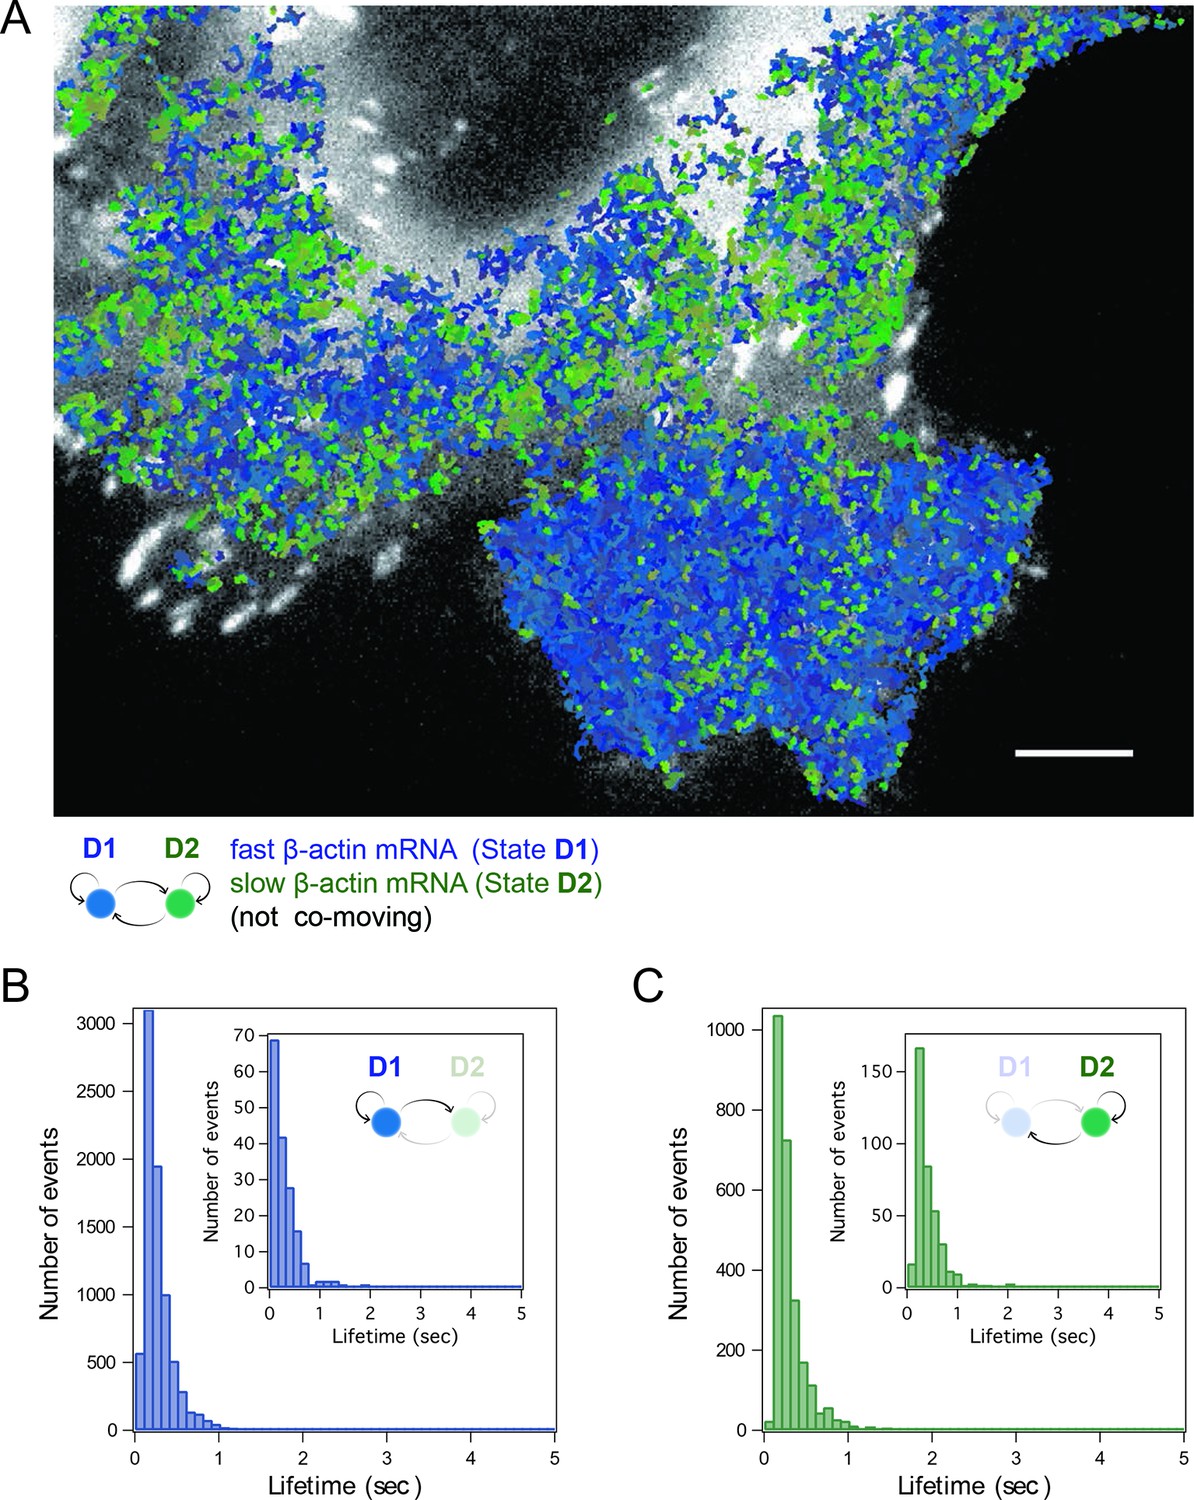
HMM-Bayesian analysis of non-co-moving mRNAs.
(A) Non-co-moving mRNA trajectories are color-coded according to their diffusive state, as determined by HMM-Bayesian analysis (7931 visits to the fast state D1 are displayed in shades of blue, and 2623 visits to the slow state D2 are displayed in shades of green). Focal adhesions are depicted in white. Scale bar: 5 μm. (B) State-duration histogram for all fast states D1 as determined from the trajectories displayed in (A) Insert: Histogram of only internal state durations of D1 (excluding states at start and end of each track). (C) Corresponding state-duration histogram of all slow state (D2) durations as determined from the trajectories displayed in (A). The insert depicts the internal state durations (excluding states at start and end of each track) for D2.
Videos
Video 1
Mouse embryonic fibroblasts (MEFs) from the MBS mouse with 24 MS2 stem-loop binding sites in the β-actin 3'UTR are labeled with tdMCP-GFP.
Focal adhesions are labeled with paxillin-mCherry. Live cell mRNA imaging was performed with TIRF excitation for 500 streaming frames at a frame exposure time of 35 ms. The movie is played at 30 frames per second. Scale bar = 10 µm.
Video 2
The MBS MEF in Video 1 cropped and enhanced to highlight several β-actin mRNA molecules that persist at adhesions.
The scale bar is 5 µm and the movie is played at 30 fps.
Video 3
β-actin mRNA is visualized 60 min after addition of puromycin.
Compared to steady-state movement, mRNA without ribosomes is much faster and homogenous throughout the cytoplasm.
Video 4
β-actin mRNA is visualized 20 min after addition of hippuristanol.
Compared to the control (left), the movement of mRNA without ribosomes (right, same cell 20 min later) is much faster and homogeneous throughout the cytoplasm.
Video 5
Ribosomes are visualized with photo-activated localization microscopy (PALM) in fibroblasts stably expressing the L10A 60s large subunit tagged with photo-activated TagRFP (PATagRFP).
405-nm activation energy is controlled manually to limit the number of fluorescent molecules, enabling single particle tracking of ribosomes. Focal adhesions are labeled with vinculin-GFP. Ribosomes are tracked with a streaming acquisition at 35 ms per frame. The movie is played at 30 fps with a 5 µm scale bar.
Video 6
Ribosomes visualized with L10A-PATagRFP after puromycin addition.
Focal adhesions are labeled with vinculin-GFP. The stack was acquired at 35 ms per frame and played at 30 fps with a 5 µm scale bar.
Video 7
Ribosomes visualized in cells with β-actin mRNA tethered to focal adhesions.
Non-fluorescent β-actin mRNA with MS2 stem-loops in the 3'UTR becomes tethered to vinculin that is tagged with tdMCP-GFP. Ribosomes can be seen preferentially immobilizing at larger focal adhesions that have accumulated mRNA over time. Tethering mRNA to adhesions significantly slows the average diffusion of ribosomes and therefore shows a significant population of tracked ribosomes are interacting with β-actin mRNA. The stack was acquired at 35 ms per frame and played at 30 fps with a 10 µm scale bar.
Video 8
Ribosomes in cells with β-actin mRNA tethered to adhesions after the addition of puromycin.
Compared to the ribosomes in Video 7, it is easy to see that puromycin dissociates ribosomes from mRNA tethered at focal adhesions. The stack was acquired at 35 ms per frame and played at 30 fps with a 5 µm scale bar.
Video 9
β-actin mRNA and ribosomes are simultaneously visualized and tracked after puromycin addition.
The stack was acquired at 35 ms per frame and played at 30 fps with a 10 µm scale bar.
Video 10
β-actin mRNA and ribosomes are simultaneously visualized and tracked after the cell’s focal adhesions were identified with paxillin-mCherry and bleached.
The stack was acquired at 35 ms per frame and played at 30 fps with a 5 µm scale bar.
Download links
A two-part list of links to download the article, or parts of the article, in various formats.
Downloads (link to download the article as PDF)
Open citations (links to open the citations from this article in various online reference manager services)
Cite this article (links to download the citations from this article in formats compatible with various reference manager tools)
Mapping translation 'hot-spots' in live cells by tracking single molecules of mRNA and ribosomes
eLife 5:e10415.
https://doi.org/10.7554/eLife.10415


