Oviductal estrogen receptor α signaling prevents protease-mediated embryo death
- National Institute of Environmental Health Sciences, National Institutes of Health, United States
- Washington State University, United States
Figures
Figure 1 with 1 supplement
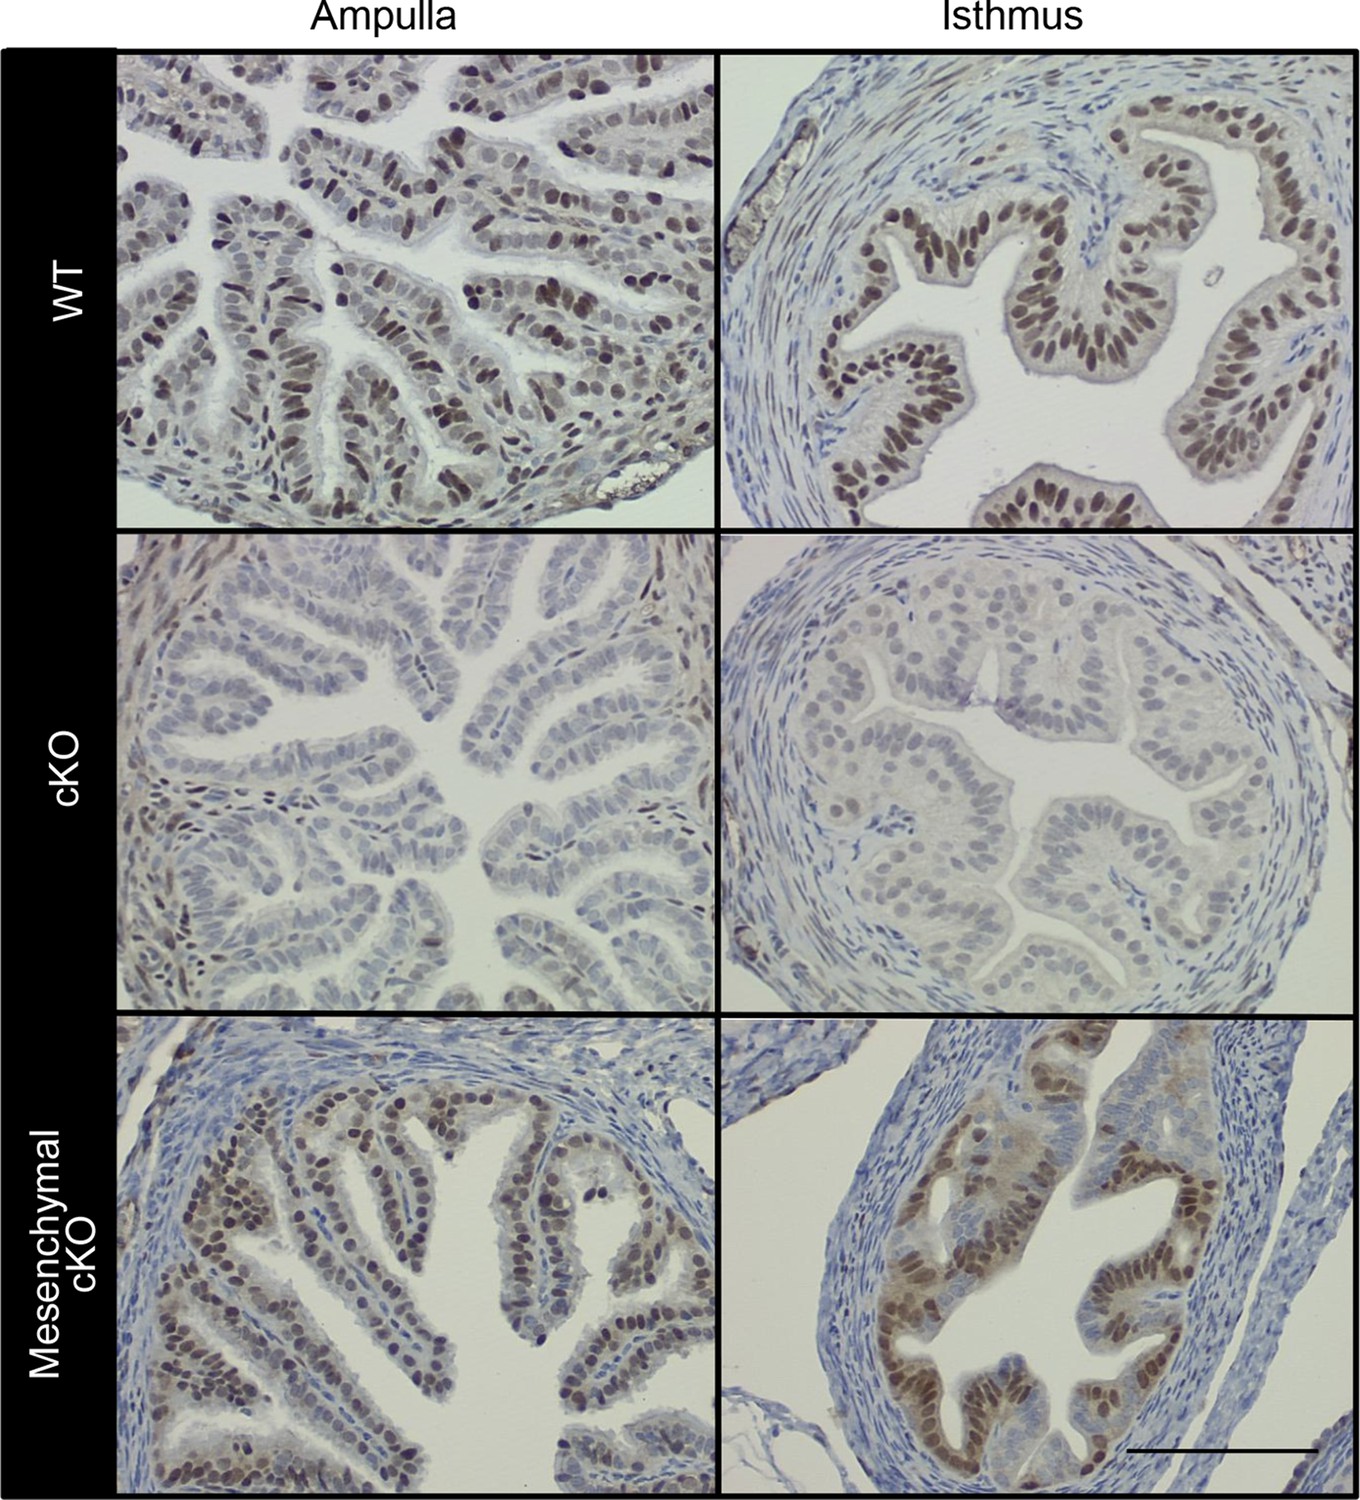
Conditional deletion of estrogen receptor α (ERα) from cell type-selective regions of the oviduct.
Representative immunohistochemical analysis of ERα in the oviduct regions indicated from wild-type (WT), conditional knockout (cKO), and mesenchymal cKO mice. Scale bar = 100 μm. ERα protein expression in the cKO uterus was reported previously (Winuthayanon et al., 2010).
Figure 1—figure supplement 1
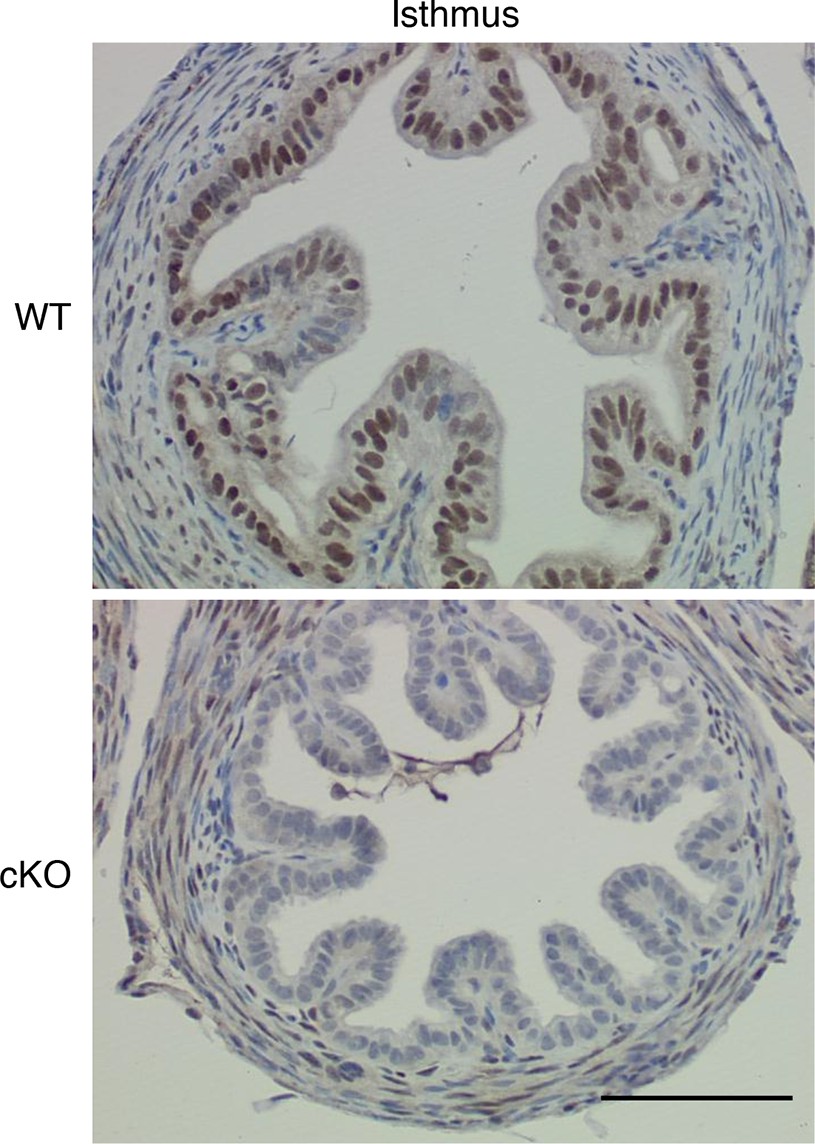
Additional images showing immunohistochemical analysis of estrogen receptor α (ERα) in oviduct isthmus.
Wild-type (WT) and conditional knockout (cKO) are indicated. Epithelial cells in cKO completely lacked ERα signal, but no difference in smooth muscle or stromal staining was observed. Scale bar = 100 μm.
Figure 2 with 1 supplement
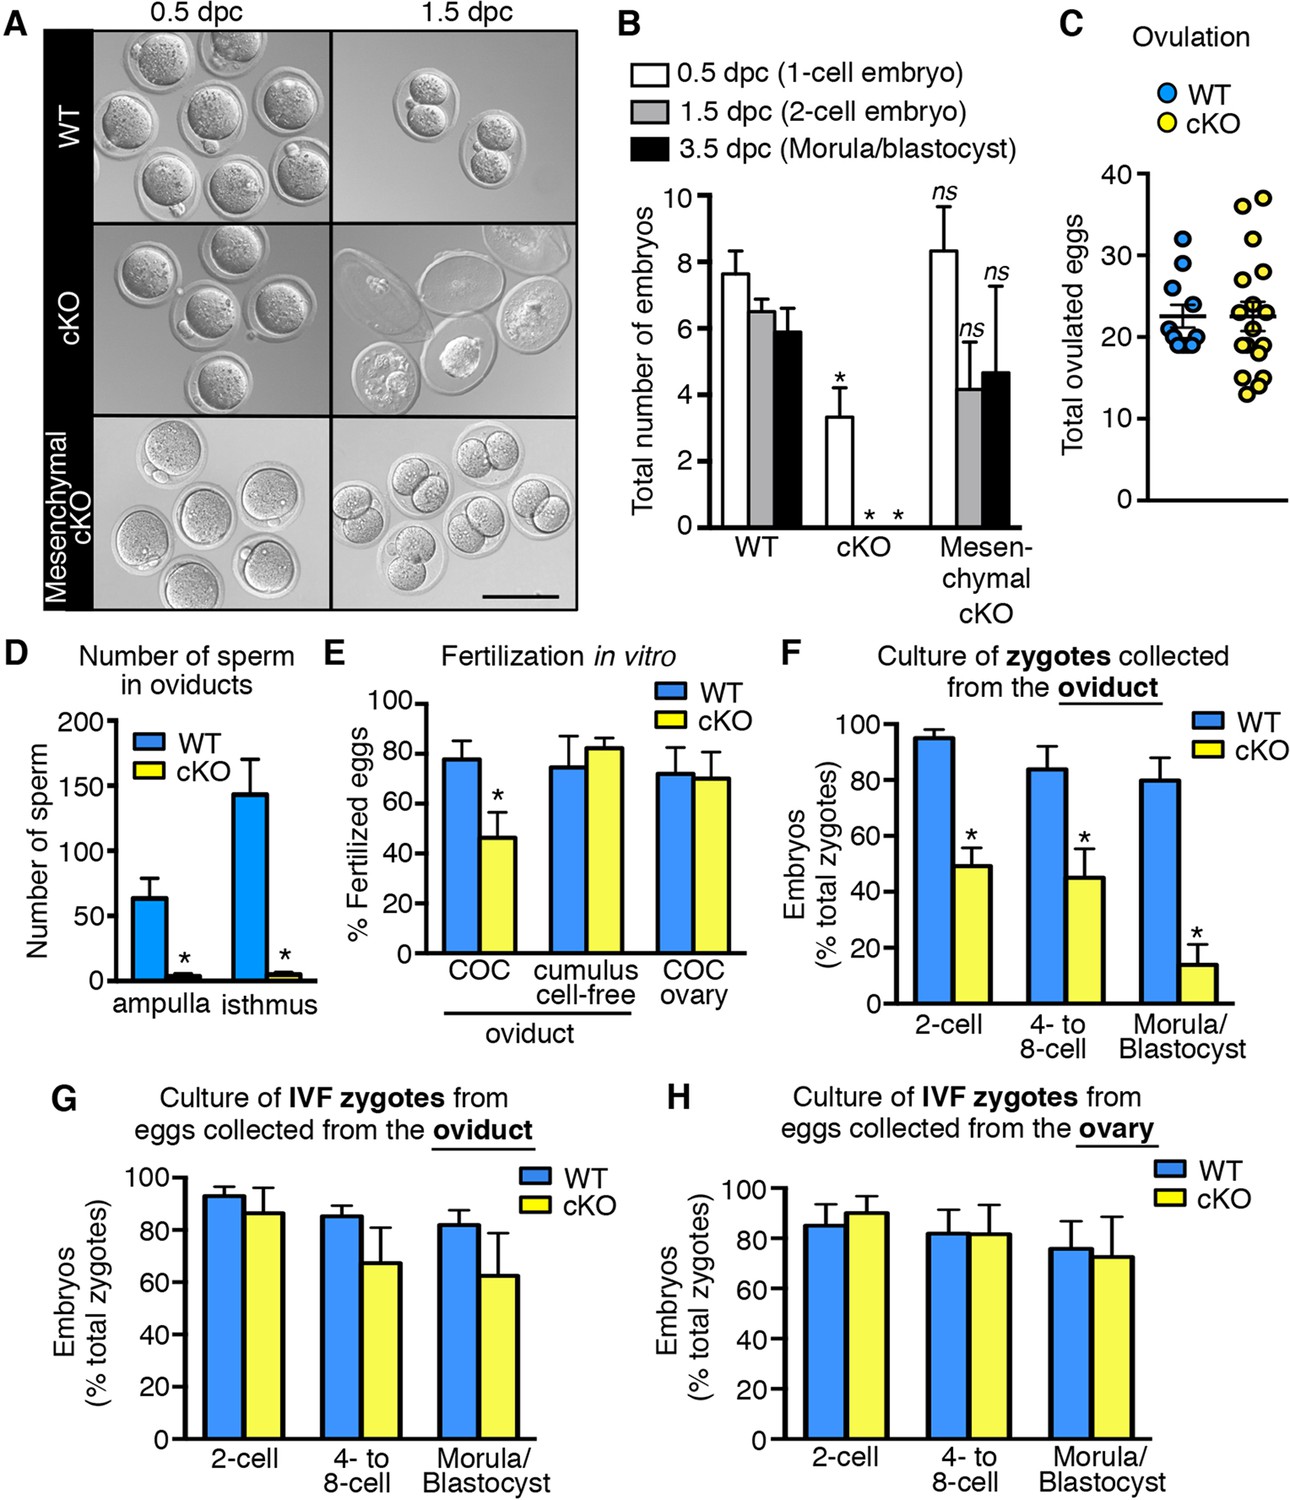
Decreased fertilization and increased embryo death in oviducts lacking epithelial estrogen receptor α (ERα).
(A) Images of zygotes and two-cell embryos collected at 0.5 and 1.5 dpc from each genotype. Scale bar = 100 μm. (B) Total embryos collected at the indicated time points (n = 3–11 mice/group). *p< 0.05 vs WT at similar time-point; ns, no significant difference vs WT at similar time-point. (C) Total ovulated oocytes from WT and cKO females after stimulation with gonadotropins (n = 10–16 mice/group). (D) Number of sperm present in the indicated regions of WT and cKO oviducts following mating. Graph shows number of sperm within cumulus cell masses in the ampulla (n = 5 mice/group) and relative number of sperm flushed from the isthmus region (n = 6 mice/group). *, significant difference compared to WT at designated location, Mann–Whitney test, p <0.01. (E) IVF efficiency. Cumulus-oocyte complexes (COCs) were collected from the oviducts or ovaries of superovulated WT and cKO females and then inseminated. Cumulus cells were removed from one set of oviduct COCs prior to insemination (cumulus cell-free). Graph indicates the percentage of eggs fertilized out of the total collected (n = 5–7 mice/group). (F) Development in vitro of zygotes collected from oviducts of WT and cKO mice. Embryo morphology recorded after 24 hr (two-cell stage), 48 hr (four- to eight-cell stage), and 72 hr (morula and blastocyst stages) (n = 4–5 mice/group). (G,H) Development in vitro of zygotes generated by IVF of oocytes from (G) oviducts (n = 5–7 mice/group) or (H) ovaries of WT and cKO mice (n = 5–7 mice/group). All graphs represent mean ± SEM. *, significant difference compared to WT at designated time point, p<0.05. cKO: Conditional knockout; dpc: Days post coitum; IVF: In vitro fertilization; WT: Wild-type.
Figure 2—figure supplement 1
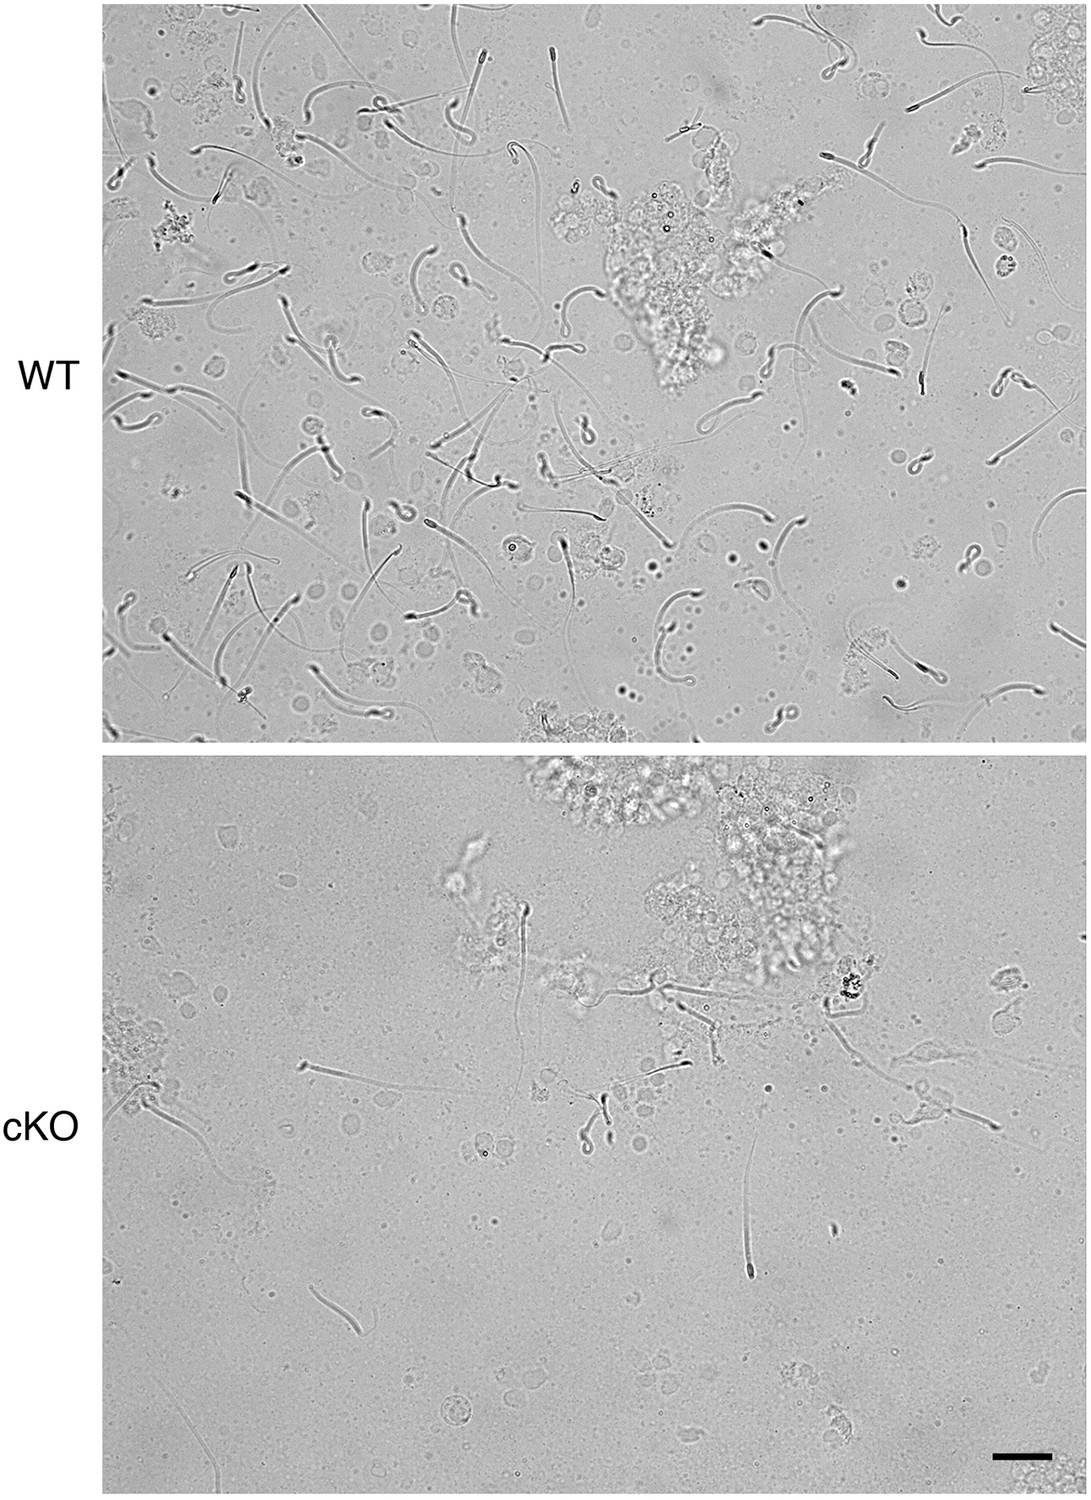
Representative images of sperm flushed from oviductal isthmus of wild-type (WT) and conditional knockout (cKO) mice.
Scale bar = 20 μm.
Figure 3
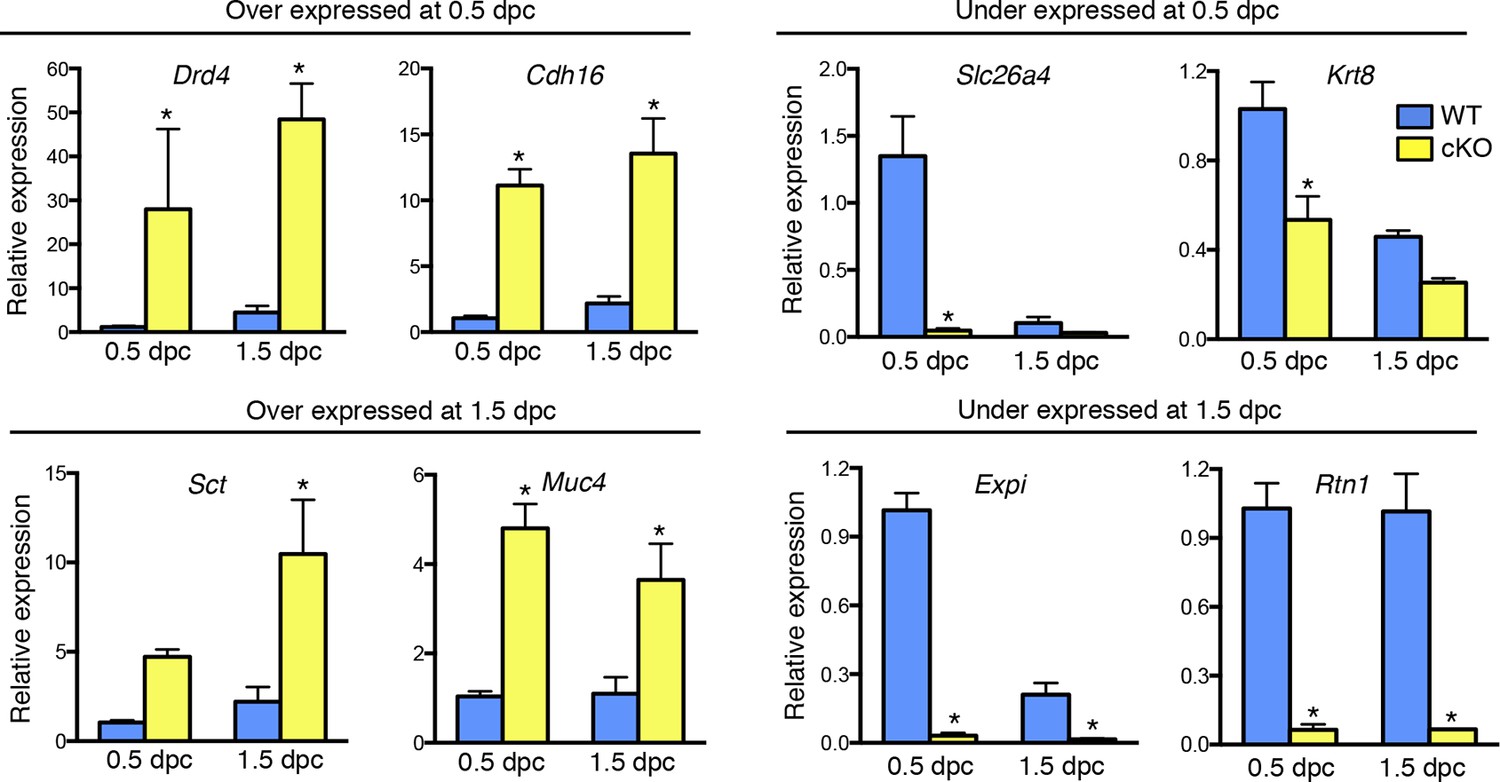
Validation of up- and down-regulated genes in conditional knockout (cKO) compared to Wild-type (WT) oviducts at 0.5 and 1.5 dpc using real-time PCR analysis.
The transcripts were selected from microarray datasets for over- and under-expression in cKO oviducts compared to WT at 0.5 or 1.5 dpc, as indicated (n = 4–7 mice/group; mean ± SEM). Data represents relative expression level normalized to Rpl7. *, significant difference compared to WT at same time point, p<0.05. dpc: Days post coitum.
Figure 4
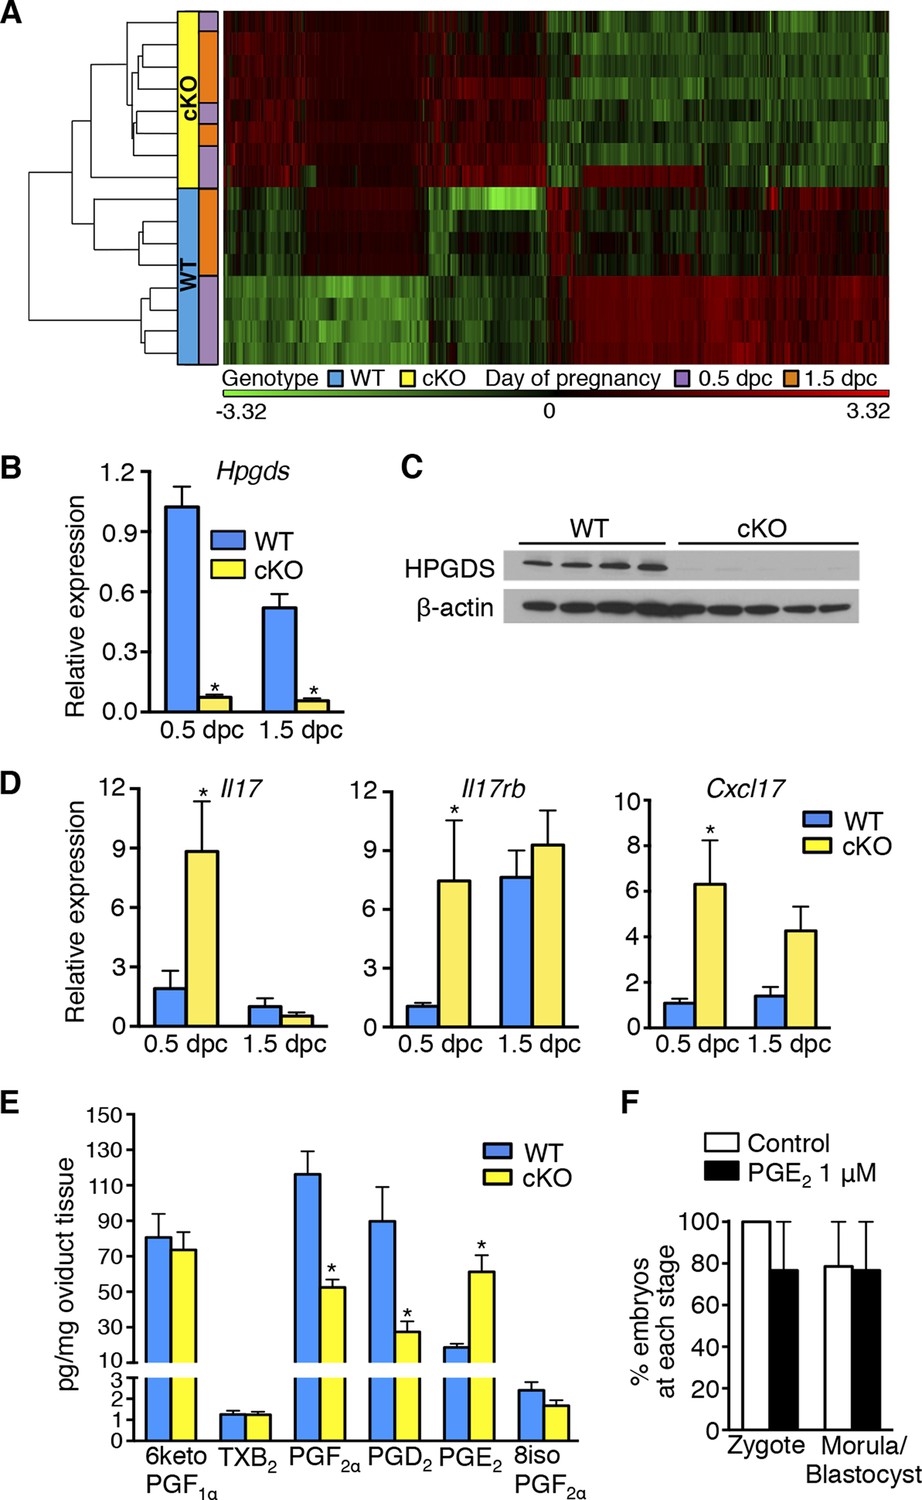
Aberrant oviduct innate immune function in the absence of oviductal epithelial estrogen receptor α (ERα).
(A) Unsupervised hierarchical clustering of microarray data from wild-type (WT) and conditional knockout (cKO) oviducts at 0.5 and 1.5 dpc. Using a 1.5-fold cutoff, 3263 probes were significantly different between WT and cKO oviducts at 0.5 dpc, whereas only 321 probes were different at 1.5 dpc. The heat map shows log2 transformed and standardized g Processed Signals (signal intensities). Green color represents probes with intensity less than mean; red color represents probes with intensity more than mean. Each horizontal bar represents data from a single animal; n = 4 mice/group. (B) Real-time PCR of hematopoietic prostaglandin D synthase (Hpgds) transcript in WT and cKO oviducts at 0.5 and 1.5 dpc (n = 4–7 mice/group). (C) Immunoblot of HPGDS expression in WT and cKO oviducts at 0.5 dpc; β-actin was used as a loading control. Protein lysate from one mouse in each lane; n = 4–5 mice/group. (D) Real-time PCR of interleukin-17 (Il17), interleukin-17 receptor b (Il17rb), and chemokine (CXC motif) ligand 17 (Cxcl17)transcripts in WT and cKO oviducts at 0.5 and 1.5 dpc (n = 4–7 mice/group). (E) Prostaglandin profile in whole oviduct tissues from WT and cKO at 0.5 dpc. 6ketoPGF1α, 6-keto-prostaglandin F1α; TXB2, thromboxane B2; PGF2α, prostaglandin F2α; PGD2, prostaglandin D2; PGE2, prostaglandin E2; and 8isoPGF2α, 8-iso-prostaglandin F2α (n = 6–7 mice/group). (F) Number of fertilized eggs (zygotes) after insemination in the presence of PGE2 and number of morulae and blastocysts 3 days after treating zygotes with 1 μM PGE2 as compared to vehicle control (n = 36–40 oocytes/group). For all panels, graphs represent mean ± SEM and asterisks indicate significant difference compared to WT at designated time point, p<0.05. dpc: Days post coitum; HPGDS: hematopoietic prostaglandin D synthase.
Figure 5 with 1 supplement
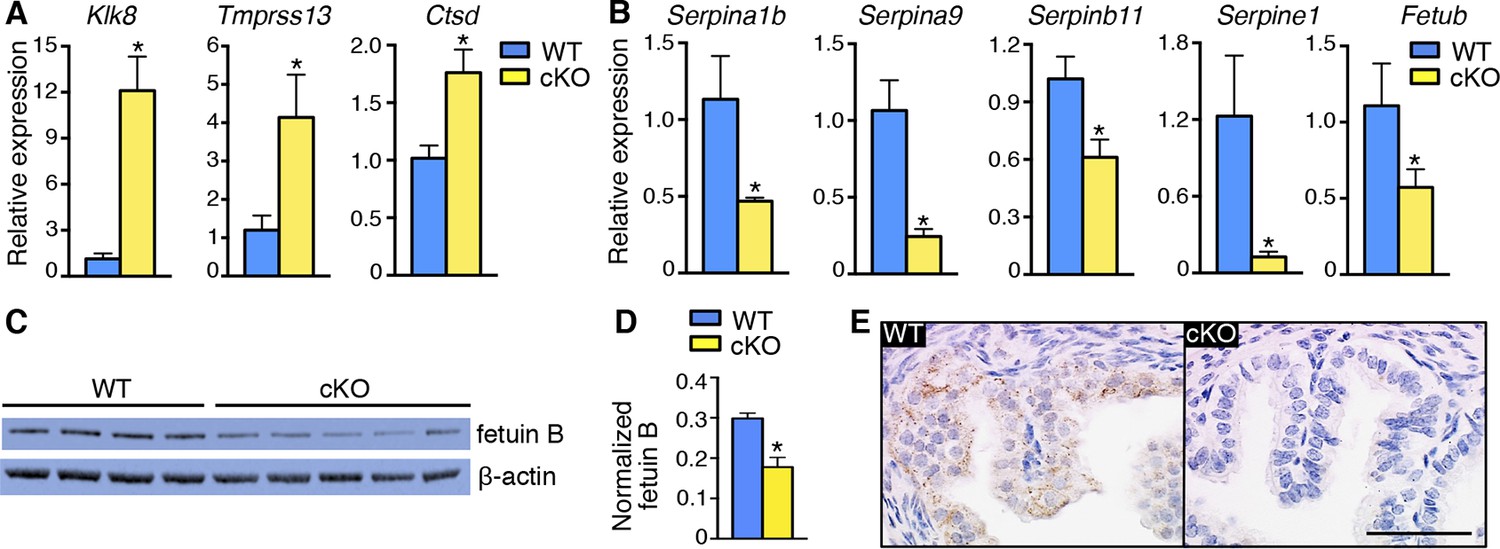
Alterations in expression of proteases and protease inhibitors in oviducts lacking epithelial estrogen receptor α (ERα).
Real-time PCR of the indicated (A) proteases and (B) protease inhibitors in wild-type (WT) and conditional knockout (cKO) oviducts at 0.5 dpc (n = 4–7 mice/group; mean ± SEM). (C) Immunoblot analysis of fetuin B in WT and cKO oviducts; β-actin served as a loading control. Protein lysate from one mouse in each lane; n = 4–5 mice/group. (D) Quantitation of fetuin B signal intensity normalized to β-actin. (E) Fetuin B localization in WT and cKO oviducts at 0.5 dpc. Images shown are representative of n = 4 mice/group. Scale bar = 50 μm. For all panels, asterisk indicates significant difference compared to WT, p<0.05. dpc: Days post coitum.
Figure 5—figure supplement 1
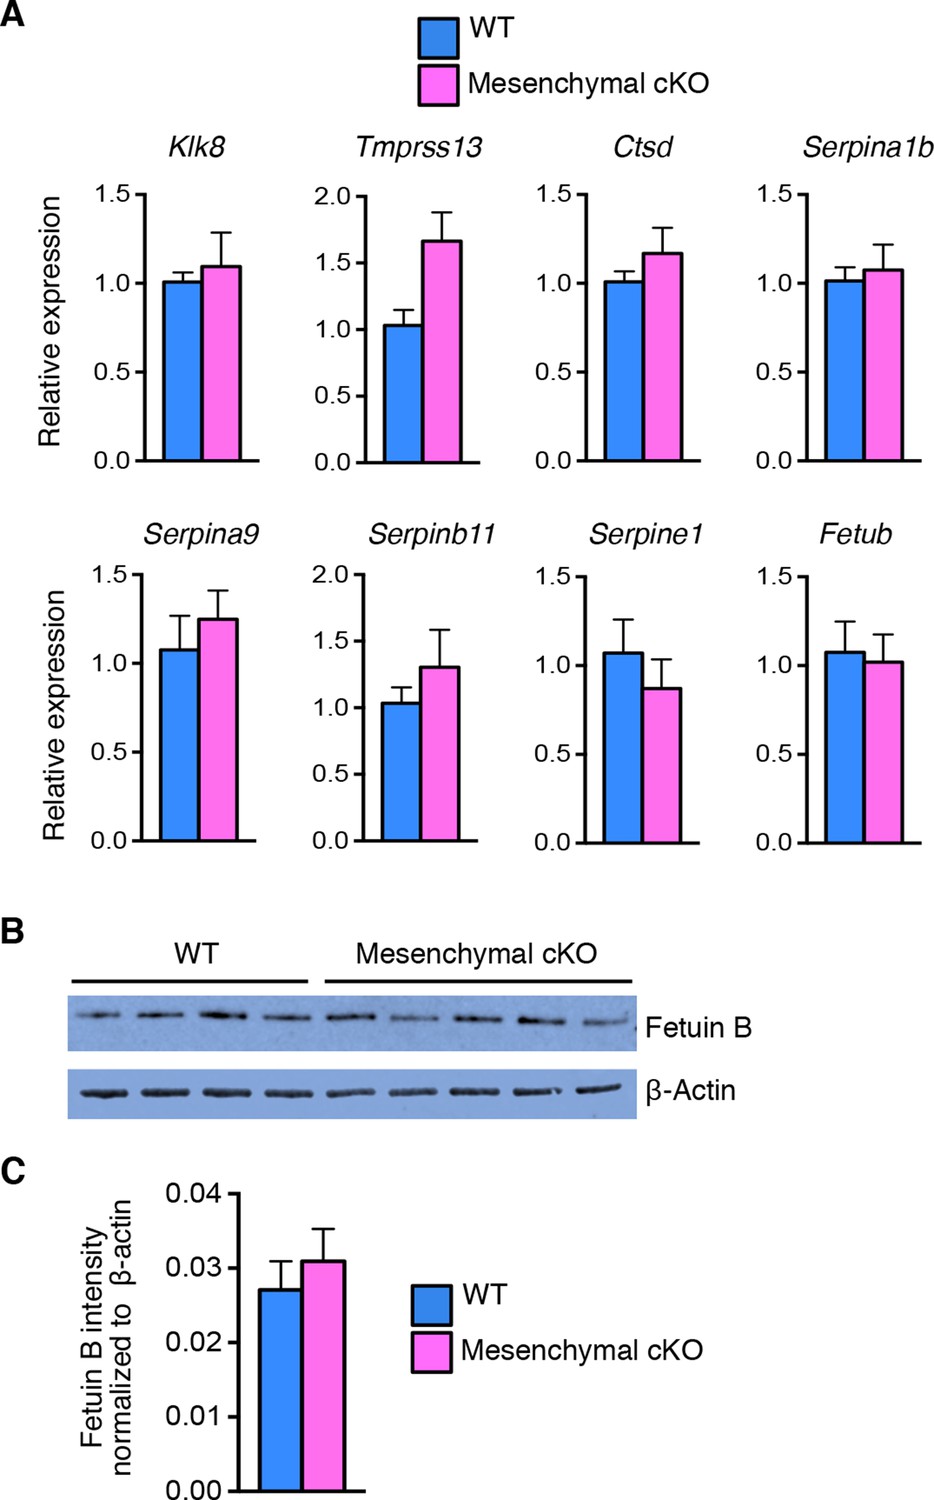
Comparable expression of proteases and protease inhibitors in wild-type (WT) and mesenchymal conditional knockout (cKO) oviduct at 0.5 dpc.
(A) Real-time PCR of the indicated proteases and protease inhibitors in WT and mesenchymal cKO oviducts at 0.5 dpc (n = 4–6 mice/group; mean ± SEM). (B) Immunoblot analysis and (C) normalized signal intensities of fetuin B protein to β-actin in WT and mesenchymal cKO oviducts at 0.5 dpc. dpc: Days post coitum.
Figure 6 with 1 supplement
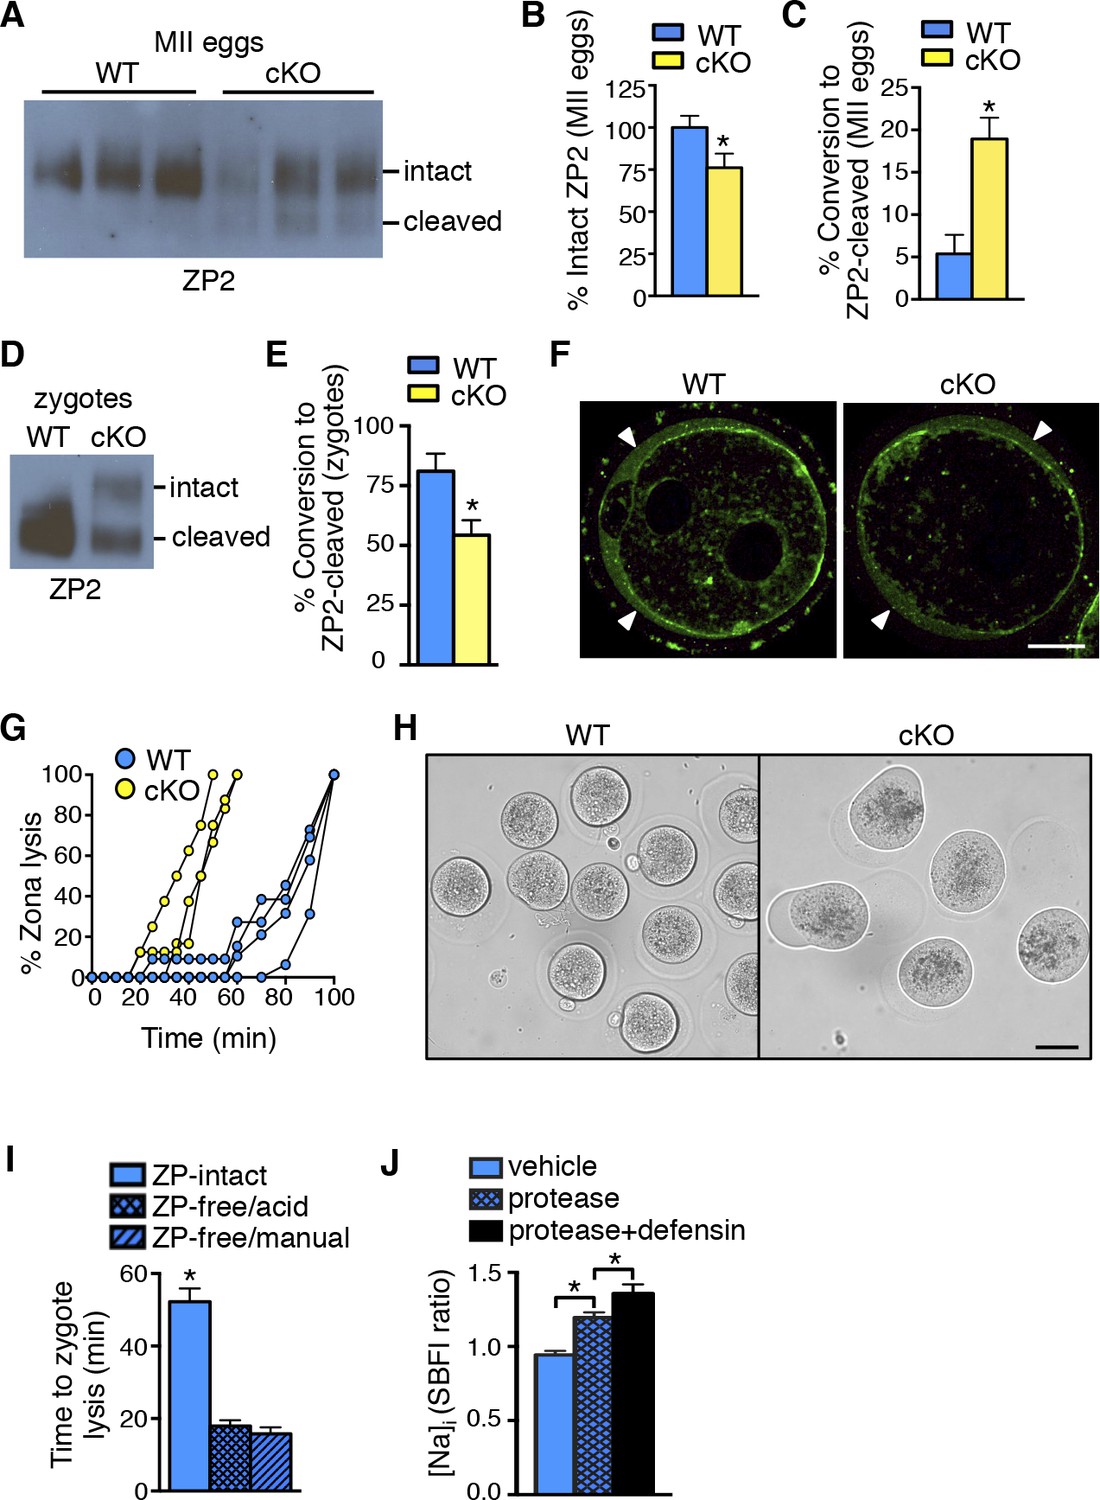
Zona pellucida alterations due to elevated protease activity in oviducts lacking epithelial estrogen receptor α (ERα).
(A) Immunoblot analysis of ZP2 protein in eggs retrieved from wild-type (WT) and conditional knockout (cKO) oviducts ∼4 hr after ovulation. Eight eggs from one mouse/lane. (B,C) Quantitation of the percentage intact ZP2 protein (B) and percentage conversion from intact ZP2 to cleaved ZP2 (C) in ovulated eggs from WT and cKO oviducts (n = 6 mice/group); *p<0.05. (D) Immunoblot analysis of ZP2 in zygotes retrieved from WT and cKO oviducts ∼10 hr after fertilization. Ten zygotes pooled from 3 mice per lane. (E) Percentage conversion from intact ZP2 to cleaved ZP2 in zygotes from WT and cKO oviducts. Graph presents data from 7 pools of 10 embryos per group; mean ± SEM. *p <0.05, T-test. (F) Images of zygotes from WT and cKO oviducts stained for cortical granules. Arrowheads indicate cortical granule contents in the perivitelline space. Scale bar = 20 μm. (G) Percentage ZP lysis over time in zygotes retrieved from WT and cKO oviducts and incubated in 0.2% α-chymotrypsin. Each line represents data from one mouse. (H) Images of WT and cKO zygotes after 90 min incubation in 0.2% α-chymotrypsin (n = 3–4 mice/group). Scale bar = 50 μm. (I) Time to lysis for zygotes cultured in 0.4% α-chymotrypsin with ZP either intact or removed using treatment with acidic Tyrode’s solution or manual microdissection, as indicated. Graph presents data from 15–21 embryos per treatment over three independent experiments; mean ± SEM. *p<0.05, ANOVA. (J) [Na]i in WT zygotes exposed to vehicle, 0.2% α-chymotrypsin (protease), or 0.2% α-chymotrypsin and recombinant defensins (protease defensin). Graph shows relative [Na]i as indicated by SBFI 340/380 ratio (n = 10–12 embryos/group; mean ± SEM). *p <0.05, ANOVA. cKO: Conditional knockout; MII: Metaphase II; [Na]i: Intracellular sodium; SBFI: Sodium-binding benzofuran isophthalate;WT: Wild-type; ZP: Zona pellucida.
Figure 6—figure supplement 1
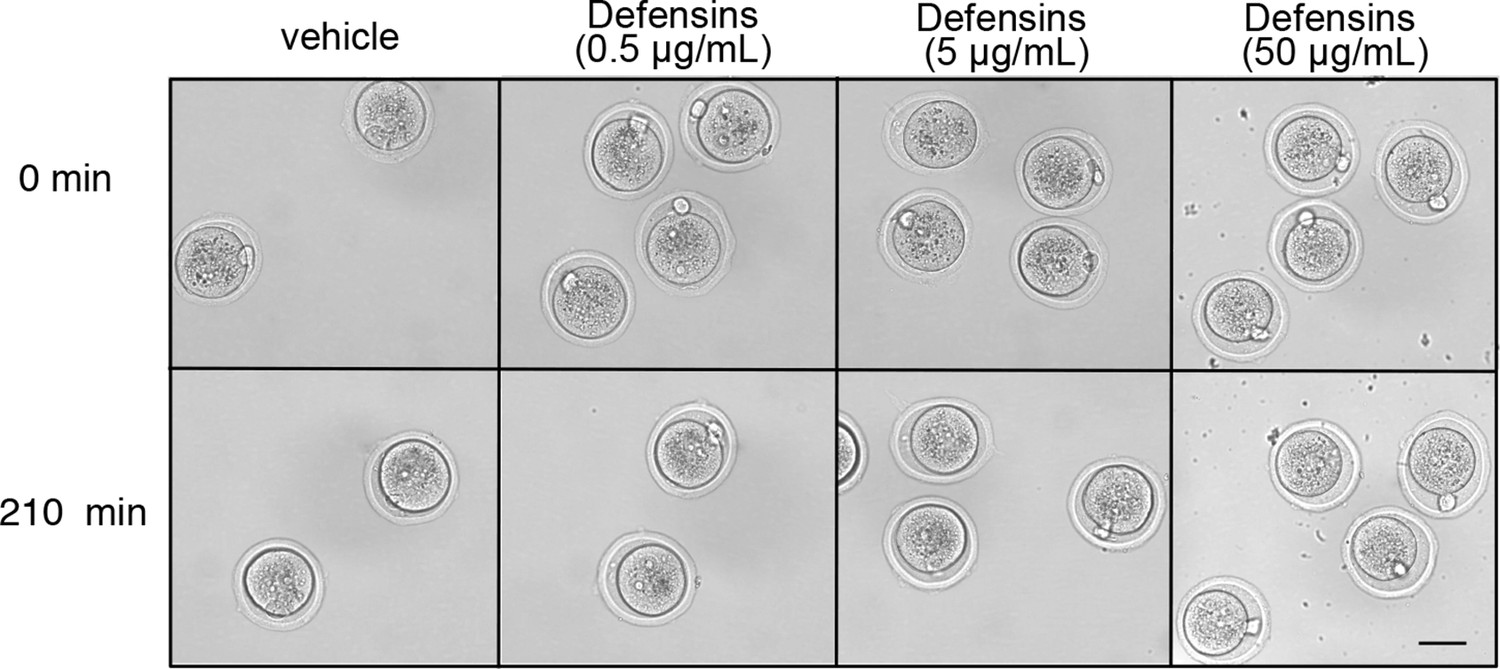
Morphology of WT zygotes after exposure to defensins.
Zygotes were incubated at 37°C in the presence of vehicle (PBS) or a combination of α-defensin 1 and β-defensin 3 recombinant proteins, each at a concentration of 0.5, 5, or 50 μg/mL. Pictures were taken at the indicated time-points. Scale bar = 50 μm.
Figure 7
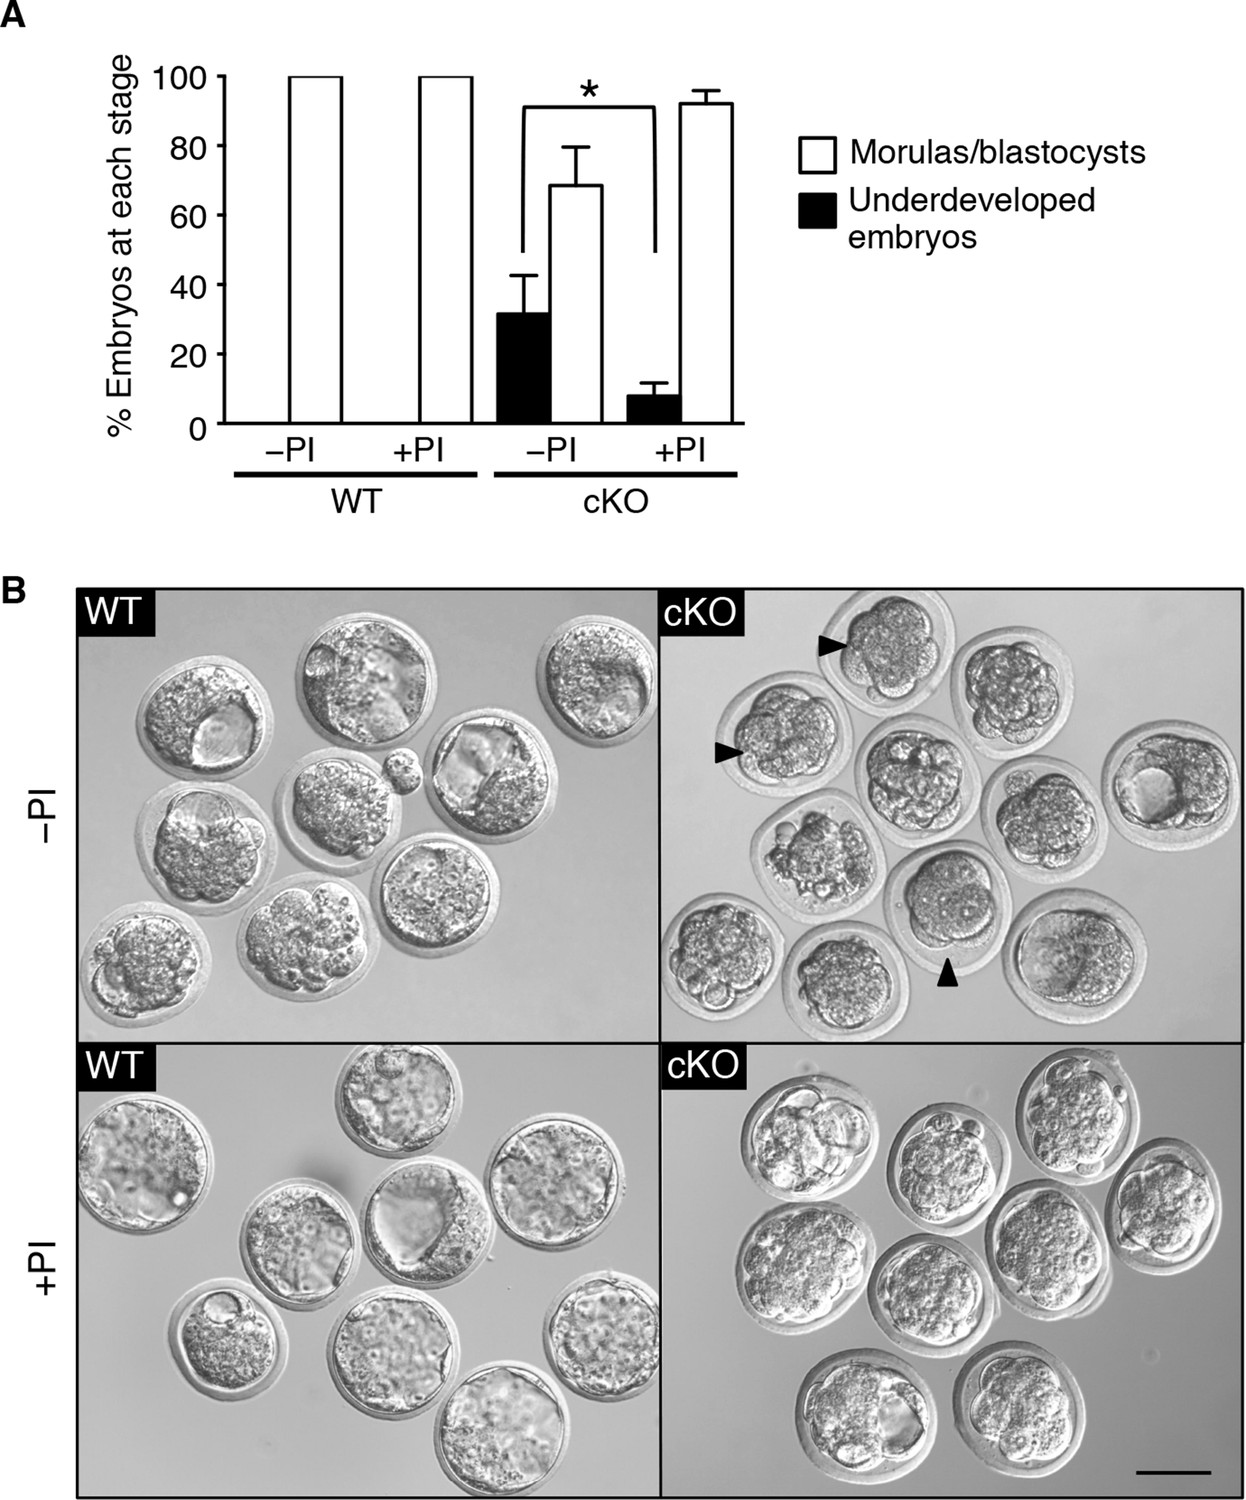
Excessive protease activity in vivo in the conditional knockout (cKO) oviduct leads to embryo development failure.
(A) Percentage of underdeveloped embryos and morula/blastocyst stage embryos retrieved from pseudopregnant wild-type (WT) and cKO recipients that received no protease inhibitors (–PI) or received protease inhibitors ( PI) during embryo transfer (n = 5–12 mice/group and 42–64 embryos/group; mean ± SEM, *p <0.05). (B) Representative images of embryos retrieved from WT and cKO recipients at 3.5 dpc in –PI and PI groups. Arrowheads indicate examples of underdeveloped embryos. Scale bars = 50 μm.
Figure 8
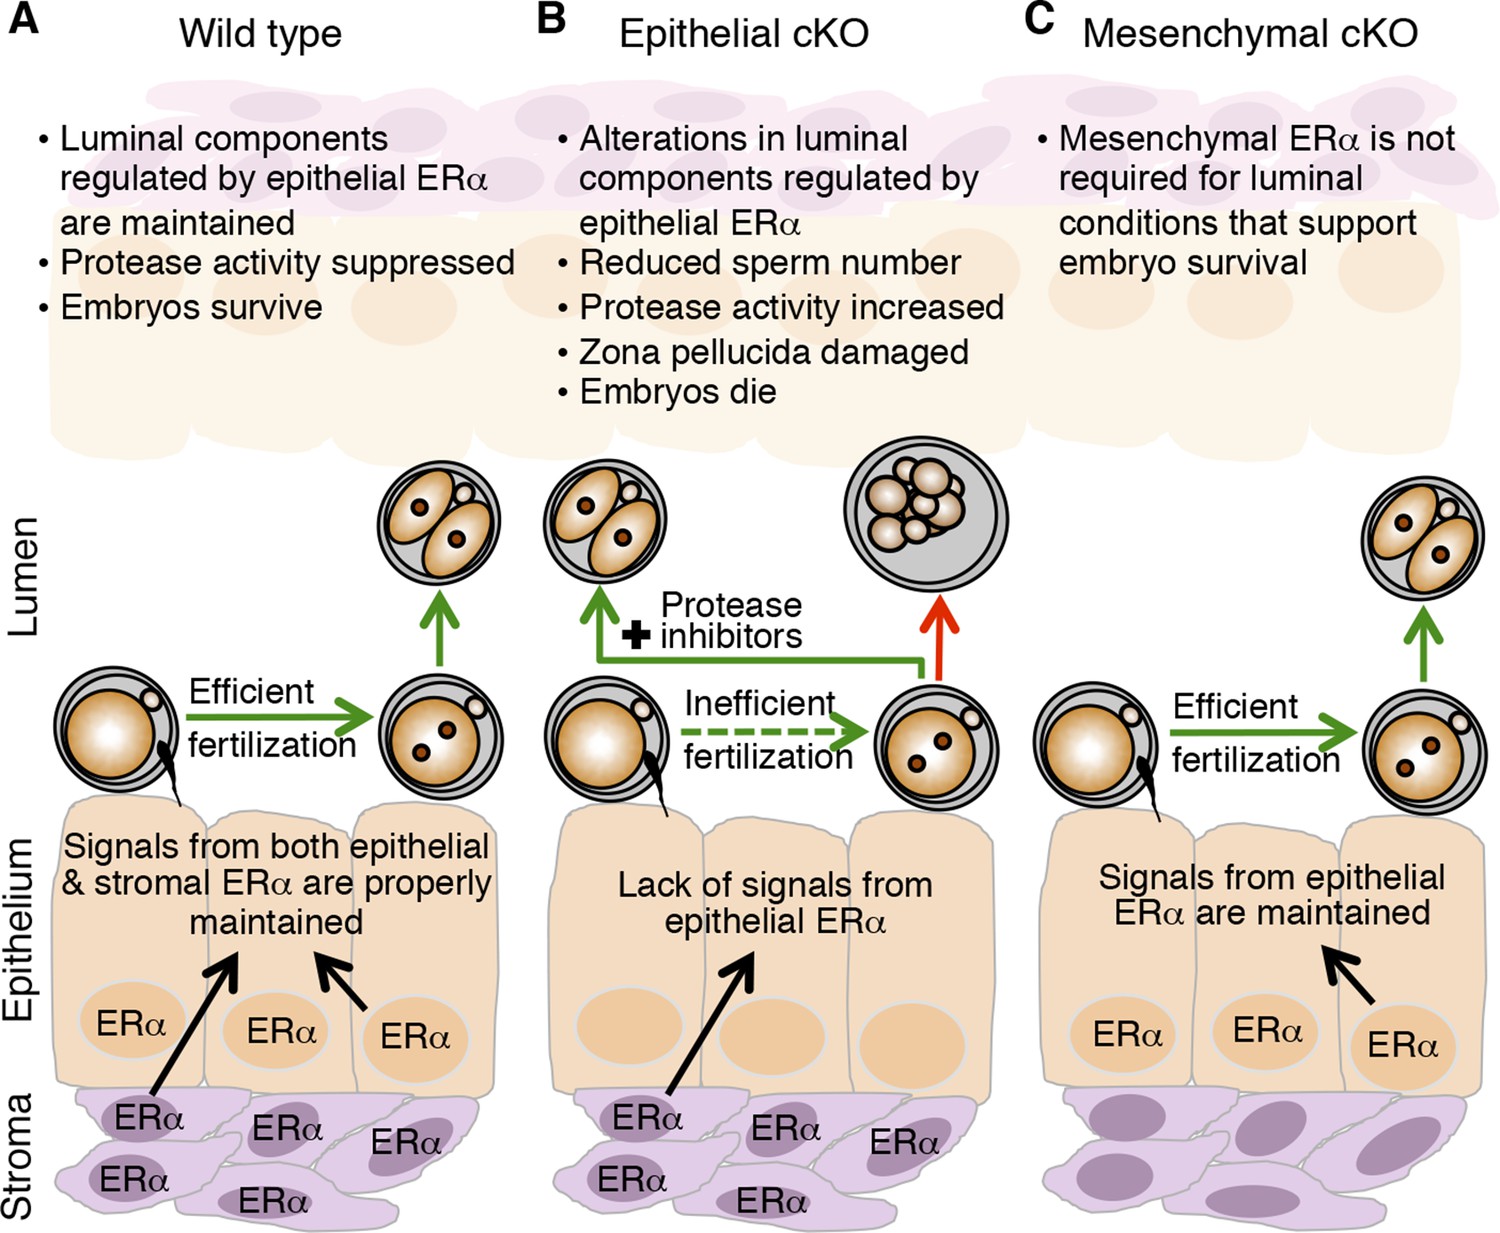
Schematic describing how estrogen receptor α (ERα) in oviduct epithelial cells supports fertilization and early embryo development.
(A) In wild-type mice, estrogen signals to ERα in both stromal and epithelial cells to suppress secretion of innate immune mediators and generate a luminal environment supportive of sperm migration, fertilization, and preimplantation embryo development. (B) In mice lacking ERα in oviduct epithelial cells, estrogen signaling to stromal cells alone cannot suppress secretion of oviduct immune mediators, resulting in increased protease activity. There is a failure of sperm migration, impaired fertilization, and lysis of successfully fertilized embryos. Embryos can be rescued by inserting protease inhibitors into the oviduct lumen. (C) In mice lacking ERα in oviduct stromal cells, the luminal environment fully supports fertilization and embryo development.
Videos
Video 1
Morphology of zygotes from WT oviducts during protease treatment in vitro.
Zygotes collected from WT oviducts at 24 hr following hCG administration and mating were cultured in PBS containing 0.2% α-chymotrypsin. Images were taken every 5 min for 60 min and are shown at 3 frames/s. hCG: Human chorionic gonadotropin; WT: Wild-type.
Video 2
Morphology of zygotes from cKO oviducts during protease treatment in vitro.
Zygotes collected from cKO oviducts at 24 hr following hCG administration and mating were cultured in PBS containing 0.2% α-chymotrypsin. Images were taken every 5 min for 60 min and are shown at 3 frames/s. cKO: Conditional knockout; hCG: Human chorionic gonadotropin.
Video 3
Protease treatment rapidly cleaves membrane-associated protein despite presence of ZP.
Movie shows green fluorescence signal after ZP-intact oocytes expressing a GPI-linked EGFP on the extracellular surface of the plasma membrane were treated with 0.04% α-chymotrypsin. Baseline imaging was performed for 5 min and then imaging was paused for 1 min to allow addition of α-chymotrypsin to the imaging drop. The movie file shows the last frame of baseline imaging, followed by subsequent images taken every 10 s, shown at 3 frames/s. This pattern of fluorescence loss is representative of 5 imaging experiments, each using 6–12 EGFP-GPI-expressing oocytes. (Note that treatment with 0.2% α-chymotrypsin caused complete loss of signal too rapidly to be visualized). ZP: Zona pellucida.
Tables
Table 1
Highly altered genes in cKO compared to WT oviducts at 0.5 dpc.
| Symbol | Entrez gene name | Fold change (cKO vs WT) | p-value |
|---|---|---|---|
| Drd4 | Dopamine receptor D4 | 38.357 | 3.40E-04 |
| Cdh16 | Cadherin 16, KSP-cadherin | 33.796 | 6.04E-08 |
| Clca1 | Chloride channel accessory 1 | 26.786 | 3.40E-03 |
| Lrrc39 | Leucine-rich repeat containing 39 | 24.885 | 1.97E-06 |
| Olfr632 | Olfactory receptor 632 | 23.183 | 1.45E-08 |
| Sct | Secretin | 21.079 | 4.74E-06 |
| Ost alpha | Organic solute transporter alpha | 20.670 | 1.87E-04 |
| Kif12 | Kinesin family member 12 | 19.814 | 1.37E-05 |
| Enthd1 | ENTH domain containing 1 | 18.375 | 2.03E-03 |
| Or8g2 | Olfactory receptor, family 8, subfamily G, member 2 | 17.596 | 5.42E-05 |
| Trp5 | Transient receptor potential cation channel, member 5 | 16.947 | 1.35E-05 |
| Olfr676 | Olfactory receptor 676 | 16.105 | 9.31E-04 |
| Or1s1 | Olfactory receptor, family 1, subfamily S, member 1 | 15.886 | 8.80E-08 |
| Cdh7 | Cadherin 7, type 2 | 15.772 | 6.51E-10 |
| Chrna6 | Cholinergic receptor, nicotinic, alpha 6 | 15.661 | 4.81E-04 |
| Col8a1 | Collagen, type VIII, alpha 1 | 14.885 | 9.07E-05 |
| Olfr470 | Olfactory receptor 470 | 14.542 | 2.39E-03 |
| Prrt3 | Proline-rich transmembrane protein 3 | 14.292 | 8.79E-03 |
| Pla2g5 | Phospholipase A2, group V | 14.256 | 1.84E-07 |
| Slc35f4 | Solute carrier family 35, member F4 | 14.091 | 2.83E-03 |
| Dhrs9 | Dehydrogenase/reductase (SDR family) member 9 | -13.530 | 6.61E-05 |
| Or1j4 | Olfactory receptor, family 1, subfamily J, member 4 | -13.621 | 8.64E-07 |
| Hiat1 | Hippocampus abundant transcript 1 | -13.909 | 9.65E-04 |
| Znf385b | Zinc finger protein 385B | -14.032 | 4.32E-07 |
| Cyp7a1 | Cytochrome P450, family 7, subfamily A, polypeptide 1 | -14.164 | 1.53E-06 |
| Olfr1316 | Olfactory receptor 1316 | -14.225 | 7.13E-07 |
| Cux1 | Cut-like homeobox 1 | -14.331 | 2.87E-04 |
| Expi | Extracellular proteinase inhibitor | -14.373 | 2.52E-06 |
| Sh2d4b | SH2 domain containing 4B | -15.412 | 1.33E-04 |
| Olfr1196 | Olfactory receptor 1196 | -15.449 | 2.26E-05 |
| Thsd7b | Thrombospondin, type I, domain containing 7B | -16.335 | 9.09E-05 |
| Slc7a14 | Solute carrier family 7 (orphan transporter), member 14 | -16.445 | 5.52E-05 |
| Olfr992 | Olfactory receptor 992 | -17.770 | 9.70E-06 |
| Olfr181 | Olfactory receptor 181 | -18.004 | 8.70E-06 |
| Upk1a | Uroplakin 1A | -18.525 | 2.05E-05 |
| Bpifc | BPI fold containing family C | -18.578 | 1.06E-05 |
| C1orf50 | Chromosome 1 open-reading frame 50 | -22.333 | 3.35E-05 |
| Tshr | Thyroid stimulating hormone receptor | -36.758 | 4.18E-06 |
| Dcpp | Demilune cell and parotid protein | -129.642 | 2.22E-03 |
| C6orf15 | Chromosome 6 open-reading frame 15 | -148.254 | 7.15E-05 |
-
cKO: Conditional knockout; dpc: Days post coitum; WT: Wild-type.
Table 2
Highly altered genes in cKO compared to WT oviducts at 1.5 dpc.
| Symbol | Entrez gene name | Fold change (cKO vs WT) | p-value |
|---|---|---|---|
| Clca1 | Chloride channel accessory 1 | 34.263 | 2.60E-04 |
| Pcdh8 | Protocadherin 8 | 27.010 | 1.34E-05 |
| Sct | Secretin | 13.070 | 6.05E-06 |
| Myom2 | Myomesin (M-protein) 2, 165kDa | 12.163 | 1.16E-05 |
| Klk8 | Kallikrein-related peptidase 8 | 8.736 | 8.45E-04 |
| Crp | C-reactive protein, pentraxin-related | 7.904 | 4.30E-04 |
| C2orf51 | Chromosome 2 open-reading frame 51 | 6.905 | 3.72E-04 |
| Muc4 | Mucin 4, cell surface associated | 5.932 | 1.02E-04 |
| Cntf | Ciliary neurotrophic factor | 5.643 | 1.02E-05 |
| Csn1s1 | Casein alpha s1 | 5.374 | 2.03E-04 |
| Dbh | Dopamine β-hydroxylase | 5.248 | 6.50E-07 |
| Hs6st3 | Heparan sulfate 6-O-sulfotransferase 3 | 5.086 | 3.19E-05 |
| G6pc2 | Glucose-6-phosphatase, catalytic, 2 | 4.370 | 6.53E-04 |
| Nr0b1 | Nuclear receptor subfamily 0, group B, member 1 | 4.231 | 2.95E-05 |
| Krt15 | Keratin 15 | 4.115 | 2.60E-04 |
| Kcnd2 | Potassium voltage-gated channel, member 2 | 4.053 | 2.78E-04 |
| Il18r1 | Interleukin 18 receptor 1 | 4.001 | 2.54E-05 |
| Cxcl17 | Chemokine (C-X-C motif) ligand 17 | 3.954 | 2.79E-07 |
| Nrgn | Neurogranin (protein kinase C substrate, RC3) | 3.881 | 2.85E-04 |
| Trvp6 | Transient receptor potential cation channel member 6 | 3.808 | 2.64E-05 |
| Cntnap2 | Contactin-associated protein-like 2 | -4.471 | 1.41E-04 |
| Gpr64 | G-protein-coupled receptor 64 | -4.527 | 2.05E-06 |
| Ly6a | Lymphocyte antigen 6 complex, locus A | -4.585 | 4.28E-04 |
| Unc5cl | Unc-5 homolog C (C. elegans)-like | -4.637 | 6.55E-04 |
| Sbp | Spermine-binding protein | -4.681 | 6.20E-05 |
| Hpgds | Hematopoietic prostaglandin D synthase | -4.790 | 2.61E-05 |
| Galntl5 | UDP-N-acetyl-α-d-galactosamine:polypeptide N-acetylgalactosaminyltransferase-like 5 | -4.804 | 7.22E-04 |
| Gabra5 | Gamma-aminobutyric acid (GABA) A receptor, alpha 5 | -5.309 | 9.81E-05 |
| Sftpd | Surfactant protein D | -5.410 | 1.14E-04 |
| Uox | Urate oxidase, pseudogene | -5.411 | 2.05E-04 |
| Ctse | Cathepsin E | -6.761 | 8.95E-04 |
| Calml3 | Calmodulin-like 3 | -7.842 | 9.63E-07 |
| Sectm1 | Secreted and transmembrane 1 | -8.130 | 3.06E-05 |
| Reg1a | Regenerating islet-derived 1 alpha | -8.255 | 5.03E-05 |
| Upk1a | Uroplakin 1A | -8.839 | 6.84E-05 |
| Rtn1 | Reticulon 1 | -9.943 | 8.23E-06 |
| Mlc1 | Megalencephalic leukoencephalopathy with subcortical cysts 1 | -11.758 | 3.67E-06 |
| Expi | Extracellular proteinase inhibitor | -13.692 | 1.96E-06 |
| Atp6v1c2 | ATPase, H transporting, V1 subunit C2 | -14.225 | 4.67E-06 |
| C6orf15 | Chromosome 6 open reading frame 15 | -253.722 | 3.51E-07 |
-
cKO: Conditional knockout; dpc: Days post coitum; WT: Wild-type.
Table 3
Selected Ingenuity top biological function categories at 0.5 dpc.
| Category | p-value | # Molecules |
|---|---|---|
| Tissue development | ||
| Tissue development | 3.12E-10 | 362 |
| Cell–cell adhesion | 3.33E-04 | 22 |
| Accumulation of monocytes | 8.34E-04 | 5 |
| Angiogenesis of organ | 1.16E-03 | 15 |
| Accumulation of phagocytes | 1.26E-03 | 22 |
| Development of endothelial tissue | 3.61E-03 | 38 |
| Accumulation of eosinophils | 5.73E-03 | 8 |
| Lipid metabolism | ||
| Synthesis of lipid | 4.66E-08 | 117 |
| Steroid metabolism | 3.13E-06 | 48 |
| Metabolism of cholesterol | 1.42E-04 | 21 |
| Metabolism of prostaglandin | 1.24E-03 | 27 |
| Synthesis of eicosanoid | 2.02E-03 | 32 |
| Synthesis of prostaglandin D2 | 3.75E-03 | 9 |
| Inflammatory response | ||
| Inflammation | 3.52E-04 | 69 |
| Accumulation of monocytes | 8.34E-04 | 5 |
| Accumulation of phagocytes | 1.26E-03 | 22 |
| Accumulation of eosinophils | 5.73E-03 | 8 |
| Accumulation of antigen-presenting cells | 8.80E-03 | 13 |
| Cellular growth and proliferation | ||
| Proliferation of endothelial cells | 3.59E-03 | 32 |
| Proliferation of endocrine cells | 4.48E-03 | 14 |
| Proliferation of chondrocytes | 5.56E-03 | 12 |
| Proliferation of epidermal cells | 7.78E-03 | 20 |
| Proliferation of B-lymphocyte-derived cell lines | 8.20E-03 | 19 |
| Proliferation of Th2 cells | 8.70E-03 | 5 |
-
dpc: Days post coitum.
Table 4
Selected Ingenuity top biological function categories at 1.5 dpc.
| Category | p-value | # Molecules |
|---|---|---|
| Tissue development | ||
| Tissue development | 3.06E-03 | 44 |
| Development of organ | 1.05E-02 | 30 |
| Aggregation of cells | 1.46E-02 | 8 |
| Organization of tissue | 1.48E-02 | 6 |
| Inflammatory response | ||
| Immune response of neutrophils | 4.91E-03 | 4 |
| Chemotaxis of antigen-presenting cells | 6.37E-03 | 5 |
| Immune response of phagocytes | 1.56E-02 | 5 |
| Cellular movement | ||
| Mobilization of cells | 6.75E-03 | 4 |
| Mobilization of neutrophils | 8.24E-03 | 2 |
| Small molecule biochemistry | ||
| Production of eicosanoid | 3.51E-03 | 7 |
| Synthesis of prostaglandin E2 | 6.13E-03 | 5 |
| Synthesis of lipid | 1.13E-02 | 15 |
-
dpc: Days post coitum.
Table 5
Protease, protease inhibitor, and antimicrobial peptide transcripts in cKO compared to WT oviducts at 0.5 dpc.
| Symbol | Entrez gene name | Fold change (cKO vs WT) | p-value |
|---|---|---|---|
| Proteases | |||
| Tmprss15 | Transmembrane protease, serine 15 | 16.41 | 2.33E-09 |
| Klk8 | Kallikrein related-peptidase 8 | 10.34 | 9.85E-04 |
| Prss42 | Protease, serine, 42 | 9.63 | 7.67E-03 |
| Prss7 | Protease, serine, 7 (enterokinase) | 8.54 | 2.34E-02 |
| Klk9 | Kallikrein related-peptidase 9 | 5.62 | 7.06E-06 |
| Prss33 | Protease, serine, 33 | 5.35 | 5.07E-04 |
| Prss51 | Protease, serine, 51 | 2.96 | 1.65E-02 |
| Prss41 | Protease, serine, 41 | 2.69 | 1.36E-04 |
| Klk7 | Kallikrein related-peptidase 7 | 2.63 | 2.55E-05 |
| Prss32 | Protease, serine, 32 | 2.45 | 3.10E-02 |
| Tmprss13 | Transmembrane protease, serine 13 | 2.14 | 6.83E-03 |
| Cma1 | Chymase 1, mast cell | 2.05 | 2.53E-02 |
| Prss35 | Protease, serine, 35 | 1.90 | 3.10E-02 |
| Prss34 | Protease, serine, 34 | 1.89 | 1.92E-02 |
| Mcpt4 | Mast cell protease 4 | 1.82 | 3.45E-02 |
| Prss23 | Protease, serine, 23 | 1.66 | 3.54E-02 |
| Tmprss6 | Transmembrane protease, serine 6 | 1.52 | 4.69E-04 |
| Ctsd | Cathepsin D | 1.51 | 4.89E-02 |
| Prss3 | Protease, serine, 3 | -1.81 | 3.10E-02 |
| Klk1b3 | Kallikrein 1-related peptidase b3 | -2.08 | 2.86E-02 |
| Klk1b8 | Kallikrein 1-related peptidase b8 | -2.31 | 2.44E-03 |
| Prss58 | Protease, serine, 58 | -2.46 | 1.27E-02 |
| Klk1b26 | Kallikrein 1-related peptidase b26 | -4.01 | 4.57E-02 |
| Klk1b11 | Kallikrein 1-related peptidase b11 | -4.04 | 1.25E-02 |
| Klk1 | Kallikrein 1 | -4.08 | 1.11E-03 |
| Prss29 | Protease, serine, 29 | -4.20 | 3.96E-02 |
| Klk12 | Kallikrein related-peptidase 12 | -4.68 | 2.05E-03 |
| Klk1b24 | Kallikrein 1-related peptidase b24 | -6.13 | 3.12E-03 |
| Klk1b21 | Kallikrein 1-related peptidase b21 | -8.85 | 4.72E-03 |
| Klk1b27 | Kallikrein 1-related peptidase b27 | -9.65 | 2.72E-03 |
| Prss28 | Protease, serine, 28 | -28.09 | 2.34E-02 |
| Protease inhibitors | |||
| Serpini2 | Serine (or cysteine) peptidase inhibitor, clade I (pancpin), member 2 | 6.99 | 3.89E-02 |
| Serpinb7 | Serine (or cysteine) peptidase inhibitor, clade B (Ovalbumin), member 7 | 6.28 | 2.63E-02 |
| Serpinb9f | Serine (or cysteine) peptidase inhibitor, clade B, member 9f | 5.97 | 3.82E-02 |
| Serpinb12 | Serine (or cysteine) peptidase inhibitor, clade B, member 12 | 2.05 | 1.12E-02 |
| Serpine2 | Serine (or cysteine) peptidase inhibitor, clade E, member 2 | 1.79 | 4.87E-02 |
| Cstb | Cystatin B (stefin B) | -1.76 | 2.25E-04 |
| Serpinb11 | Serine (or cysteine) peptidase inhibitor, clade B (ovalbumin), member 11 | -2.10 | 2.99E-03 |
| Fetub | Fetuin beta | -2.25 | 1.14E-02 |
| Csta | Cystatin A (stafin A) | -2.65 | 3.80E-03 |
| Serpine1 | Serine (or cysteine) peptidase inhibitor, clade E, member 1 | -2.69 | 4.02E-02 |
| Serpina3b | Serine (or cysteine) peptidase inhibitor, clade A, member 3B | -3.30 | 2.49E-02 |
| Serpina1b | Serine (or cysteine) peptidase inhibitor, clade A, member 1B | -3.49 | 5.80E-03 |
| Serpina1e | Serine (or cysteine) peptidase inhibitor, clade A, member 1E | -4.04 | 4.02E-02 |
| Serpina9 | Serine (or cysteine) peptidase inhibitor, clade A (alpha-1 antiproteinase, antitrypsin), member 9 | -4.22 | 2.52E-03 |
| Wfdc18 (or Expi) | WAP four-disulfide core domain 18 (or extracellular proteinase inhibitor) | -13.69 | 1.96E-06 |
| Antimicrobial peptides | |||
| Defb8 | Defensin, beta 8 | 13.12 | 2.78E-02 |
| Defa38 | Defensin, alpha 38 | 3.48 | 2.42E-02 |
| Defa3 | Defensin, alpha 3 | 2.21 | 3.35E-05 |
| Defb116 | Defensin, beta 116 | -2.50 | 1.03E-02 |
| Defb103b | Defensin, beta 103B | -3.24 | 1.06E-03 |
| Defa4 | Defensin, alpha 4 | -5.70 | 3.46E-02 |
| Defb34 | Defensin, beta 34 | -10.02 | 6.15E-05 |
-
cKO: Conditional knockout; dpc: Days post coitum; WT: Wild-type.
Table 6
List of the primer sequences used for real-time RT-PCR reactions.
| Symbol | Entrez gene name | Sequences (Forward ([F]) and Reverse [(R]):5’ → 3’ |
|---|---|---|
| Cdh16 | Cadherin 16 | F: GCATTGCCCAGGTGCACTGGA R: AAGGGTCCTGGAGGCTGGCT |
| Ctsd | Cathepsin D | F: GACAACAATAGGGTCGGCTT R: GCTGGCTTCCTCTACTGGAC |
| Cxcl17 | Chemokine (C-X-C motif) ligand 17 | F: AAGCCACGGGGACCAACACC R: GGCTTGCAGGAACCAATCTTTGC |
| Drd4 | Dopamine receptor 4 | F: TGGACGTCATGCTGTGCACCG R: GGTCACGGCCACGAACCTGTC |
| Fetub | Fetuin B | F: ACGTCTAGCCTTCTGCGATT R: TCCACTGTAAGCCACTCTGC |
| Hpgds | Hemopoietic prostaglandin D synthase | F: GGACTTACAATCCACCAGAGC R: TCCCAGCCAAATCTGTGTTTT |
| Il17 | Interleukin 17 | F: CTGGAGGATAACACTGTGAGAGT R: TGCTGAATGGCGACGGAGTTC |
| Il17rb | Interleukin 17 receptor B | F: TCAGCGCCCATAACATCCCCA R: ACGTGGTTTAGGCAGCCTGGC |
| Klk8 | Kallikrein related-peptidase 8 | F: GTTCCACCCTCTTCCTCAGA R: CTCCCATGAACAGAAGCAGA |
| Krt8 | Keratin 8 | F: TGAAGAAGGATGTGGACTGTGCCT R: ATGCGGGTCTCCTCGTCATACATT |
| Muc4 | Mucin 4 | F: ACCATGTCTTGGGGAACGTC R: ATGCAGGTGAGGTATTCCTGA |
| Rpl7 | Ribosomal protein L7 | F: AGCTGGCCTTTGTCATCAGAA R: GACGAAGGAGCTGCAGAACCT |
| Rtn1 | Reticulon 1 | F: AACGTCGTCGCGGGAACTGT R: AGCTGCCATACCTGTGGATGCAGT |
| Sct | Secretin | F: CCCACGCCGATGCTACTGCT R: TCTTGGGGTCCTGGGAGGTGC |
| Serpina1b | Serine (or cysteine) peptidase inhibitor, clade A, member 1B | F: ATCACCCGGATCTTCAACAA R: CTCATCGATGGTCAGCACAG |
| Serpina9 | Serine (or cysteine) peptidase inhibitor, clade A, member 9 | F: CAGGTGAGACTCCCTTCCTT R: GTGGGAGGACTCTTGGTTGT |
| Serpinb11 | Serine (or cysteine) peptidase inhibitor, clade B, member 11 | F: TCTTCTGAGTGCAGCCAAGT R: AACGCTGAGGGAGTTCTGTT |
| Serpine1 | Serine (or cysteine) peptidase inhibitor, clade E, member 11 | F: ACCGGAATGTGGTCTTCTCT R: TGCCCTTCTCATTGACTTTG |
| Tmprss13 | Transmembrane protease, serine 13 | F: ATAGGTCGCAATGTCCTTCC R:TCTCAAACCACAGTGGGAAC |
| Tshr | Thyroid stimulating hormone receptor | F: CCTGACAGCTATAGACAACGATGCC R: ACGCTGGTGGAAGACACATCTAGCA |
| Wfdc18 (or Expi) | WAP four-disulfide core domain 18 (or extracellular proteinase inhibitor) | F: TTTGTTCTGGTAGCTTTGATTTTCA R: GCGCCAGGTTTTTCTTTGG |
Download links
A two-part list of links to download the article, or parts of the article, in various formats.
Downloads (link to download the article as PDF)
Open citations (links to open the citations from this article in various online reference manager services)
Cite this article (links to download the citations from this article in formats compatible with various reference manager tools)
Oviductal estrogen receptor α signaling prevents protease-mediated embryo death
eLife 4:e10453.
https://doi.org/10.7554/eLife.10453


