Temporal transcriptomics suggest that twin-peaking genes reset the clock
- University of Oxford, United Kingdom
Figures
Figure 1 with 2 supplements
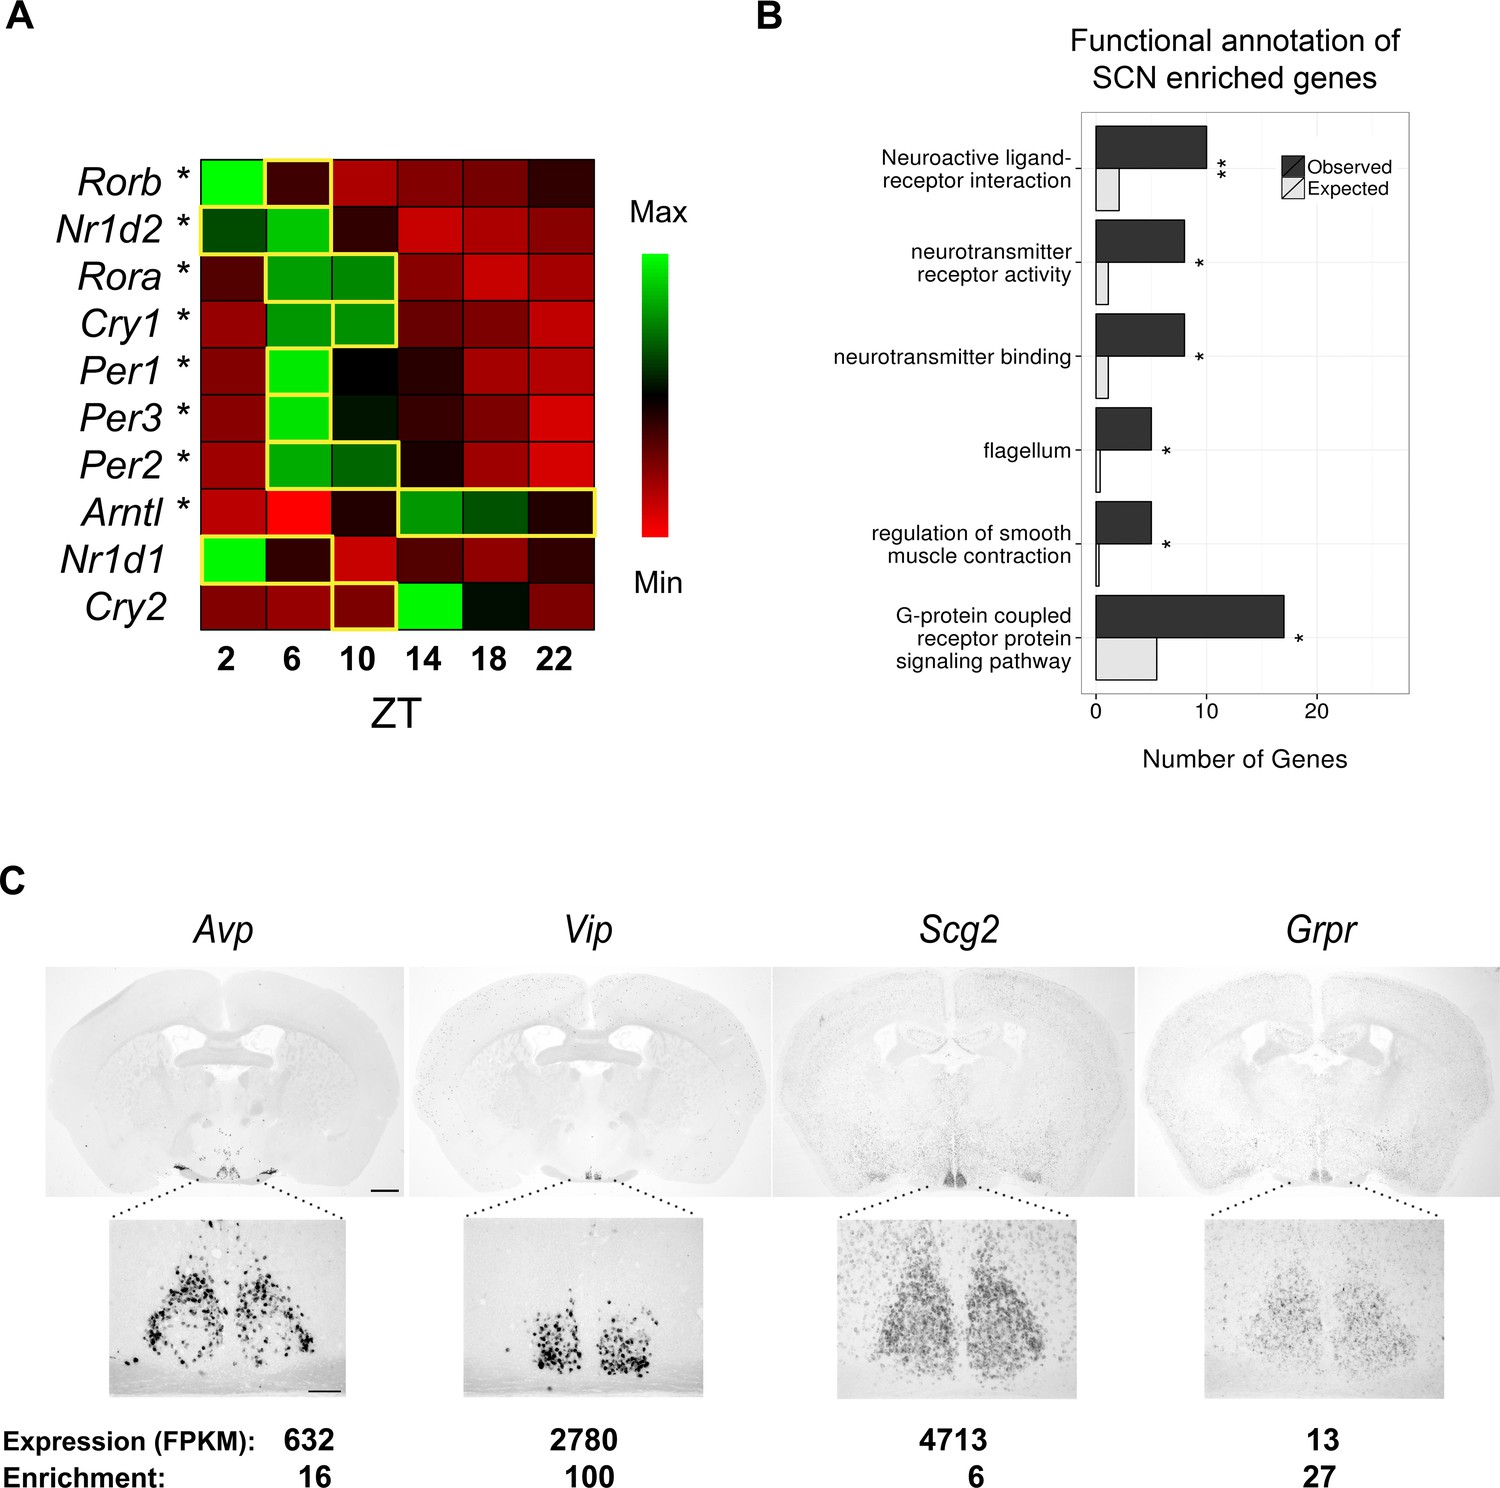
RNA-seq data of laser-capture microdissection (LCM) suprachiasmatic nucleus (SCN) samples recapitulate the cycling of clock gene expression and identify known and novel SCN enriched genes.
(A) Heatmap showing mean expression of key clock genes in the SCN across circadian time. The majority (8/10) show significant cycling (DESeq2 and JTK Cycle; *q < 0.05) and peak at the expected timepoint denoted by a yellow box (Ko and Takahashi, 2006). (B) Statistically significant Gene Ontology (GO) enrichments for SCN enriched genes (q < 0.05). Bars represent the number of genes of a given category expected by chance among SCN enriched genes (grey) versus those observed (black). q-values: *q < 0.05, **q < 0.01, ***q < 0.001. (C) In situ hybridisation (ISH) of four SCN enriched genes at ZT6 in the wild-type brain. Scale bar: 0.5 mm (low magnification); 0.2 mm (high magnification).
Figure 1—figure supplement 1
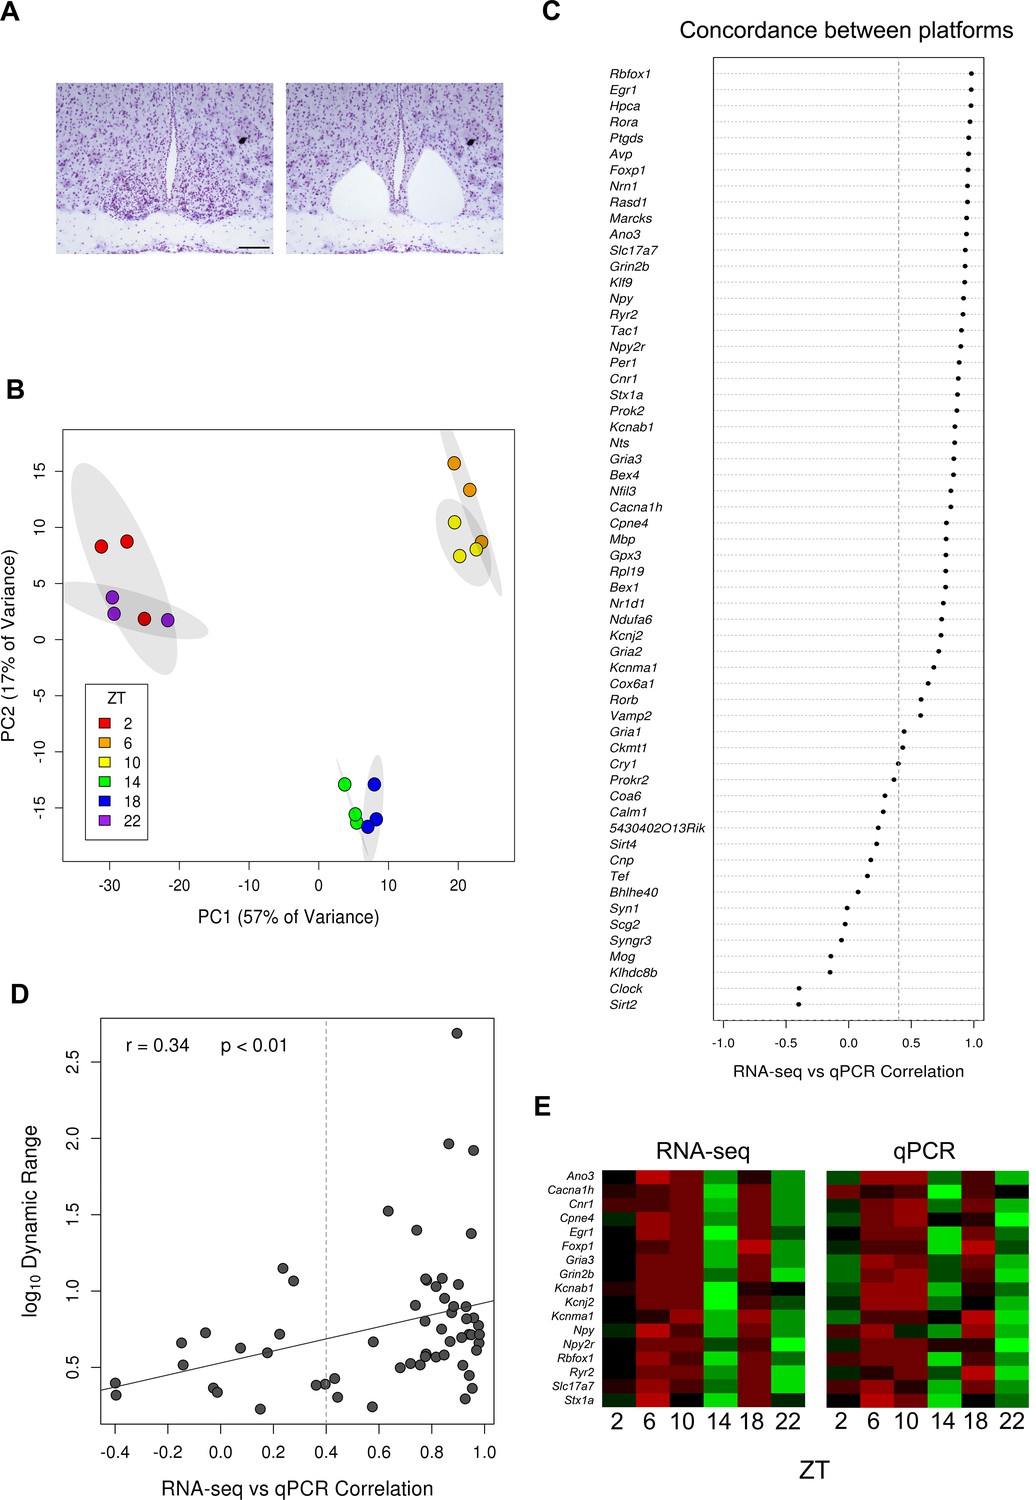
Generation of the SCN transcriptome over 24 hr.
(A) Representative Nissl-stained brain sections before and after laser-capture microdissection (LCM) of the SCN. Scale bar: 0.5 mm. (B) Principal component analysis (PCA) plot showing separation of RNA-seq data according to timepoint and sequencing batch. Ellipses delineate the 95% confidence intervals for each timepoint. (C) Dot plot showing the Pearson’s correlation between RNA-seq and quantitative polymerase chain reaction (qPCR) values for all the annotated genes surveyed (excluding those housekeeping genes used to normalise the data); 43/59 genes show a high concordance between methods (r >0.4). (D) Scatter plot showing a trend for increased correlation of cycling gene expression measured in the two different platforms for increased dynamic range. Gene expression values with larger dynamic ranges tend to be less susceptible to extrinsic factors such as random noise and batch effects which therefore contribute less. (E) Heatmap showing the mean expression levels for 17 twin-peaking genes across circadian time according to (i) RNA-seq or (ii) qPCR from LCM SCN samples.
Figure 1—figure supplement 2
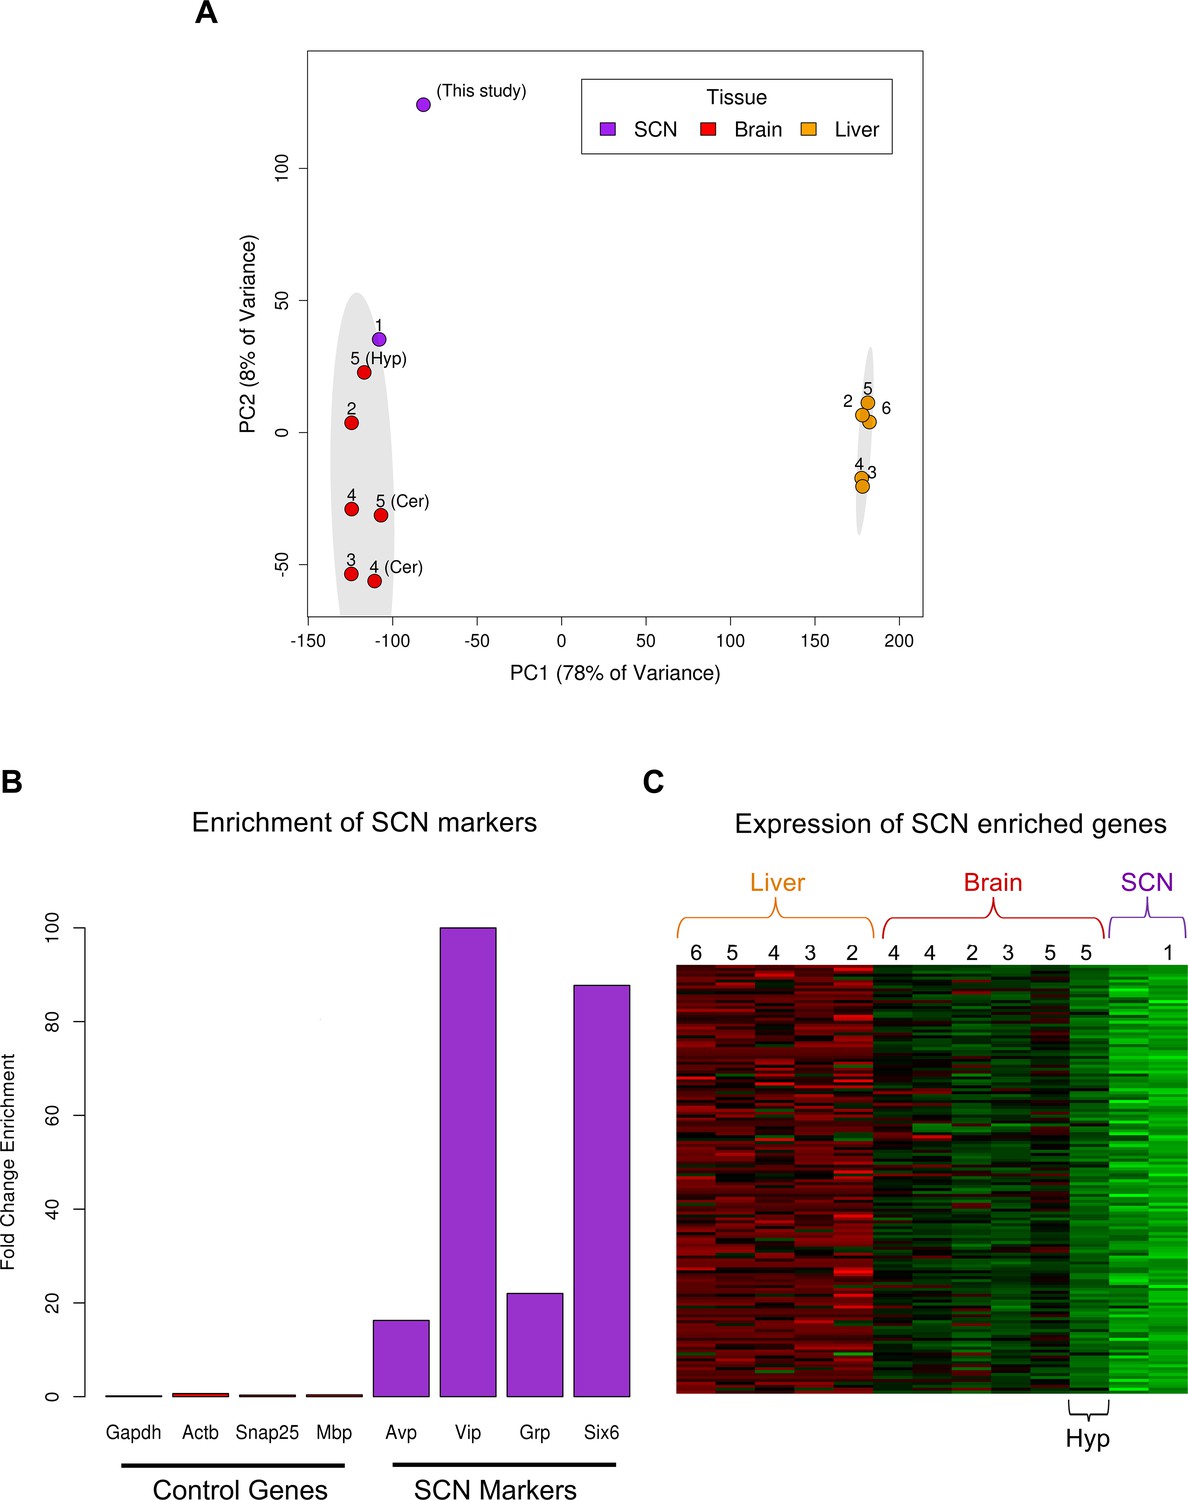
Use of publically available RNA-seq data to identify SCN enriched genes.
(A) PCA plot showing successful separation of RNA-seq data according to tissue but, importantly, not according to study. Adjacent numbers indicate the study from which data were collected (1, Azzi et al. (2014); 2, Barbosa-Morais et al. (2012); 3, Merkin et al. (2012); 4, Brawand et al. (2011); 5, Zhang et al., (2014b); 6, Menet et al. (2012)). Ellipses delineate the 95% confidence intervals for each tissue. The first principal component (PC1) explains nearly 80% of the expression variance in samples and displays a large separation between liver and brain tissues signifying substantial transcriptomic differences between these disparate tissues. The second principal component (PC2; approximately 10%) in part explains variation among different regions of the brain. Samples from the same tissue (e.g. cerebellum) cluster together more closely than tissue samples from the same study (labelled by number) but different brain region. This indicates that RNA-seq batch effects are small relative to biological variation. Of the non-SCN brain tissues samples, the published ‘hypothalamus’ RNA-seq dataset (Zhang et al., 2014b) shows the greatest similarity to the SCN samples. (B) Fold-change (FC) enrichment of SCN marker (purple) and control gene (red) expression in the LCM SCN samples relative to mean brain fragments per kilobase of exon per million (FPKM) levels from other transcriptomic studies in (A). These SCN markers display large FC enrichment compared to general markers of neurons (e.g. Snap25), oligodendrocytes (e.g. Mbp) and housekeeping genes (e.g. ActB, Gapdh). (C) Heatmap showing mean expression levels of the 146 SCN enriched genes across all other transcriptomic studies in (A). Numbers indicate study from which data were collected as in (A). These genes show the highest expression in the SCN followed by the hypothalamus, as expected, given the location of the SCN within the hypothalamus.
Figure 2 with 1 supplement
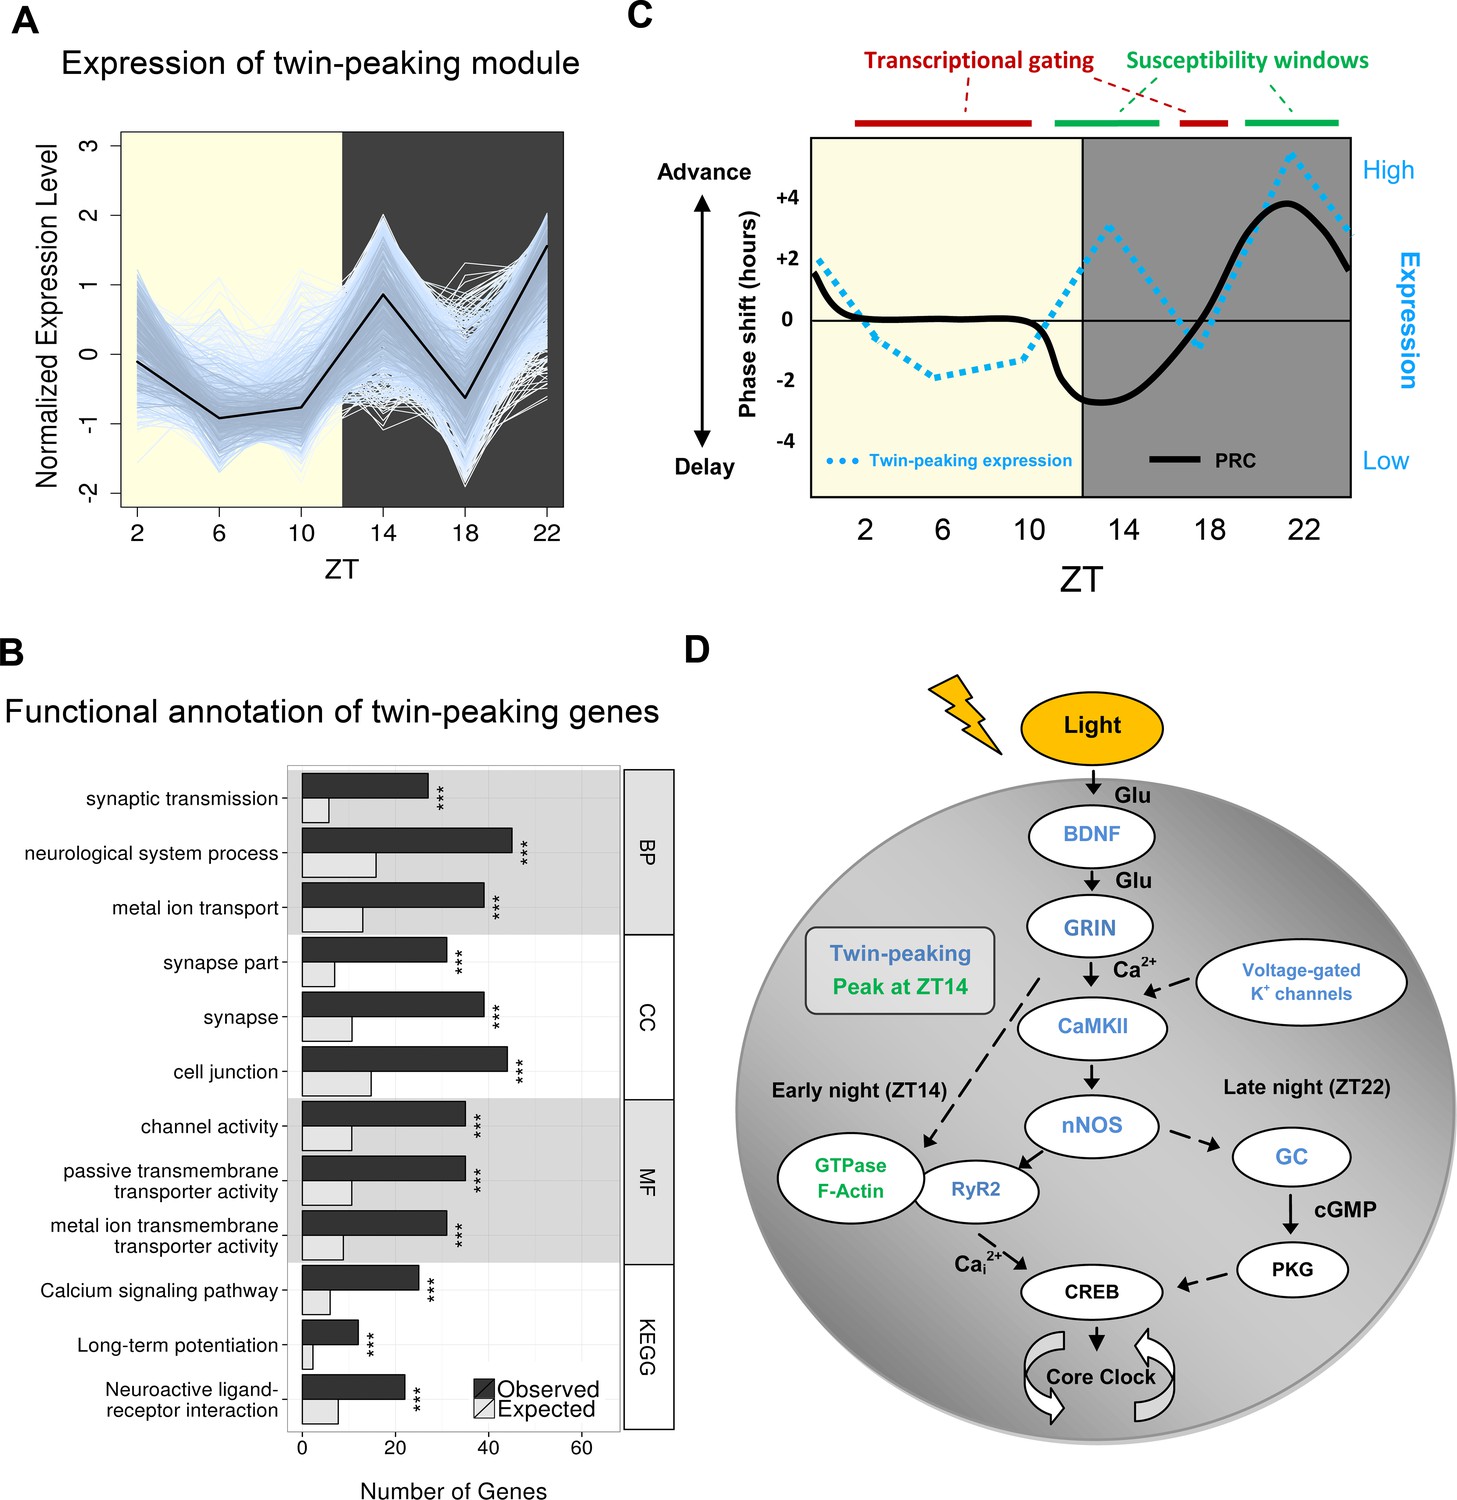
Gene clustering identifies a novel twin-peaking synaptic gene module with a potential role in phase resetting.
(A) Relative expression of each gene present in the identified twin-peaking module over 24 hr. The black line represents the module eigengene – the first principal component of the gene expression matrix for this module. (B) Top three statistically significant (q < 0.05) Gene Ontology (GO) (biological process (BP), cellular component (CC), molecular function (MF)) and Kyoto Encyclopedia of Genes and Genomes (KEGG) enriched terms for the 496 significantly fluctuating twin-peaking genes. q-values: *q < 0.05, **q < 0.01, ***q < 0.001. (C) Illustration of the theoretical phase response curve (PRC) in mouse, which demonstrates the phase shifting potential when a light pulse is applied at different times (black line) (Golombek and Rosenstein, 2010). Our module eigengene for the twin-peaking module (blue dotted line) indicates that when its expression lies above the threshold level (black horizontal line), the phase of the organism is able to shift. The greater the expression over this threshold, the larger the phase shift. Conversely, when expression is low and below this threshold, the suprachiasmatic nucleus (SCN) is resistant to phase shifting induced by light pulses. This suggests the presence of susceptibility windows (shown by green bars) when light impulses are able to shift the phase of the SCN. (D) Circadian gating of light signalling pathway, adapted from (Iyer et al., 2014). Twin-peaking gene-encoded proteins identified by laser-capture microdissection (LCM) SCN RNA-seq are indicated in blue. Photic information is transmitted to the SCN via glutamatergic signalling through the retinohypothalamic tract (RHT). (i) Brain-derived neurotrophic factor (BDNF) gates glutamatergic synaptic transmission by regulating either presynaptic release or membrane channel activity. (ii) Voltage-gated potassium channels hyperpolarise the SCN neurons allowing photic input from the RHT to elicit a significant response. (iii) Glutamate binding to glutamate receptor, ionotropic, N-methyl D-aspartate (GRIN) receptors induces calcium influx inducing CaMKII autophosphorylation. (iv) Active pCaMKII phophorylates neuronal nitric oxide synthase (nNOS), which generates nitric oxide (NO), producing differential effects according to time of day. (v) In early night (ZT14), we observe peaking of genes relating to small guanosine triphosphate (GTPase) activation and actin-based cytoskeletal remodelling. At this timepoint, F-actin levels are at their highest and an influx of Ca2+ depolymerises the F-actin affecting components of the mitogen-activated protein (MAP) kinase pathway. Ca2+ also induces intracellular Ca2+ release though the opening of the endoplasmic reticulum calcium channel RyR2. (vi) In late night (ZT22), NO activates guanylyl-cyclase (GC), which increases cyclic guanosine monophosphate (cGMP) levels activating protein kinase G (PKG). (vii) Phosphorylation of cAMP response element-binding protein (CREB) leads to the transcription of PER1, which contributes to the shifting of the circadian phase.
Figure 2—figure supplement 1
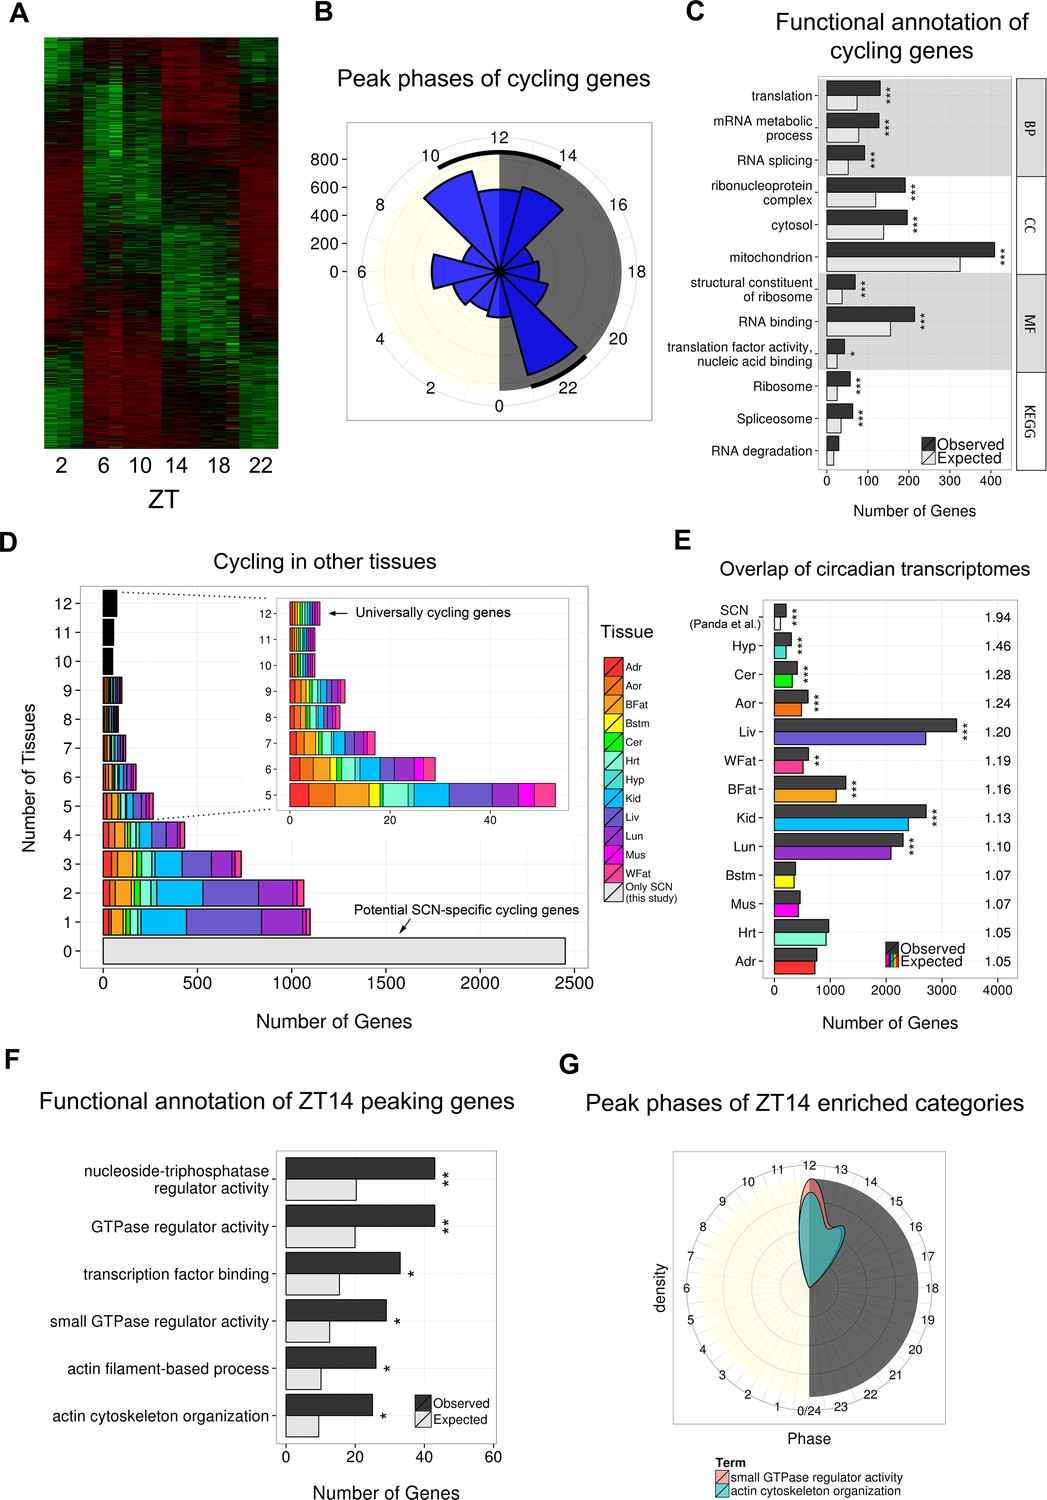
Identification of 4569 cycling genes in the SCN.
(A) Heatmap showing the expression levels in each biological replicate for the 4569 significantly cycling genes in the SCN across circadian time ordered by peak phase (DESeq2 and JTK Cycle, q < 0.05). (B) Polar plot showing the distribution of peak phases for the identified 4569 cycling genes binned in 2-hr windows. Cycling genes tend to peak during transcriptional ‘rush hours’ near to light transitions (shown by black lines), as previously described (Zhang et al., 2014b). (C) Top three statistically significant GO ( BP, CC, MF) and KEGG enrichments for the 4569 cycling genes. q-values: *q < 0.05, **q < 0.01, ***q < 0.001. (D) Number of other tissues in which the 4569 cycling genes also cycle. Colours indicate the distribution of these cycling genes across the different tissues. (E) Number of the 4569 cycling genes that are also significantly cycling in other tissues from other studies (Zhang et al., 2014b) ordered by fold-change (FC) enrichment (right). Tissues which show significantly greater LCM SCN cycling genes are denoted with an asterisk (*q < 0.05, **q < 0.01, ***q < 0.001); as expected, the greatest enrichment in overlap was with the SCN results from the microarray study by Panda et al. (2002). (F) Statistically significant GO and KEGG enrichments for the 1034 cycling genes peaking at ZT14. q-values: *q < 0.05, **q < 0.01, ***q < 0.001. (G) Distribution of peak phases for significantly cycling genes with GO annotations ‘actin cytoskeleton organisation’ (n = 25) and ‘small GTPase regulator activity’ (n = 29).
Figure 3 with 1 supplement

Identification of multiexonic lincRNAs whose expression fluctuates in the suprachiasmatic nucleus (SCN).
(A) Proportion of the 3187 identified lincRNAs which (i) have been previously annotated (according to Ensembl or UCSC), (ii) are not annotated in these resources but have been identified in other studies (Belgard et al., 2011, Ramos et al., 2013) or (iii) are unique to this study. (B) Proportion of the 3187 identified lincRNAs which show significant fluctuating expression patterns (twin-peaking module and DESeq2 q < 0.05, or JTK cycle q < 0.05 and DESeq2 q < 0.05); protein-coding genes are shown for comparison. (C) Heatmap showing the expression levels in each biological replicate for the 341 fluctuating lincRNAs. (D) In situ hybridisation (ISH) of NONCO7761 (3100003L05Rik) at ZT6 in the mouse brain showing low yet distinct expression in the SCN. Scale bar: 0.5 mm (low magnification), 0.2 mm (high magnification). (E) RNA-seq and quantitative polymerase chain reaction (qPCR) show fluctuating mean expression ± SD of the lincRNA NONCO7761 (3100003L05Rik) over 24 hr.
Figure 3—figure supplement 1
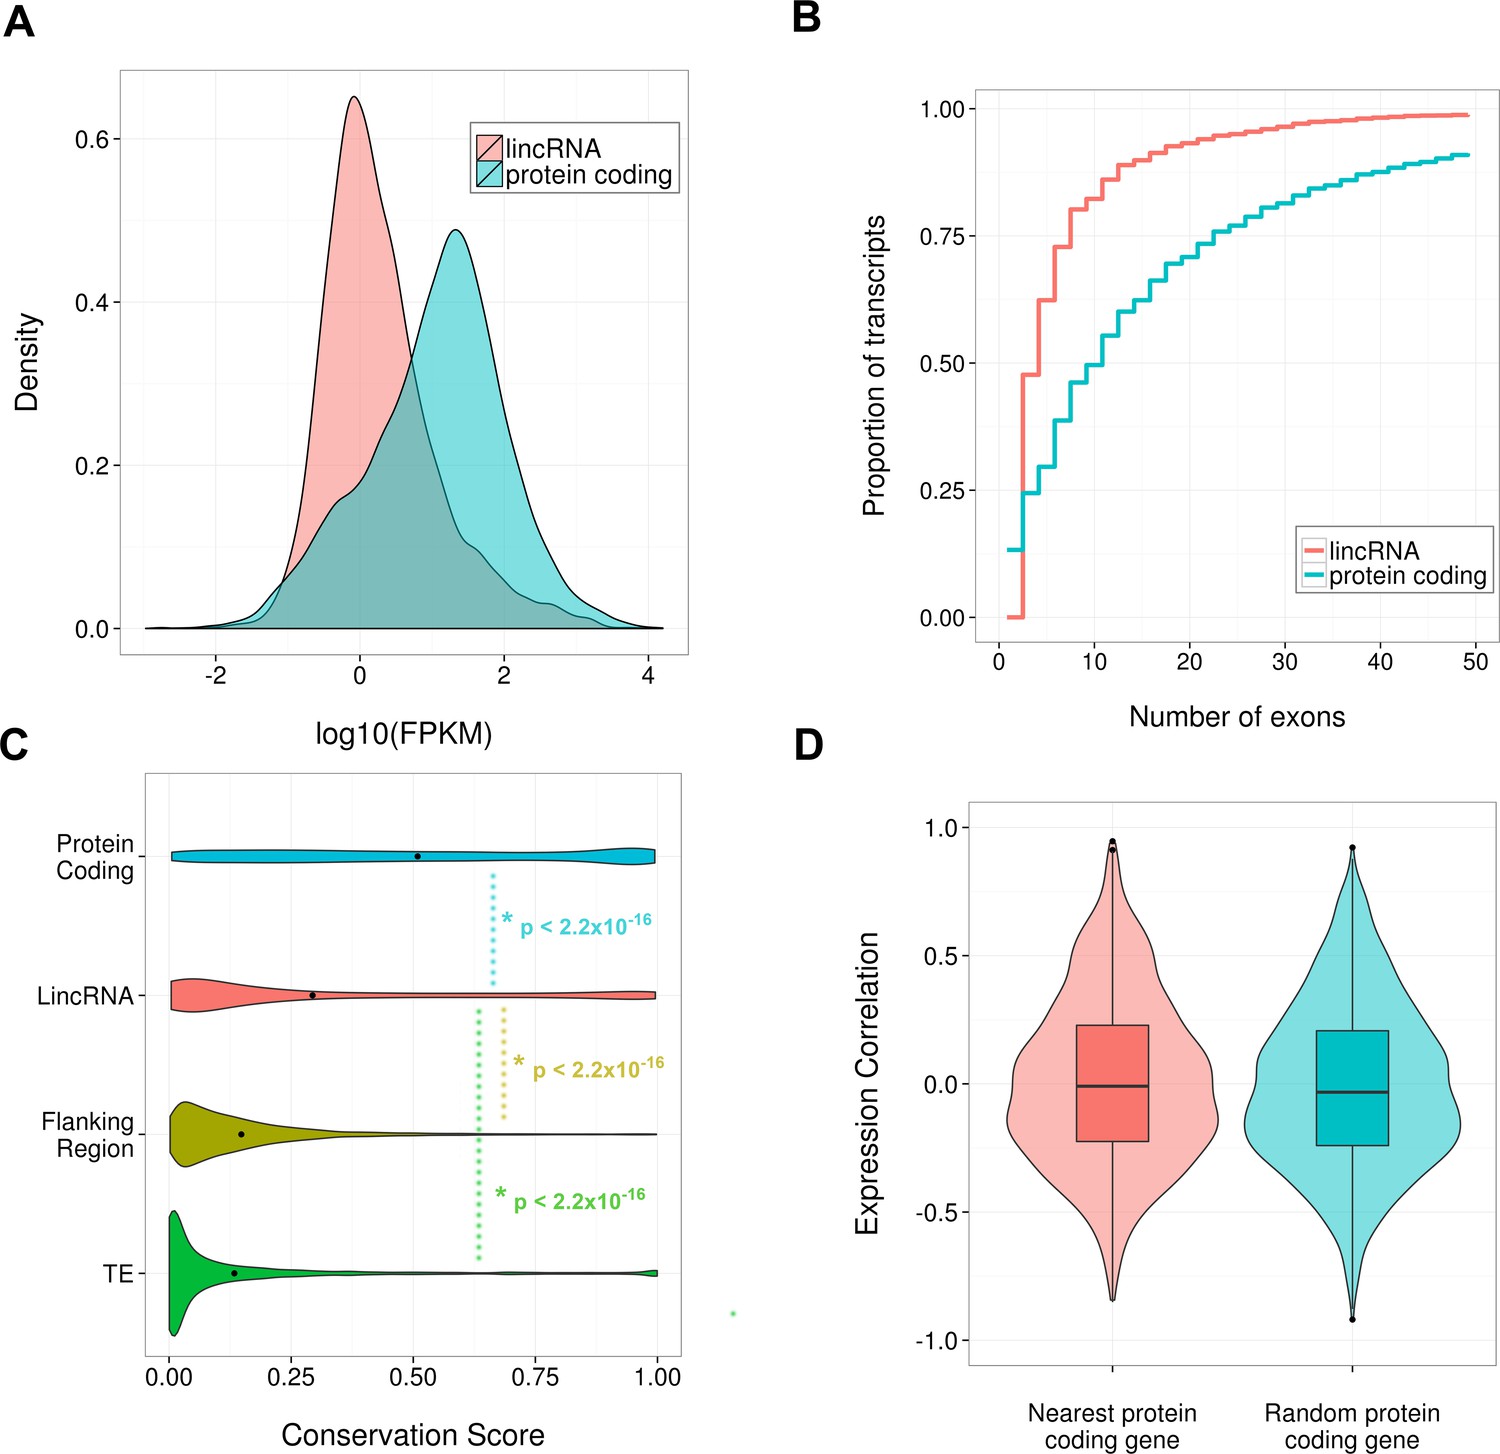
Properties of identified SCN lincRNAs.
(A) Density plot comparing the distribution of expression levels of the 3187 identified lincRNAs (red) and protein-coding genes (blue); lincRNAs tend to be significantly lower expressed than protein-coding genes (p < 2.2×10⁻¹⁶, Kolmogorov–Smirrnov (KS) test). (B) Cumulative frequency graph showing the number of exons possessed by protein-coding genes and the identified 3187 lincRNA loci. Despite this study only considering multiexonic lincRNAs, protein-coding genes tend to possess significantly more exons (p < 2.2×10⁻¹⁶, KS test). (C) Violin plot showing phastCons conservation scores for the exonic regions of the 2796 identified lincRNAs with available conservation scores; these lincRNAs showed significantly less conservation than protein-coding genes but significantly greater conservation than two proxies for neutral evolution: (i) transposable elements within a 50-kb window of the lincRNA locus (p < 2.2×10⁻¹⁶, KS test), (ii) 500-bp of sequence up- or downstream of the lincRNA locus selected randomly within a 1- to 5-kb window (p < 2.2×10⁻¹⁶, KS test). (D) Violin and box plot showing no significant difference (p = 0.45, KS test) in the Pearson’s correlation of a lincRNA’s expression with that for its genomically most proximal protein-coding gene (n = 2261, expression correlation not possible if closest gene is not expressed) compared to a randomly selected protein-coding gene.
Figure 4
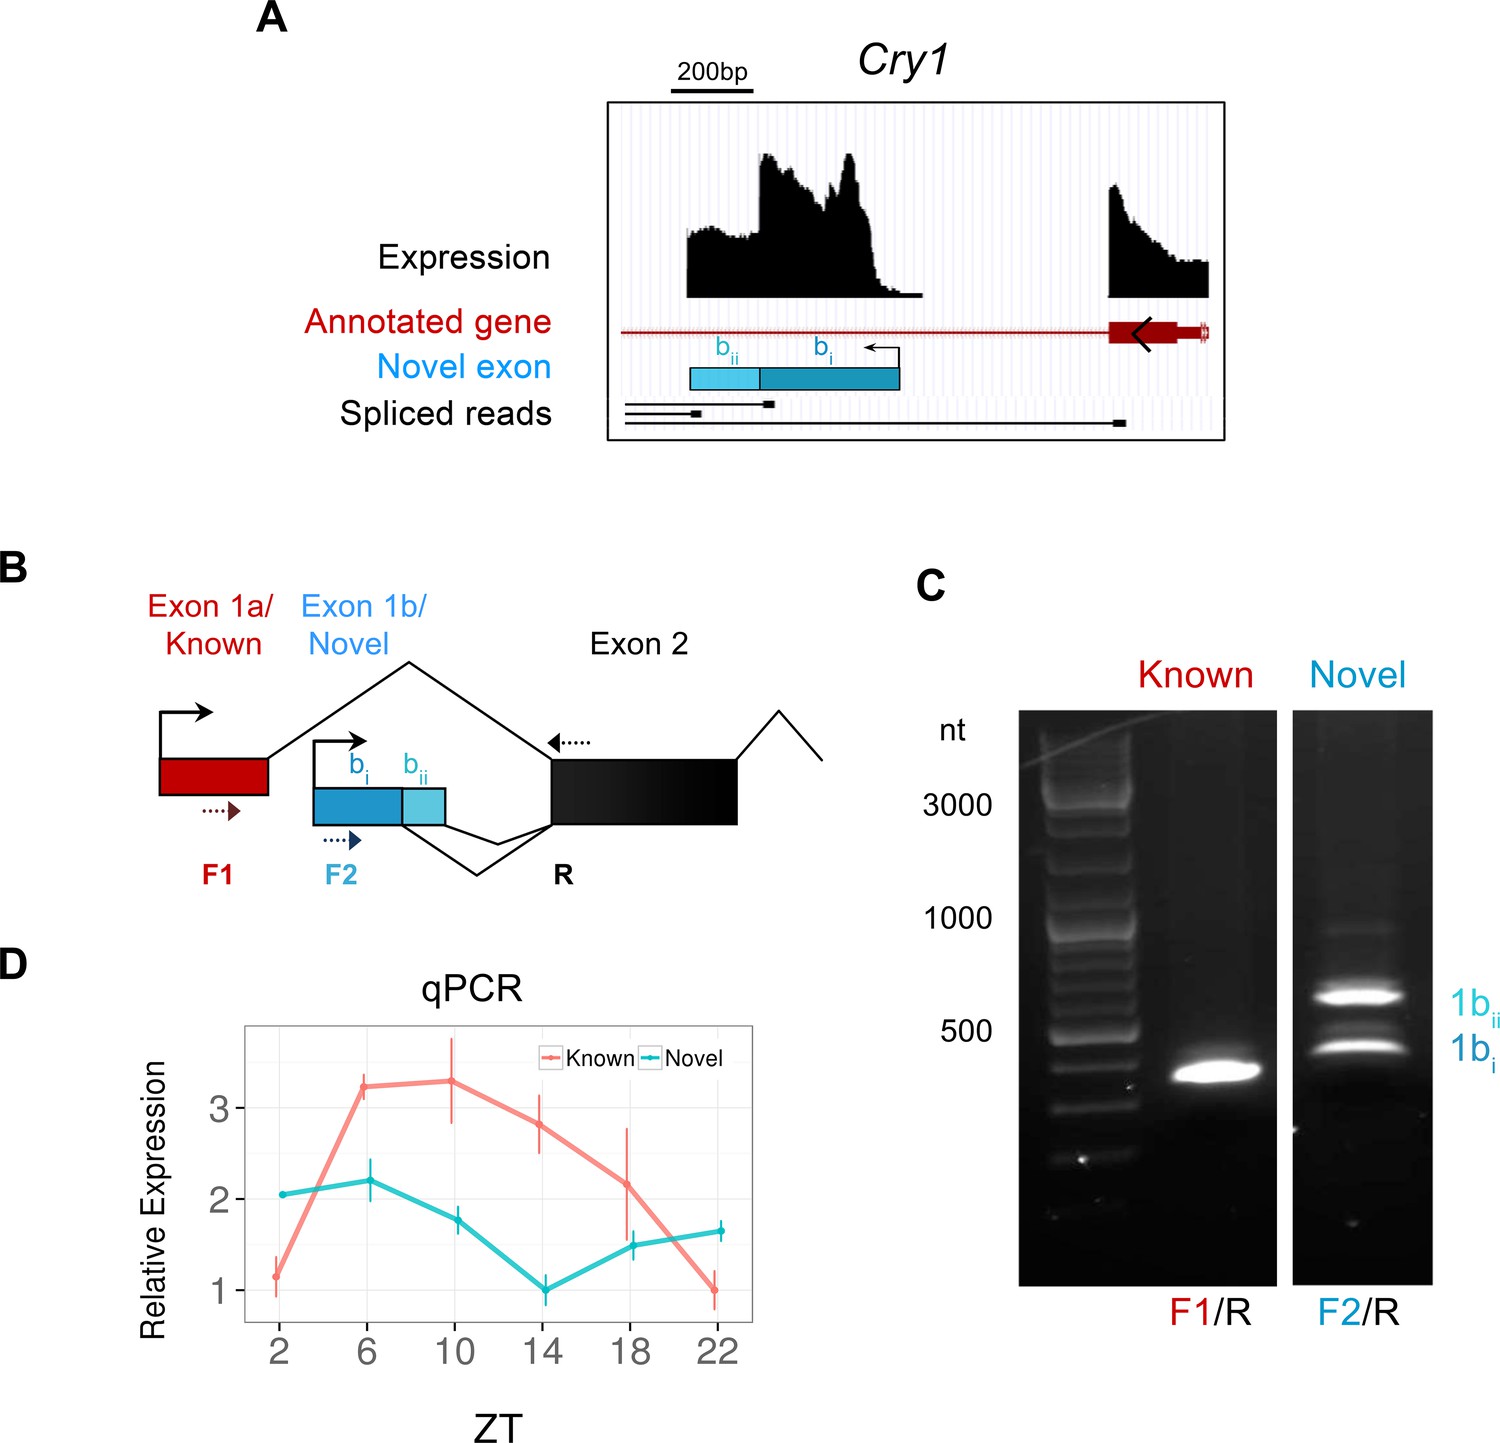
Identification of a novel antiphase Cry1 isoform.
(A) Genomic region of mouse chromosome 10 displaying the novel exon (blue bar) for the clock gene Cry1, which appears to represent an alternate transcriptional start sites (TSS). Peaks (black) signify total expression of the exon whereas representative RNA-seq spliced reads (black) indicate exonic splice junctions. (B) Schematic diagram showing the 5’ gene structure of the canonical (red) and novel (blue) Cry1 isoforms. The novel exon (exon 1b) splices into the subsequent second exon using two different exon boundaries. Dotted arrows denote the position of PCR primers used to amplify Cry1 by RT-PCR. (C) RT-PCR from SCN RNA at ZT6 confirms the presence of novel Cry1 TSS capable of producing two different isoforms as labelled. The identity of all PCR products was confirmed by sequencing. (D) Quantitative polymerase chain reaction (qPCR) of the canonical and novel Cry1 TSS show antiphase cycling expression (mean ± SD) patterns.
Additional files
-
Supplementary file 1
Primer list for quantitative polymerase chain reaction (qPCR).
- https://doi.org/10.7554/eLife.10518.011
-
Supplementary file 2
Table with statistics and general information for each gene surveyed in the SCN.
- https://doi.org/10.7554/eLife.10518.012
-
Supplementary file 3
Table with statistics and general information for each multi-exonic lincRNA expressed in the SCN.
- https://doi.org/10.7554/eLife.10518.013
-
Supplementary file 4
Table with coordinates and additional information for identified novel exons expressed in the SCN.
- https://doi.org/10.7554/eLife.10518.014
-
Supplementary file 5
A GTF file of the 3187 multi-exonic lincRNA expressed in the SCN.
- https://doi.org/10.7554/eLife.10518.015
Download links
A two-part list of links to download the article, or parts of the article, in various formats.
Downloads (link to download the article as PDF)
Open citations (links to open the citations from this article in various online reference manager services)
Cite this article (links to download the citations from this article in formats compatible with various reference manager tools)
Temporal transcriptomics suggest that twin-peaking genes reset the clock
eLife 4:e10518.
https://doi.org/10.7554/eLife.10518


