PHF13 is a molecular reader and transcriptional co-regulator of H3K4me2/3
- Max Planck Institute for Molecular Genetics, Germany
- Structural Genomics Consortium, Canada
- Heinrich-Pette-Institute - Leibniz Institute for Experimental Virology, Germany
- Centre for Genomic Regulation, Spain
- Ludwig-Maximilians-University, Germany
- Universitat Pompeu Fabra (UPF), Spain
- Friedrich-Alexander-Universität Erlangen-Nürnberg, Germany
- Pg. Lluis Companys, Spain
Figures
Figure 1
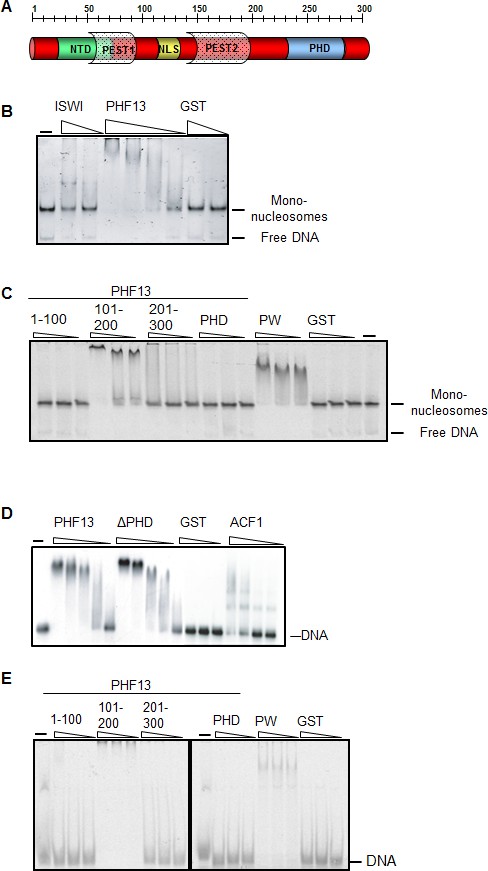
PHF13 binds to DNA and recombinant nucleosomes.
(A) Schematic of the putative domain structure of PHF13. (B) Mononucleosome EMSA using recombinant mononucleosomes reconstituted on a 200 bp DNA fragment (20 nM) and increasing concentrations of GST (150 nM, 1200 nM), GST-ISWI (28 nM, 226 nM) and GST-PHF13 (70 nM, 140 nM, 280 nM, 560 nM). (C) Mononucleosome EMSA using recombinant mononucleosomes reconstituted on a 151 bp fragment (20 nM) and increasing concentrations (80, 160, 320 nM) of GST-1-100, GST-101-200, GST-201-300, GST-PHD and PWWP (positive control). (D) EMSA: 248 fM of P32 radioactively labeled 248 bp DNA with increasing concentrations of GST (37.5, 150, 300 nM) GST-PHF13 (17, 34, 68, 102 and 135 nM) and GST-ΔPHD (18.5, 37, 74, 111, 148 nM) and ACF1 (10.5, 21, 31.5 and 42 nM). ACF1 served as a positive control. (E) EMSA: 10 nM Cy5 labeled 40 bp DNA with increasing concentrations (40, 80, 160 nM) of GST, GST-1-100, GST-101-200, GST-201-300, GST-PHD and GST-PWWP (positive control). The input DNA and mononucleosomes are indicated in B–E.
Figure 2
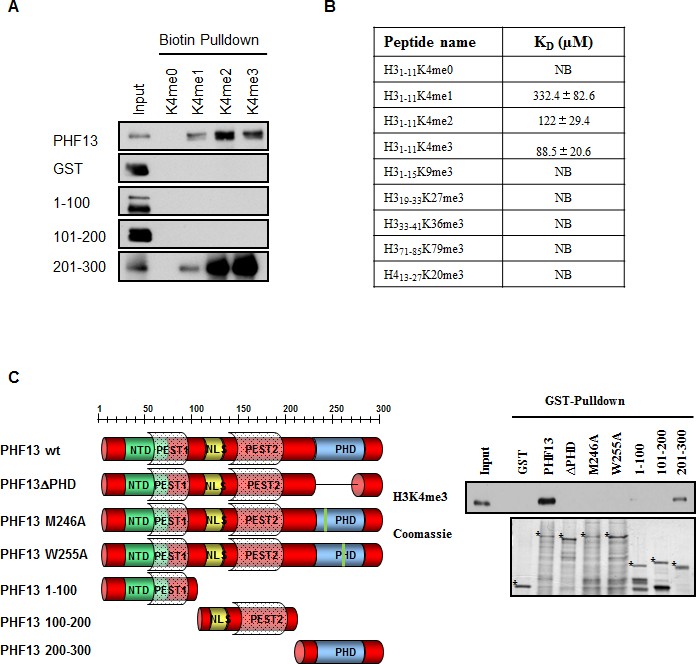
PHF13’s PHD domain specifically interacts with H3K4me2/3
(A) Biotinylated histone peptide pull down.Equivalent amounts (1 µg) of GST, GST-PHF13 and GST-PHF13 deletion fragments 1–100, 100–200 and 200–300 aa were incubated with 1 µg of differentially modified biotinylated histone peptides and streptavidin beads. Co-precipitation of GST-proteins was analyzed using a GST specific antibody. (B) Fluorescence Polarization Assay. The dissociation constant of the PHF13-PHD only protein with differentially methylated H3 and H4 peptides. (C) GST pull down of H3K4me3 from nuclease digested chromatin lysates using GST-alone, GST-PHF13 and the indicated GST-PHF13 deletion and point mutant proteins. Precipitation of H3K4me3 was analyzed with a specific antibody. Amount of GST proteins were controlled by Coomassie staining.
Figure 3 with 1 supplement

Crystal structure of PHF13’s PHD domain.
(A–B) The crystal structure of apo-PHF13 PHD domain (A) and PHF13 PHD finger in complex with H3K4me3 (B). (C) Electrostatic surface potential of PHF13’s PHD finger in complex with H3K4me3. Dashed lines represent intermolecular hydrogen bonds. (D) Fluorescence Polarization Assay - The dissociation constant of PHF13 and PHF13 PHD point mutants with H3K4me3. (E) Isothermal titration Calorimetry (ITC) - Binding affinity of PHF13’s PHD domain for H3R2K4me3 (left panel) or H3R2me2aK4me3 (right panel).
-
Figure 3—source data 1
Data collection and refinement statistics – Detailed specifications of the data obtained from the crystallization of Apo-PHF13-PHD and the PHF13-PHD-H3K4me3 complex.
- https://doi.org/10.7554/eLife.10607.006
-
Figure 3—source data 2
PHF13 PHD domain binding to a differentially methylated histone peptide tail chip.
(A) Binding of His-PHF13-PHD-only to a histone peptide array was detected with an anti-His antibody. Boxes denote the positive controls (12 x histidine) and an interaction with H3K4me3 when the neighboring R2 is not di-methylated. (B) Peptide key of the spotted differentially modified histone peptides on the histone peptide array. The length, position and sequence of the spotted peptides are annotated in the table.
- https://doi.org/10.7554/eLife.10607.007
Figure 3—figure supplement 1
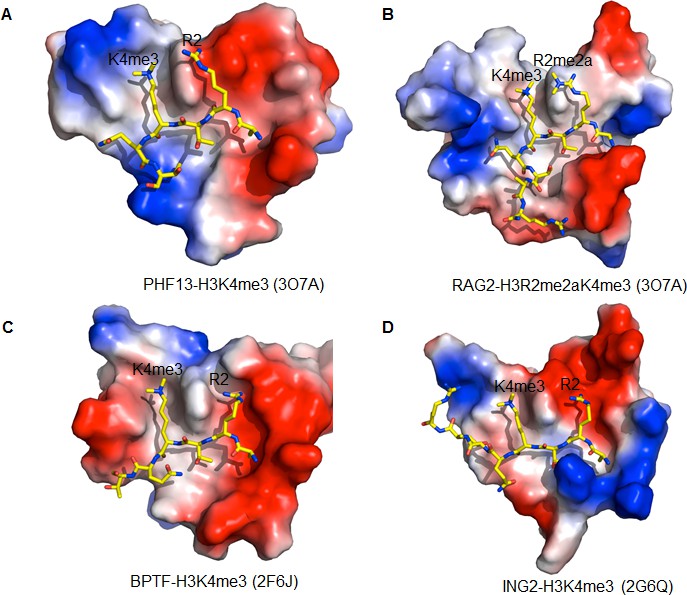
Comparison of the H3R2 binding pocket of different PHD domains.
(A) PHF13-H3K4me3. PDB code: 3O7A (B) RAG2-H3R2me2aK4me3. PDB code: 2V83 (C) BPTF-H3K4me3. PDB code: 2F6J, D) ING2-H3K4me3. PDB code: 2G6Q. The PHD domains are displayed in surface charge representation model and the histone peptides are shown in stick models.
Figure 4 with 4 supplements
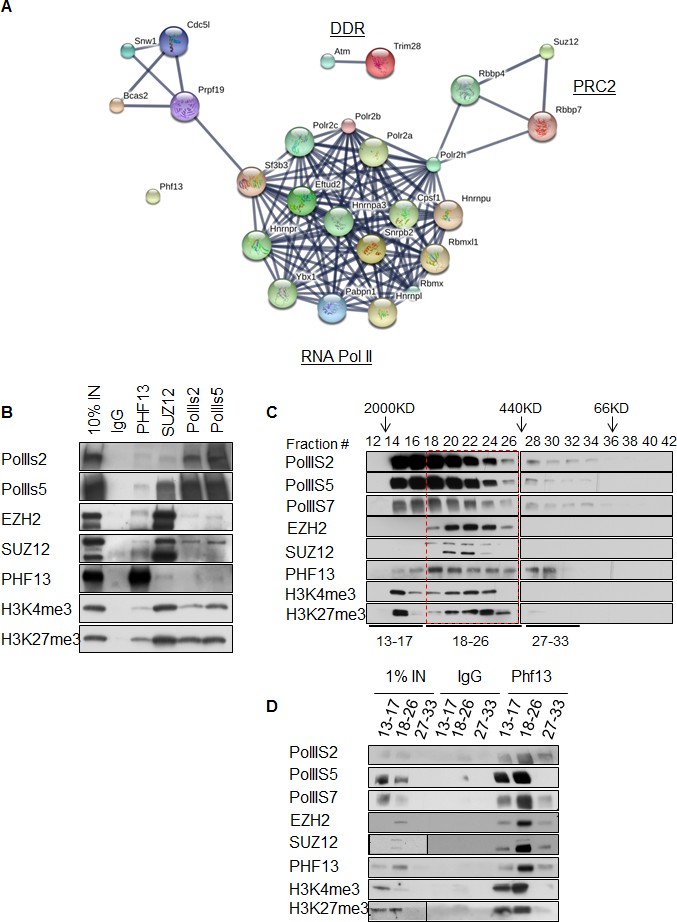
PHF13 interacts with RNA polymerase II and PRC2 complexes.
(A) A String functional protein association network (http://string-db.org/) of PHF13 chromatin interactions as identified by mass spectrometry. High confidence interactions were selected (0.9), and revealed an interaction network with DDR proteins, PRC2 and RNA polymerase II complex. (B) Immunoblot of co-immunoprecipitating interactions from control IgG, PHF13, SUZ12, PolII S2P and PolII S5P immunoprecipitations from nuclease digested chromatin fraction of E14 mESC cells. (C) Immunoblot of even fraction numbers collected from a superose 6 size exclusion chromatography run using nuclease digested chromatin fraction of E14 mESC cells. The co-elution of RNA PolII with PRC2, H3K4me3, H3K27me3 and PHF13 in fractions 18–26 is denoted by red hatched box. (D) Immunoblot of interacting proteins from an IgG and PHF13 immunoprecipitation of the pooled chromatography fractions 13–17, 18–26 and 27–33. Inputs for SUZ12 and H3K27me3 are separately boxed due to the fact that they represent a separate exposure in relation to the IPs.
-
Figure 4—source data 1
Mass spectrometry table of PHF13 interacting proteins.
Table represents the proteins identified by mass spectrometry obtained from PHF13 immunoprecipitations from nuclease digested chromatin lysates from E14 ESCs that were either trypsin digested or LysC digested. Shown is the number of unique peptides identified as well as the posterior error probability (PEP) or q-value.
- https://doi.org/10.7554/eLife.10607.010
-
Figure 4—source data 2
Associated functional terms of mass spectrometry interacting proteins.
Shown are the top biological processes and molecular functions and their false discovery rates (FDR), determined using by the string functional protein association network (http://string-db.org/) analysis.
- https://doi.org/10.7554/eLife.10607.011
Figure 4—figure supplement 1
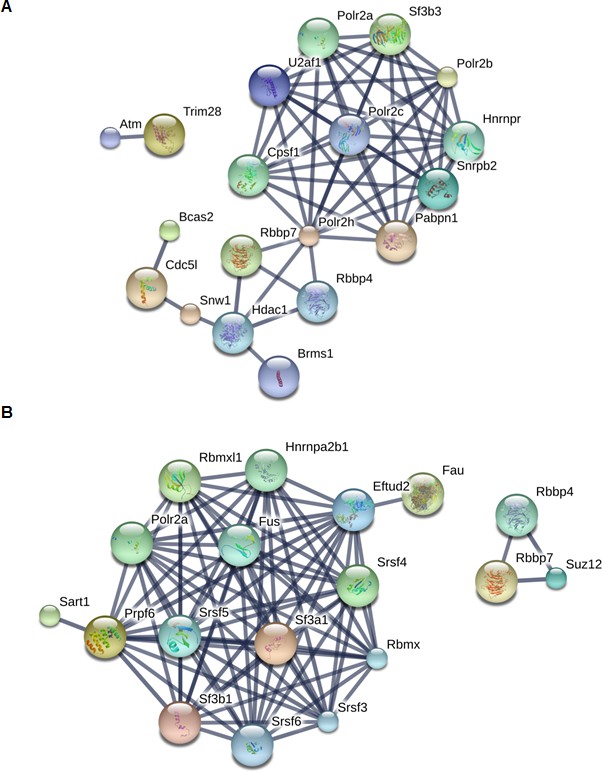
String protein functional association networks for PHF13 interactions when digested by Trypsin (A) or by LysC (B).
https://doi.org/10.7554/eLife.10607.012
Figure 4—figure supplement 2
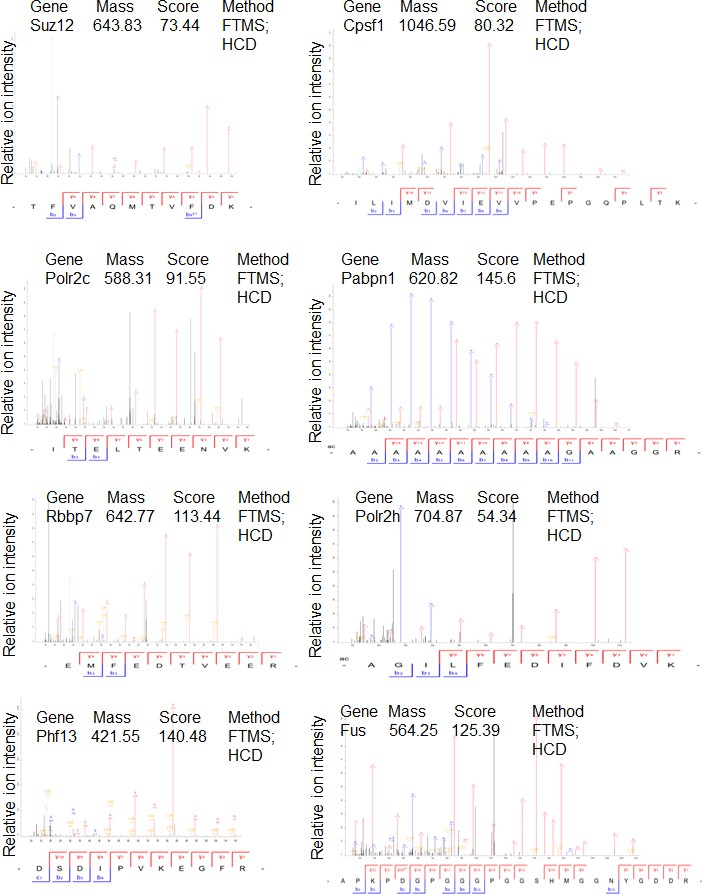
Mass spectrometry profiles of PHF13 interacting proteins where only one unique peptide was identified.
Manually verified MS/MS spectra of unique peptides from indicated proteins with the annotated b- and y- ion series of the higher-energy collision dissociation (HCD).
Figure 4—figure supplement 3
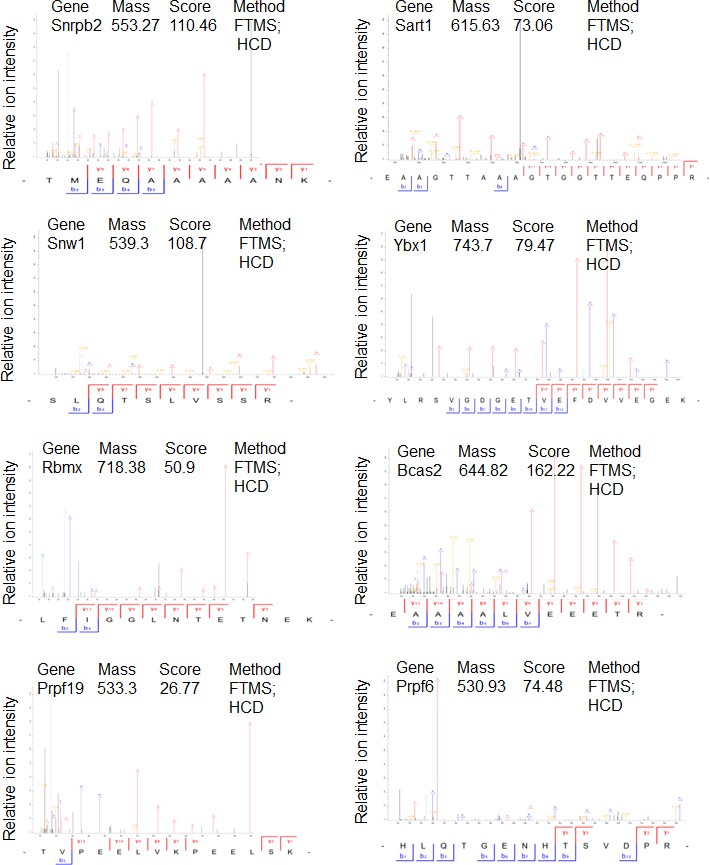
Mass spectrometry profiles of PHF13 interacting proteins where only one unique peptide was identified.
Manually verified MS/MS spectra of unique peptides from indicated proteins with the annotated b- and y- ion series of the higher-energy collision dissociation (HCD).
Figure 4—figure supplement 4
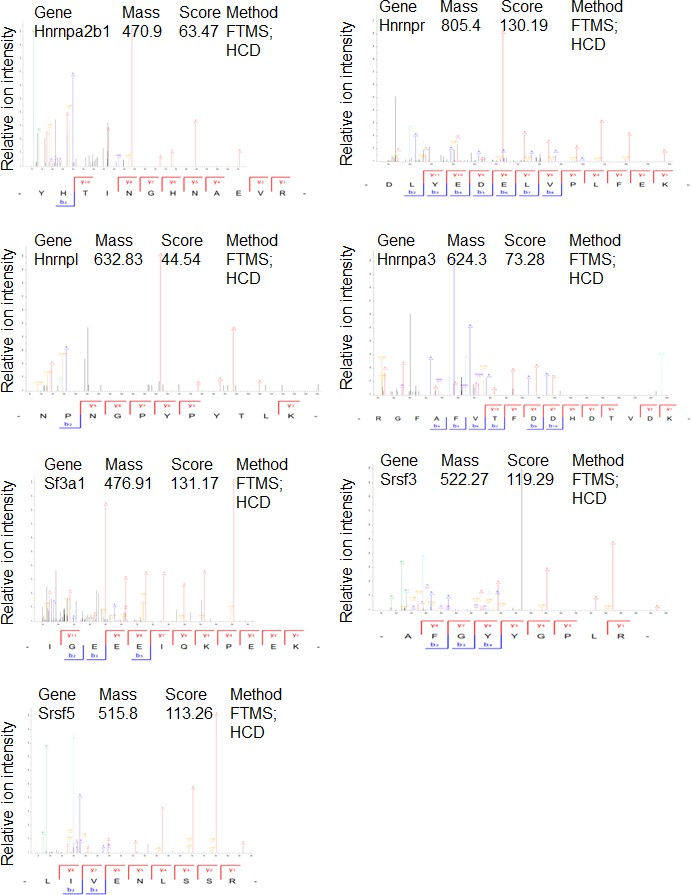
Mass spectrometry profiles of PHF13 interacting proteins where only one unique peptide was identified.
Manually verified MS/MS spectra of unique peptides from indicated proteins with the annotated b- and y- ion series of the higher-energy collision dissociation (HCD).
Figure 5 with 2 supplements
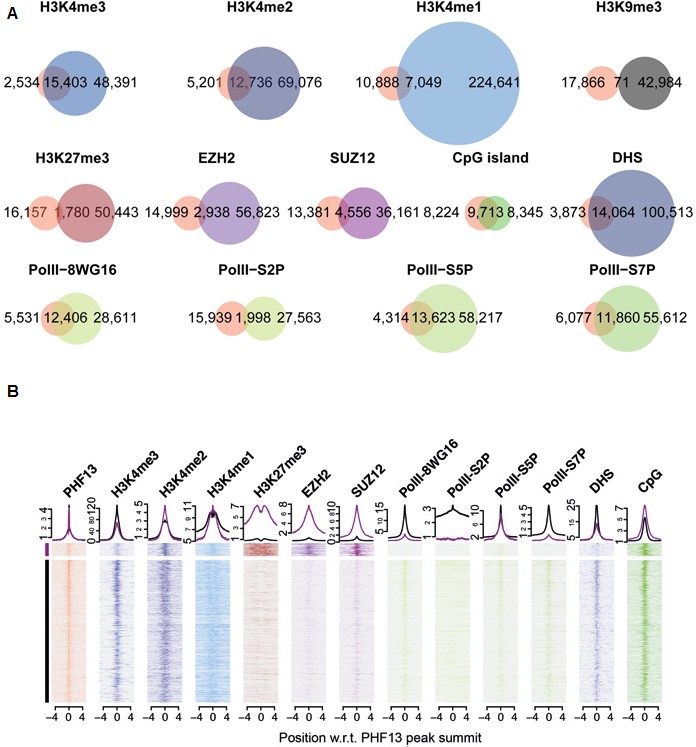
ChIPseq shows a genome wide overlap with methylated H3K4, DHS, CpG islands, PRC2 and RNAPolII.
(A) Venn diagrams for the overlap of called-peaks. (B) Heatmaps for the ChIPseq signal centered around PHF13 peaks. Shown are two groups of peaks that are the result of a k-means clustering of all ChIPseq signals except the one from PHF13, the DHS signal, and the CpG content. Above the heatmap the average signal for the two groups is plotted.
Figure 5—figure supplement 1
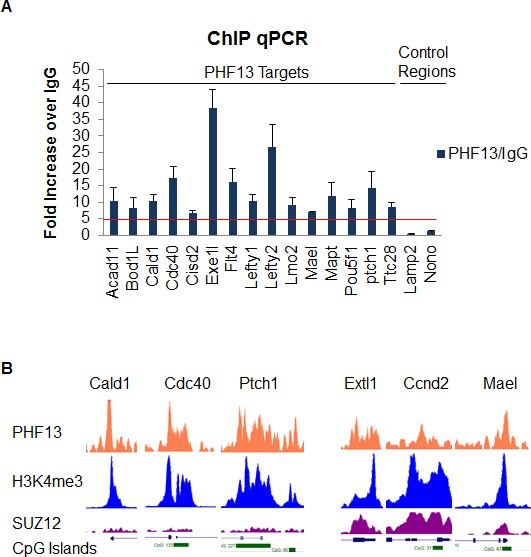
ChIP qPCR analysis of PHF13 ChIPseq targets.
PHF13 was chromatin immunoprecipitated from formaldehyde fixed E14 mESCs and analyzed for PHF13 binding at target or negative control regions in comparison to IgG binding. Shown is a representative ChIP qPCR, standard deviations are qPCR technical replicates.
Figure 5—figure supplement 2
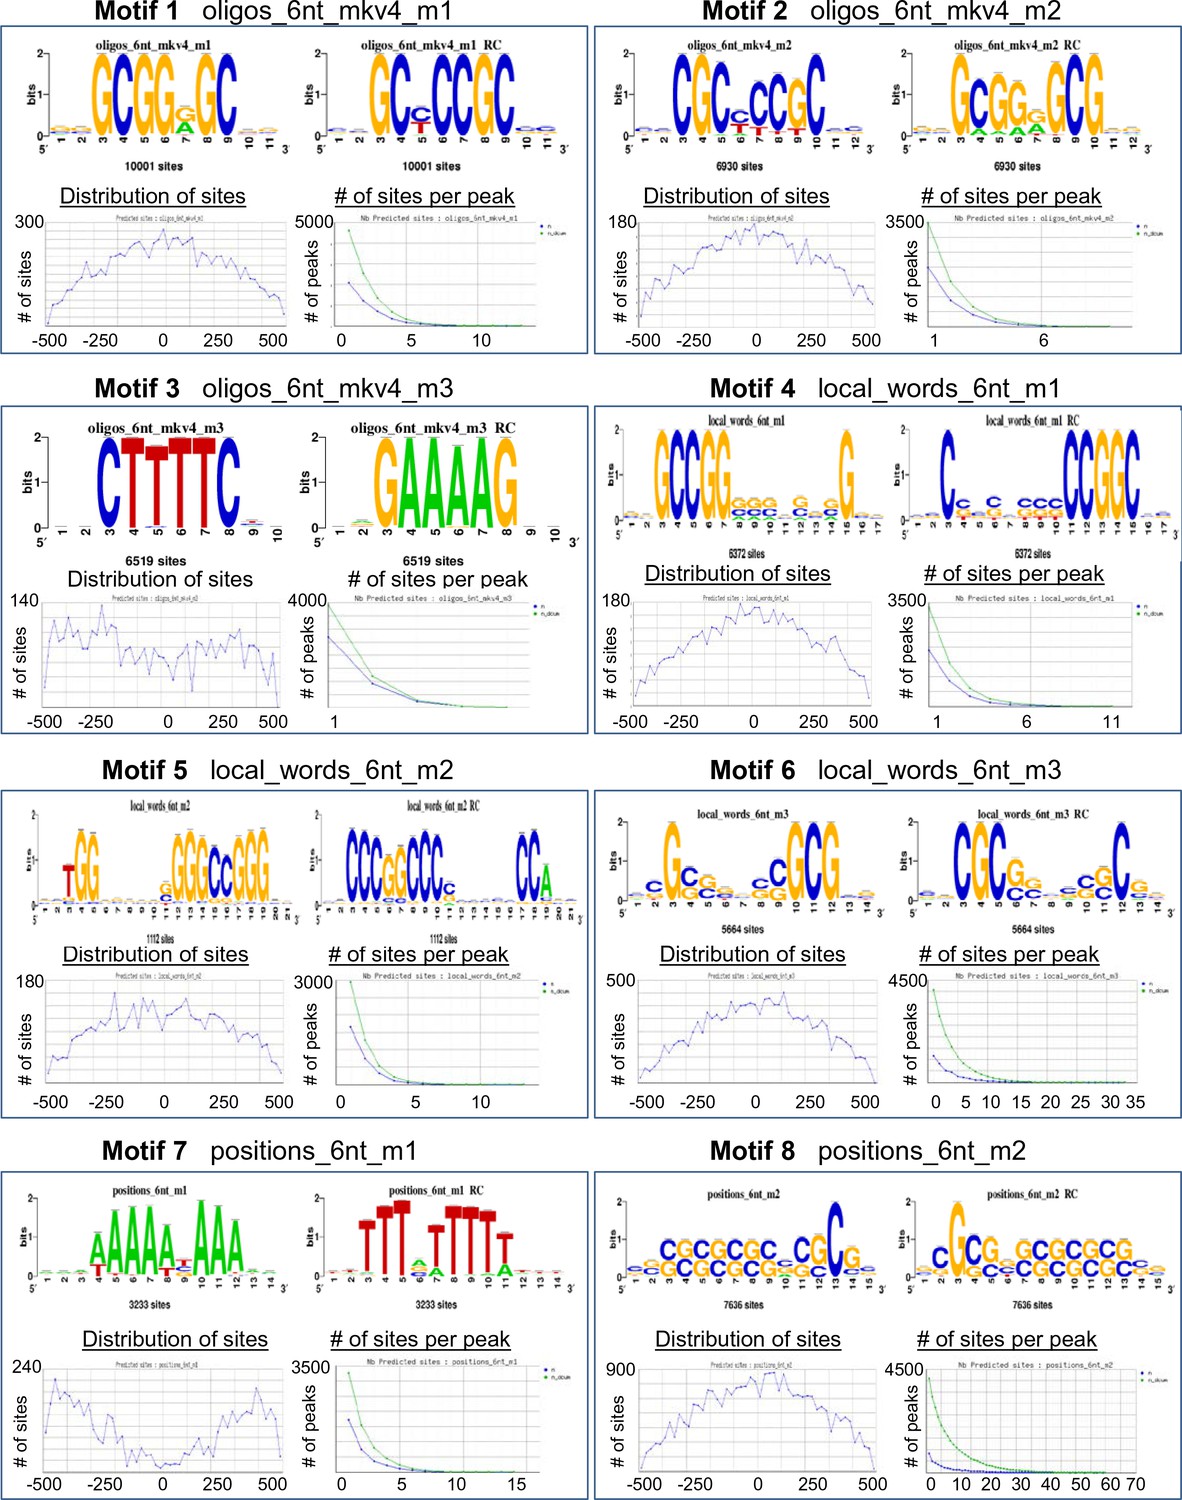
RFAT motif finder of PHF13 ChIP sequencing peak.
The RSAT motif finder identified 21 recognizable motifs based on PHF13 ChIP sequencing peaks. These motifs show that sequences rich in CpG peak at the position of PHF13 peaks and extend left and right of the peak. In contrast AT rich sequences are depleted at the peak of PHF13. Shown are the identified motif sequences and their distribution around the PHF13 peak.
Figure 6 with 1 supplement
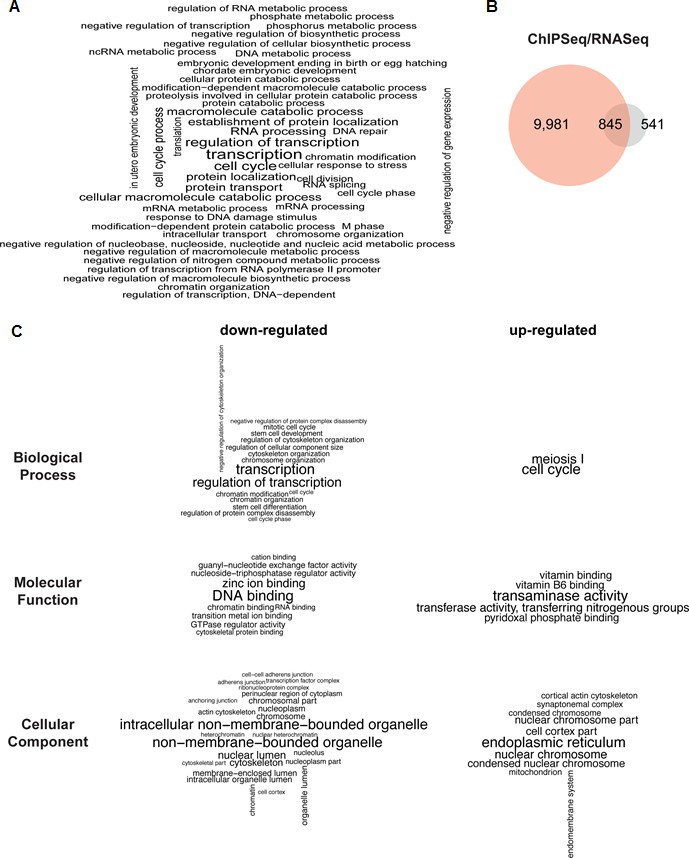
PHF13 ChIP and RNA sequencing overlap and associated functional terms.
(A) Gene set enrichment analysis of genes overlapping with PHF13 ChIPseq peaks located within +/- 1500 bp of their TSSs. (B) Venn diagrams showing the overlap of PHF13 ChIPseq target genes and the genes that were significantly up or down regulated (with an adjusted p-value less than 0.05) after PHF13 knockdown. (C) Gene ontology analysis of the significantly differentially expressed genes that were up or down regulated (with an adjusted p-value of less than 0.05) after PHF13 knockdown.
-
Figure 6—source data 1
PHF13 ChIPseq targets- PHF13 ChIPseq peaks in mouse ES cells located +/- 1500 bp of the TSSs were used to identify 10,826 PHF13 target genes.
- https://doi.org/10.7554/eLife.10607.020
-
Figure 6—source data 2
David GO analysis of PHF13 ChIPseq targets- PHF13 ChIP sequencing target genes were analysed by david and resulted in the following biological processes, molecular functions and cellular components being over represented.
- https://doi.org/10.7554/eLife.10607.021
-
Figure 6—source data 3
PHF13 shRNA RNAseq targets- PHF13 shRNA depletion for 12 days led to 1,386 genes being significantly up or down with an adjusted p-value less than 0.05 in mouse ES cells.
- https://doi.org/10.7554/eLife.10607.022
-
Figure 6—source data 4
David GO analysis of PHF13 regulated genes- Down regulated genes in mESCs after PHF13 knockdown were analyzed by David functional annotation bioinformatic microarray analysis and returned the following biological processes, molecular functions and cellular components as being over represented.
- https://doi.org/10.7554/eLife.10607.023
-
Figure 6—source data 5
David GO analysis of PHF13 regulated genes- Up regulated genes in mESCs after PHF13 knockdown were analyzed by David functional annotation bioinformatic microarray analysis and returned the following biological processes, molecular functions and cellular components as being over represented.
- https://doi.org/10.7554/eLife.10607.024
Figure 6—figure supplement 1
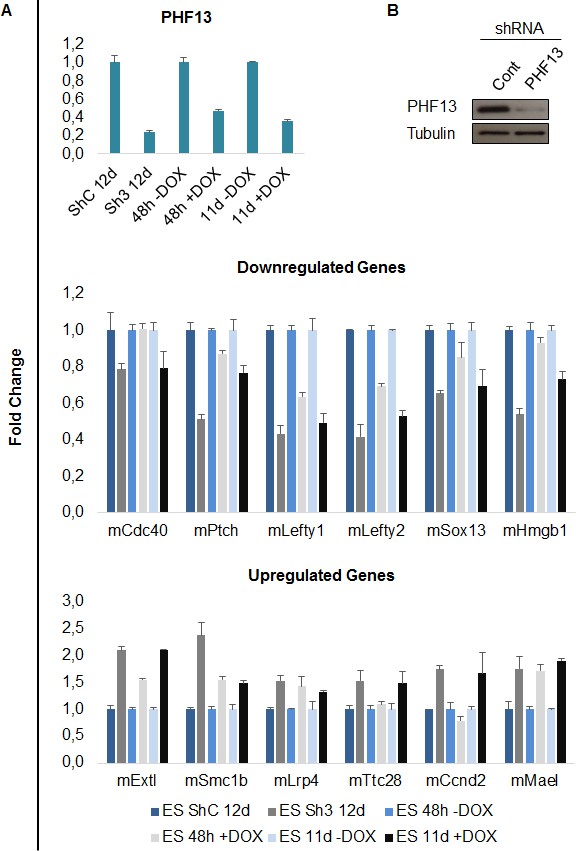
qPCR validation of PHF13 regulated genes.
(A) mRNA expression levels of PHF13 and up and down regulated genes in wild type control transduced E14 mESCs (ShC 12d) or in wild type uninduced mESCs (48h –Dox and 11d – Dox) in comparison to PHF13 depleted (Sh3 transduced) E14 mESCs or induced mESCs (48 hr + Dox and 11d + Dox). Shown are representative qPCRs, standard deviations are qPCR technical replicates. (B) Immunoblot of PHF13 knockdown efficiency (sh3) in comparison to shControl in E14 ES cell lysates, 12 days post transduction and selection. Tubulin served as a loading control.
Figure 7
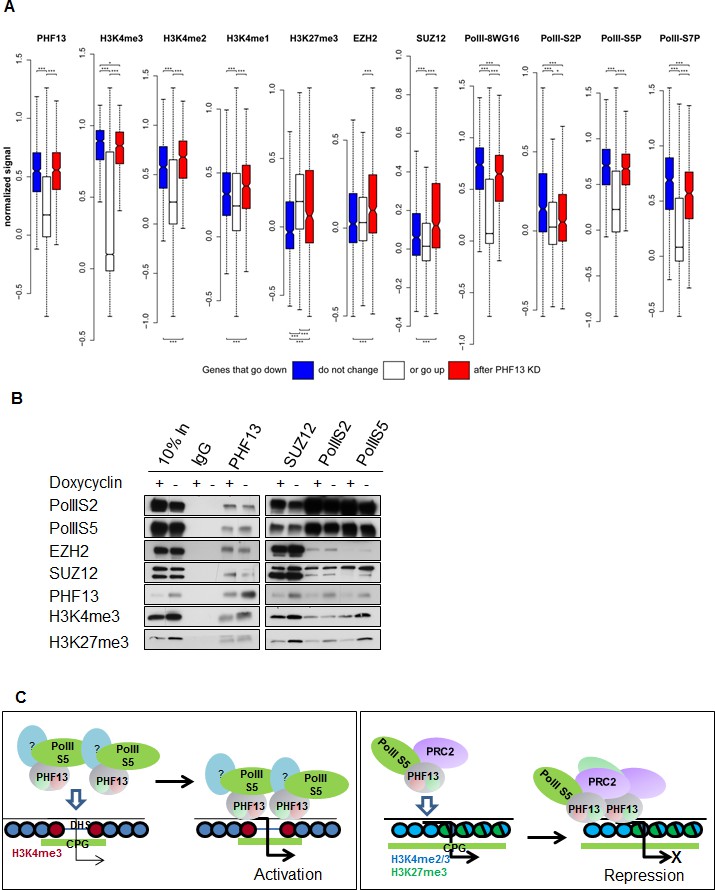
PHF13 modulates recruitment and/or stabilizes RNA PolII S5P and RNA PolII S5P / PRC2 complexes at H3K4me1/2/3 demarcated chromatin.
(A) PHF13 targets that go up or down after depletion are under wild-type conditions enriched or depleted of PRC2, respectively and are enriched in H3K4me1/2/3 and RNA PolII. Differential transcript expression upon PHF13 knockdown in murine ES cells. For each ChIPseq track the normalized signal around the transcription start site is shown for transcripts, which are down-regulated (blue), not changed (white), up-regulated (red) at an adjust p-value threshold of 0.05. The bars above each boxplot denote statistical significant higher signal in the down-/up-regulated genes compared to the unchanged transcripts and in the down regulated genes compared to the up regulated genes. The bars below each boxplot denote statistical significant lower signals in the down-/up-regulated genes compared to the unchanged transcripts and in the down regulated genes compared to the up regulated genes. The stars above and below the bars denote the significance threshold, which is for one star 0.01, two 0.001 and three 0.0001. P-values were calculated with the Wilcoxon rank sum test. (B) Immunoblots of co-precipitating proteins from IgG, PHF13, SUZ12, PolIIS2 and PolIIS5 immunoprecipitations performed in nuclease digested chromatin lysates from wild type (- Doxycyclin) or PHF13 depleted (+ Doxycyclin) mESCs. (C) Left Panel: PHF13 interacts with RNA PolII (S5P and S7P) and most probably as of yet unknown transcriptional activating chromatin modulating complexes. Furthermore, PHF13 simultaneously binds to H3K4me3 and CpG rich DNA at the promoters of active genes. This in turn, acts to either recruit and/or stabilizes these complexes at active promoters, promoting transcription. Right Panel: PHF13 interacts with RNA PolII S5P and PRC2. PHF13 simultaneously binds to bivalent CpG rich, H3K4me2/3 and H3K27me3 enriched promoters of silenced genes. This in turn acts to recruit and/or stabilizes PRC2 and RNA PolII S5P at bivalent promoters, thereby promoting gene repression.
Download links
A two-part list of links to download the article, or parts of the article, in various formats.
Downloads (link to download the article as PDF)
Open citations (links to open the citations from this article in various online reference manager services)
Cite this article (links to download the citations from this article in formats compatible with various reference manager tools)
PHF13 is a molecular reader and transcriptional co-regulator of H3K4me2/3
eLife 5:e10607.
https://doi.org/10.7554/eLife.10607


