Trogocytosis-associated cell to cell spread of intracellular bacterial pathogens
- University of North Carolina at Chapel Hill, United States
Figures
Figure 1 with 2 supplements
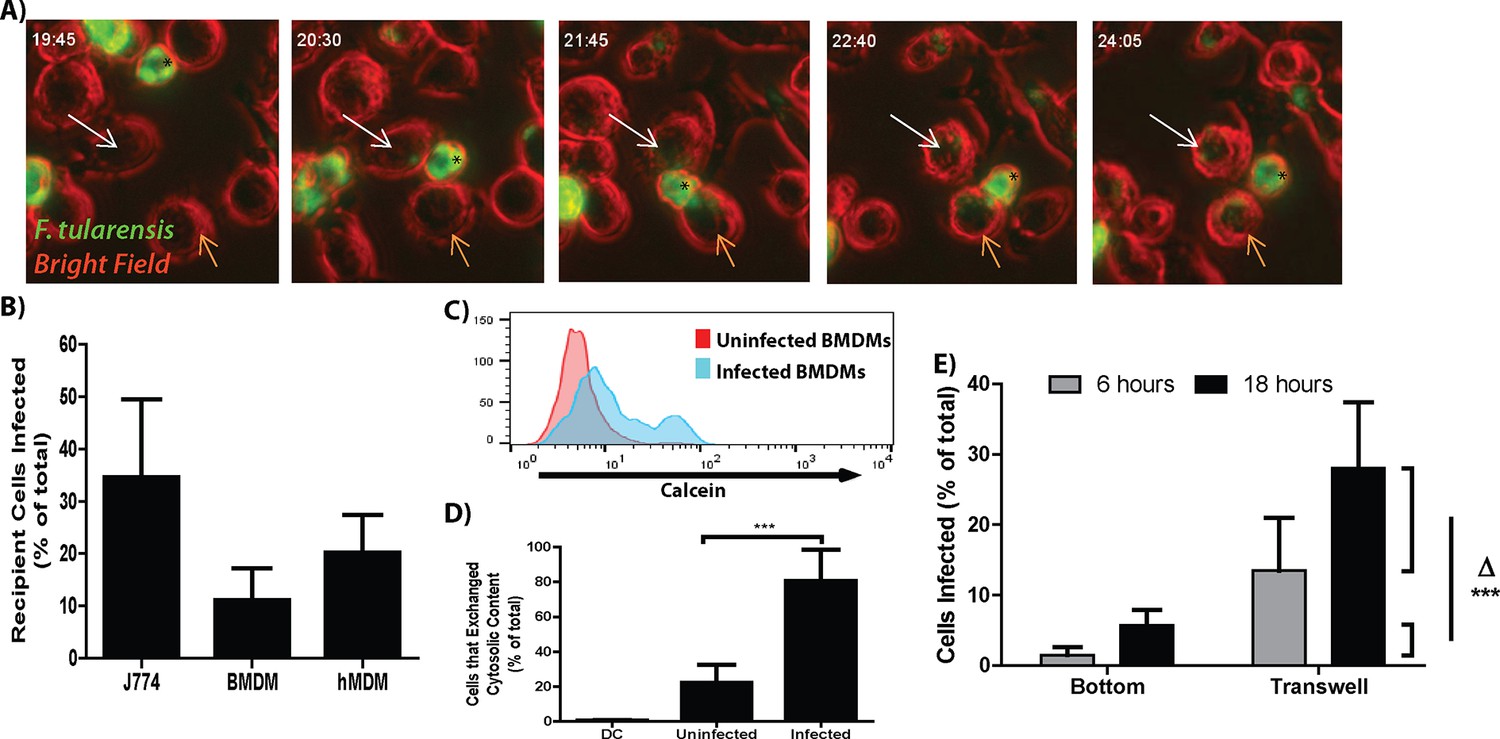
F. tularensis transfers between macrophages during cytosolic transfer.
(A) Representative panels from live cell imaging of F. tularensis infected J774 cells transferring bacteria. Time- hour: minutes post inoculation; * - initially infected cell; White arrow- first bacterial transfer event; Orange arrow- second bacterial transfer event. Movie available as Video 1. (B) The proportion of recipient macrophages infected after a 6 hr co-incubation with infected cells of the same type (3 independent experiments performed in triplicate). (C) A representative histogram of the amount of calcein that transferred to recipient cells (log10 fluorescence) after 6 hr co-incubation. (D) The percent of infected or uninfected cells that exchanged cytosolic content (positive for both Cell Trace Red and calcein) after 6 hr co-incubation. The uninfected population represents cells in the infected well that did not become infected. DC refers to a doublet control (2 independent experiments performed in triplicate) (E) Bacterial transfer to uninfected cells is significantly higher with direct cell to cell contact. Infected BMDMs on a transwell filter were suspended over uninfected BMDMs. The percent of total cells infected on the bottom chamber (bottom) and top filter (transwell) were determined by FACS 6 and 24 hr after suspending the transwell over uninfected cells. Side brackets indicate the change in numbers of infected cells in each chamber from 6 to 24 hr. Transfer to BMDMs separated from the initially infected cells was significantly lower than transfer to BMDMS in contact with the infected cell population. (3 independent experiments performed in triplicate). (Mean +/- SD). (***p<0.001)
Figure 1—figure supplement 1
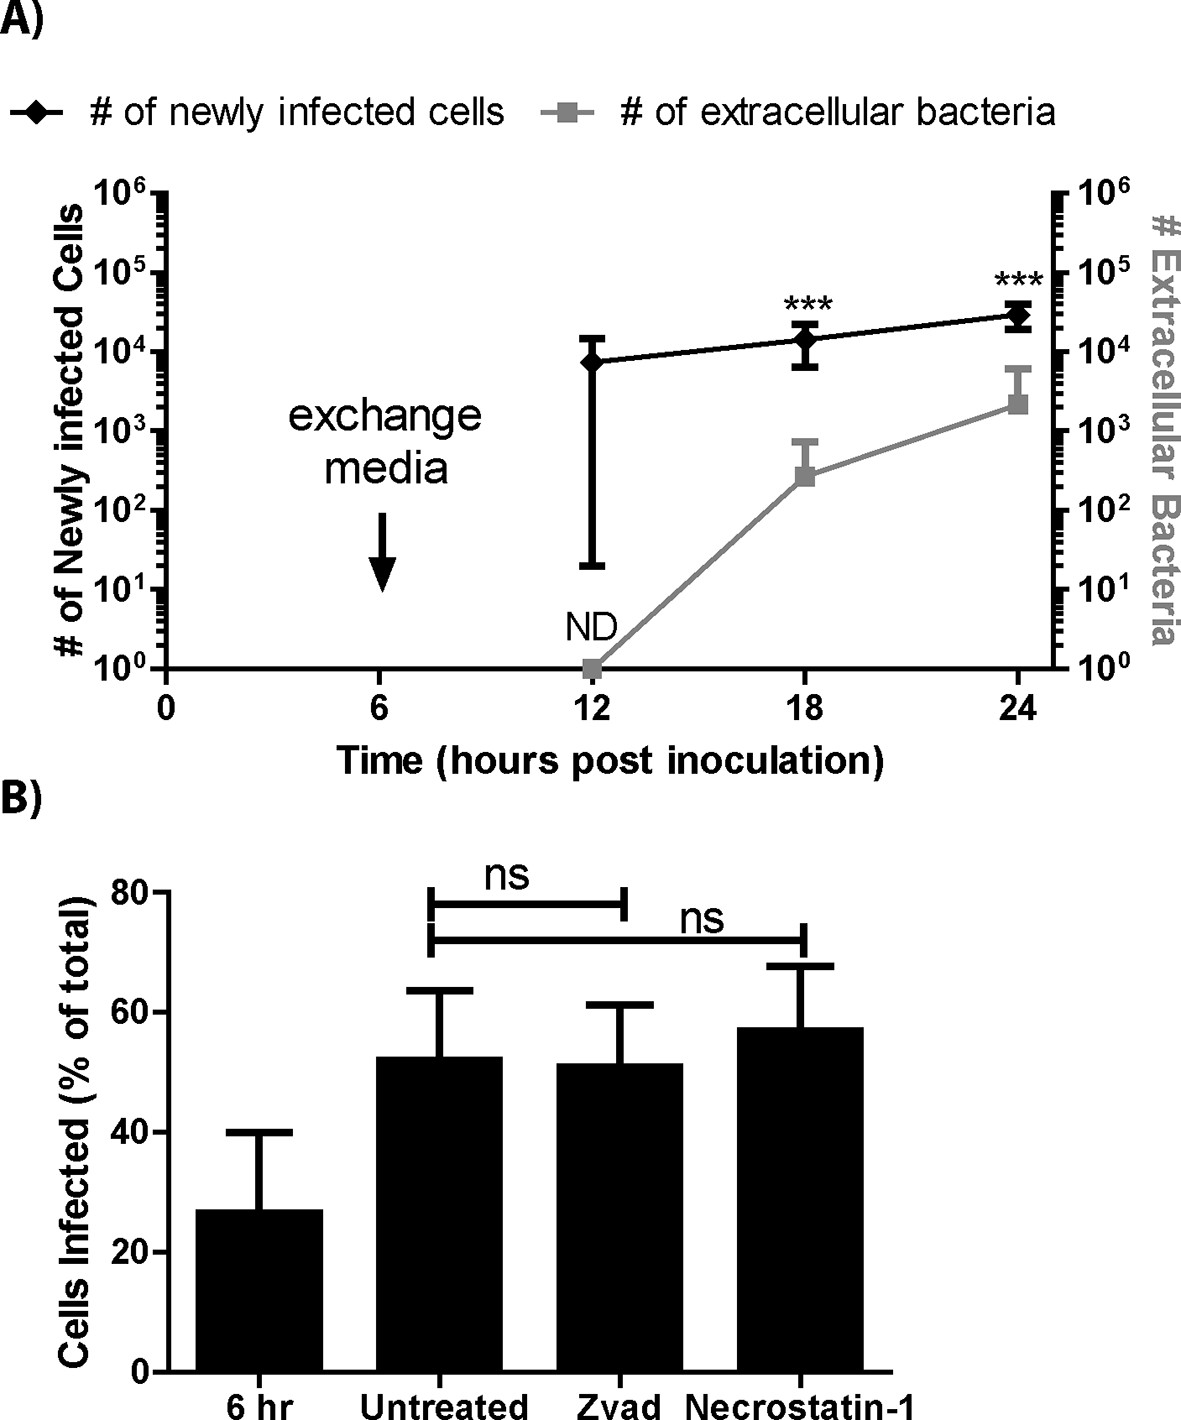
The extracellular space is not a major source of infectious bacteria.
(A) The total number of BMDMs infected at 6 hr intervals compared to the number of extracellular bacteria in 1 milliliter of media. All samples were initially treated with gentamicin between 2 and 6 hr post inoculation to destroy extracellular bacteria from the inoculum. The antibiotic containing media was replaced with antibiotic free media at 6 hr post infection. (B) BMDMs were assessed for the number of infected cells at 6 or 24 hr post inoculation in the presence of specific inhibitors. Z-Vad(OMe)-FMK or necrostatin-1 were added at 6 hr post inoculation. (All experiments from 3 independent experiments performed in triplicate) (Mean +/- SD). (ND- not determined, bacterial counts below limit of detection, ns p>0.05, **p<0.05,**p<0.01, ***p<0.001)
Figure 1—figure supplement 2

Experimental design and bacterial motility for transwell assay.
(A) Experimental design of the transwell assay performed in Figure 1E. (B) Extracellular F. tularensis can penetrate and infect BMDMs on both sides of the transwell membrane. F. tularensis was added to the indicated chamber for 2 hr and both chambers were assessed for the number of BMDMs that became infected. (3 independent experiments performed with a single replicate) (Mean +/- SD).
Figure 2 with 1 supplement
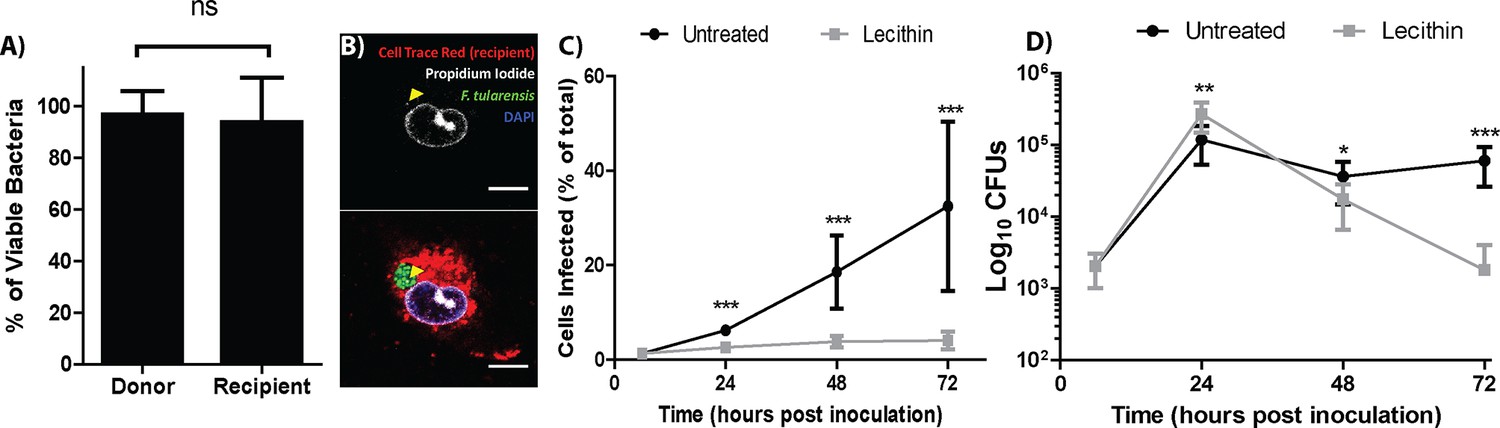
Live bacteria transfer to macrophages during bacterial transfer.
(A) The percent of viable bacteria (propidium iodide negative) in donor and recipient BMDMs (2 independent experiments, 50 fields of view each) (B) Micrographs of propidium idodide treated permeabilized F. tularensis infected BMDMs. Arrow- propidium iodide positive bacterium. Scale bar- 10 uM. (C) The number of cells infected in untreated or soy lecithin treated BMDMs. Infected BMDMs in soy lecithin treated (grey) and untreated (black) were quantified by FACS at indicated times post inoculation. Data are presented as number of infected cells regardless of number of bacteria per infected cell. Soy lecithin was added to the treated populations after initial infection with F. tularensis. (D) Soy lecithin does not inhibit F. tularensis intracellular replication. The number of viable bacteria in untreated or soy lecithin treated BMDMs was quantified at indicated times by dilution plating and calculation of colony forming units. Lecithin was added at 6 hr post inoculation (3 independent experiments performed in triplicate for both lecithin experiments). (Mean +/- SD). (ns p>0.05, *p<0.05, **p<0.01, ***p<0.001).
Figure 2—figure supplement 1
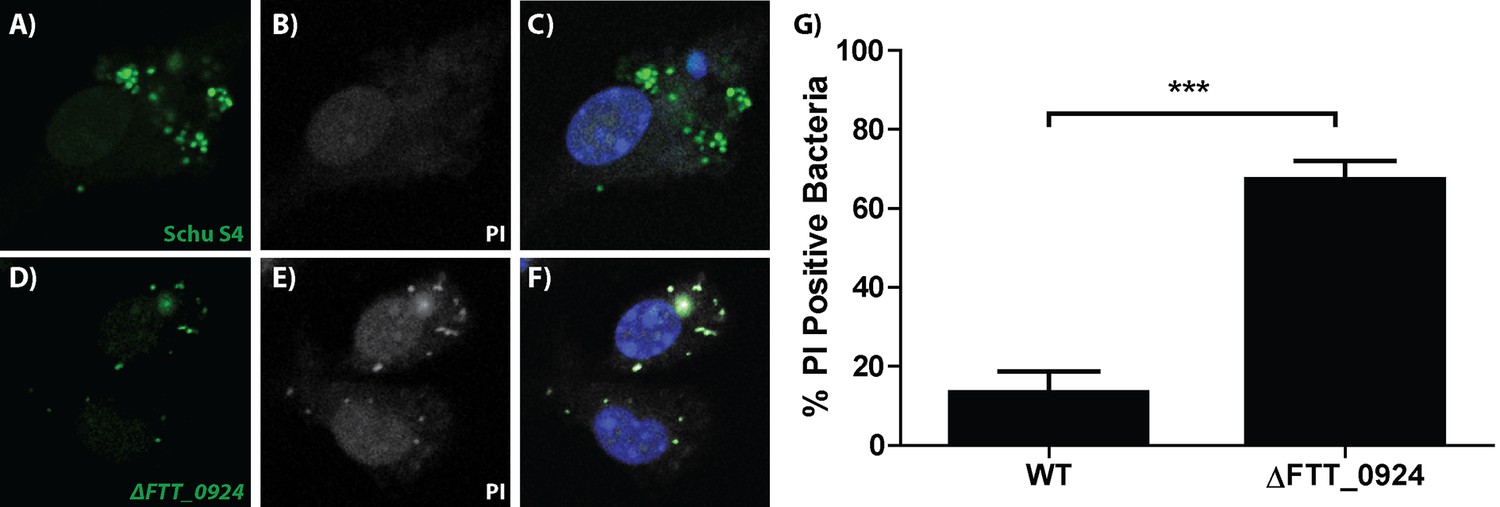
Propidium iodide can access and bind to dead intracellular bacteria following saponin treatment.
Fluorescence microscopy images of BMDMs infected with (A–C) wild type Schu S4-GFP or (D–F) intracellular growth defective mutant △FTT_0924-GFP, permeabilized with saponin and treated with propidium iodide (PI). (A,D) GFP positive bacteria (green), (B,E) PI positive bacteria (white), (C,F) merged images. (G) Proportion of PI positive (dead) intracellular wild type (WT) and growth deficient mutant bacteria (△FTT_0924). The data were analyzed from n = 100 macrophages per strain from 3 independent experiments. (Mean +/- SD) (***P<0.001).
Figure 3 with 1 supplement

Bacterial transfer is cell type specific.
(A) Percentage of infected J774 macrophages or TC-1 epithelial cells at the indicated time post inoculation (log10 fluorescence). (B) A compilation of the number of J774 or TC-1 cells infected over time. Statistics represent test for a significant increase in the number of cells infected compared to the previous 6 hr time point. (C) TC-1 to TC-1 transfer vs TC-1 to BMDM transfer after a 0 or 18 hr co-incubation. (All results from 3 independent experiments performed in triplicate) (Mean +/- SD). (ns p>0.05, *p<0.05, **p<0.01).
Figure 3—figure supplement 1
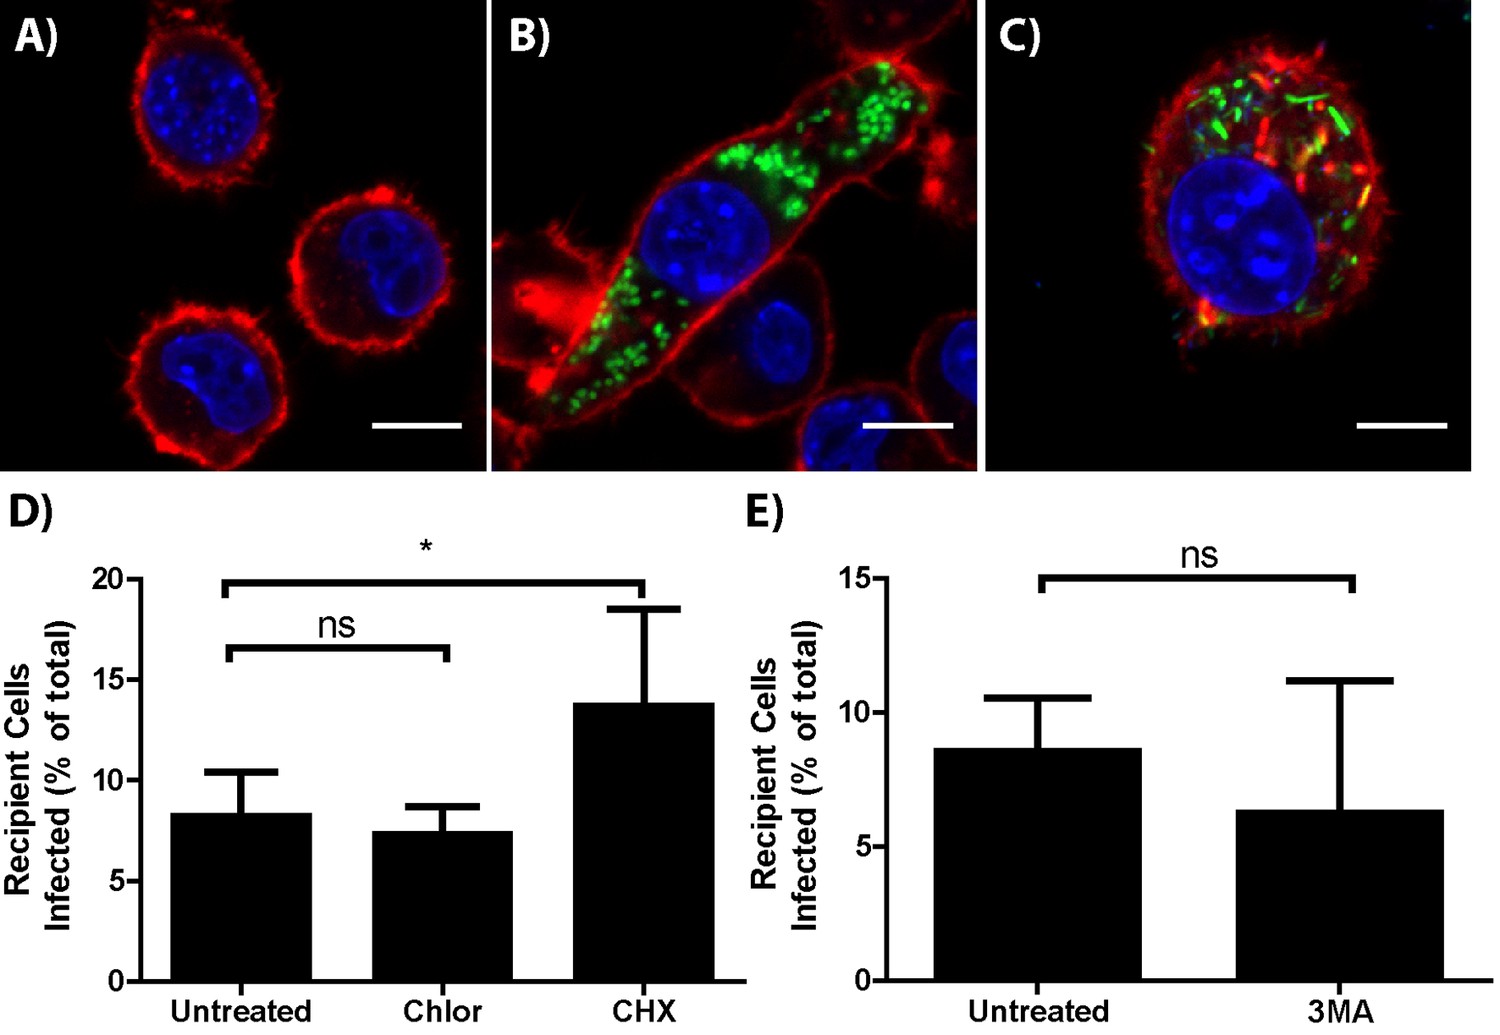
F. tularensis does not transfer via actin based motility or autophagy.
Representative micrographs of (A) uninfected, (B) F. tularensis infected, or (C) Listeria monocytogenes infected BMDMs 16 hr post inoculation. DAPI is depicted in blue, phalloidin (actin) in red and the bacteria in green. The scale bar represents 10 uM. (D) Transfer of bacteria to recipient cells in the presence of host (cycloheximide [CHX]) or bacteria (chloramphenicol [Chlor]) protein synthesis inhibitors. (E) F. tularensis transfer to recipient BMDMs after a 6 hr co-incubation in the presence or absence of 3-methyladenine (3 MA). (All experiments from 3 independent experiments performed in triplicate) (Mean +/- SD). (ns p>0.05, * p<0.05).
Figure 4 with 3 supplements

Plasma membrane protein transfer correlates with bacterial transfer.
(A) Fluorescence micrographs of BMDMs before, during, and after trogocytosis. (B) A donor [white plasma membrane] and trogocytosis positive recipient BMDM [red cell] exchanging cytosolic material and bacteria. The bottom right panel is a 3D rendering of the Z-stack from the cells in the top panel. Percent of trogocytosis positive recipient cells that are (C) BMDMs or (D) hMDMs. (E) The percent of Balb/c recipient BMDMs that acquired SIINFEKL peptide bound MHC-I from B6 BMDMs. (F) The percent of infected splenocytes that underwent trogocytosis in a mouse infection model (8 or 9 mice per group from 4 independent experiments). DC refers to a doublet control. (All tissue culture data are from 3–4 independent experiments performed in triplicate) (Scale bar- 10 um) (Mean +/- SD). (ns p>0.05, *p<0.05, **p<0.01, ***p<0.001)
Figure 4—figure supplement 1

Plasma membrane protein exchange increases during infection.
(A) The percent of Balb/c recipient BMDMs that acquired B6 MHC-I from F. tularensis infected or uninfected donor B6 BMDMs. (3 independent experiments performed in triplicate) (B) The percent of splenocytes that exchanged MHC-I in infected or uninfected mice (8 or 9 animals per group from 4 independent experiments). (Mean +/- SD). (*p<0.05, ***p<0.001)
Figure 4—figure supplement 2

Trogocytosis does not require de novo protein synthesis, but is inhibited by lecithin.
(A) The change in MHC-I transfer induced by infection when host (cycloheximide [CHX]) or bacteria (chloramphenicol [Chlor]) protein synthesis is inhibited. The uninfected cells were averaged for each experiment and each infected or uninfected sample was compared to this average because cycloheximide and chloramphenicol altered the basal level of MHC-I exchange. (Mean +/- SD). (n=2 independent experiments performed in triplicate) (ns p>0.05, *p<0.05, **p<0.01). (B) The percent of J774 recipient cells that underwent plasma membrane transfer in the presence or absence of 0.5% soy lecithin. DC refers to doublet control. Graph is representative of 3 independent experiments performed in triplicate (Mean +/- SD). (***p=0.001)
Figure 4—figure supplement 3

Trogocytosis in various cell types in mouse splenocytes.
The percent of Balb/c H2-Kd positive cells that had surface exposed CD45.1 in each represented population. Macrophage: F4/80+; Monocyte: F4/80-, CD11b+; Dendritic Cell: F4/80-, CD11c+; Other: F4/80-, CD11b-, CD11c-. Results for each cell type were normalized to the ‘Other’ population in that mouse, so fold change in the ‘Other’ population is always 1. Dendritic cells fold change: Uninfected = 1.3 fold +/- 0.3, Infected 1.6 fold +/- 0.3 (average +/- SD). Macrophages and monocytes were significantly more likely to undergo trogocytosis in both the infected and uninfected mice than the ‘Other’ cell types based on the raw data (p<0.05). Bars represent the mean. (8 or 9 animals per group from 4 independent experiments)
Figure 5 with 1 supplement

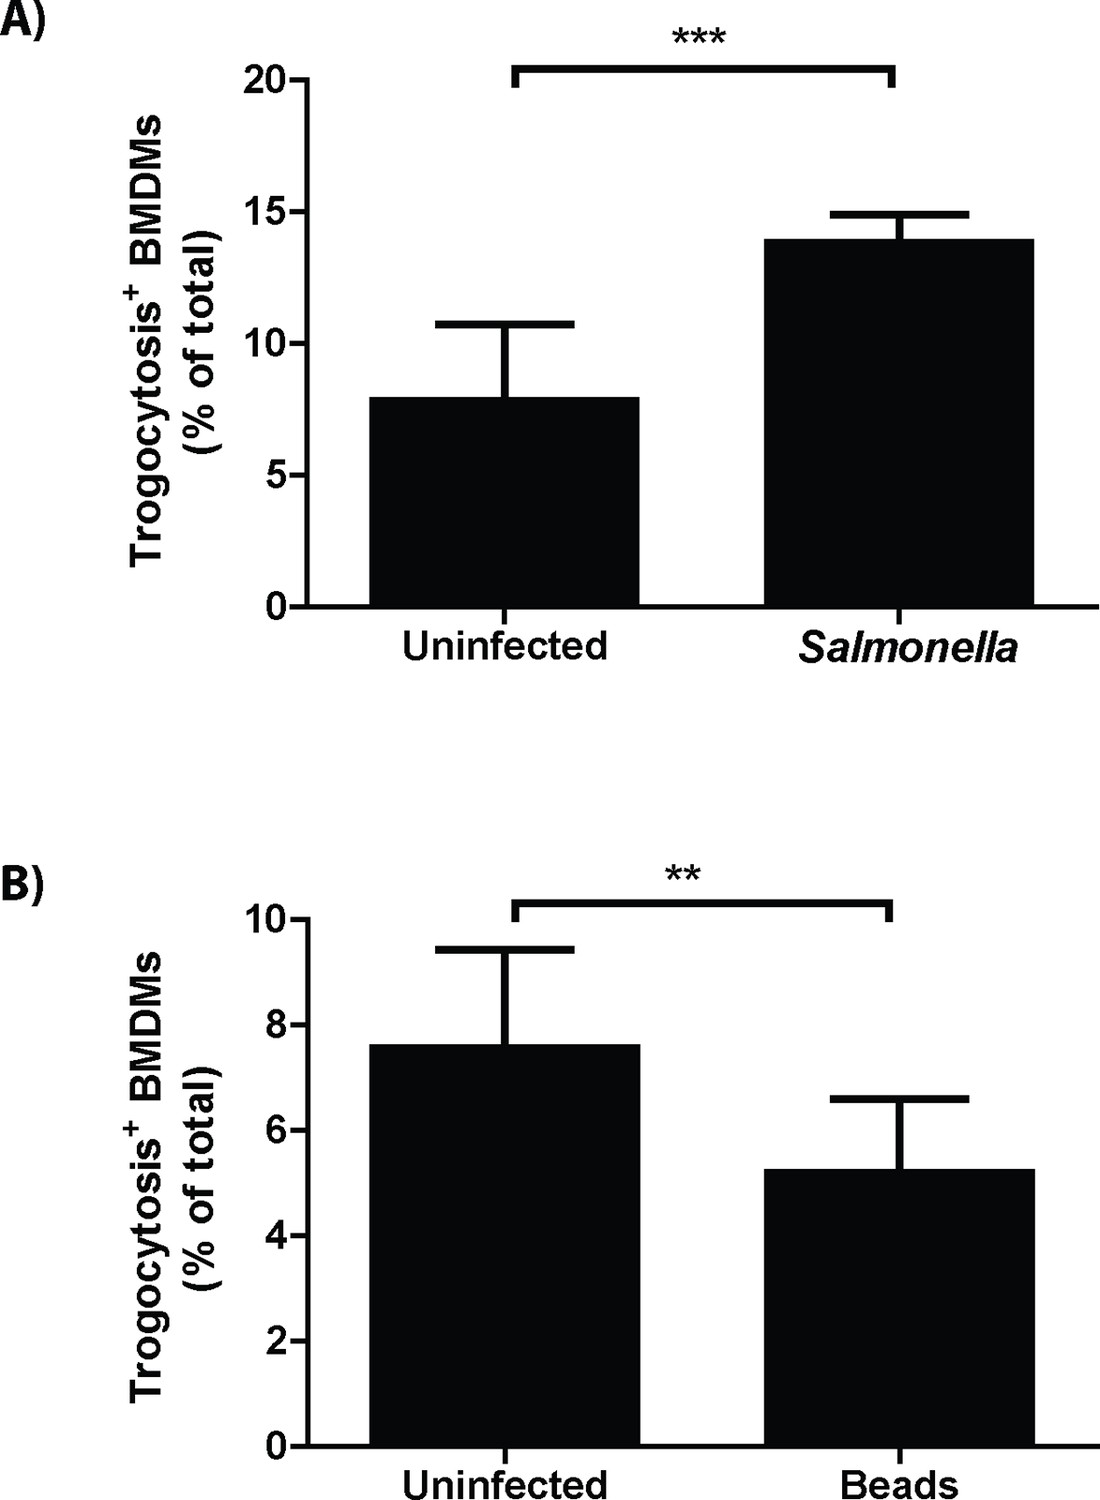
Trogocytosis – associated bacterial transfer is not restricted to F. tularensis.
The percent of recipient cells that underwent plasma membrane protein transfer in response to (A) Salmonella typhimurium or (B) fluorescent beads. The recipient BMDMs that acquired bacteria or beads grouped separately from recipient cells in the same well that did not acquire foreign material. DC refers to a doublet control. (All results from 3–4 independent experiments performed in triplicate) (Mean +/- SD). (ns p>0.05, **p<0.01, ***p<0.001)
Figure 5—figure supplement 1
Plasma membrane protein exchange increases during infection.
The percent of Balb/c recipient BMDMs that acquired B6 MHC-I from uninfected or (A) S. typhimurium or (B) bead infected donor B6 BMDMs. (Mean +/- SD). (3 independent experiments performed in triplicate) (**p<0.01, ***p<0.001).
Videos
Video 1
F. tularensis bacteria transfer from infected macrophage to neighboring cells.
Time lapse video of an F. tularensis infected J774 macrophage (top middle in opening frame) that migrates to neighboring cells, infects those macrophages, and then migrates away. F. tularensis is depicted in green, bright field in red. The time is hours: minutes post inoculation. Images were acquired every 5 min.
Video 2
F. tularensis bacteria transfer from infected macrophage to neighboring cells.
Time lapse video from an experiment separate from Video 1 depicting an F. tularensis infected J774 macrophage migrating toward neighboring cells, infects those macrophages, and then migrating away. F. tularensis is depicted in green, bright field in red. The time is hours: minutes post inoculation. Images were acquired every 5 min.
Download links
A two-part list of links to download the article, or parts of the article, in various formats.
Downloads (link to download the article as PDF)
Open citations (links to open the citations from this article in various online reference manager services)
Cite this article (links to download the citations from this article in formats compatible with various reference manager tools)
Trogocytosis-associated cell to cell spread of intracellular bacterial pathogens
eLife 5:e10625.
https://doi.org/10.7554/eLife.10625


