SOX2 O-GlcNAcylation alters its protein-protein interactions and genomic occupancy to modulate gene expression in pluripotent cells
- University of California, San Francisco, United States
- Gladstone Institute University of California, San Francisco, United States
- Kyoto University, Japan
Figures
Figure 1 with 7 supplements
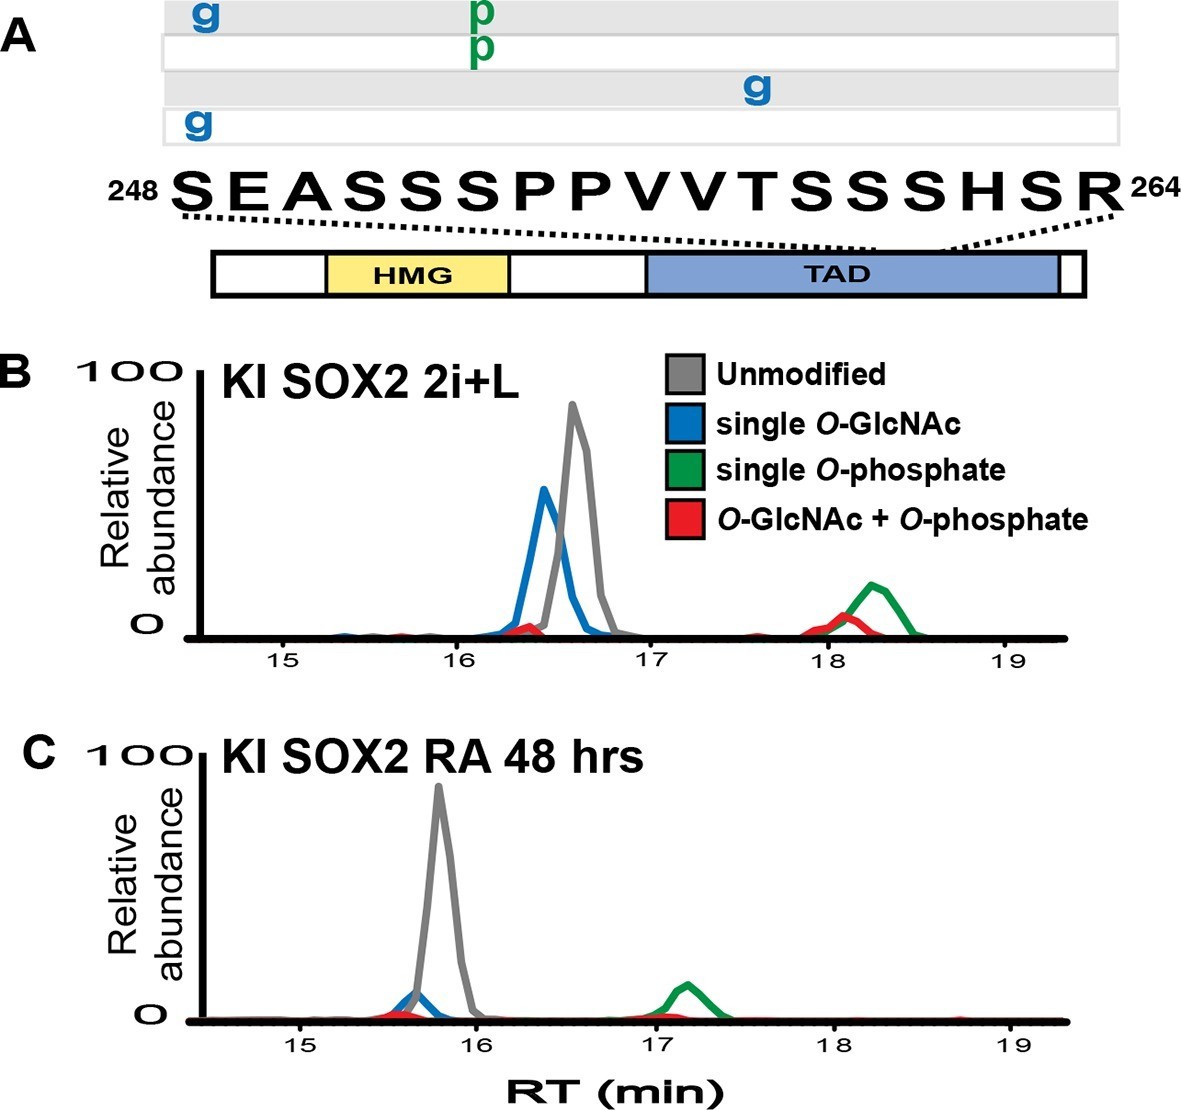
SOX2 O-GlcNAc levels change during differentiation.
(A) Diagram of SOX2 (bottom, with TAD and high mobility group DNA binding domain [HMG] indicated), the TAD peptide sequence (middle; amino acid numbering from the Uniprot accession number P48432), and the PTM isoforms identified on the TAD peptide (top, grey and white rectangles, g indicates O-GlcNAc and p indicates phosphate). Mass spectra can be seen in Figure 1—figure supplement 1. (B) and (C) Extracted ion chromatographs (XICs) of SOX2 TAD peptide PTM states from (B) undifferentiated KI SOX2 mESCs (2i+L) or (C) differentiated KI SOX2 mESCs (RA 48 hr). Traces for each PTM isoform are colored differently, key provided in the inset in (B).
Figure 1—figure supplement 1
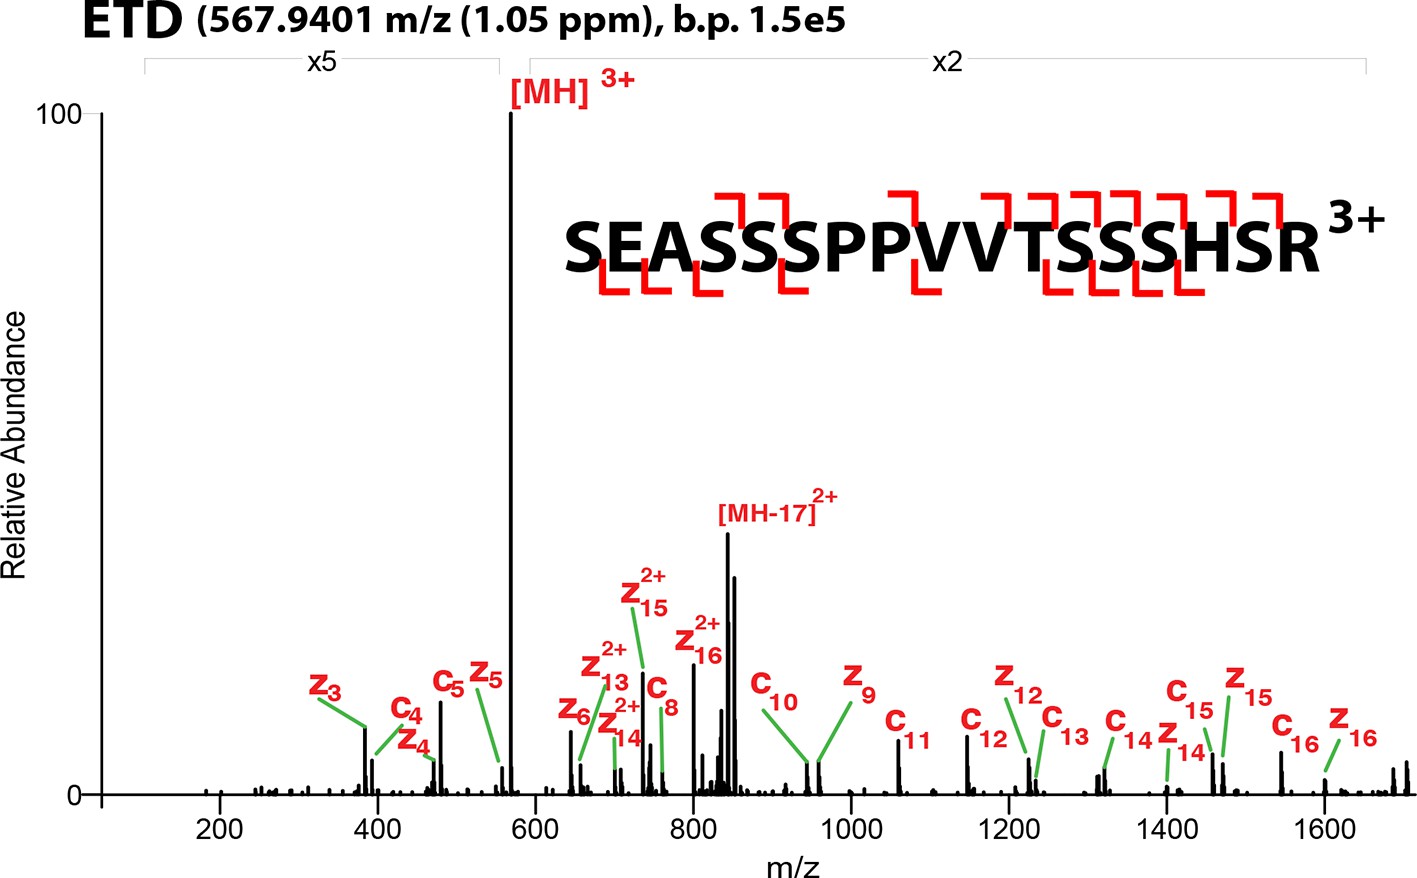
ETD-MS/MS spectra of SOX2 unmodified TAD peptide described in Figure 1A.
Proton transfer species are not labeled, ppm, parts per million; b.p., base peak.
Figure 1—figure supplement 2
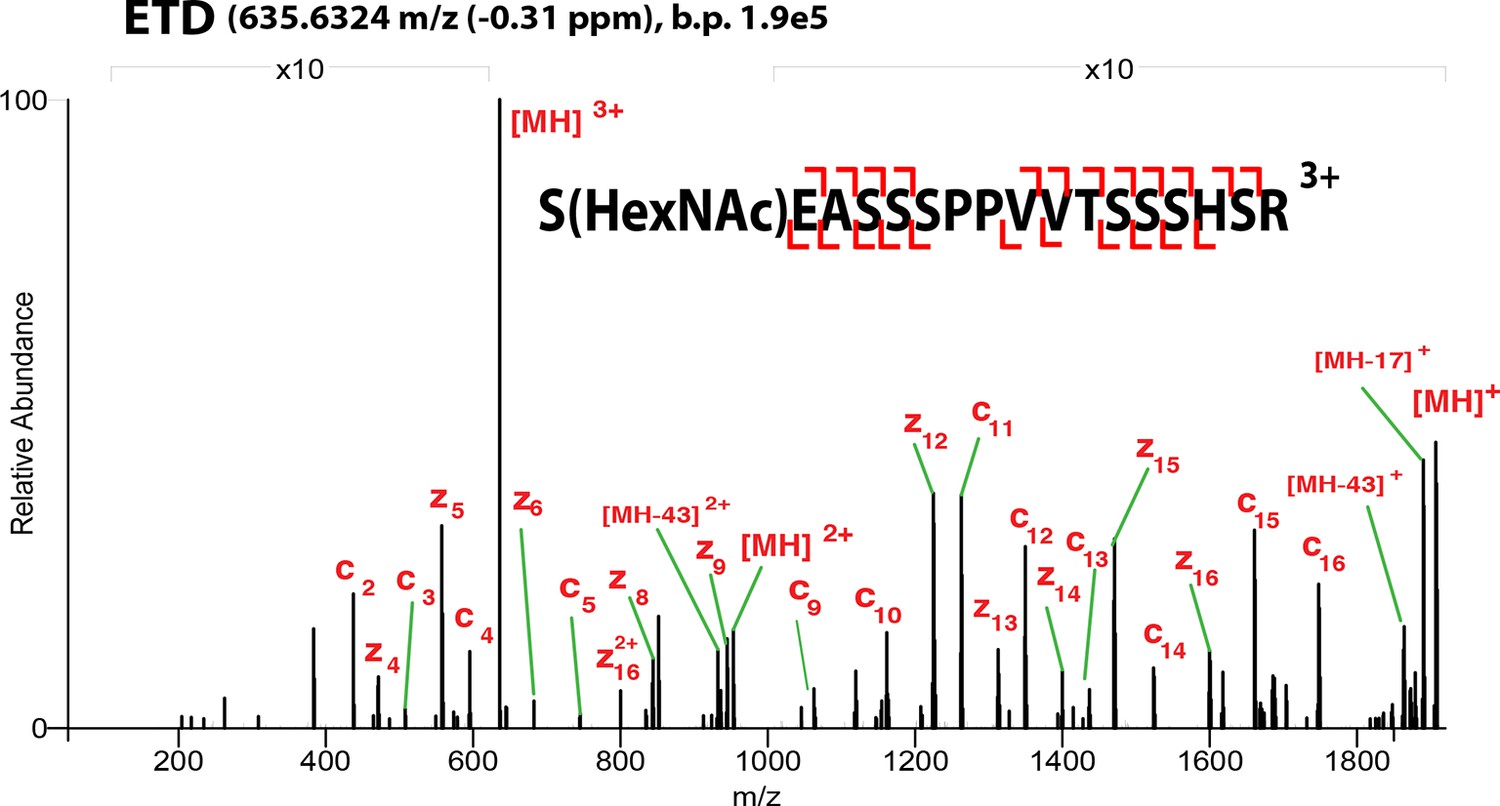
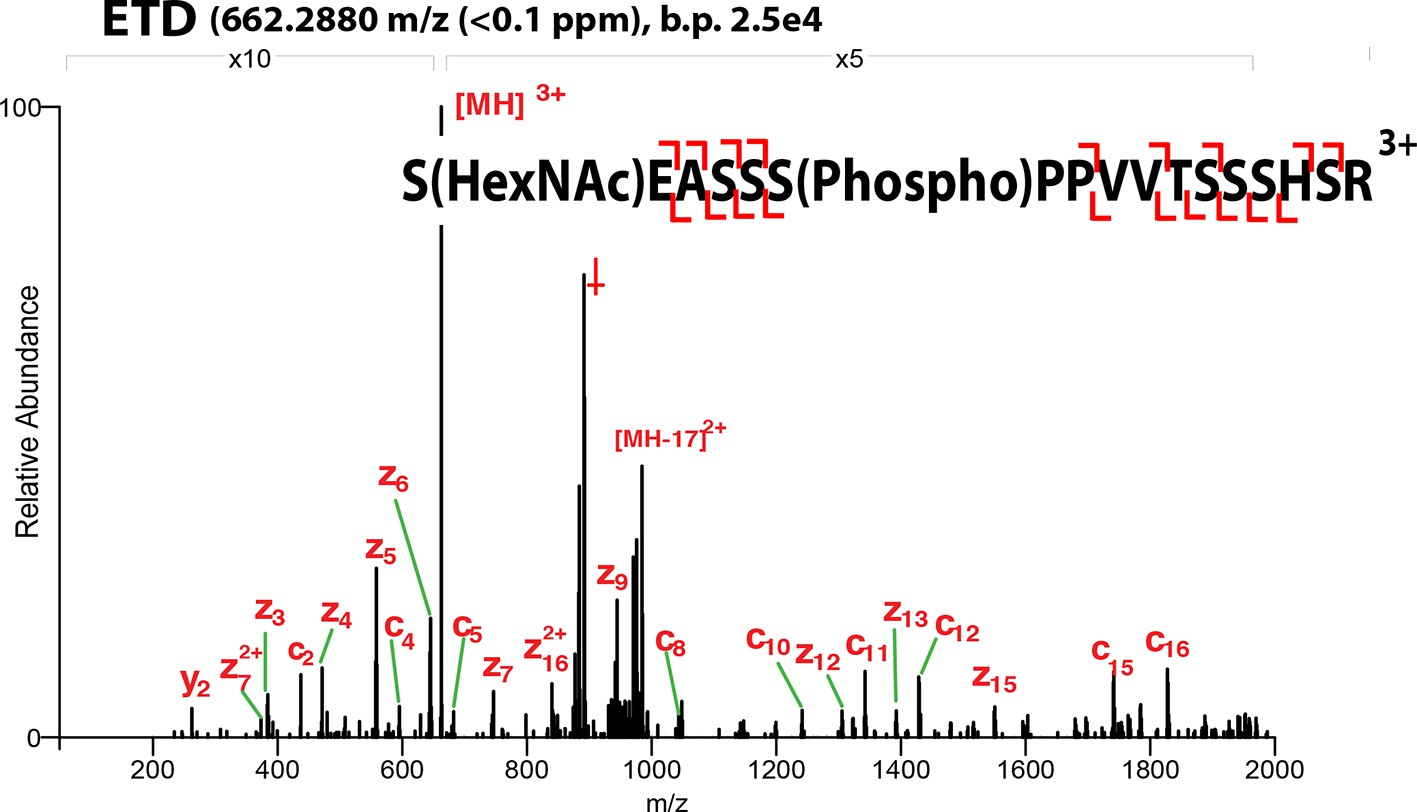
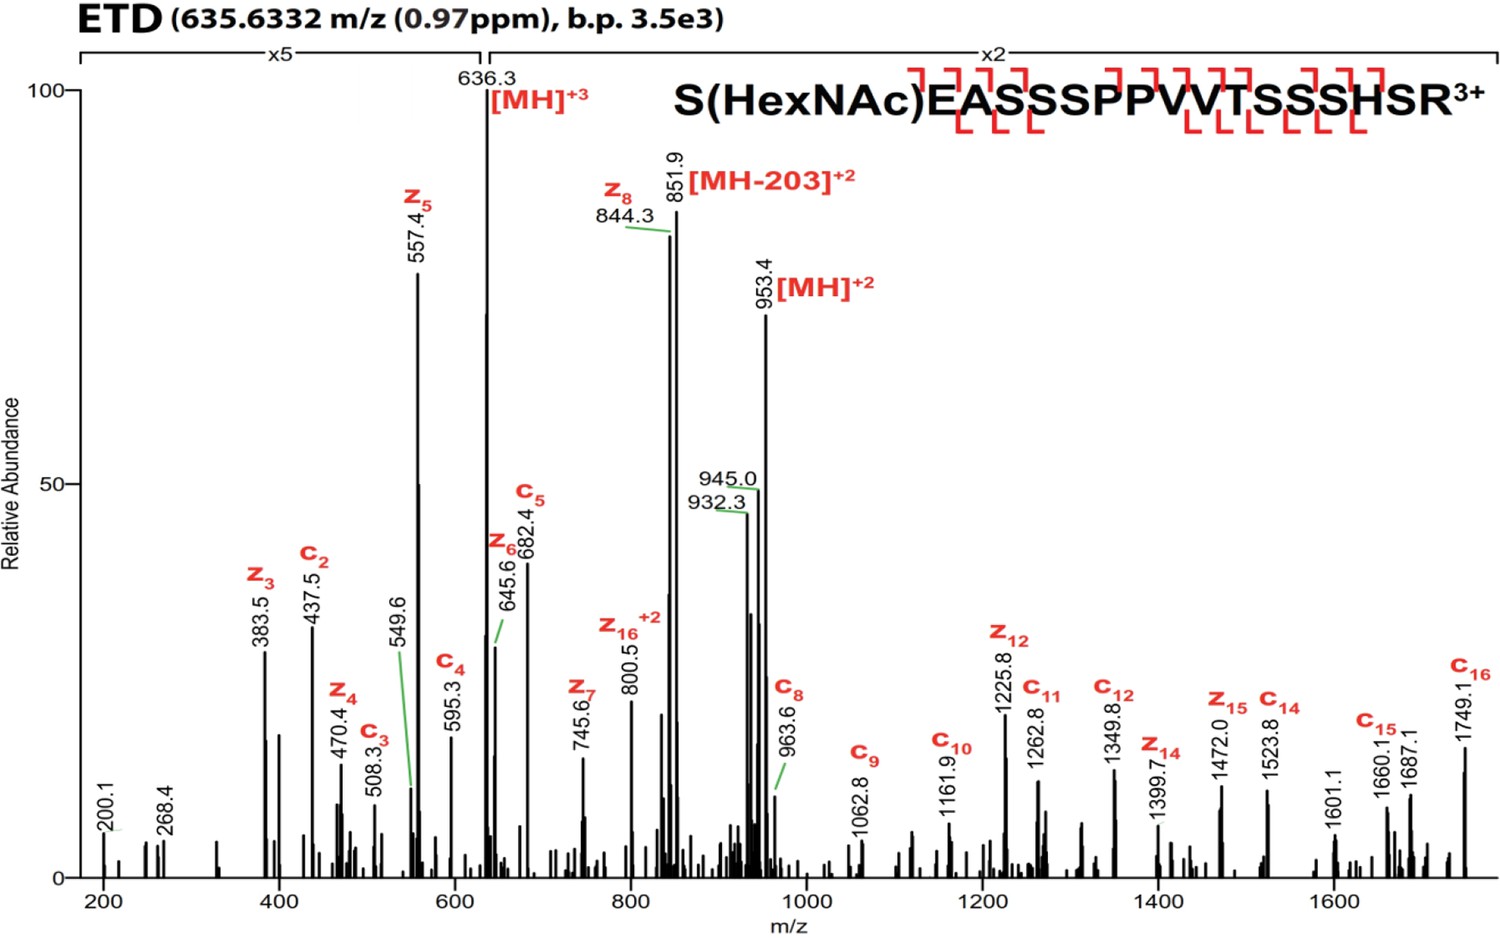
ETD-MS/MS spectra of SOX2 GlcNAc-S248 TAD peptide described in Figure 1A.
Proton transfer species are not labeled, ppm, parts per million; b.p., base peak.
Figure 1—figure supplement 3
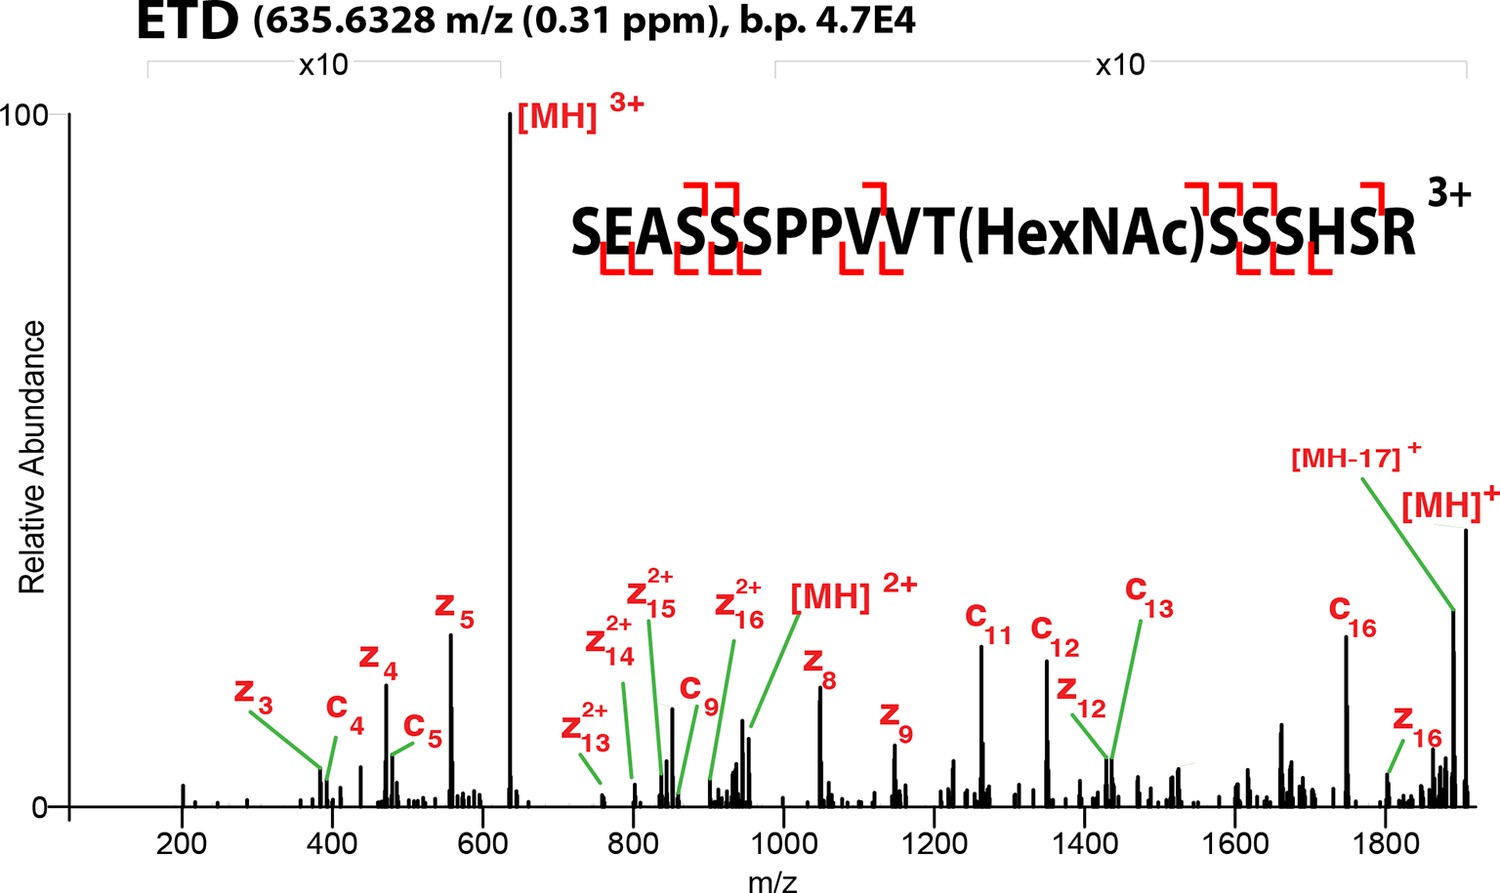
ETD-MS/MS spectra of SOX2 GlcNAc-T258 TAD peptide described in Figure 1A.
Proton transfer species are not labeled, ppm, parts per million; b.p., base peak.
Figure 1—figure supplement 4
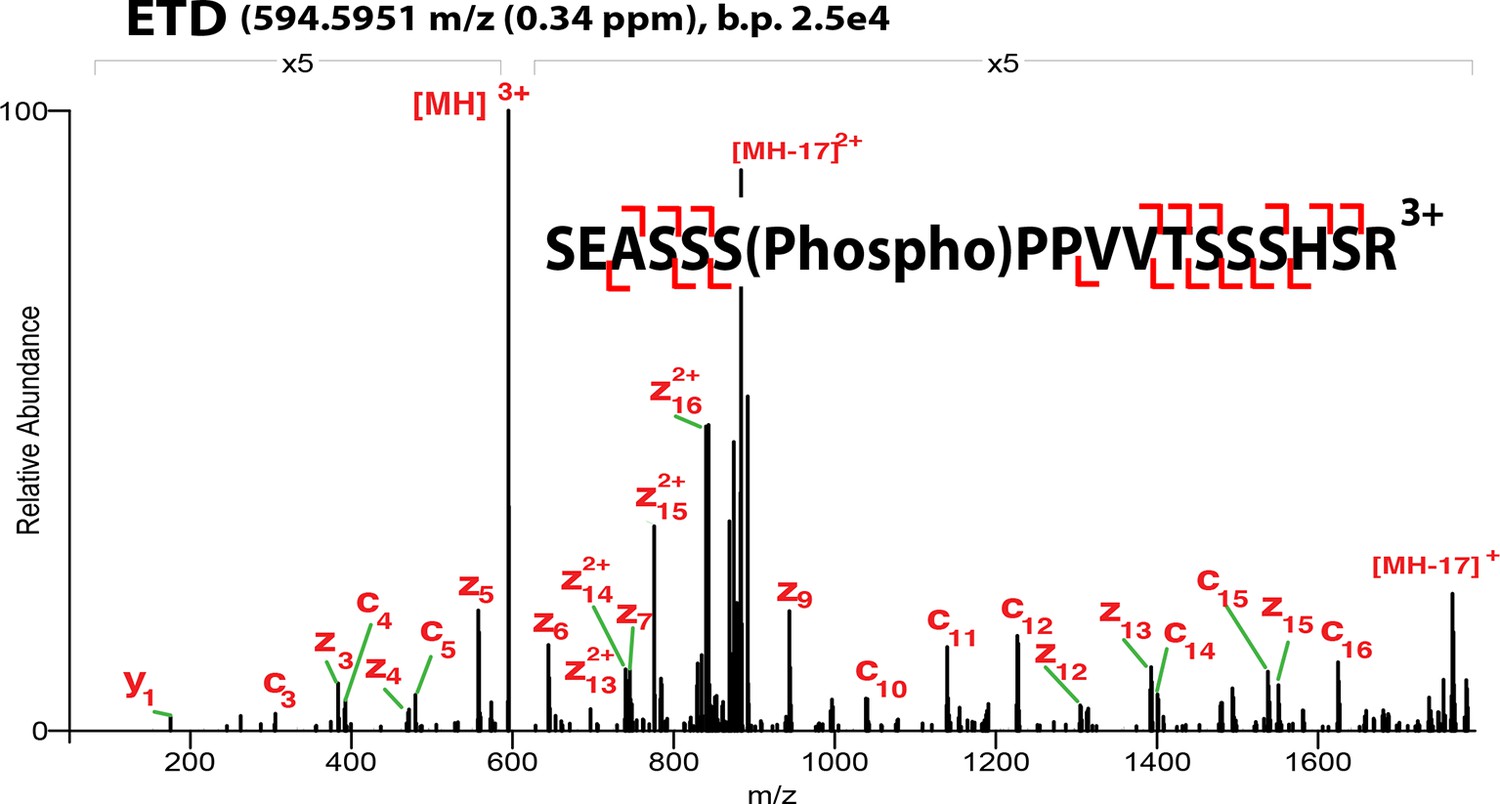
ETD-MS/MS spectra of SOX2 phospho-S253 TAD peptide described in Figure 1A.
Proton transfer species are not labeled, ppm, parts per million; b.p., base peak.
Figure 1—figure supplement 5
ETD-MS/MS spectra of SOX2 co-modified GlcNAc-S248/phospho-S253 TAD peptide described in Figure 1A.
Proton transfer species are not labeled, ppm, parts per million; b.p., base peak, † indicates co-isolating contamination peak.
Figure 1—figure supplement 6
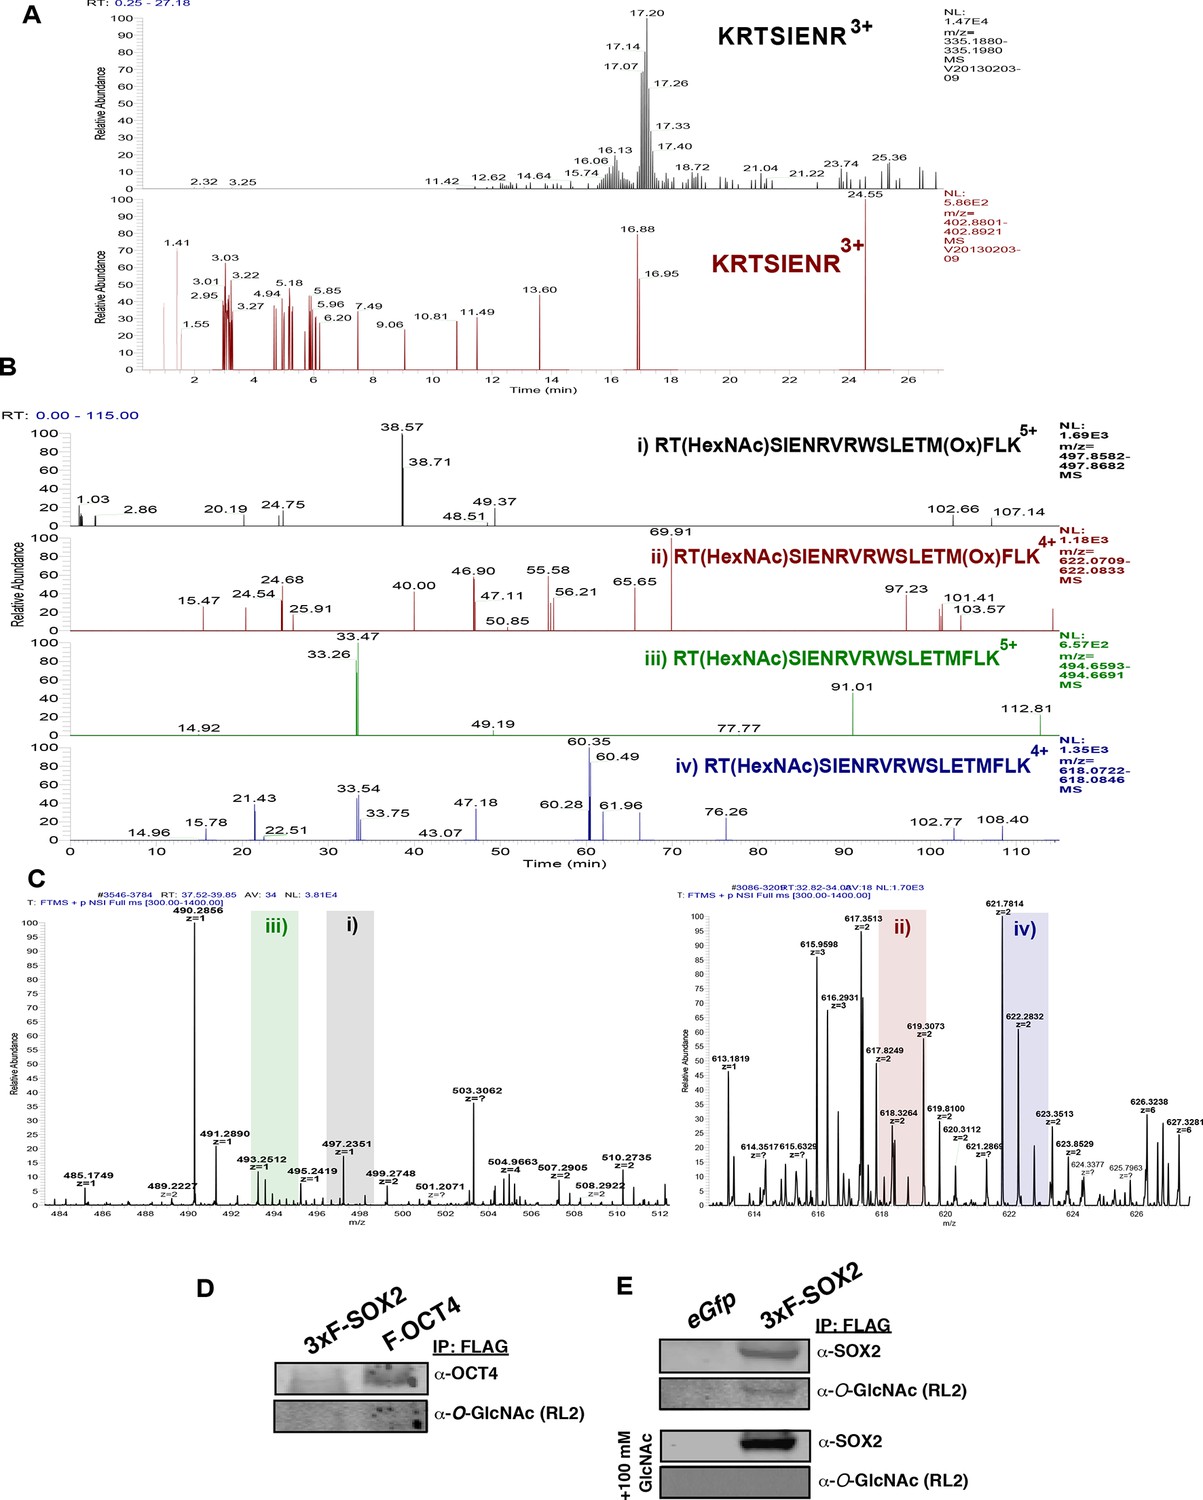
O-GlcNAcylation of OCT4 at T228 is undetectable in mESCs.
OCT4 was FLAG-affinity purified from ZHBTc4 F-Oct4 ESCs (the same cell line employed in [Jang et al., 2012]), which express FLAG-tagged OCT4. Peptides containing T228, the residue reported to be O-GlcNAcylated (Jang et al., 2012), were analyzed by LC-MS/MS. (A) XICs (10 ppm) for predicted m/z of an unmodified tryptic peptide containing T228 (top, black panel) and the proposed O-GlcNAc modified peptide (bottom, red panel). XICs show the signal for the unmodified peptide, but no signal for the O-GlcNAc modified version. (B) XICs (10 ppm) for m/z of predicted O-GlcNAc modified LysC-derived peptides containing T228 is not detectable (two charge states, with and without Met oxidation). (C) Zoom of MS1 scans from Figure supplement 6B where potential signal would exists. No signal with the appropriate charge state was detected for any LysC derived peptide indicating all signal in B is background. (D) Western blot analysis of purified FLAG-tagged OCT4 from ZHBT c4 F-OCT4 mESCs failed to detect O-GlcNAcylation. (E) Western blot analysis of 3xF-SOX2 purified from OSFLAG-WTKM transduced MEFs detects SOX2 O-GlcNAcylation, which can be blocked by the addition of 100 mM free GlcNAc to the primary antibody incubation.
Figure 1—figure supplement 7
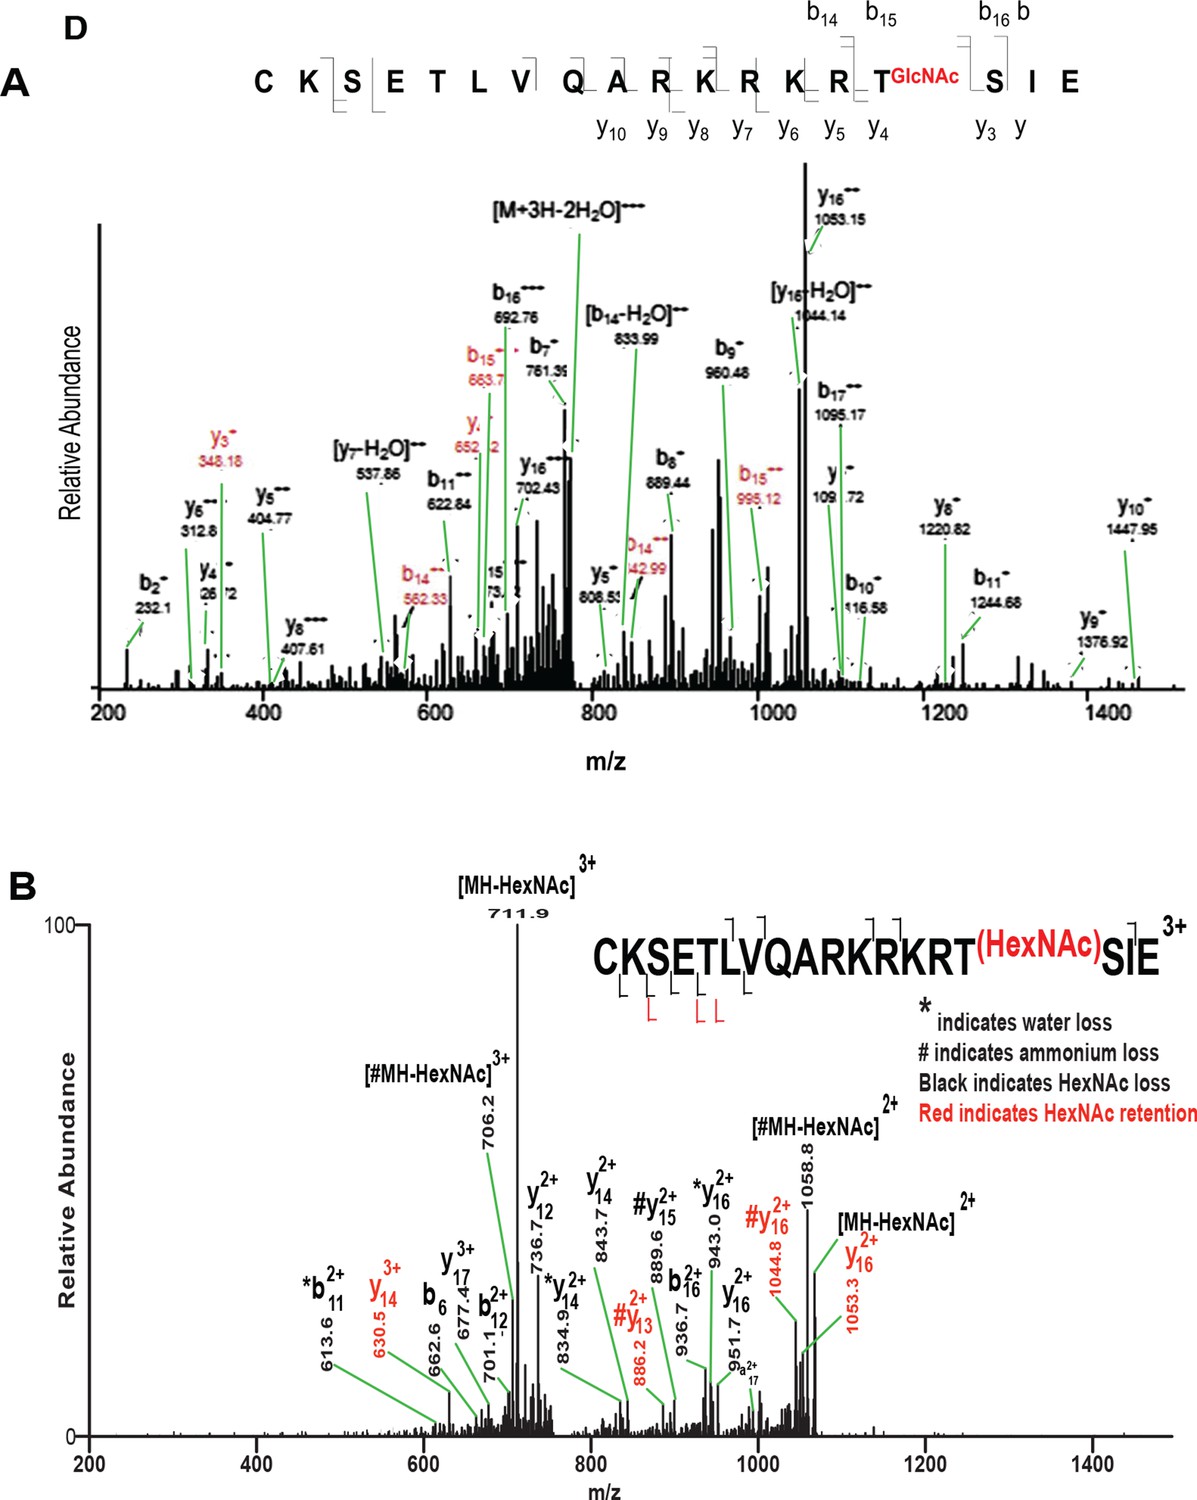
Incorrect assignment of GluC digest OCT4 peptide mass spectrum containing T228.
(A) Modified mass spectrum from Jang et al. identifying OCT4 T228 as O-GlcNAc modified (Figure 3D; Cell Stem Cell 17 May 2012 [doi: 10.1016/j.stem.2012.03.001]). Problematic issues are 1) discrepancy with well-established fragmentation patterns for O-linked glycopeptides; 2) confusing labeling of peaks (original black arrows, which obscured peak identifications, were changed to green for this figure); 3) incorrect peptide sequence. GluC digestion should yield ICKSETLVQARKRKRTSIE, where the initial Ile is missing from the Jang et al. assignment; 4) only OCT4 peptide sequences were searched increasing false positive rates; and 5) the precursor mass and charge state were not reported making the data uninterpretable. (B) Ion trap CAD mass spectrum of synthetic glycopeptide of the reported amino acid sequence shows the original spectrum in Jang et al. was misinterpreted.
Figure 2 with 2 supplements
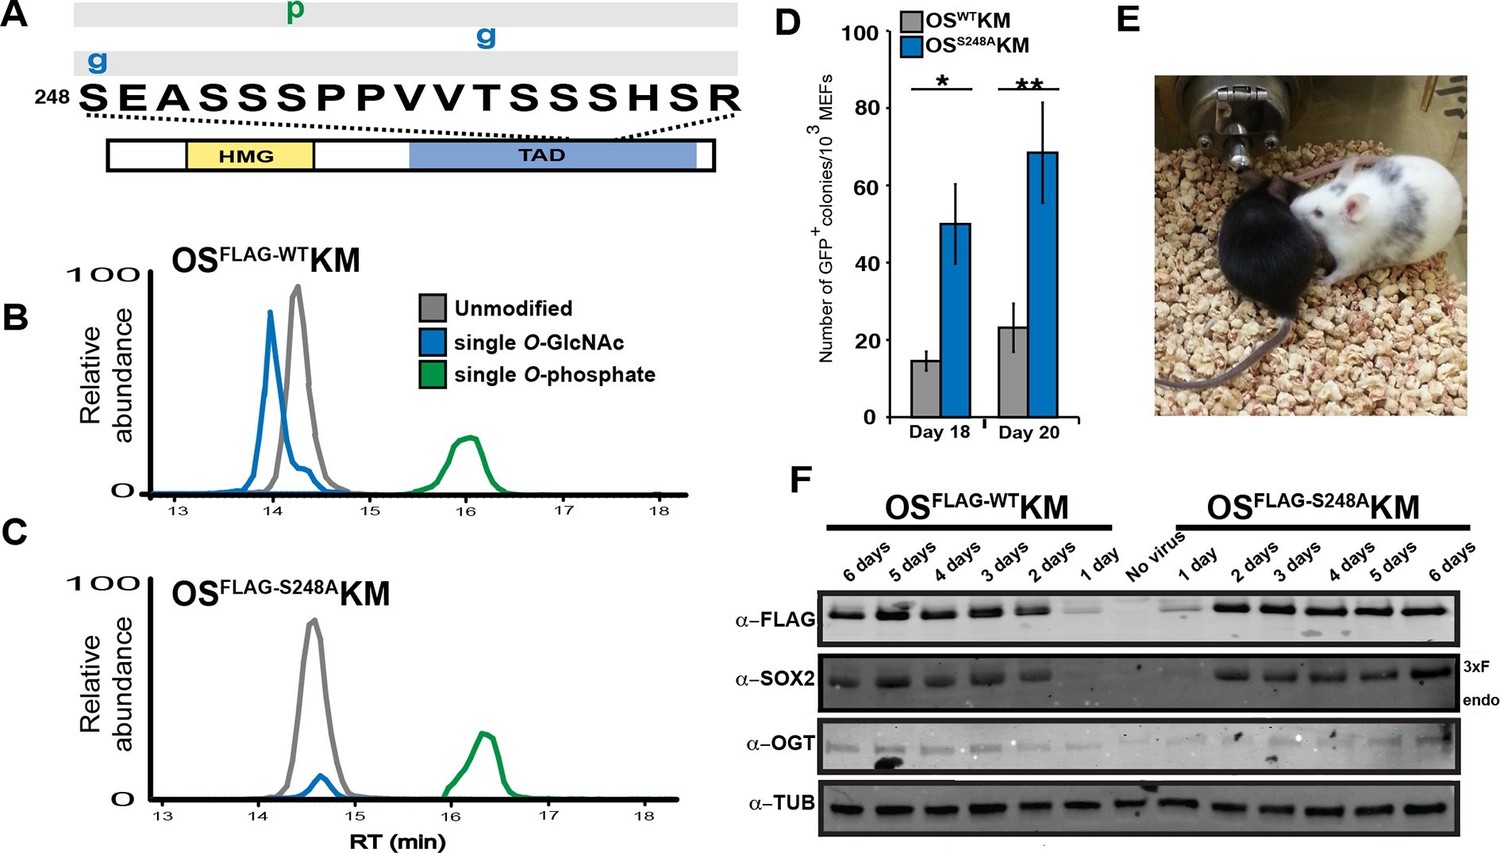
O-GlcNAc-deficient SOX2, SOX2S248A, increases somatic cell reprogramming efficiency.
(A) Diagram of SOX2 and the PTMs identified from MEFs transduced with OSFLAG-WTKM, labeled as described in Figure 1A. Spectra can be found at tinyurl.com/iPSC-3xF-SOX2-ETD and tinyurl.com/iPSC-3xF-SOX2-HCD. (B) XICs of 3xF-SOX2WT TAD peptide PTM states from OSFLAG-WTKM-transduced MEFs. (C) XICs of 3xF-SOX2S248A TAD peptide PTM states from OSFLAG-S248AKM-transduced MEFs. Color key the same as in (B). (D) Number of GFP+ colonies from 1000 Nanog-Gfp MEFs transduced with OSWTKM or OSS248AKM and cultured on SNL feeders for 18 or 20 days (n=7 +/- S.E.M.). (E) Chimeric mouse derived from iPSCs obtained from transducing Nanog-Gfp MEFs with OSS248AKM and his black offspring, demonstrating germline transmission. (F) Western blots against FLAG, SOX2, OGT and TUBULIN for the first six days of reprogramming with either OSFLAG-WTKM or OSFLAG-S248AKM. “Endo” refers to the apparent molecular weight at which the endogenous SOX2 would be expected, “3xF” refers the the FLAG tagged version from the viral transduction.
Figure 2—figure supplement 1
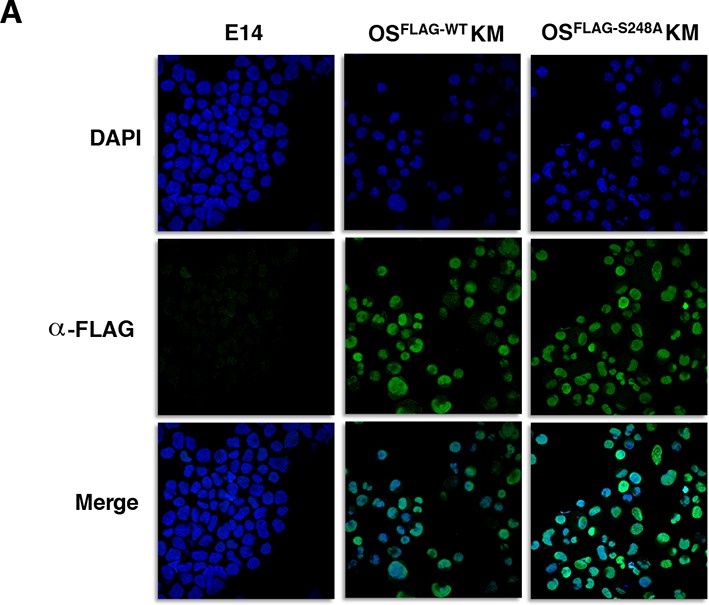
Immunofluorescence staining against FLAG in MEFs six days after transduction with either OSFLAG-WTKM or OSFLAG-S248AKM shows similar nucleocytoplasmic distribution.
E14 mESCs are used as a staining negative control.
Figure 2—figure supplement 2
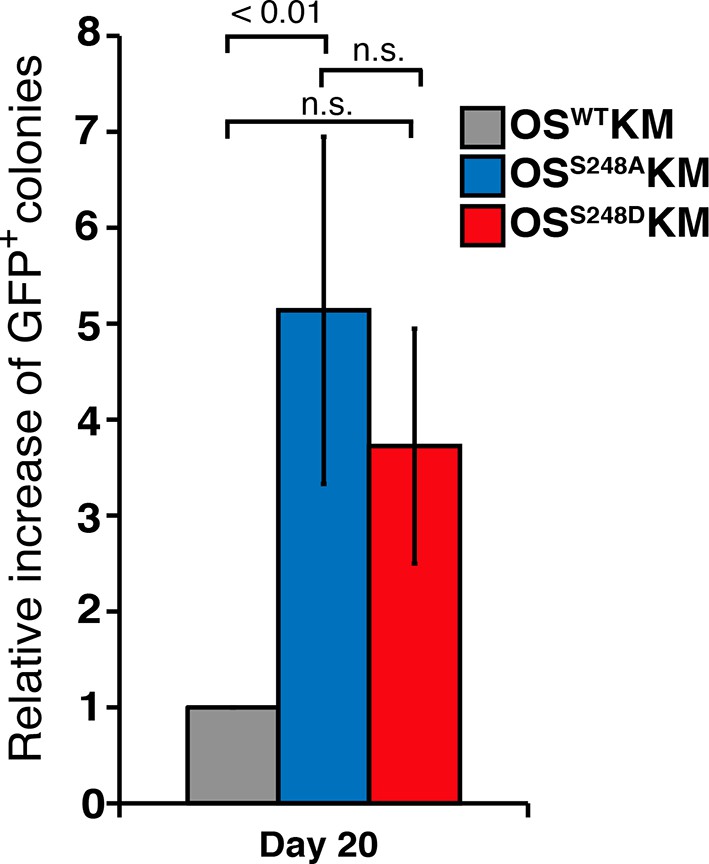
SOX2S248D also increases somatic cell reprogramming efficiency.
Relative increase, compared to OSWTKM, in number of GFP+ colonies from 1000 Nanog-Gfp MEFs that were infected with OSS248AKM or the phosphomimetic OSS248DKM and cultured on SNL feeders for 20 days after infection (n=7 for OSWTKM and OSS248AKM, two for OSS248DKM).
Figure 3 with 3 supplements
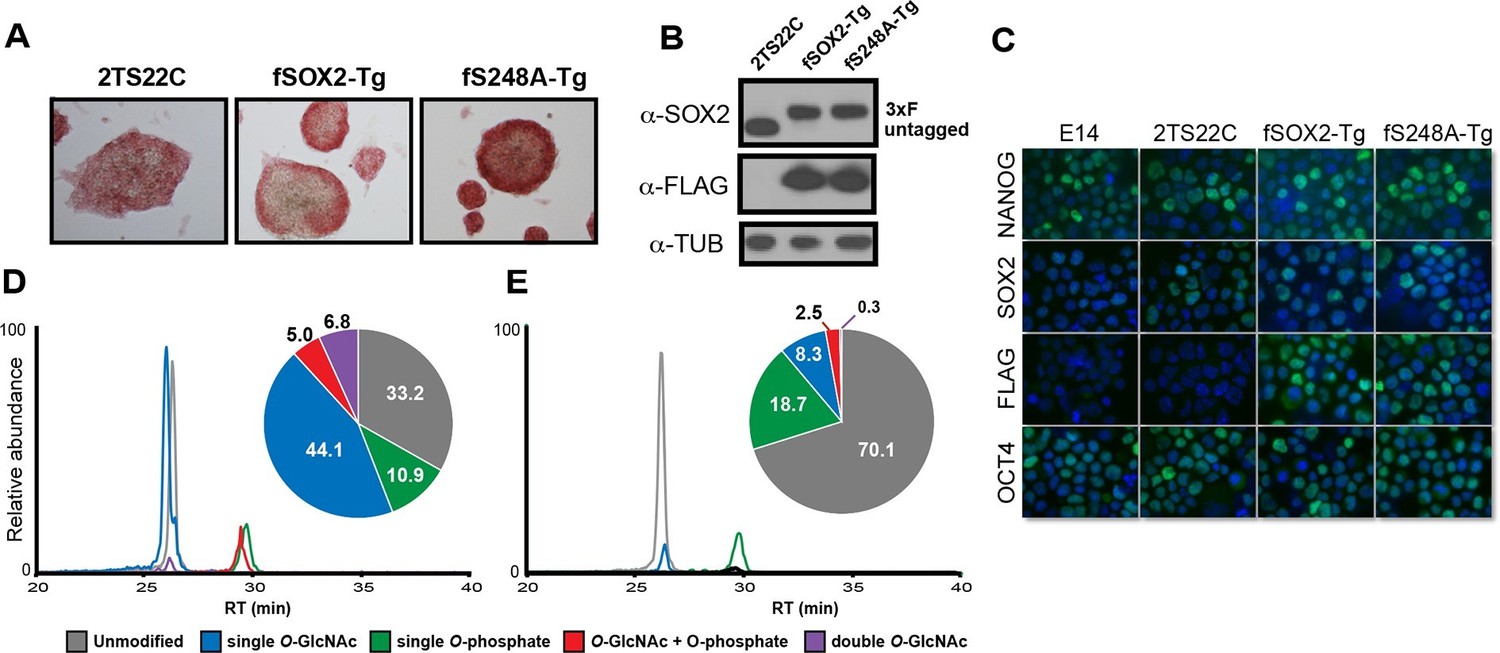
SOX2S248A can replace wild type SOX2 in mESCs.
(A) Characterization of fSOX2-Tg and fS248A-Tg mESCs. fSOX2-Tg and fS248A-Tg mESCs exhibit AP staining, a marker of pluripotency, similar to parental 2TS22C cells. (B) Western blot analysis of SOX2 and FLAG in 2TS22C, fSOX2-Tg and fS248A-Tg mESCs. TUBULIN (TUB) is used as a loading control. “3xFLAG” and “untagged” refer to expected molecular weights of SOX2 with the 3xFLAG tag or no tag, respectively. (C) Immunofluorescence staining for NANOG, SOX2, FLAG and OCT4 in wild type E14, parental 2TS22C, fSOX2-Tg, and fS248A-Tg mESCs. Antibody staining is green, nuclear stain with DAPI is blue. (D) and (E) XICs of the TAD peptides of SOX2 immunopurified from fSOX2-Tg (D) and fS248A-Tg (E) mESCs. Insets: pie charts showing the mean percentage of each PTM form to total TAD peptide signal (n=3). The doubly phosphorylated TAD peptide is below the limit of quantitation for both cell lines.
Figure 3—figure supplement 1
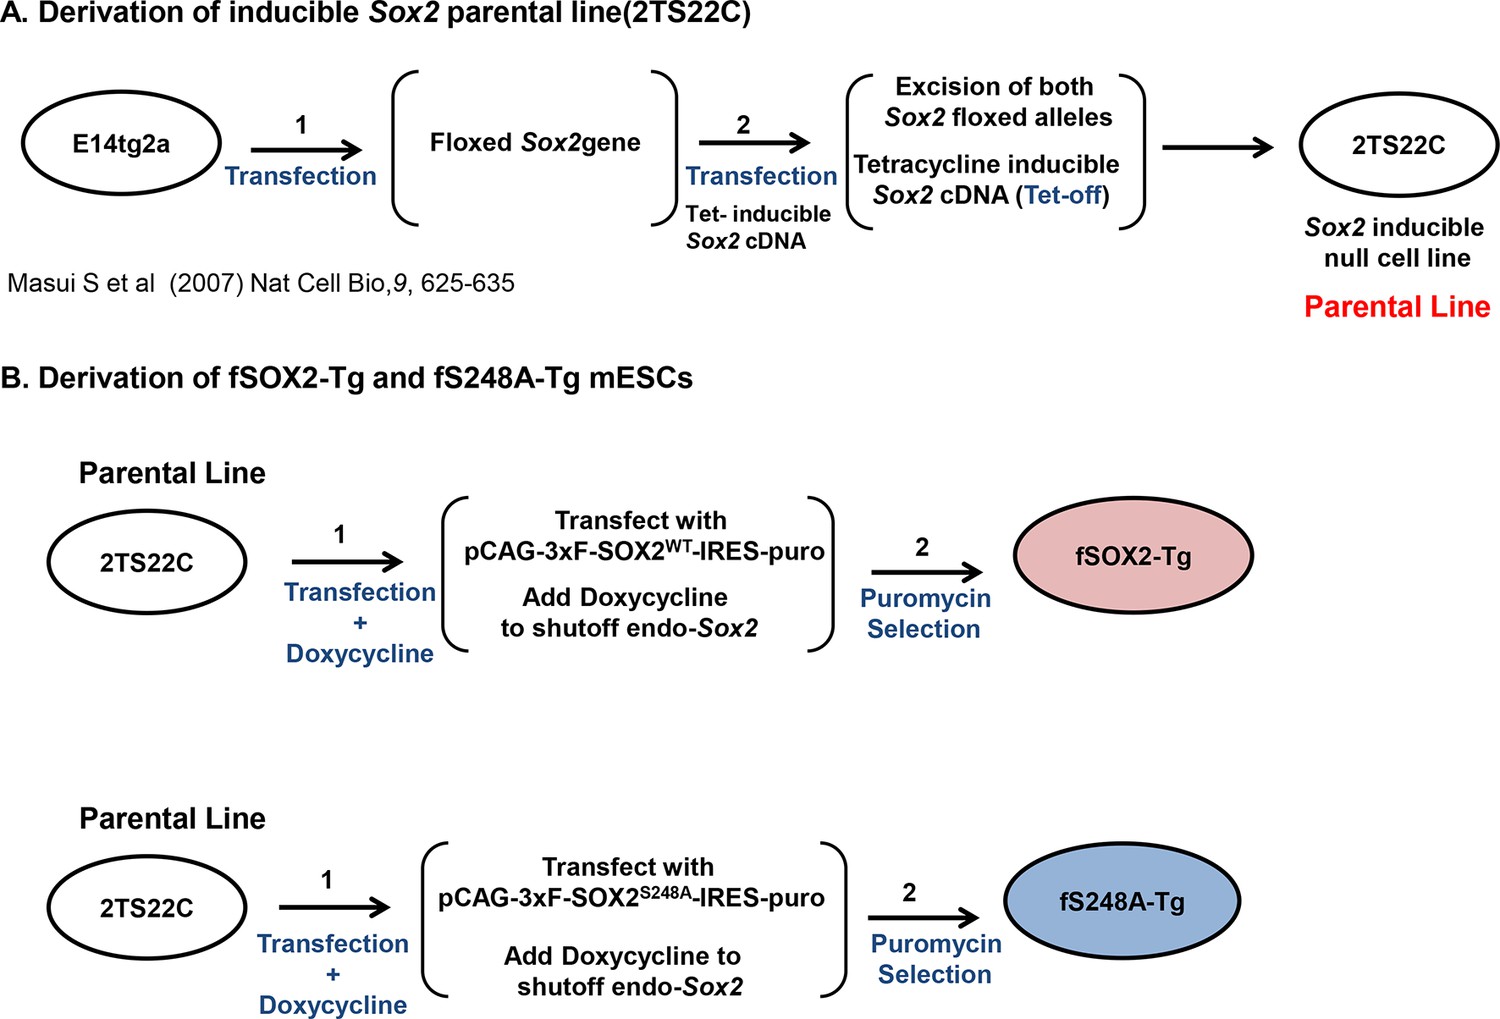
Diagram of creation of fSOX2-Tg or fS248A-Tg lines.
(A) Derivation of 2TS22C mESCs, which are deleted for endogenous copies of Sox2 and express tetracycline-off (tet-off) transgenic Sox2, summarized from (Masui et al., 2007). (B) 2TS22C cells were transfected with the constructs pCAG-3xF-SOX2WT-IRES-puroR (upper) or pCAG-3xF-SOX2S248A-IRES-puroR (lower), in which Sox2 expression is driven by the CAG promoter. After 24 hr, doxycycline was added to cultures to repress the tet-regulated copy of SOX2 expressed by the parental line 2TS22C. 48 hr after transfection, puromycin was added to cultures to select for stable integrants. After two weeks, colonies with ESC-like colony morphology were expanded and characterized for SOX2 expression.
Figure 3—figure supplement 2
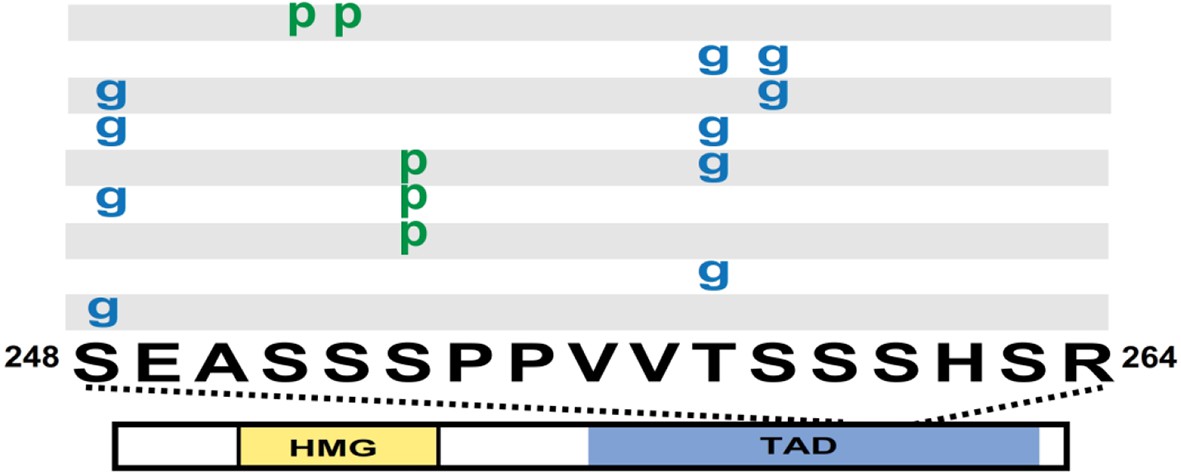
Diagram of SOX2 and the PTMs identified from fSOX2-Tg cells, labeled as described in Figure 1A.
Spectra can be found at tinyurl.com/3xF-SOX2-ETD and tinyurl.com/3xF-SOX2-HCD.
Figure 3—figure supplement 3
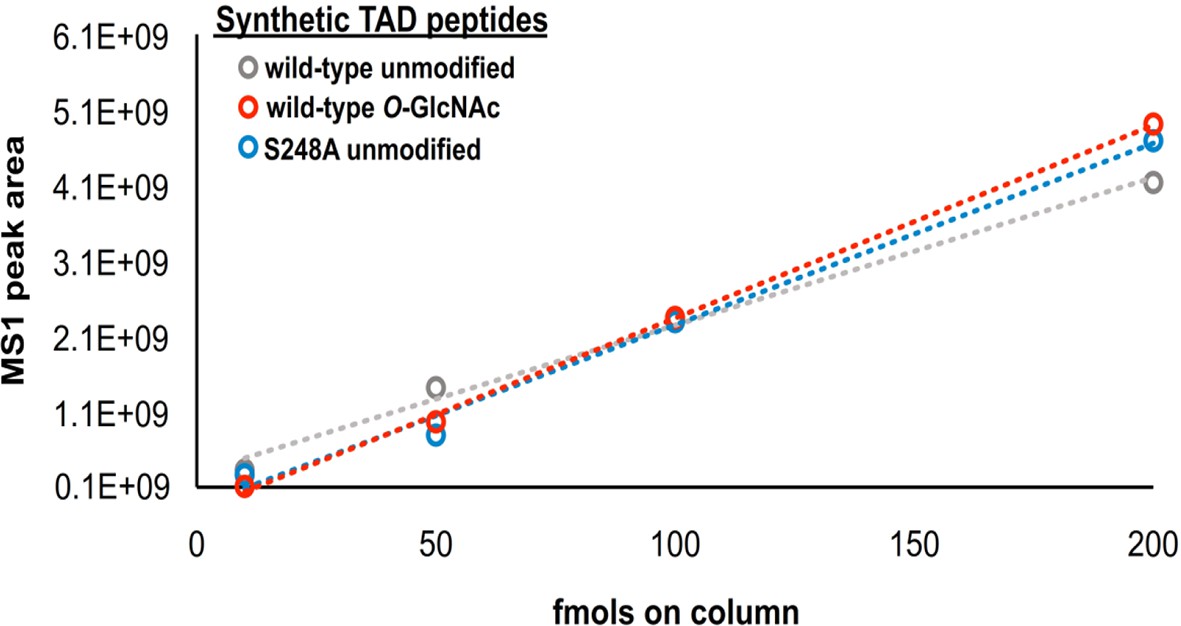
Label-free MS1 analysis of synthetic SOX2 TAD peptides.
The WT unmodified (grey), WT O-GlcNAc modified (red) and S248A unmodified peptides (blue) were loaded at known concentrations and the MS1 peak area was plotted.
Figure 4 with 1 supplement
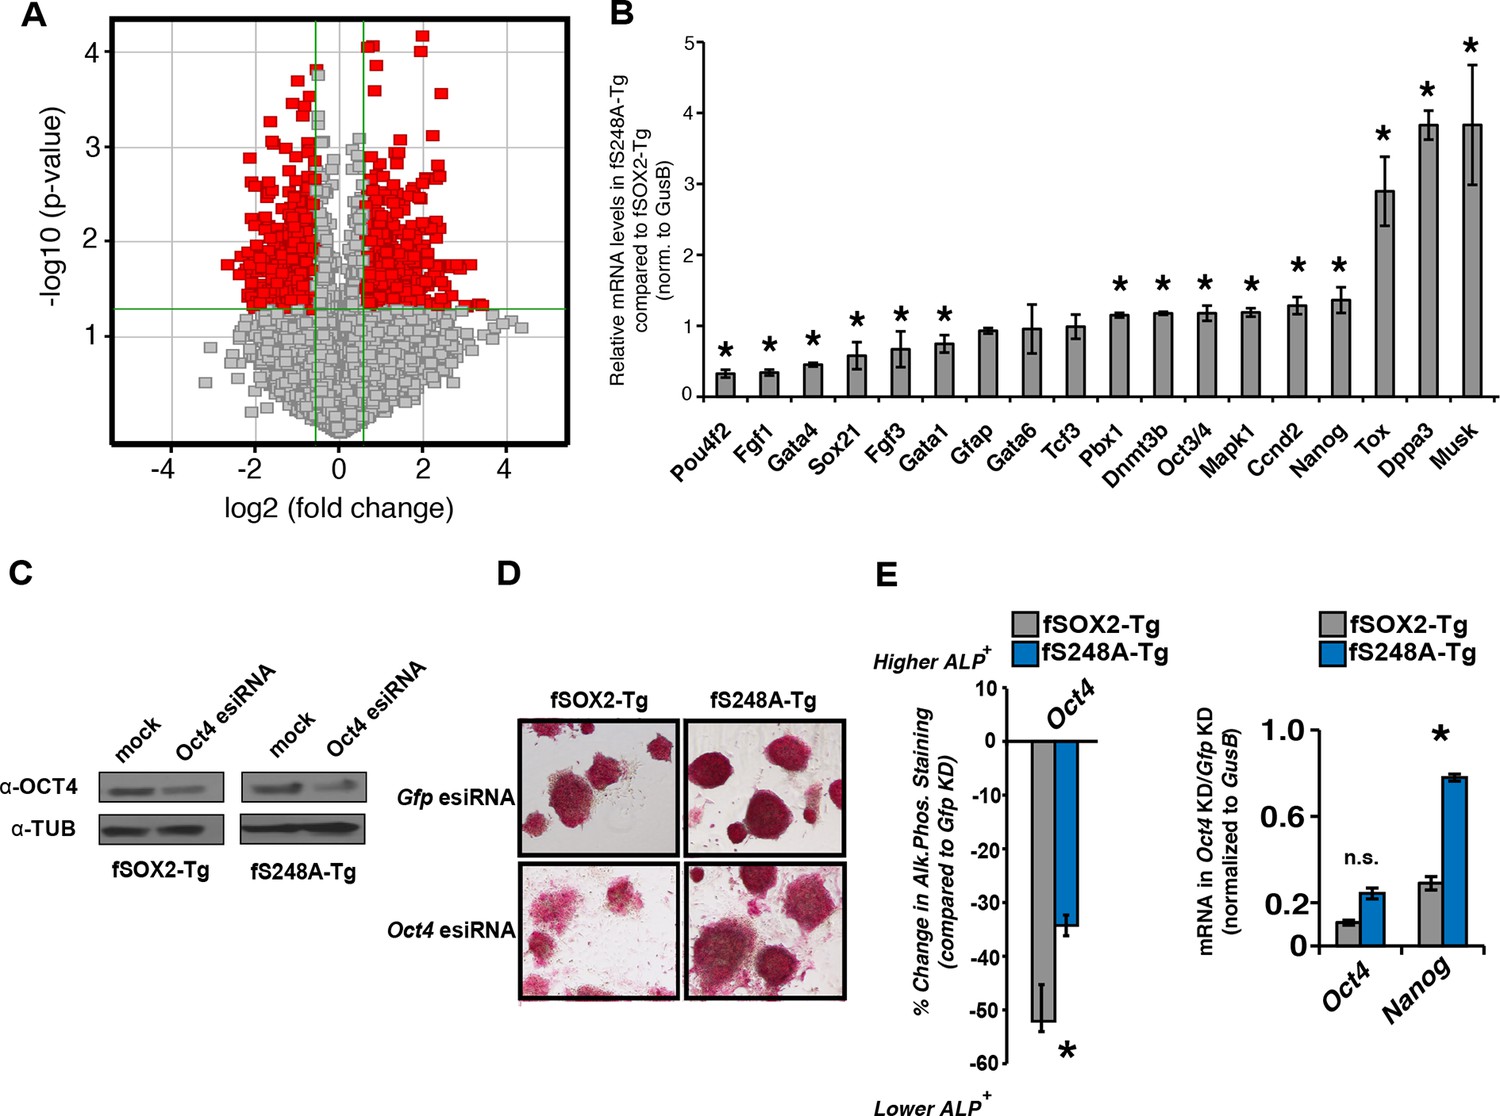
fS248A-Tg mESCs show altered gene expression and decreased dependence on OCT4.
(A) Volcano plot of global changes in gene expression between fSOX2-Tg and fS248A-Tg cells. Red indicates genes with increased or decreased expression (fold change cutoff 1.5 and paired t-test p<0.05) (Supplementary file 1a). (B) RT-qPCR of select genes differentially expressed between fSOX2-Tg and fS248A-Tg cells (* indicates p<0.05, n=3, +/- S.E.M.). (C) fSOX2-Tg or fS248A-Tg cells were depleted of OCT4 using siRNA pools (esiRNAs) and Western blot analysis of OCT4 and TUBULIN were performed. (D) and (E), (D) AP staining and (E) quantitation of fold change in AP staining three days after OCT4 or GFP depletion in fSOX2-Tg and fS248A-Tg cells. Additional example fields of view for relative quantitation can be seen in Figure 4—figure supplement 1. F, RT-qPCR analysis of Oct4 and Nanog mRNA levels in fSOX2-Tg or fS248A-Tg cells depleted of OCT4 compared to the control knockdown of GFP.
Figure 4—figure supplement 1
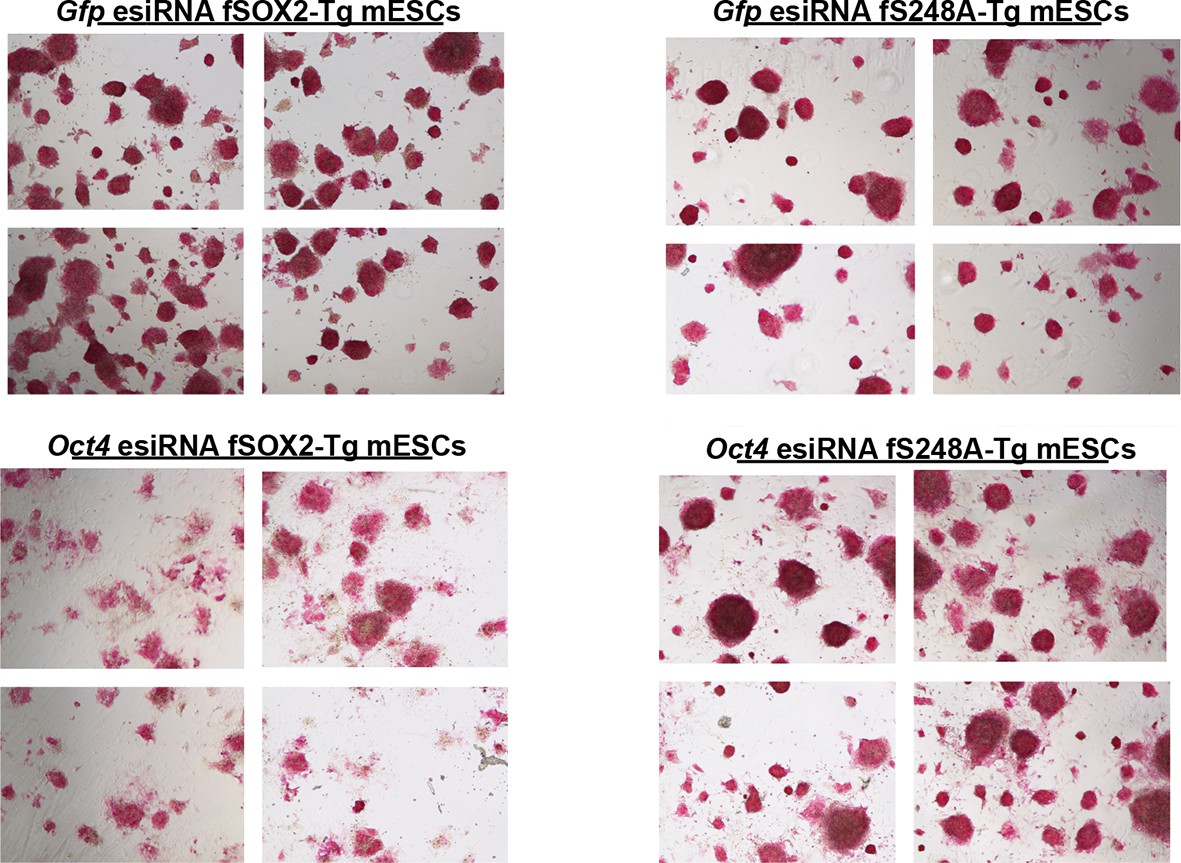
AP activity staining of fSOX2-Tg and fS248A-Tg cells three days after Gfp or Oct4 knockdown.
Four fields of view, shown here, were used for relative AP stain quantitation for a representative replicate. Mock knockdown (Gfp) was used as the baseline for AP staining.
Figure 5
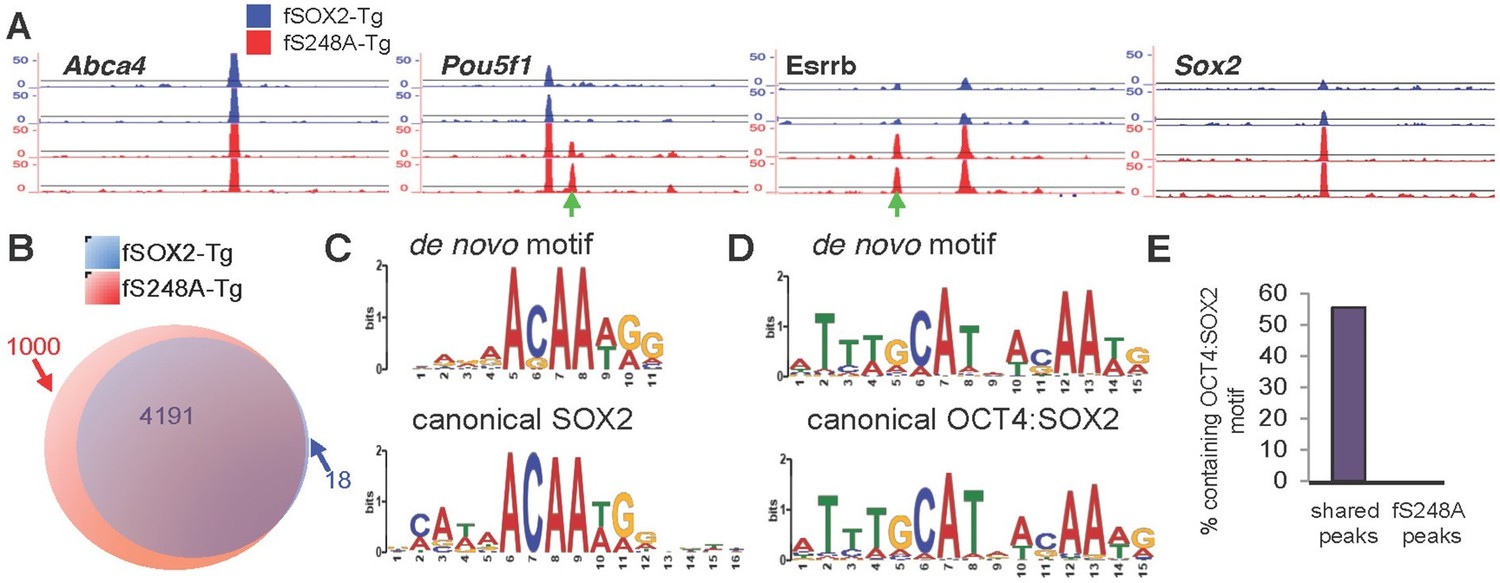
S248A mutation alters genome-wide distribution of SOX2.
(A) Representative UCSC genome browser tracks of FLAG ChIP-seq in fSOX2-Tg (blue) and fS248A-Tg (red) cells. Examples of fS248A-Tg specific peaks (Pou5f1, Esrrb) and shared peaks (Abca4, Sox2) are shown for 2 biological replicates (2 technical replicates were performed for each biological replicate, Spearman correlations for technical replicates are 1, for biological replicates 0.45 for fSOX2-Tg and 0.55 for fS248A-Tg). Each track is 15 kb. Green arrows indicate fS248A-Tg specific peaks. For Sox2 track, the region shown is not encompassed in the deletion removing endogenous Sox2. (B) Overlap (purple) in called peaks from anti-FLAG ChIP-seq in fSOX2-Tg (blue) and fS248A-Tg (red) mESCs. (C) De novo SOX2 motif identified in shared ChIP-seq peaks between fSOX2-Tg and fS248A-Tg cells (top) compared to the canonical SOX2 motif [Jaspar M01271] (bottom). (D) OCT4:SOX2 motif identified in peaks shared between fSOX2-Tg and fS248A-Tg cells using de novo motif analysis (top) compared to the canonical OCT4:SOX2 motif [Jaspar MA0142.1] (bottom). (E) Proportion of peaks containing a motif matching the OCT4:SOX2 de novo motif in shared peaks (left) and fS248A-Tg specific peaks (right).
Figure 6 with 2 supplements
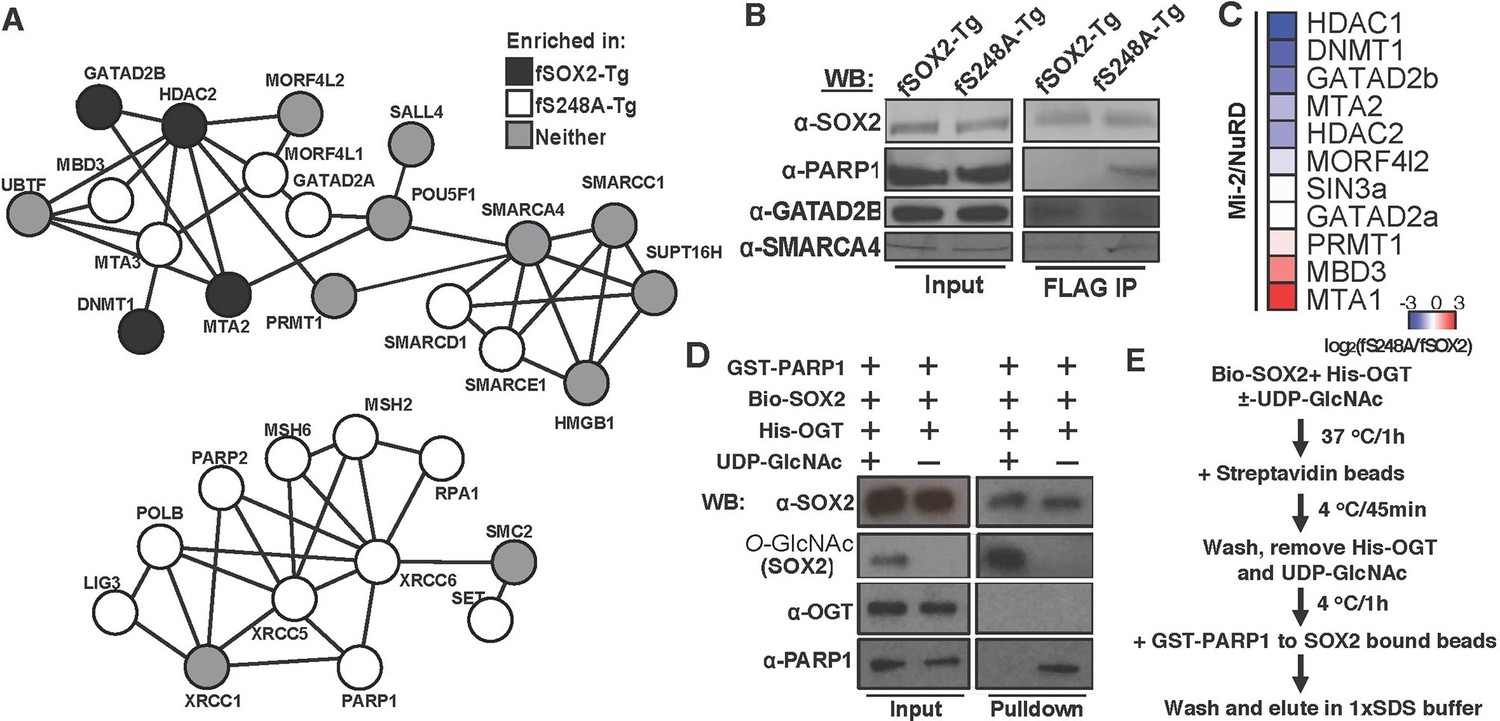
O-GlcNAcylation of SOX2 at S248 alters protein-protein interactions.
(A) Interaction diagram of a subset of SOX2 interactors that exhibit differential association with 3xF-SOX2S248A relative to 3xF- SOX2WT. Color of circles indicates with which SOX2 proteoform a protein preferentially interacts. Interaction diagram based on high confidence, experimental interactions identified by STRING. (B), Anti-FLAG IP-WB for SOX2, PARP1, GATAD2B, and SMARCA4 in fSOX2-Tg and fS248A-Tg cells. (C) Heatmap of median enrichment values of NuRD subunits that preferentially associate with 3xF-SOX2WT or 3xF-SOX2S248A as determined by quantitative mass spectrometry (n=3). (D) Western blot analysis of in vitro interaction between SOX2 +/- O-GlcNAcylation and PARP1. Bio-SOX2 and His-OGT were incubated with and without UDP-GlcNAc, Bio-SOX2 purified away from OGT and UDP-GlcNAc using streptavidin beads and incubated with GST-PARP1. Western blots examine proteins associated with streptavidin beads. Comparable amounts of input and pull down were loaded for all blots, except O-GlcNAc, in which more material was loaded in the pull down lanes. WB, Western blot; GST, glutathione S-transferase tag; Bio, biotinylated Bio tag; His, polyhistidine tag. (E) Flow chart outlining scheme for D.
Figure 6—figure supplement 1
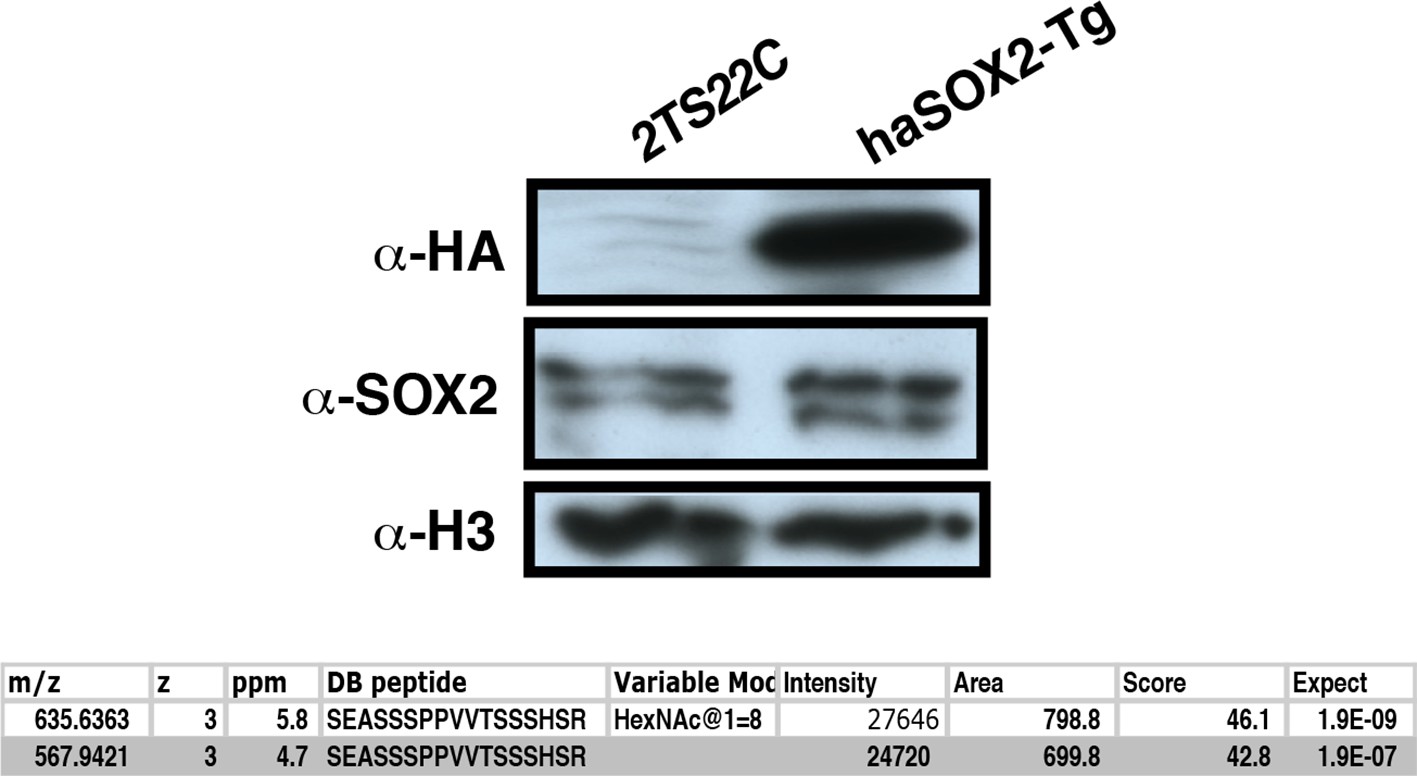
Creation of haSOX2-Tg, where HA-tagged SOX2 is the sole source of SOX2.
Western blots compare parental line to haSOX2-Tg ESCs. Below table shows MS analysis identifies GlcNAc-S248 in these cells.
Figure 6—figure supplement 2
O-GlcNAc site mapping by ETD-MS/MS of recombinant Bio-tagged human SOX2 incubated with recombinant human OGT and UDP-GlcNAc.
https://doi.org/10.7554/eLife.10647.023
Figure 7
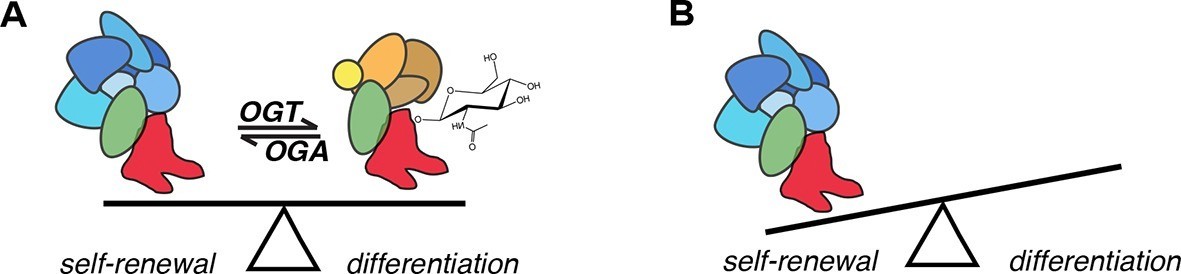
Model for the role of O-GlcNAcylation in regulation of SOX2 in mESCs.
(A) O-GlcNAc (sugar moiety) affects the affinity of SOX2 (red) for interacting proteins (ovals). Some proteins (blue shapes) exhibit greater affinity for unmodified SOX2, while others exhibit lower affinity (orange shapes). In addition, O-GlcNAcylation affects SOX2 binding to a subset of target DNA sequences. (B) As a result of altered genomic distribution and protein-protein interactions when SOX2 cannot be O-GlcNAcylated (SOX2S248A), pluripotency gene expression is promoted at the expense of differentiation.
Additional files
-
Supplementary file 1
(a) Differentially expressed genes between fSOX2-Tg and fS248A-Tg cells determined by microarray. P-values, absolute fold change and direction of regulation are listed in columns 2, 3, and 4, respectively. (b) Proteins, listed by Gene name, found to interact with SOX2 in mESCs in this study. FLAG/HA IP (column 1) lists proteins found to specifically interact with SOX2 in either fSOX2-Tg or fS248A-Tg cells but not in haSOX2-Tg cells (FLAG IP control). fS48A-Tg Int./fSOX2-Tg Int. (column 2) indicates the log2 fold-enrichment of the SOX2-protein interaction between the two cell lines. Z-score (fS48A-Tg/fSOX2-Tg) indicates the enrichment score for a SOX2-protein interaction between the two cell lines. Previously identified SOX2 interactors are listed for the associated references. Full references can be found in the main text. (c) Peptides sequences and m/z values used for the targeted analysis described in Figure 6c. (d) Primers used in this study.
- https://doi.org/10.7554/eLife.10647.025
Download links
A two-part list of links to download the article, or parts of the article, in various formats.
Downloads (link to download the article as PDF)
Open citations (links to open the citations from this article in various online reference manager services)
Cite this article (links to download the citations from this article in formats compatible with various reference manager tools)
SOX2 O-GlcNAcylation alters its protein-protein interactions and genomic occupancy to modulate gene expression in pluripotent cells
eLife 5:e10647.
https://doi.org/10.7554/eLife.10647


