Synergistic integration of Netrin and ephrin axon guidance signals by spinal motor neurons
- Columbia University, United States
- Institut de recherches cliniques de Montréal, Canada
- McGill University, Canada
- The Jackson Laboratory, United States
- Howard Hughes Medical Institute, Columbia University, United States
- Montréal Neurological Institute, Canada
- Université de Montréal, Canada
- Thomas Jefferson University, United States
- Howard Hughes Medical Institute, The Jackson Laboratory, United States
- Taipei Medical University, Taiwan
Figures
Figure 1 with 1 supplement
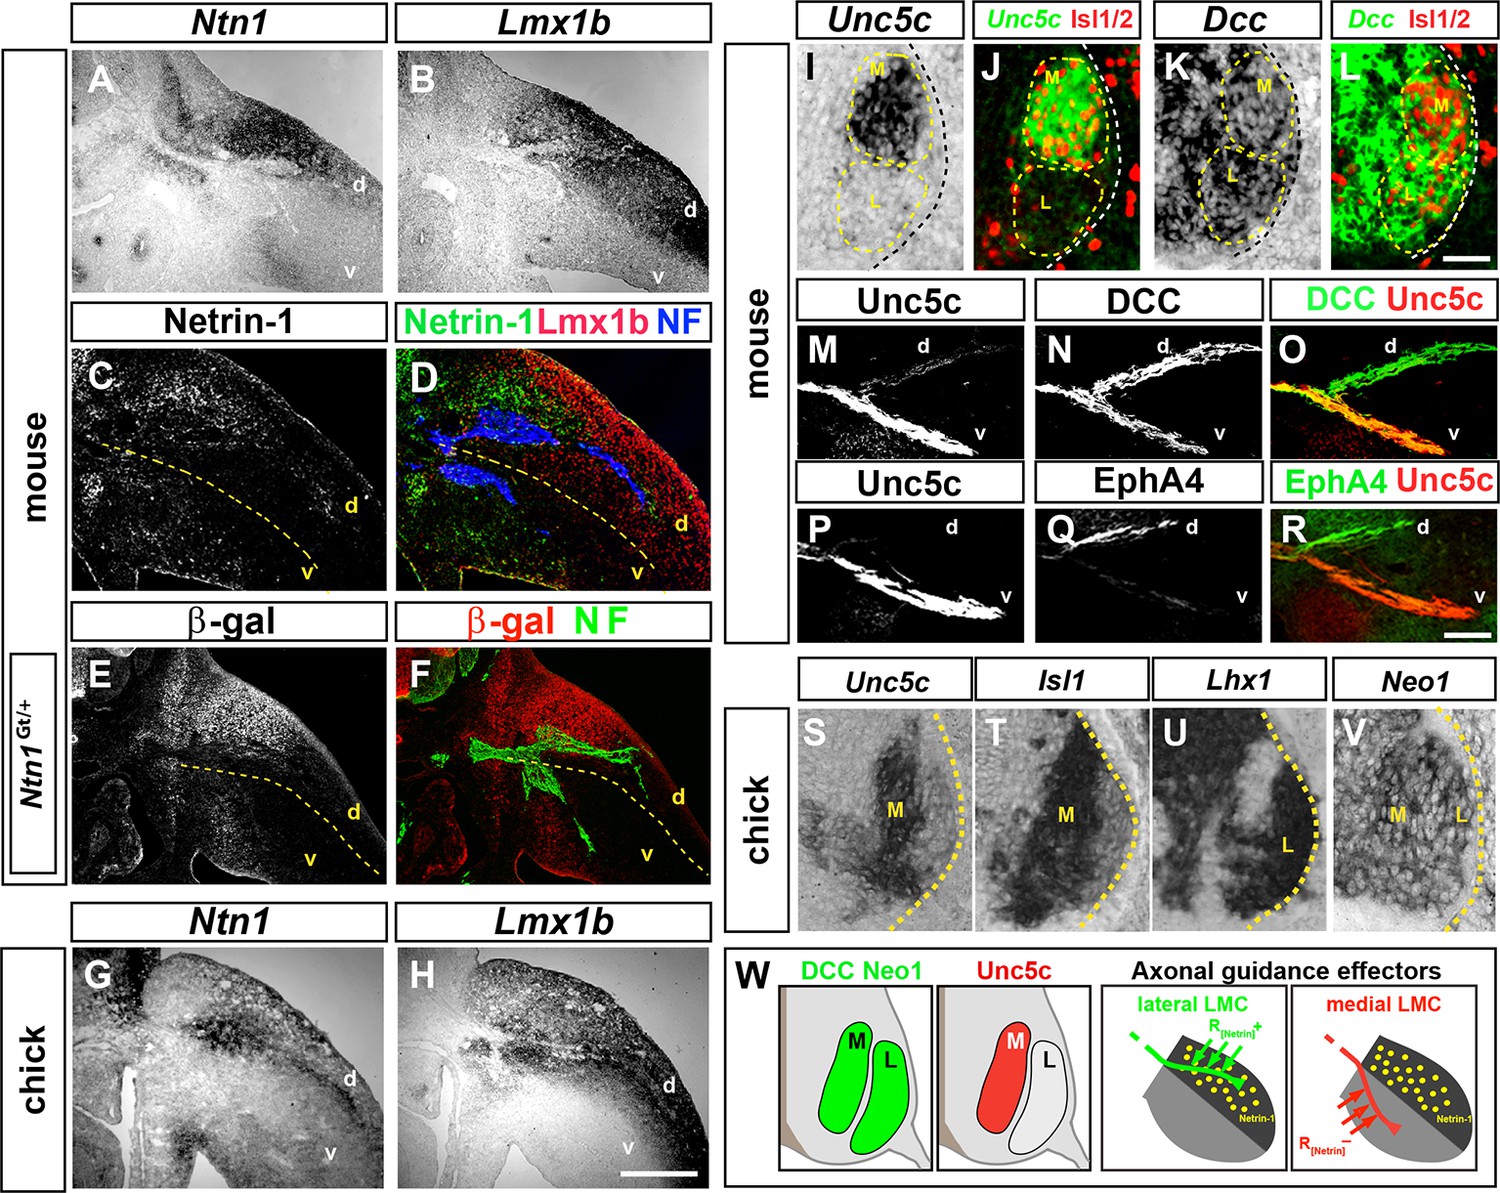
Expression of Netrin-1 in the limb mesenchyme and of Netrin receptors in medial and lateral LMC neurons.
Netrin-1 mRNA and protein detected by in situ hybridization and immunohistochemistry compared with the dorsal limb marker Lmx1b in mouse and chick limbs at the time of LMC axon limb ingrowth. (A, B) In situ hybridization for Ntn1 (A) and the dorsal limb marker Lmx1b (B) mRNAs in consecutive sections of e11.5 wild-type mouse forelimb. (C, D) Immunostaining for Netrin-1, neurofilament, and Lmx1b in e11.5 mouse forelimb. (E, F) Immunostaining for β-galactosidase and neurofilament in e11.5 Ntn1Gt/+ mouse forelimb. β-galactosidase is expressed at the dorsal limb mesenchyme domain abutting dorsally projecting LMC axons. (G, H) In situ hybridization for Ntn1 mRNA (G) and Lmx1b mRNA (H) in consecutive sections of HH st. 27 chick hindlimbs. Unc5c and DCC (or Neogenin in chick) mRNA and protein expression was compared with LMC divisional markers in e11.5 mice and HH st. 27 chick spinal cord or to EphA4 in lateral LMC axons. (I, J) Selective expression of Unc5c in medial LMC motor neurons. In situ detection of Unc5c mRNA and immunodetection of Isl1/2 in e11.5 lumbar mouse spinal cord. The green signal in (J) represents the pseudocolor image shown in (I). M and L indicate the position of medial and lateral LMC, respectively, as assessed by Isl1/2 (red) or Lhx1 immunostaining (not shown). (K, L) DCC is expressed at both LMC divisions. In situ hybridization of Dcc mRNA and immunodetection of Isl1/2 in e11.5 mouse lumbar spinal cord. The green signal represents the pseudocolor image. Note the higher level of Dcc in lateral (Isl1-) vs. medial (Isl1+) LMC motor neurons. (M–R) Localization of Unc5c and DCC proteins in dorsal and ventral axon branches entering the hindlimb in e11.5 embryos. (M–O) Double immunostaining for Unc5c and DCC. Note the high expression level of Unc5c in ventral nerves and DCC in both dorsal and ventral nerves. (P–R) Double immunostaining for Unc5c and EphA4. (S–V) Expression of Netrin-1 receptors in chick LMC neurons. In situ hybridization for Unc5c, Neo1, Isl1, and Lhx1 in consecutive sections of HH St. 27 chick lumbar spinal cord. Note the presence of in medial (Isl1+) LMC neurons and of Neo1 in both LMC divisions. (W) Summary of Netrin-1, DCC, and Unc5c expression in limb mesenchyme and LMC neurons. LMC, lateral motor column; Ntn1, Netrin-1; NF, neurofilament; M, medial; L, lateral; d, dorsal; v, ventral. Scale bars: (A–H) 250 μm, (I–L) 80 μm, (M–V) 50 μm.
Figure 1—figure supplement 1
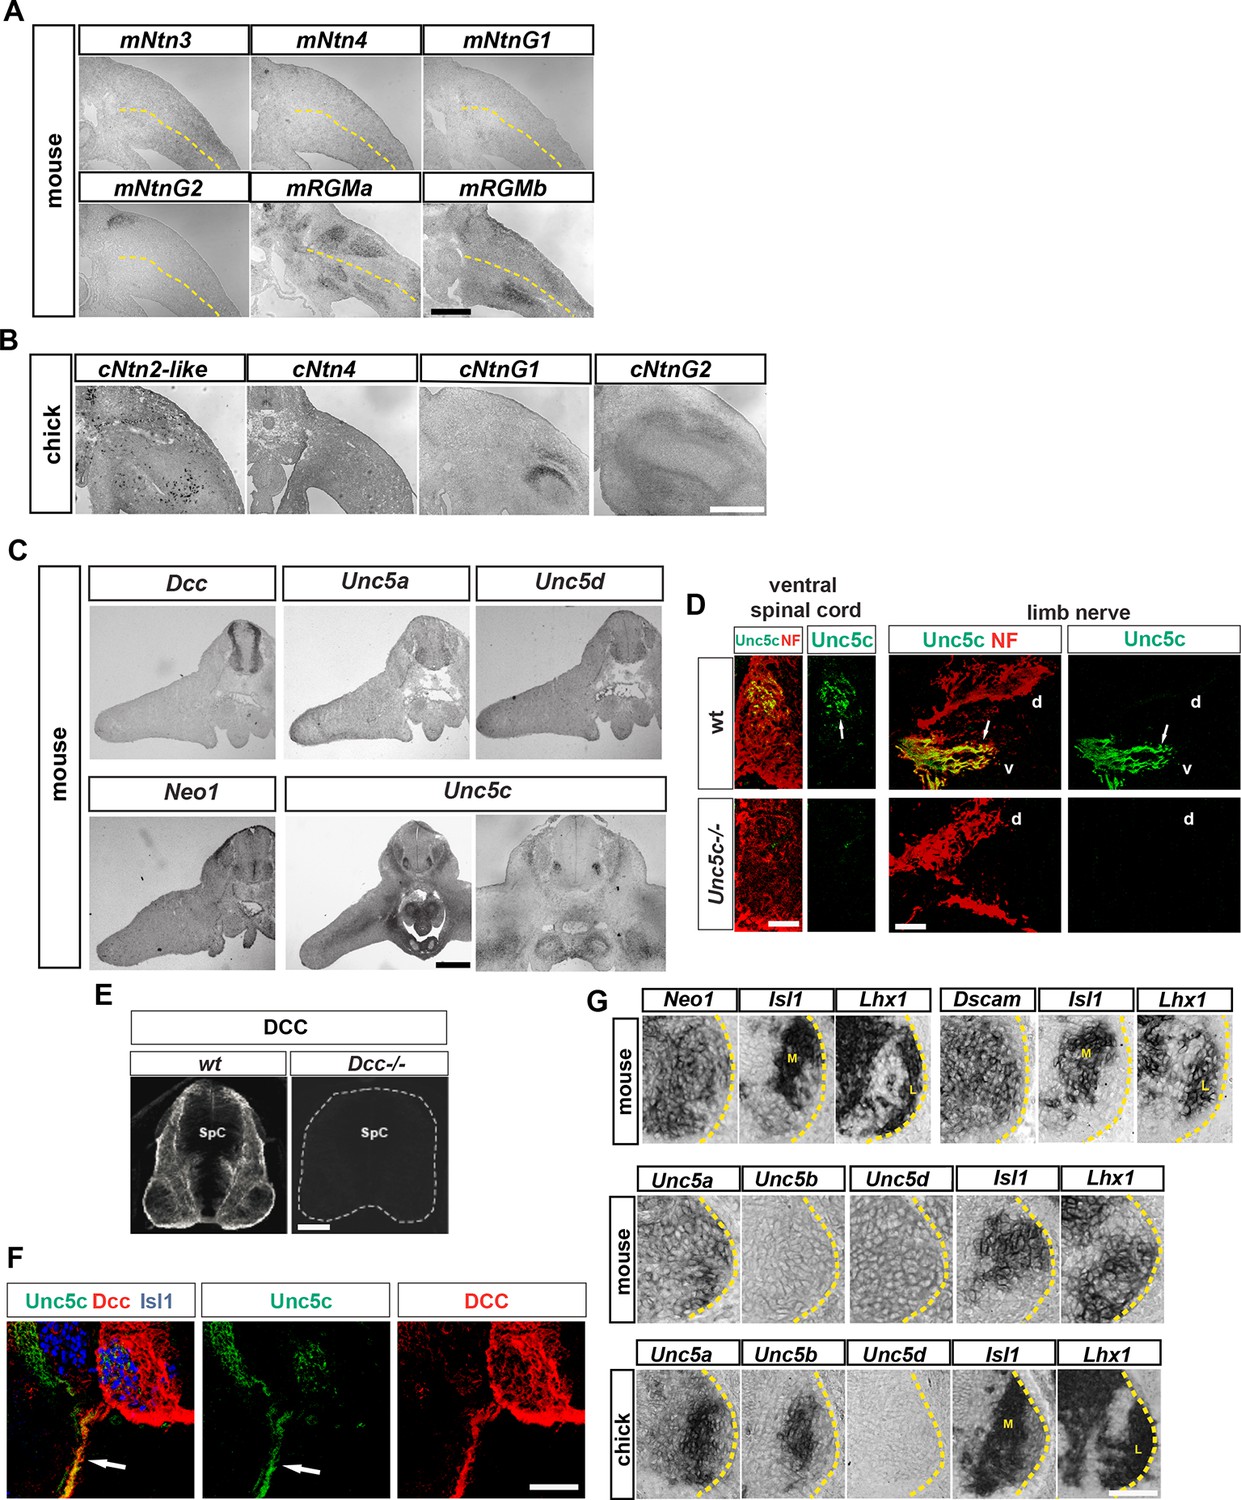
Expression of Netrin family ligands and receptors in mouse and chick hindlimbs.
(A and B) Analysis of mRNA expression by in situ hybridization of Netrin family ligands in mouse e11.5 and chick HH st. 27 hindlimbs. Note the absence of expression of mNtn3, mNtn4, cNtn2-like, and cNtn4 and the expression of mNtnG2, mRgma, mRgmb, cNtnG1, and cNtnG2 in patterns that do not suggest a clear LMC axon dorsoventral limb nerve selection function. (C) Analysis of mRNA expression by in situ hybridization of Netrin family receptors in e11.5 mouse hindlimbs. Note the absence of expression of these receptors in hindlimbs with the exception of Unc5c that is present in ventral limb mesenchyme. (D and E) Specificities of Unc5c and DCC antibodies. (D) Immunostaining for Unc5c and neurofilament in e 11.5 mice lumbar spinal cords (left) or peripheral axons (right) of wild-type and Unc5c-/- mice. (E) Immunostaining for DCC in spinal cords of wild-type or Dcc-/- mice. (F) Immunostaining for Unc5c and DCC in sensory and motor axons. Note the absence of DCC from axons exiting the DRG and the lower expression of Unc5c in the sensory-only branch compared with the motor branch. (G) Analysis of mRNA expression by in situ hybridization for genes encoding Netrin receptors in e11.5 mouse and HH St. 27 chick spinal cords. Expression of mouse Neo1, Dscam, Unc5a, and Unc5d is observed in both medial and lateral LMCs, while mouse Unc5b is not expressed in LMC neurons. In chick, both Unc5a and Unc5b are expressed in medial LMC while Unc5d is absent from LMC neurons. SpC, spinal cord. Scale bars: (A–C) 300 μm, (D) 40 μm, (E–G) 80 μm.
Figure 2 with 2 supplements
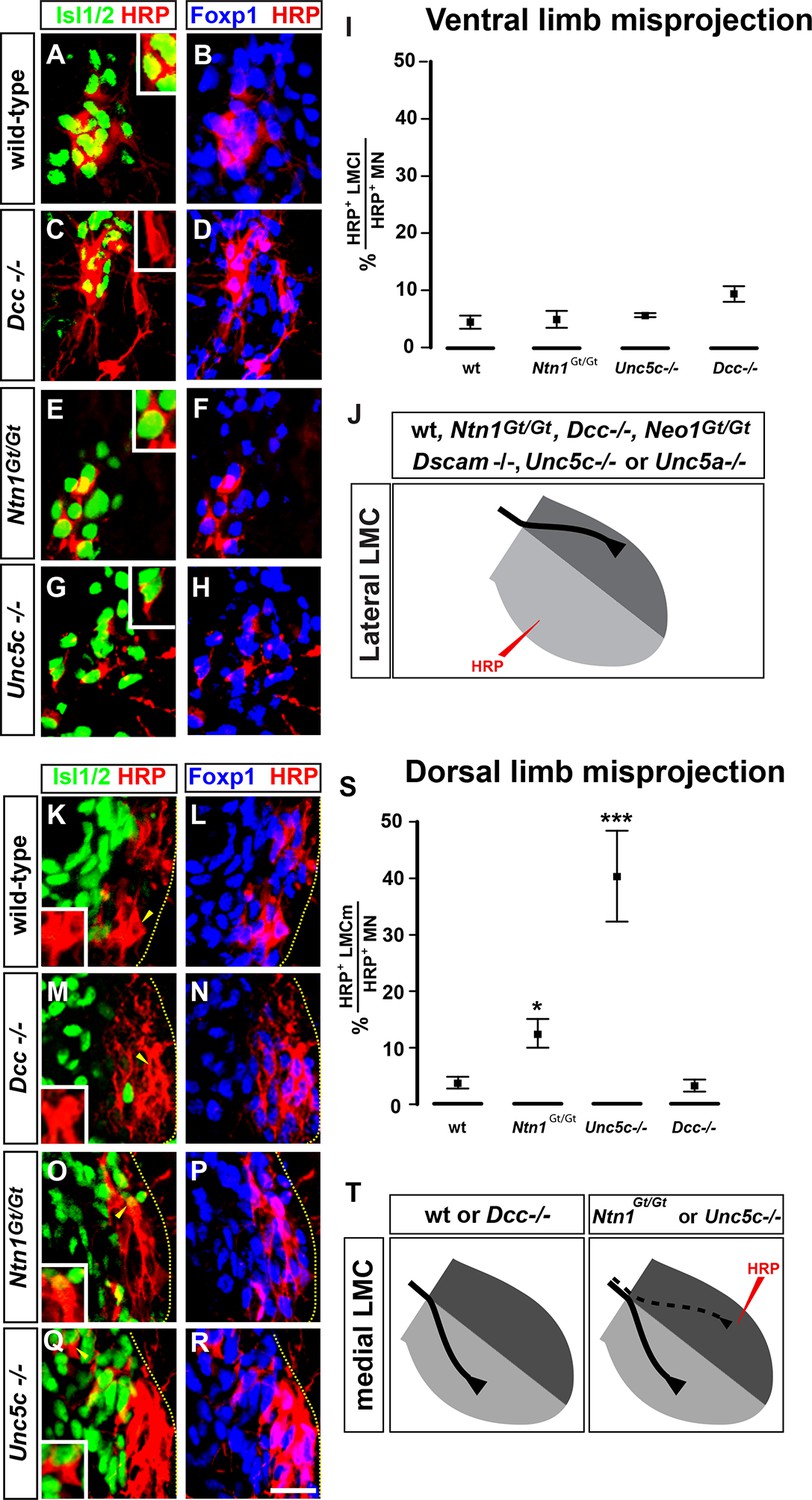
The requirement of Netrin-1 and its receptors for the fidelity of LMC axon trajectory selection.
Lateral and medial LMC axon projections were analyzed by injecting the retrograde tracer HRP into dorsal or ventral limb muscles followed by the assessment of LMC divisional identity of backfilled LMC neurons. (A–H) Analysis of lateral LMC motor axon projections in wild-type (A and B), Dcc-/- (C and D), Ntn1Gt/Gt (E and F) and Unc5c-/- (G and H) mutant mice. A retrograde tracer (HRP, red) was injected in the ventral forelimb of e12.5 wild-type or mutant mice followed by detection of Isl1 (green, A, C, E, G) and Foxp1 (blue, B, D, F, H) to identify medial (Isl1+, Foxp1+) and lateral (Isl1-, Foxp1+) LMC neurons. Insets in A, C, E and G show examples of magnified HRP+ backfilled cells that are Isl1- (Dcc-/- mice) or Isl1+ (wild-type, Ntn1Gt/Gt or Unc5c-/- mice). (I) Quantification of retrogradely labeled lateral LMC axon projections. The graph depicts the mean percentage ± SD of HRP+ backfilled motor neurons that express the medial LMC marker Isl1 after a dorsal limb injection. n = 5 (wild-type), 4 (Ntn1Gt/Gt), 3 (Unc5c-/-), 5 (Dcc-/-) embryos. (J) Summary of analysis of lateral LMC projections in different Netrin signaling mutant mice. See Figure 2—figure supplement 2 for results of additional mutant analyses. (K–R) Analysis of medial LMC motor axon projections in wild-type (K and L), Dcc-/- (M and N), Ntn1Gt/Gt (O and P), and Unc5c-/- (Q and R) mutant mice. HRP (red) was injected in the dorsal forelimb of e12.5 wild-type or mutant mice followed by immunostaining of spinal cord sections for Isl1 (green, K, M, O, Q) and Foxp1 (blue, L, N, P, R) to identify medial (Isl1+, Foxp1+) and lateral (Isl1-, Foxp1+) LMC neurons. Arrowheads indicate examples of HRP+ cells that are Isl1- (wild-type and Dcc-/- mice) or Isl1+ (Ntn1Gt/Gt or Unc5c-/- mice) and are magnified in the insets. (S) Quantification of retrogradely labeled medial LMC axon projections. The graph depicts the mean percentage ± SD of HRP+ backfilled motor neurons that express the medial LMC marker Isl1 after a dorsal limb injection. n = 3 (wild-type), 3 (Ntn1Gt/Gt), 5 (Unc5c-/-), 3 (Dcc-/-) embryos. (T) Summary scheme of medial LMC projections in wild-type, Ntn1Gt/Gt, Unc5c-/-, and Dcc-/- mice. In Ntn1Gt/Gt and Unc5c-/- mice some medial LMC axons project to the dorsal limb. HRP, horseradish peroxidase; wt, wild-type; Ntn1, Netrin-1; error bars = SD; *** = p<0.001; * = p<0.05; statistical significance computed using Fisher’s exact test. All values (mean ± SD) can be found in Supplementary file 1B; scale bar: 20 μm.
Figure 2—figure supplement 1
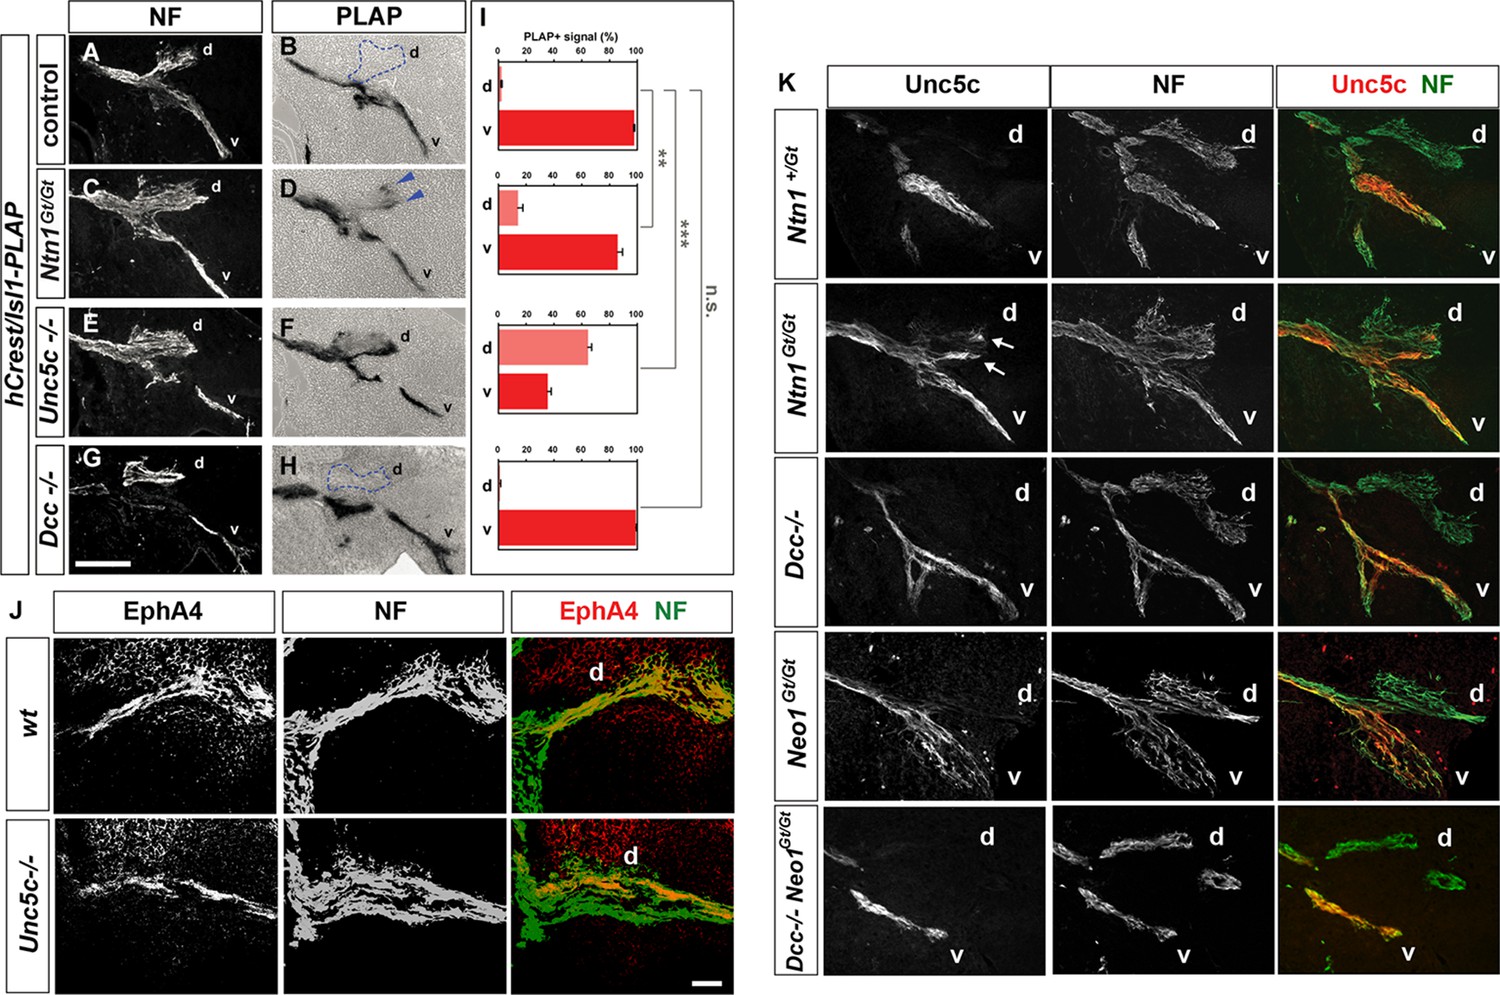
Analysis of medial LMC axon projections in mutant mice.
Medial LMC axons were identified by genetic labeling with placental alkaline phosphatase (PLAP) (A–H) or identified with immunostaining for NF and EphA4 (J) or NF and Unc5c (K). (A–H) hCrest/Isl1-PLAP mice were crossed to wild-type, Dcc-/-, Ntn1Gt/Gt, and Unc5c-/- mice. Developing for alkaline phosophatase allowed the selective visualization of medial LMC axon projections. Immunostaining for NF in combination with alkaline phosphatase reaction in wild-type (A and B), Ntn1Gt/Gt (C and D), Unc5c-/- (E and F), and Dcc-/- (G and H) mice. (I) Quantification of the percentage of PLAP signal present in dorsal or ventral nerve branches. (J) Immunostaining for NF and EphA4 in e11.5 lumbar spinal cords of wild-type (top panels) and Unc5c-/- mutants (bottom panels). Note the overlap of NF and EphA4 in the dorsal branch of wild-type mice and the presence of a large cohort of EphA4-negative axons in the dorsal nerve of Unc5c-/- mice. (K) Analysis of Unc5c-expressing medial LMC axon trajectories in Ntn1Gt/Gt, Dcc-/-, Neo1Gt/Gt or double Neo1Gt/Gt, Dcc-/- mice. Limb sections were immunostained for NF and Unc5c (at a dilution in which motor but not sensory axons can be detected) in the different mutant mice as indicated. Note the presence of Unc5c-positive axons in the dorsal branch of Ntn1Gt/Gt mice. LMC, lateral motor column; NF, neurofilament; wt, wild-type; error bars = SD; *** = p<0.001; ** = p<0.01; n.s. = not significant; statistical significance computed using Student’s unpaired t test; all values are mean ± SD. Scale bars: (A–H, K) 80 μm; (J) 25 μm.
Figure 2—figure supplement 2
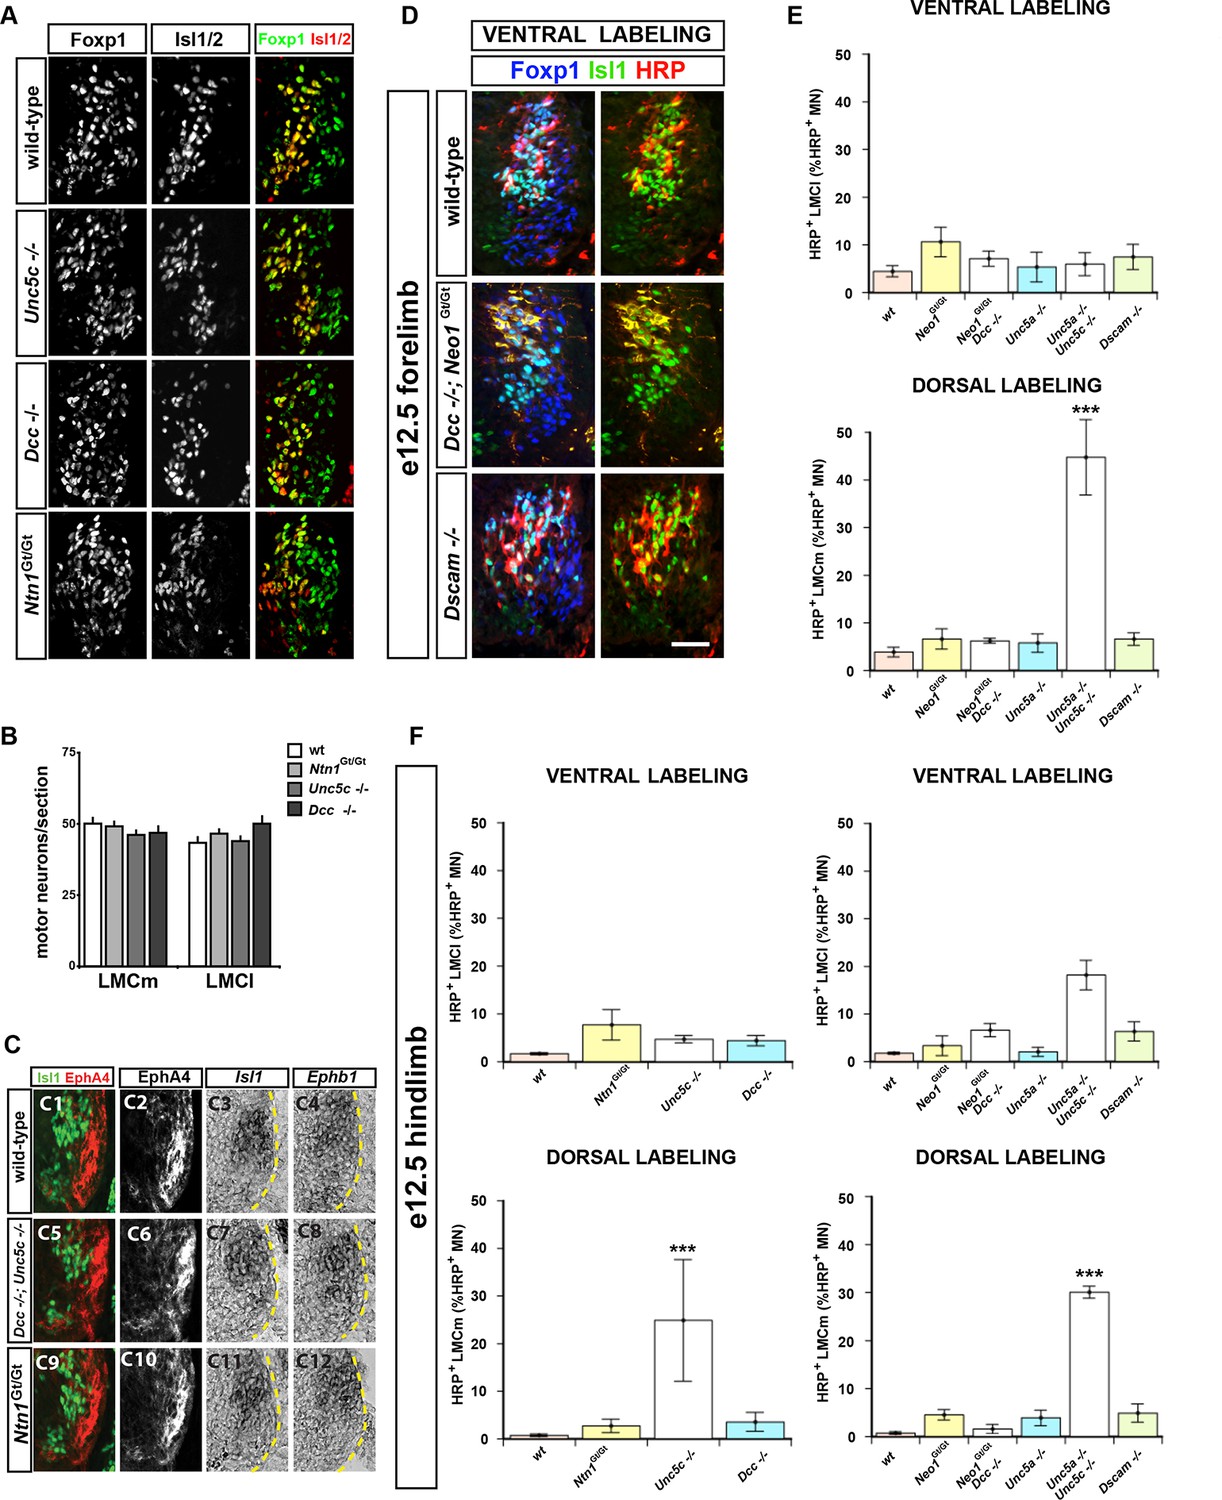
Normal specification of LMC neurons in Unc5c, Dcc, and Ntn1Gt mutants and summary of LMC axon trajectory analysis in mutant mice.
(A–C) Normal specification of LMC neurons in Unc5c-/-, Dcc-/-, and Ntn1Gt/Gt mice. (A) The number of medial and lateral LMC neurons was determined in e13.5 cervical and lumbar spinal cord sections from different mutant mice immunostained for Isl1 and Foxp1. (B) Quantification of medial and lateral LMC neurons in wt, Unc5-/-, Dcc-/-, and Ntn1Gt/Gt mice. (C) Normal expression of EphB1 and EphA4 in Unc5c-/-, Dcc-/-, and Ntn1Gt/Gt mice. E13.5 lumbar spinal cord sections from different mice were immunostained for Isl1 and EphA4 (C1-2, C5-6, C9-10) or analyzed by in situ hybridization for Isl1 and Ephb1 mRNA in consecutive sections (C3-4, C7-8, C11-12). (D and E) Summary of analysis of lateral (ventral labeling) and medial (dorsal labeling) LMC trajectories by backfill experiments in mice forelimbs of Neo1Gt/Gt double Dcc-/-;Neo1Gt/Gt, Unc5a-/-, double Unc5a-/-; Unc5c-/-, and Dscam-/- mice. Only the proportion of HRP+ LMC expressing Isl1 in dorsally filled double Unc5a-/-; Unc5c-/- embryos is significantly different from that of wt embryos (p<0.001). Number of embryos quantified for ventral fill: n = 5 (wt), 4 (Neo1Gt/Gt), 3 (Dcc-/- and Neo1Gt/Gt), 4 (Unc5a-/-), 4 (Unc5c-/- and Unc5a-/-), 4 (Dscam-/-). Number of embryos quantified for dorsal fill: n = 3 (wt), 4, (Neo1Gt/Gt), 4 (Dcc-/-; Neo1Gt/Gt), 4 (Unc5a-/-), 3 (Unc5c-/-; Unc5a-/-), 3 (Dscam-/-). (F) Summary of analysis of lateral (ventral labeling) and medial (dorsal labeling) LMC trajectories by backfill experiments in e12.5 mice hindlimbs of different Netrin mutants as indicated. The proportions of HRP+ LMC expressing Isl1 in dorsally filled Unc5c-/-and Unc5a-/-; Unc5c-/- embryos are significantly different from that of wt embryos (p<0.001 for both groups). Number of embryos quantified for ventral fill: n = 7 (wt), 3, (Neo1Gt/Gt), 4 (Dcc-/-; Neo1Gt/Gt), 4 (Unc5a-/-), 3 (Unc5c-/-; Unc5a-/-), 4 (Dscam-/-). Number of embryos quantified for dorsal fill: 4 (wt), 4, (Neo1Gt/Gt), 3 (Dcc-/- and Neo1Gt/Gt), 4 (Unc5a-/-), 3 (Unc5c-/-; Unc5a-/-), 3 (Dscam-/-). HRP, horseradish peroxidase; LMC, lateral motor column; wt, wild-type; error bars = SD; *** = p<0.001; statistical significance computed using Student’s unpaired t test (B) or Fisher’s exact test on raw numbers (E, F); all values are mean ± SD. Quantification details in supplemental file 1C. Scale bars: (A) 50 μm; (C) 80 μm; (D) 40 μm.
Figure 3 with 1 supplement
Opposing responses of medial and lateral LMC axons to Netrin-1 require Neogenin and Unc5c function.
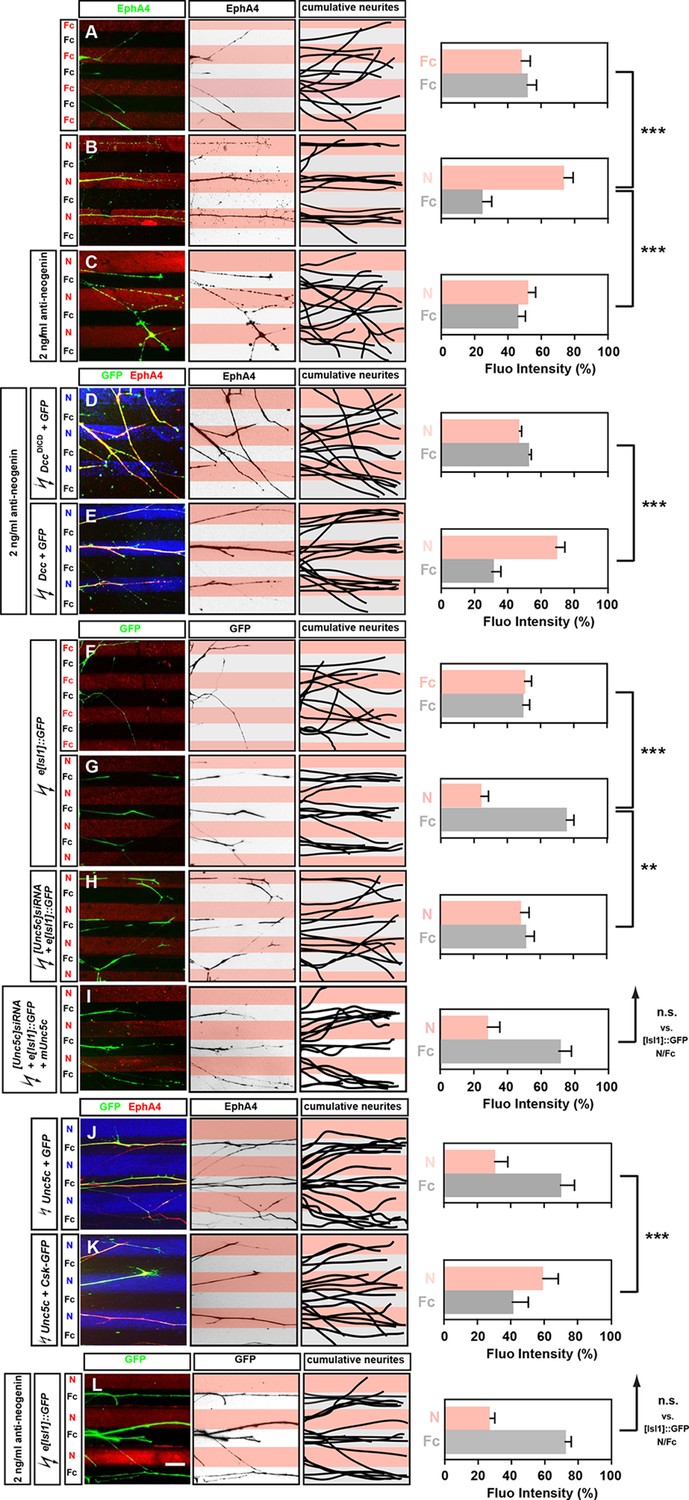
Growth preference on protein stripes exhibited by medial and lateral LMC axons. Each experiment is composed of three panels (left, middle, right) and a quantification. (A–E) Left panels: explanted lateral (EphA4+) LMC neurites on Fc/Fc (A) or Netrin-1 (N)/Fc stripes without (B) or with (C) the addition of anti-neogenin antibody. Lateral (GFP+ EphA4+) LMC neurites of DccΔICD and GFP (D) or Dcc and GFP (E) co-electroporated explants treated with anti-neogenin antibody. Middle panels: inverted images where EphA4 signal is dark pixels overlaid on substrate stripes. Right panels: superimposed images of five representative explants from each experimental group highlighting the distribution of lateral LMC neurites. Quantification of lateral (EphA4+) LMC neurites on first (pink) and second (pale) stripes expressed as a percentage of total EphA4 signals. Number of neurites: 77. Minimal number of explants: 11. (F–I) Left panels: detection of medial (GFP+) LMC neurites of explants on Fc/Fc (F) or N/Fc stripes (G), [Unc5c]siRNA co-electroporated explants on N/Fc stripes (H) and [Unc5c]siRNA + Unc5c co-electroporation rescue experiment (I). Middle panels: inverted images where GFP signal is dark pixels overlaid on substrate stripes. Right panels: superimposed images of five representative explants from each experimental group highlighting the distribution of medial LMC neurites (right panels). Quantification of medial (GFP+) LMC neurites on first (pink) and second (pale) stripes expressed as a percentage of total GFP signals. Minimal number of neurites: 83. Minimal number of explants: 12. (J–K) Left panels: explanted lateral (EphA4+) LMC neurites on N/Fc stripes. Lateral (GFP+ EphA4+) LMC neurites of Unc5c and GFP (J) or Unc5c and Csk-GFP (K) co-electroporated explants. Middle panels: inverted images where EphA4 signal is dark pixels overlaid on substrate stripes. Right panels: superimposed images of five representative explants from each experimental group highlighting the distribution of lateral LMC neurites. Quantification of lateral (EphA4+) LMC neurites on first (pink) and second (pale) stripes expressed as a percentage of total EphA4 signals. Minimal number of neurites: 90. Minimal number of explants: 11. (L) Left panels: detection of medial (GFP+) LMC neurites of explants on N/Fc stripes with anti-neogenin antibody addition. Middle panels: inverted images where GFP signal is dark pixels overlaid on substrate stripes. Right panels: superimposed images of five representative explants from each experimental group highlighting the distribution of medial LMC neurites (right panels). Quantification of medial (GFP+) LMC neurites on first (pink) and second (pale) stripes expressed as a percentage of total GFP signals. Minimal number of neurites: 83. Minimal number of explants: 12. LMC, lateral motor column; N, netrin-1; error bars = SD; *** = p<0.001; ** = p<0.01; n.s. = not significant; statistical significance computed using Mann-Whitney U test; all values (mean ± SD) can be found in Supplementary file 1B; scale bar: 50 µm.
Figure 3—figure supplement 1
Functional blocking of Neogenin has no effect on ephrin-mediated lateral LMC repulsion, quantification of Unc5c-expressing medial LMC neurons in mice and chick.
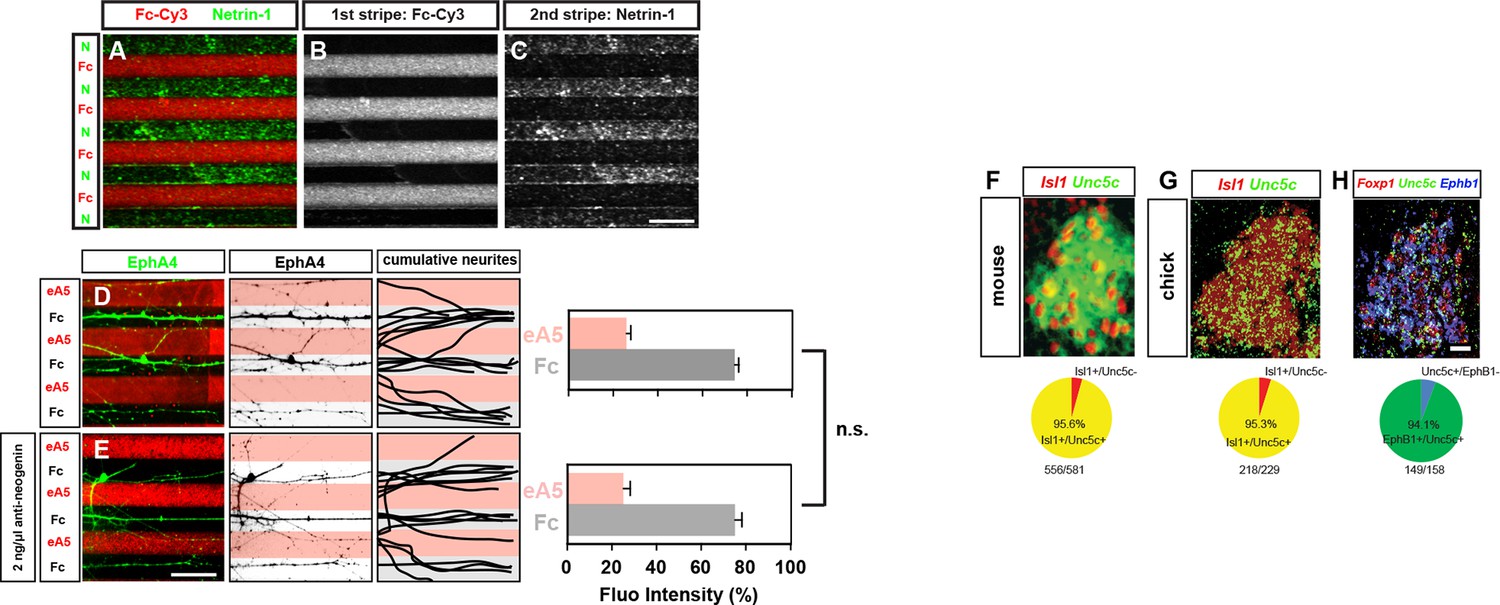
(A–C) Characterization of Netrin-1/Fc stripes. Detection of Netrin-1 and Fc-Cy3 in alternating stripes by immunostaining. (D–E) Detection of lateral (EphA4+) LMC neurites of explants on C100 eA5-Fc/Fc stripes without (D) or with (E) anti-neogenin antibody treatment. Middle panels: inverted images where EphA4 signal is dark pixels overlaid on substrate stripes. Right panels: superimposed images of five representative explants from each experimental group highlighting the distribution of lateral LMC neurites. Quantification of lateral (EphA4+) LMC neurites on first (pink) and second (pale) stripes expressed as a percentage of total EphA4 signals. (F) In situ hybridization for Unc5c in conjunction with immunostaining for Isl1 in e11.5 mice lumbar spinal cord. Bottom: quantification of the number of LMC neurons (Isl1+) which are also Unc5c+. 12 sections, n=581 neurons. (G) Double in situ hybridization for Unc5c and Isl1 in HH stage 27 chick lumbar spinal cord. Bottom: quantification of the number of LMC neurons (Isl1+) which are also Unc5c+. 6 sections, n=229 neurons. (H) Double in situ hybridization for Unc5c and Ephb1 in HH stage 27 chick lumbar spinal cord. Bottom: quantification of the number of Ephb1+ LMC neurons which also are Unc5c+. 3 sections, n=119 neurons. LMC, lateral motor column; N, Netrin-1; eA5, ephrin-A5-Fc; error bars = SD; n.s. = not significant; statistical significance computed using Mann-Whitney U test. Scale bars: (A–E) 100 μm, (F–H) 20 μm.
Figure 4 with 1 supplement
Co-operation between Unc5c and EphB2 receptors in LMC trajectory selection.
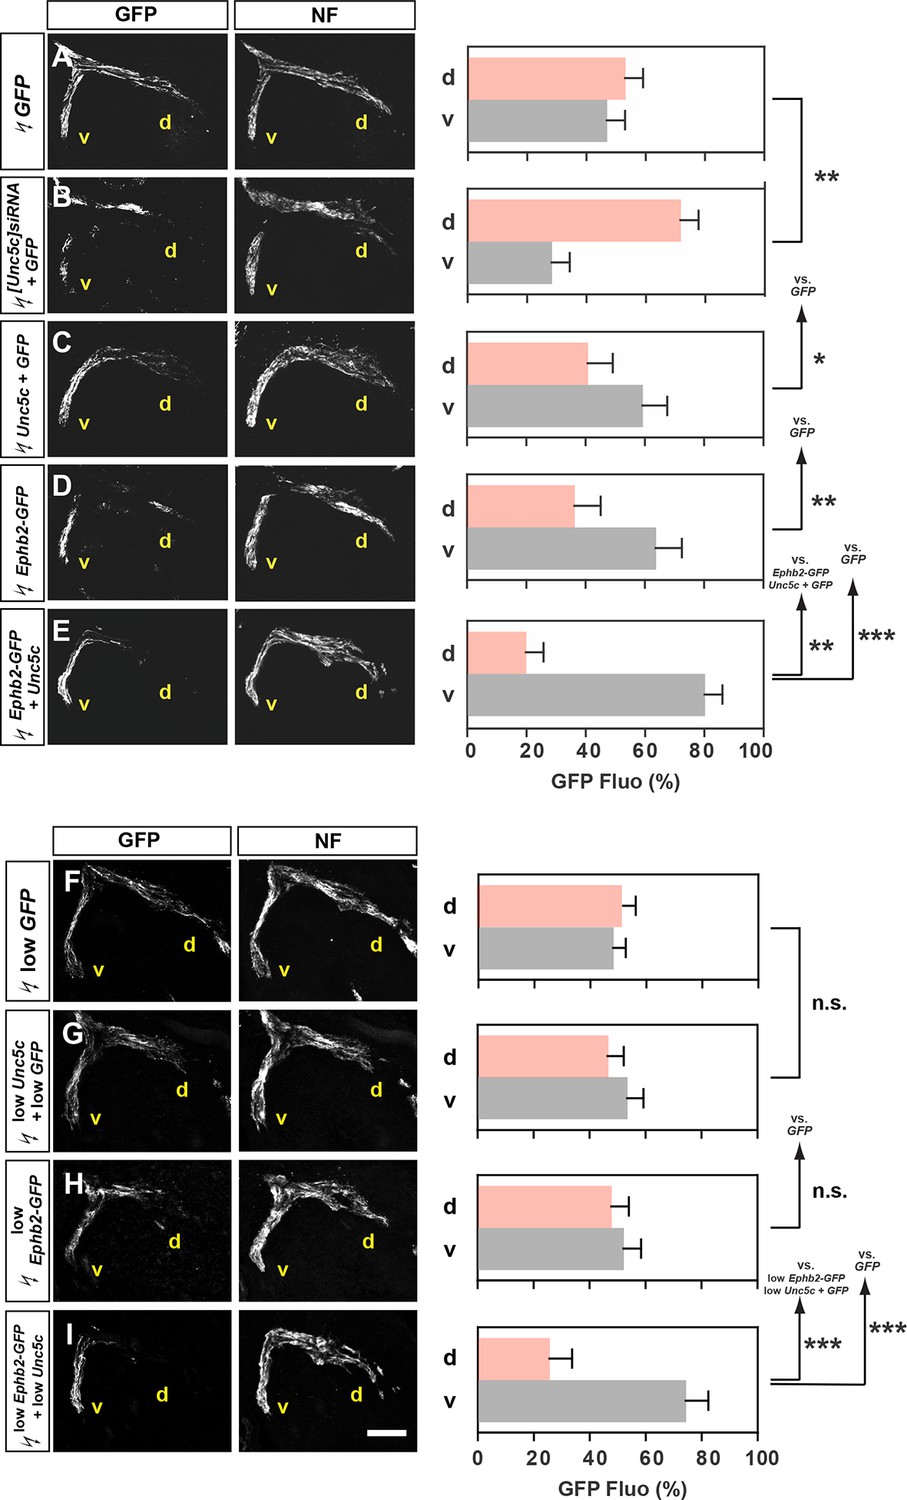
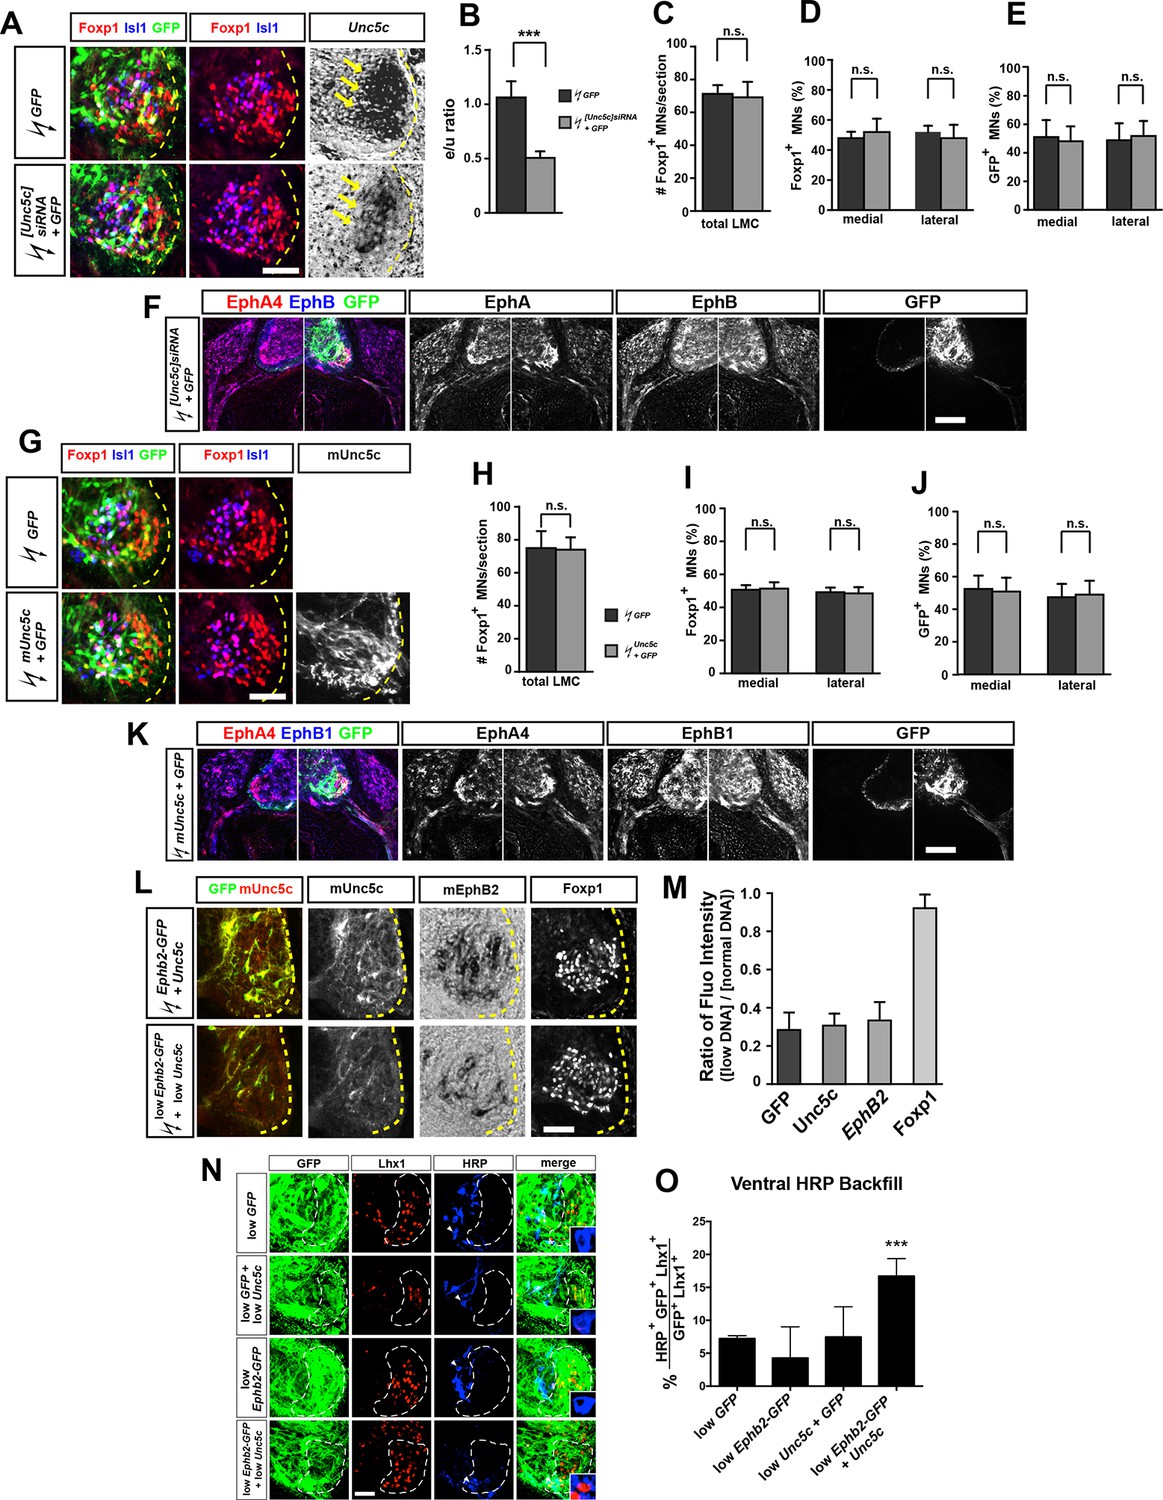
(A–E) GFP and neurofilament detection in the limb nerve branches in the crural plexus of embryos electroporated with the following expression plasmids and siRNAs: GFP (A), [Unc5c]siRNA and GFP (B), Unc5c and GFP (C), EphB2-GFP (D), or EphB2-GFP and Unc5c (E). Quantification of GFP signals in all electroporation experiments expressed as, respectively, percentage in dorsal and ventral limb nerves (GFP Fluo [%]). n = 5 embryos. (F–I) GFP and neurofilament detection in the limb nerve branches in the crural plexus of embryos electroporated with the following expression plasmids with 20% of normal concentration: low GFP (F), low Unc5c and low GFP (G), low EphB2-GFP (H), or low EphB2-GFP and low Unc5c (I). Quantification of GFP signals in all electroporation experiments expressed as, respectively, percentage in dorsal and ventral limb nerves (GFP Fluo [%]). n = 5 embryos. See text for detailed description. d, dorsal; v, ventral; error bars = SD; *** = p<0.001; ** = p<0.01; * = p<0.05; n.s.= non significant; statistical significance computed using Mann-Whitney U test; All values (mean ± SD) can be found in Supplementary file 1B. Scale bar: 150 µm.
Figure 4—figure supplement 1
Characterization of siRNA-mediated Unc5c knockdown and Unc5c overexpression in LMC neurons in chicken.
(A) Detection of Isl1, Foxp1, GFP, and Unc5c in chick embryos electroporated with [Unc5c]siRNA and GFP. (B) Quantification of the reduction in expression levels of Unc5c in LMC neurons after in ovo electroporation of [Unc5c]siRNA. Note a significant decrease (p<0.001) in Unc5c expression levels by 50% upon [Unc5c]siRNA and GFP but not GFP-only electroporation. Number of embryos quantified: n = 3 for both groups. (C, D) The total number of LMC neurons and the proportion of medial and lateral LMC are normal after [Unc5]siRNA electroporation. Number of embryos quantified: n = 4 for all groups. (E) Equal proportion of medial and lateral LMC neurons electroporated with either GFP only or [Unc5c]siRNA and GFP. Number of embryos quantified: n = 4 for all groups. (F) The expression of EphA4 and EphB1 is not altered after [Unc5]siRNA electroporation. (G) Detection of Isl1, Foxp1, GFP, and mouse Unc5c in chick embryos expressing mUnc5c and GFP. (H, I) The total number of LMC neurons and the proportion of medial and lateral LMC are normal after mUnc5c and GFP electroporation. Number of embryos quantified: n = 4 for all groups. (J) Equal proportion of medial and lateral LMC neurons electroporated with either GFP only or mUnc5c and GFP. Number of embryos quantified: n = 4 for all groups. (K) The expression of EphA4 and EphB1 is not altered after mUnc5c and GFP electroporation. Number of embryos quantified: n = 4 for all groups. (L) Detection of GFP, mUnc5c, mEphb2, and Foxp1 in chick embryos expressing normal (top) or low (1/5th) (bottom) concentrations of Ephb2-GFP and Unc5c plasmids. (M) Quantification of the ratio of the ectopic expression levels of low and normal concentration of GFP, Unc5c, and EphB2 in chick embryos. Number of embryos quantified: n = 6 for all groups. (N) Analysis of lateral LMC motor axon projections in chick embryos electroporated with Unc5c, Ephb2, Unc5c and Ephb2, or GFP expression plasmids (all at low concentrations). A retrograde tracer (HRP, blue) was injected in the ventral forelimb of HH st. 29/30 chick embryos followed by detection of Lhx1 (red) to identify lateral LMC neurons. Insets show examples of magnified HRP+ backfilled cells that are Lhx1+ (in low Unc5c + low Ephb2 co-electroporation) or Lhx1- (in all other conditions). (O) Quantification of retrogradely labeled lateral LMC axon projections. The graph depicts the mean percentage ± SD of electroporated (GFP+) and HRP+ backfilled motor neurons that express the lateral LMC marker Lhx1 after a ventral limb injection. N ≥ 3 embryos. HRP, horseradish peroxidase; LMC, lateral motor column; error bars = SD; *** = p<0.001; n.s. = not significant; statistical significance computed using Mann-Whitney U test (B–E, H–J, M), or Fisher’s exact test on raw numbers (O); all values are mean ± SD. Scale bars: (A, G, L) 56 μm; (F, K) 145 μm; (N) 40 μm.
Figure 5 with 1 supplement
Congruent and opposing modes of Netrin and ephrin synergy in cultured LMC axons.
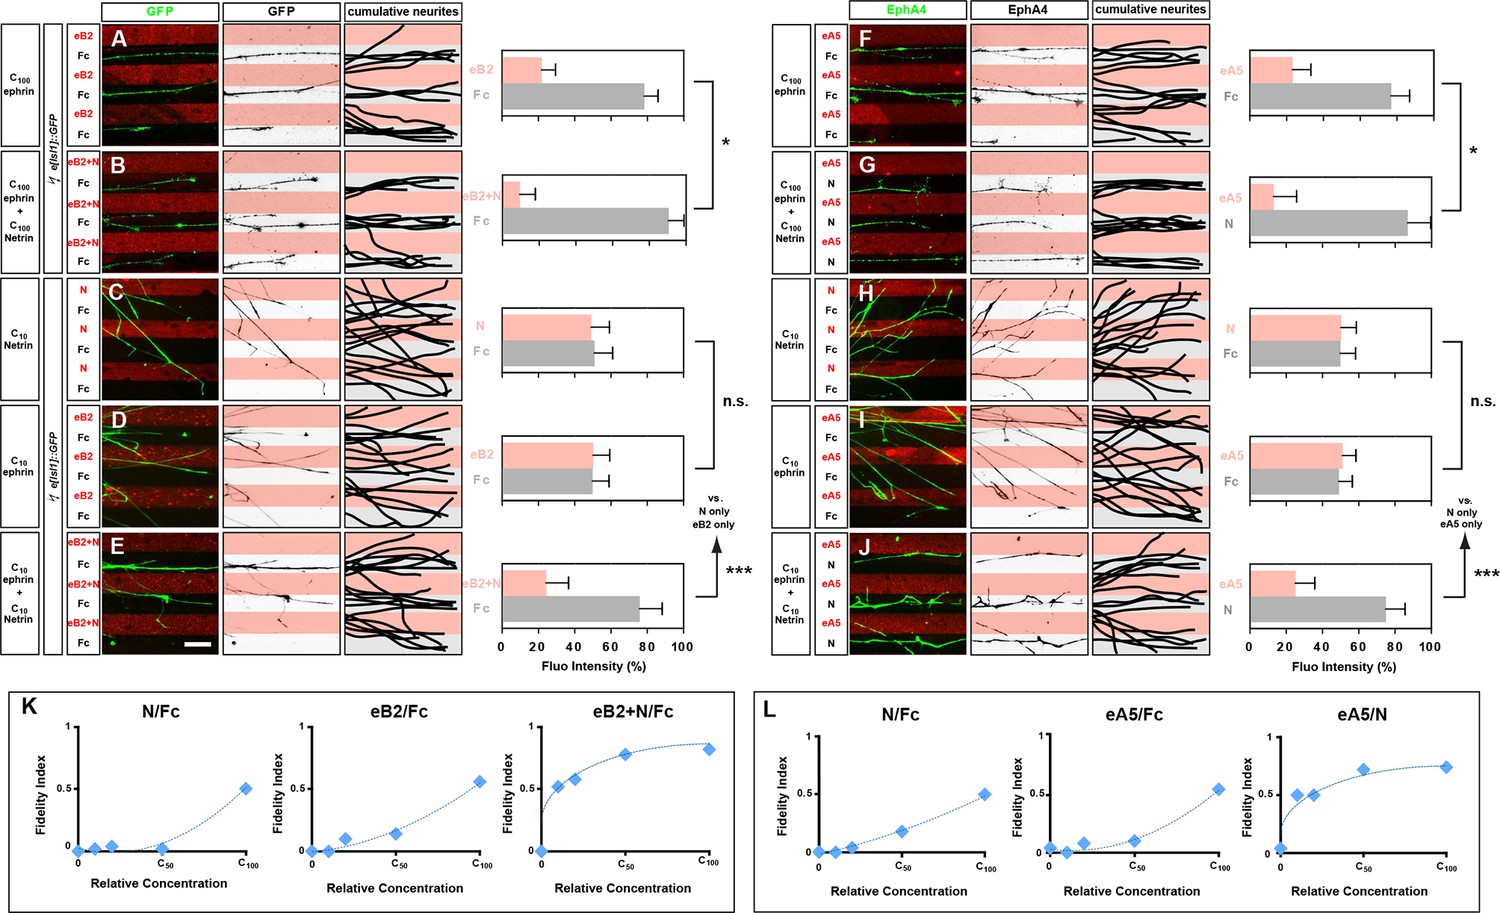
(A–J) Left panels: explanted medial (GFP+) LMC neurites of e[Isl1]::GFP-electroporated explants on C100 eB2-Fc/Fc (A), C100 eB2-Fc + C100 N/Fc (B), C10 N/Fc (C), C10 eB2-Fc/Fc (D), C10 eB2-Fc + C10 N/Fc (E) stripes and explanted lateral (EphA4+) LMC neurites on C100 eA5-Fc/Fc (F), C100 eA5-Fc/ C100 N stripes (G), C10 N/Fc (H), C10 eA5-Fc/Fc (I), or C10 eA5-Fc/C10 N (J) stripes. Middle panels: inverted images where GFP (A–E) or EphA4 (F–J) signal is dark pixels overlaid on substrate stripes. Right panels: superimposed images of five representative explants from each experimental group highlighting the distribution of LMC neurites. Quantification of medial (GFP+) or lateral (EphA4+) LMC neurites on first (pink) and second (pale) stripes expressed as a percentage of total GFP (A–E) or EphA4 (F–J) signals. C100 stripes were generated by incubating with ephrins at 10 μg/ml and/or Netrin-1 at 100 ng/ml. Experiments with intervening concentrations (C50 and C25) are shown in Figure 5—figure supplement 1. Minimal number of neurites: 72. Minimal number of explants: 11. (K, L) Plots of relative concentrations (x axis) over the fidelity index (y axis). Medial (K) or lateral (L) LMC neurites were challenged with one of five concentrations (C100, C50, C25, C10, 0) of ephrin or Netrin-1 to test for preferential LMC neurite growth. The fidelity index is the absolute value of: (percent growth on 2nd stripes – 50%)/50%. Index of 1 represents the complete repulsion or attraction of LMC neurites from the 1st stripes, and 0 represents no preference. Note that stripes at C10 concentrations induced little or no preferential LMC neurite growth when only ephrin (middle plots of K and L) or Netrin-1 (left plots of K and L) was presented, but allowed a strong preferential growth of LMC neurites when both cues were present (right plots of K and L). LMC, lateral motor column; N, Netrin-1; eA5, ephrin-A5-Fc; eB2, ephrin-B2-Fc; error bars = SD; *** = p<0.001; * = p<0.05; statistical significance computed using Mann-Whitney U test; All values (mean ± SD) can be found in Supplementary file 1B. Scale bar: 50 µm.
Figure 5—figure supplement 1
Netrin and ephrin synergy in LMC axon guidance.
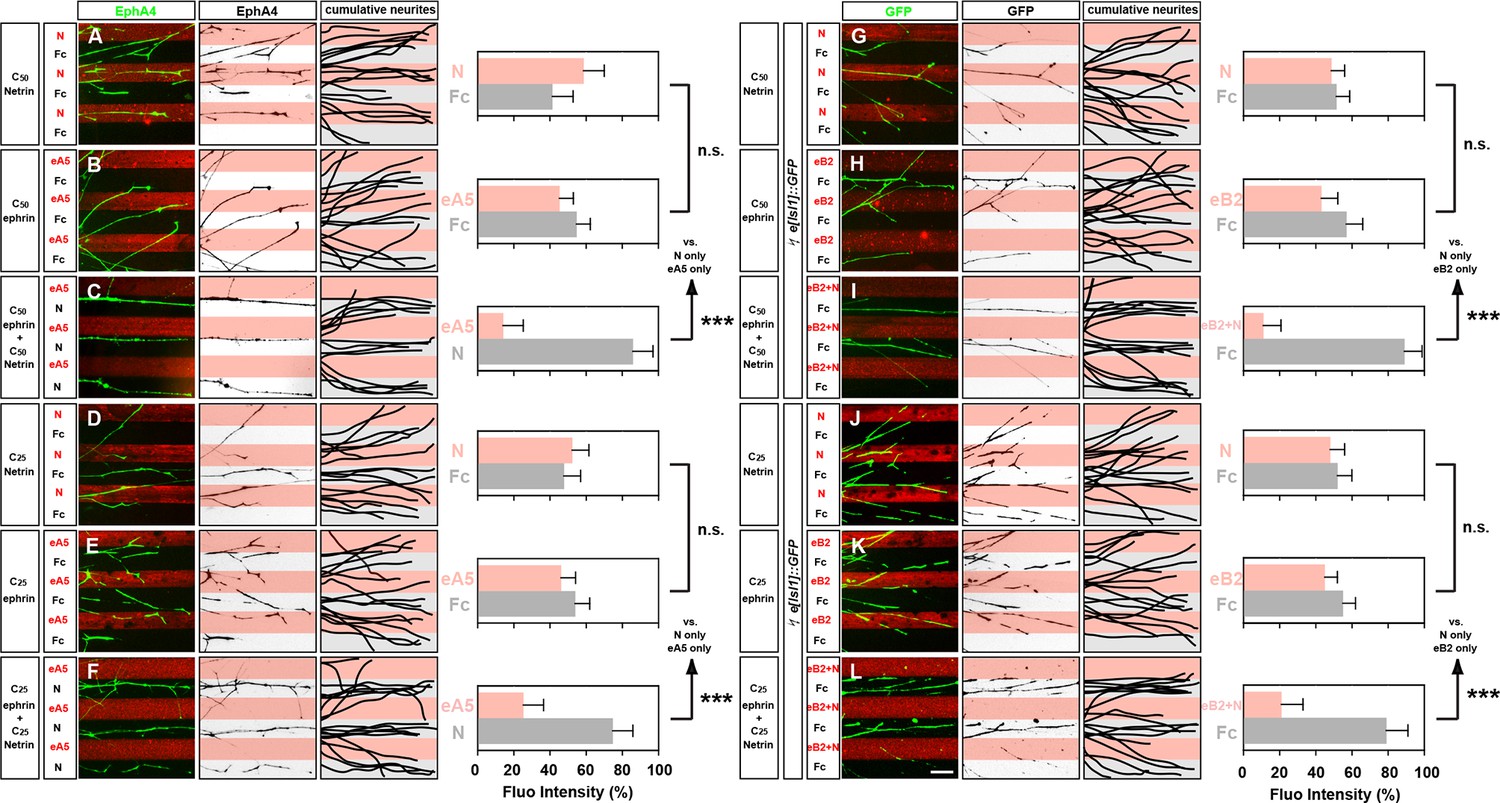
(A–L) Left panels: explanted lateral (EphA4+) LMC neurites on C50 N/Fc (A) C50 eA5-Fc/Fc (B) C50 eA5-Fc/N stripes (C) C25 N/Fc (D) C25 eA5-Fc/Fc (E) or C25 eA5-Fc/N (F) stripes, and medial (GFP+) LMC neurites of e[Isl1]::GFP-electroporated explants on C50 N/Fc (G) C50 eB2-Fc/Fc (H) C50 eB2-Fc + C50 N/Fc (I) C25 N/Fc (J) C25 eB2-Fc/Fc (J) C25 eB2-Fc + C25 N/Fc (L) stripes. Middle panels: inverted images where EphA4 (A–F) or GFP (G–L) signal is dark pixels overlaid on substrate stripes. Right panels: superimposed images of five representative explants from each experimental group highlighting the distribution of LMC neurites. Quantification of lateral (EphA4+) or medial (GFP+) LMC neurites on first (pink) and second (pale) stripes expressed as a percentage of total EphA4 (A–F) or GFP (G–L) signals. Minimal number of neurites: 72. Minimal number of explants: 11. LMC, lateral motor column; N, Netrin-1; eA5, ephrin-A5-Fc; eB2, ephrin-B2-Fc; error bars = SD; n.s. = not significant; *** = p<0.001; statistical significance computed using Mann-Whitney U test; all values are mean ± SD; scale bar: (A–L) 50 µm.
Figure 6 with 1 supplement
Ligand-dependent and signal-dependent EphB2-Unc5c complex formation and EphB2 phosphorylation.
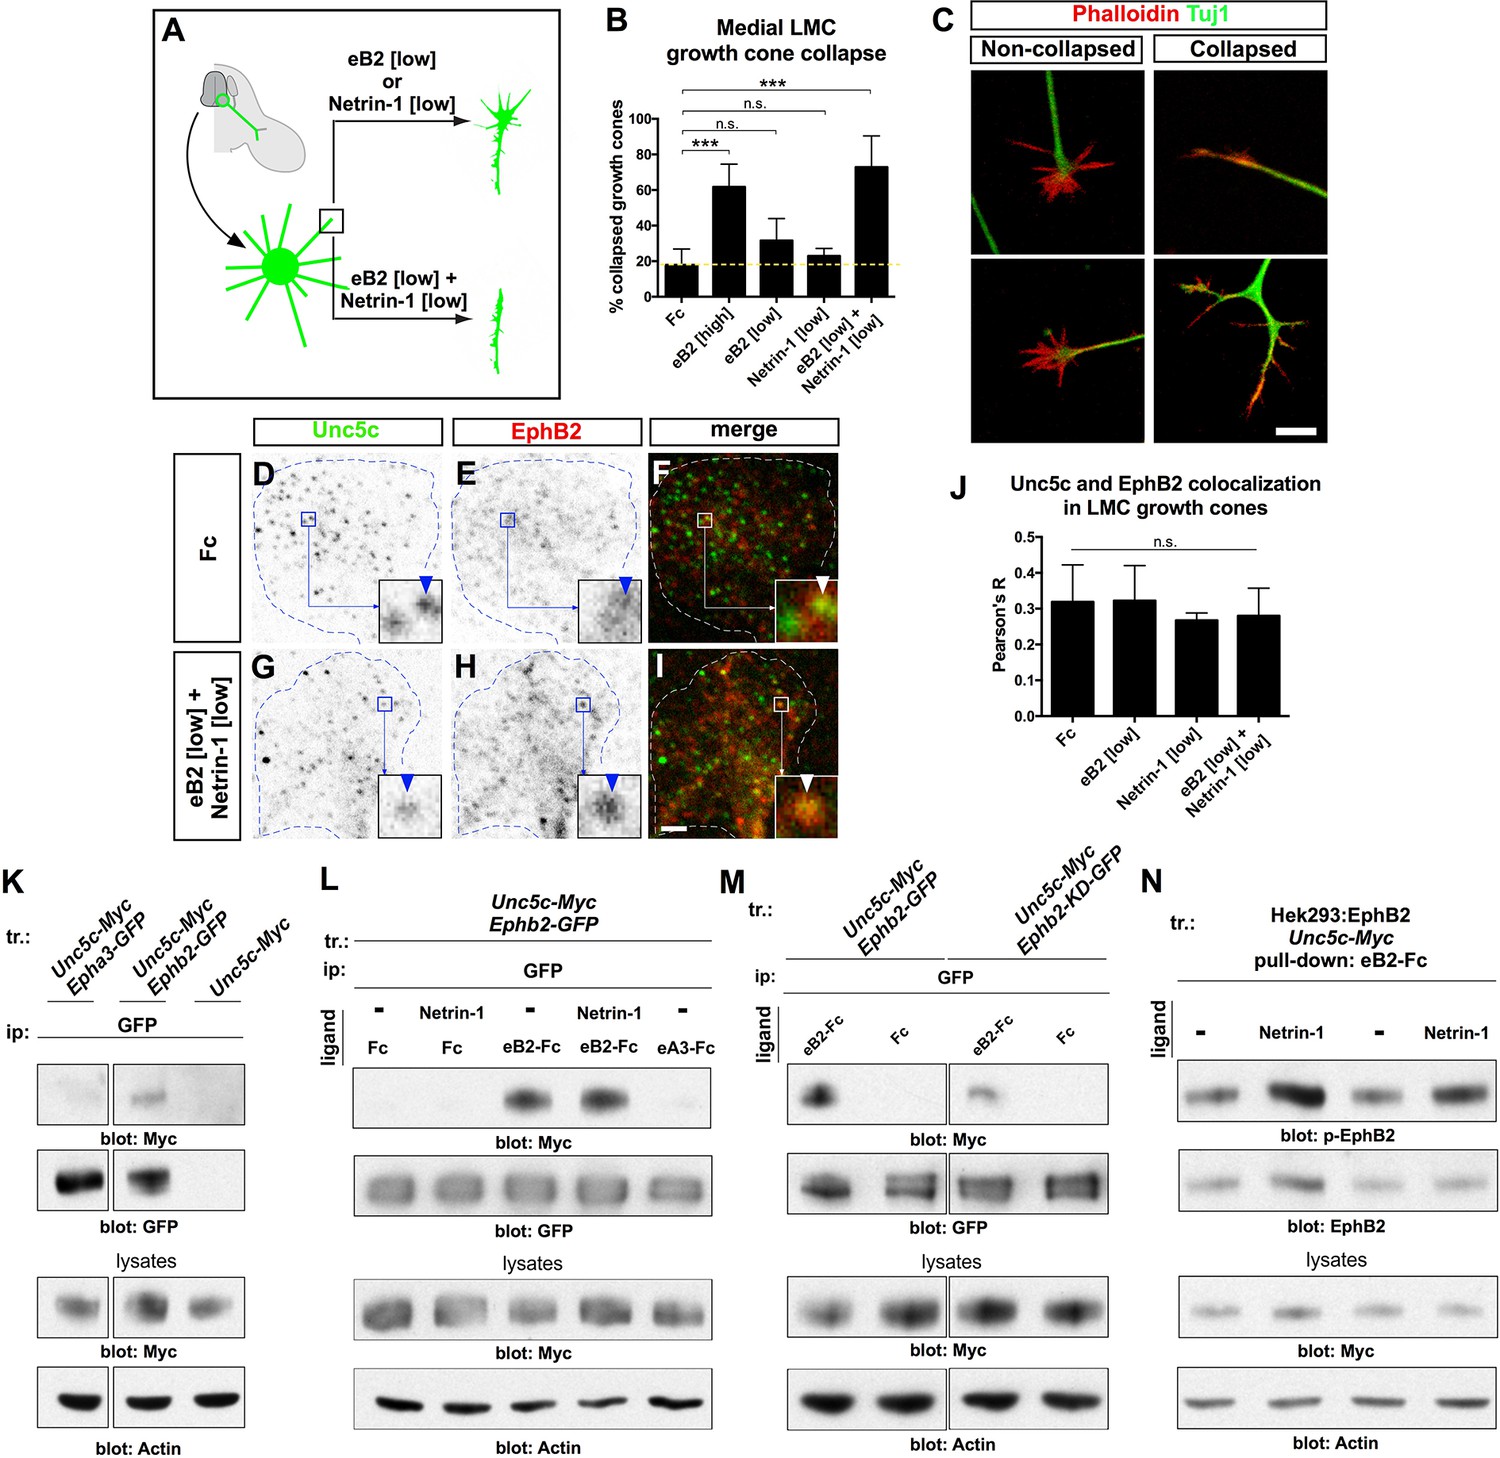
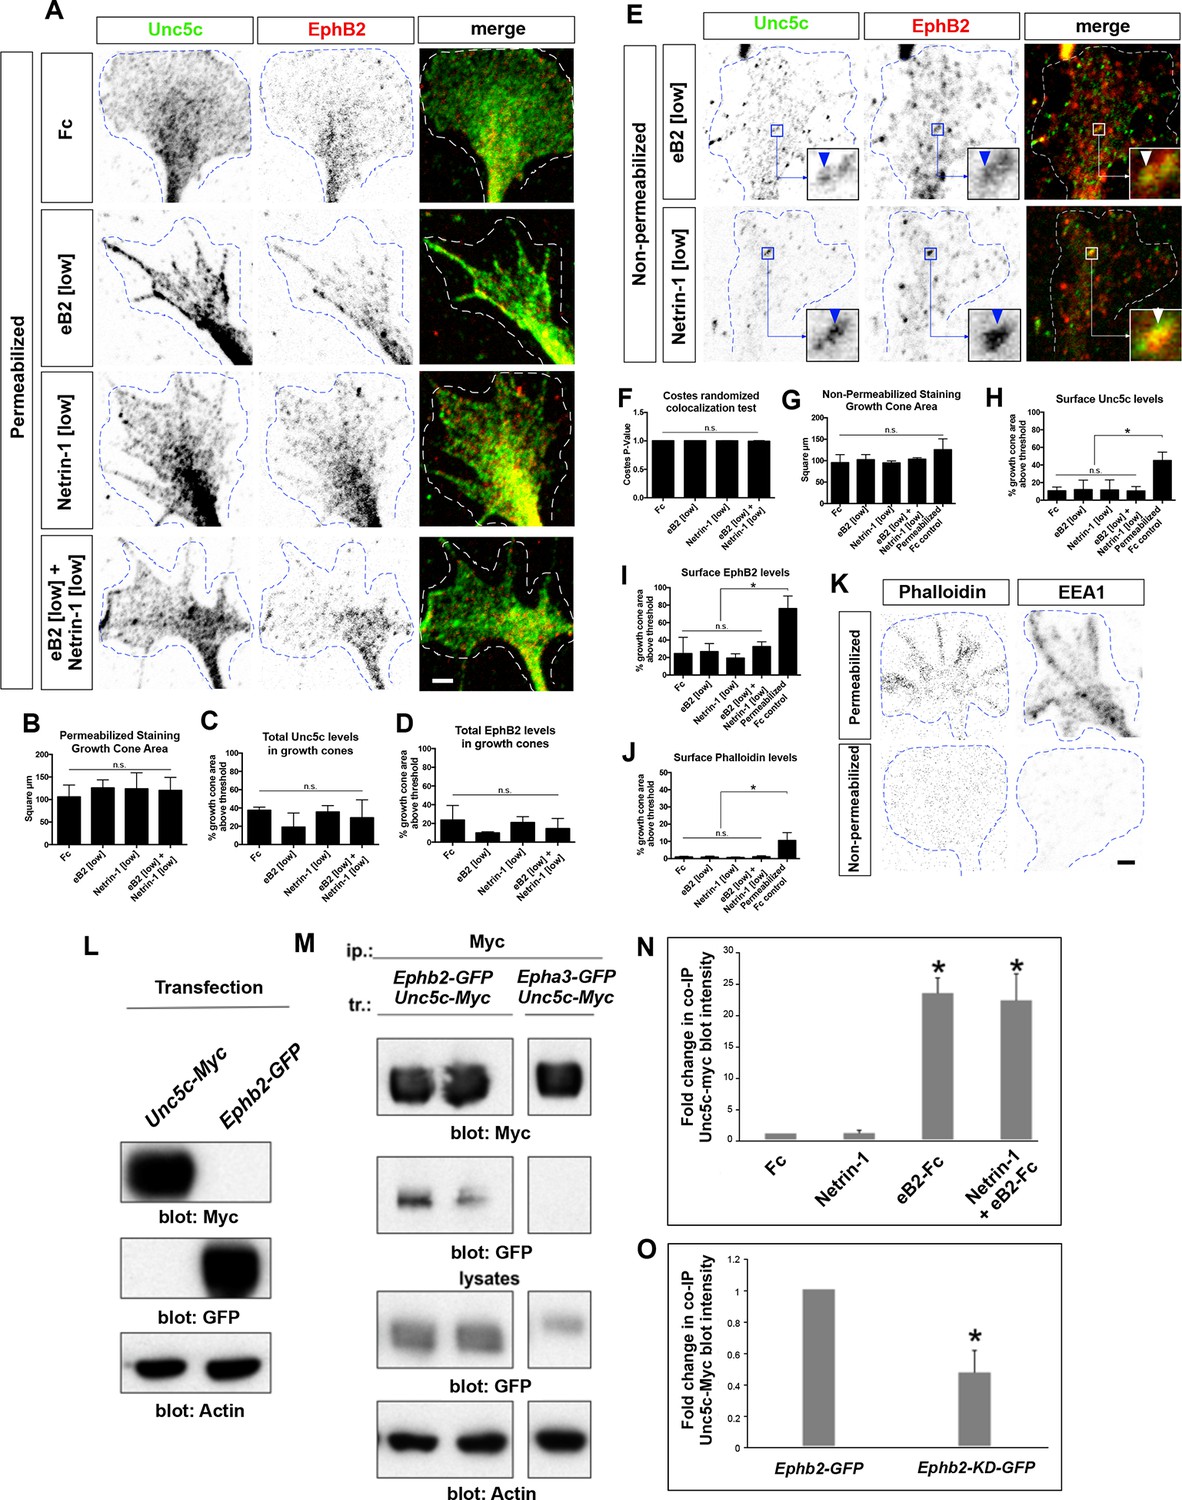
(A) Medial LMC neuron explant growth cone collapse assay scheme. (B) Percentage of collapsed e[Isl1]::GFP medial LMC growth cones following 30 min exposure to Fc (10 μg/ml), eB2-Fc (high: 10 μg/ml; low: 1 μg/ml), Netrin-1 (300 ng/ml) or Netrin-1 and eB2-Fc (300 ng/ml and 1 μg/ml). Significance computed using Fisher’s exact test. (C) Examples of growth cones labeled with Tuj1 (green) and phalloidin (red). (D–I) Unc5c and EphB2 protein localization in non-permeabilized LMC growth cones treated with Fc or eB2 and Netrin-1 for 15 min. Individual channels are inverted. All treatments result in same receptor protein signal levels (eB2 and Netrin-1 images are in Figure 6—figure supplement 1). Receptor clusters are depicted in insets, arrowheads: Unc5c and EphB2 co-localization. (J) Pearson's R value as a measure of surface Unc5c and EphB2 co-localization in LMC growth cones. Co-localization levels are higher than expected by chance, as demonstrated by Costes’ shuffled image P-value calculations (Figure 6—figure supplement 1). Ligand treatment does not increase the levels of receptor co-localization observed (p=0.7940, one-way analysis of variance (ANOVA) and Tukey's multiple comparisons test; N = 3; n ≥ 33 growth cones per treatment). (K) Unc5c and EphB2 receptor interactions. Unc5c-Myc was co-immunoprecipitated with EphB2-GFP but not with EphA3-GFP in transfected HEK-293 cells. All samples shown were run in same gel. (L) Unc5c-EphB2 interaction is selectively enhanced by 15 min incubation with eB2-Fc (1.5 μg/ml) or eB2-Fc+Netrin-1 (1.5 μg/ml +250ng/ml) but not with Netrin-1 (250 ng/ml), Fc (1.5 μg/ml), or ephrin-A3-Fc (1.5 μg/ml) prior to lysates preparation. Fc fusion proteins were pre-clustered by incubating them with anti-human or anti-mouse Ig for 1 hr at 4°C. For quantifications see Figure 6—figure supplement 1N. (M) Comparison of Unc5c interactions with wild-type or kinase-dead EphB2. Unc5c-Myc/EphB2-GFP interaction is blocked when a single point mutation is introduced in EphB2-GFP abolishing its kinase function (EphB2-KD-GFP, Dalva et al., 2000). For quantifications see Figure 6—figure supplement 1O. All samples shown were run in same gel. (N) P-EphB2 levels are increased upon stimulation with Netrin-1+eB2-Fc compared with eB2-Fc alone. p-EphB2 was developed first, followed by stripping of the membrane and re-blotting with anti-EphB2 antibody. Two replicate comparisons are shown; one sample t-test; p<0.02, N=10 comparisons, 4 experiments. eB2, ephrin-B2-Fc; ip, immunoprecipitation; LMC, lateral motor column; tr, transfection. All error bars = SD; *** = p<0.001; n.s. = not significant; scale bars: (C) 10 μm; (D–I) 2 μm. All values (mean ± SD) can be found in Supplementary file 1B.
Figure 6—figure supplement 1
Unc5c–EphB2 receptor association.
(A) Unc5c and EphB2 protein localization in permeabilized LMC growth cones treated for 15 min with Fc, Netrin-1, eB2, Netrin-1+eB2. Individual channels are inverted. (B) Growth cone size does not change following Fc, eB2, Netrin-1, or Netrin-1+eB2 treatment for 15 min (p=0.8161 using one-way ANOVA; N = 3; n ≥ 36 growth cones per treatment). All treatments result in same receptor protein signal levels. (C) Quantification of Unc5c protein signal in LMC growth cones as fraction of growth cone area above threshold (p=0.3643, one-way ANOVA and Tukey's multiple comparisons test; N = 3; n ≥ 36 growth cones per treatment). (D) Quantification of EphB2 protein signal in LMC growth cones as fraction of growth cone area above threshold (p=0.3862, one-way ANOVA and Tukey's multiple comparisons test; N = 3; n ≥ 36 growth cones per treatment). (E) Unc5c and EphB2 protein localization in non-permeabilized LMC growth cones treated with eB2 or Netrin-1 for 15 min. Individual channels are inverted. Receptor clusters are depicted in insets, arrowheads: Unc5c and EphB2 co-localization. (F) Costes’ P-value analysis for Fc-treated, eB2-treated, Netrin-1-treated, and Netrin-1+eB2-treated non-permeabilized growth cones, calculated by automatically shuffling appropriately sized chunks of one of the channels of an image and running co-localization analysis. This was done 100 times per image. A value of 1 signifies that 100% of the shuffled results had a Pearson's R value lower than the one calculated for the original image, i.e. observed co-localization is higher than expected by chance (N = 3; n ≥ 33 growth cones per treatment). (G) Quantification of growth cone size for non-permeabilized growth experiments (p=0.1675 using one-way ANOVA, N = 3; n ≥ 33 growth cones per treatment). (H) Quantification of Unc5c protein signal in LMC growth cones as fraction of growth cone area above threshold (no significant differences, except between permeabilized and non-permeabilized, p<0.05; one-way ANOVA followed by Tukey's multiple comparisons test; N = 3; n ≥ 33 growth cones per treatment; detailed values in supplemental file 1C). (I) Quantification of EphB2 protein signal in LMC growth cones as fraction of growth cone area above threshold (no significant differences, except between permeabilized and non-permeabilized, p<0.05; one-way ANOVA followed by Tukey's multiple comparisons test; N = 3; n ≥ 33 growth cones per treatment). (J) Quantification of phalloidin signal reflecting successful non-permeabilized staining, expressed as fraction of growth cone area above threshold (no significant differences, except between permeabilized and non-permeabilized, p<0.05; one-way ANOVA followed by Tukey's multiple comparisons test; N = 3; n ≥ 33 growth cones per treatment). (K) Permeabilized versus non-permeabilized signal for fluorescent-conjugated phalloidin and early endosome marker 1 (EEA1), showing successful staining with minimal membrane permeabilization. n.s. = not significant; error bars = SD. (L) Specificity of antibodies in immunoblot detection. HEK293 cells were transfected with Unc5c-Myc or EphB2-GFP and anti-Myc and anti-GFP antibodies were used in western blots to detect expressed proteins from total lysates. (M) Co-immunoprecipitation of EphB2 by Unc5c. EphB2-GFP was immunoprecipitated by Myc antibody from lysates of Unc5c-Myc-transfected and Ephb2-GFP-transfected HEK293 cells. (N) Co-immunoprecipitated Unc5c fold changes. Pixel intensity and area of unsaturated western blot bands were measured in inverted images in Photoshop and total intensity calculated. For fold changes calculations, values of co-immunoprecipitated Unc5c in each treatment were normalized to immunoprecipitated EphB2-GFP and compared with Fc condition. One sample t-test, * = p<0.05; N=4 in each condition. (O) Reduction in co-immunoprecipitated Unc5c by EphB2-KD-GFP when compared with EphB2-GFP interactions. Calculation of band intensities were done as described in (N). Values of co-immunoprecipitated Unc5c-Myc were normalized to immunoprecipitated EphB2-GFP or EphB2-KD-GFP and the fold change between EphB2-KD-GFP and EphB2-GFP calculated. One sample t-test, * = p<0.05; N=4 in each condition. LMC, lateral motor column; scale bars: (A, E, K) 2 μm.
Figure 7 with 1 supplement
Src family kinases (SFKs) are required for synergistic repulsion from ephrin-B2 and Netrin-1.
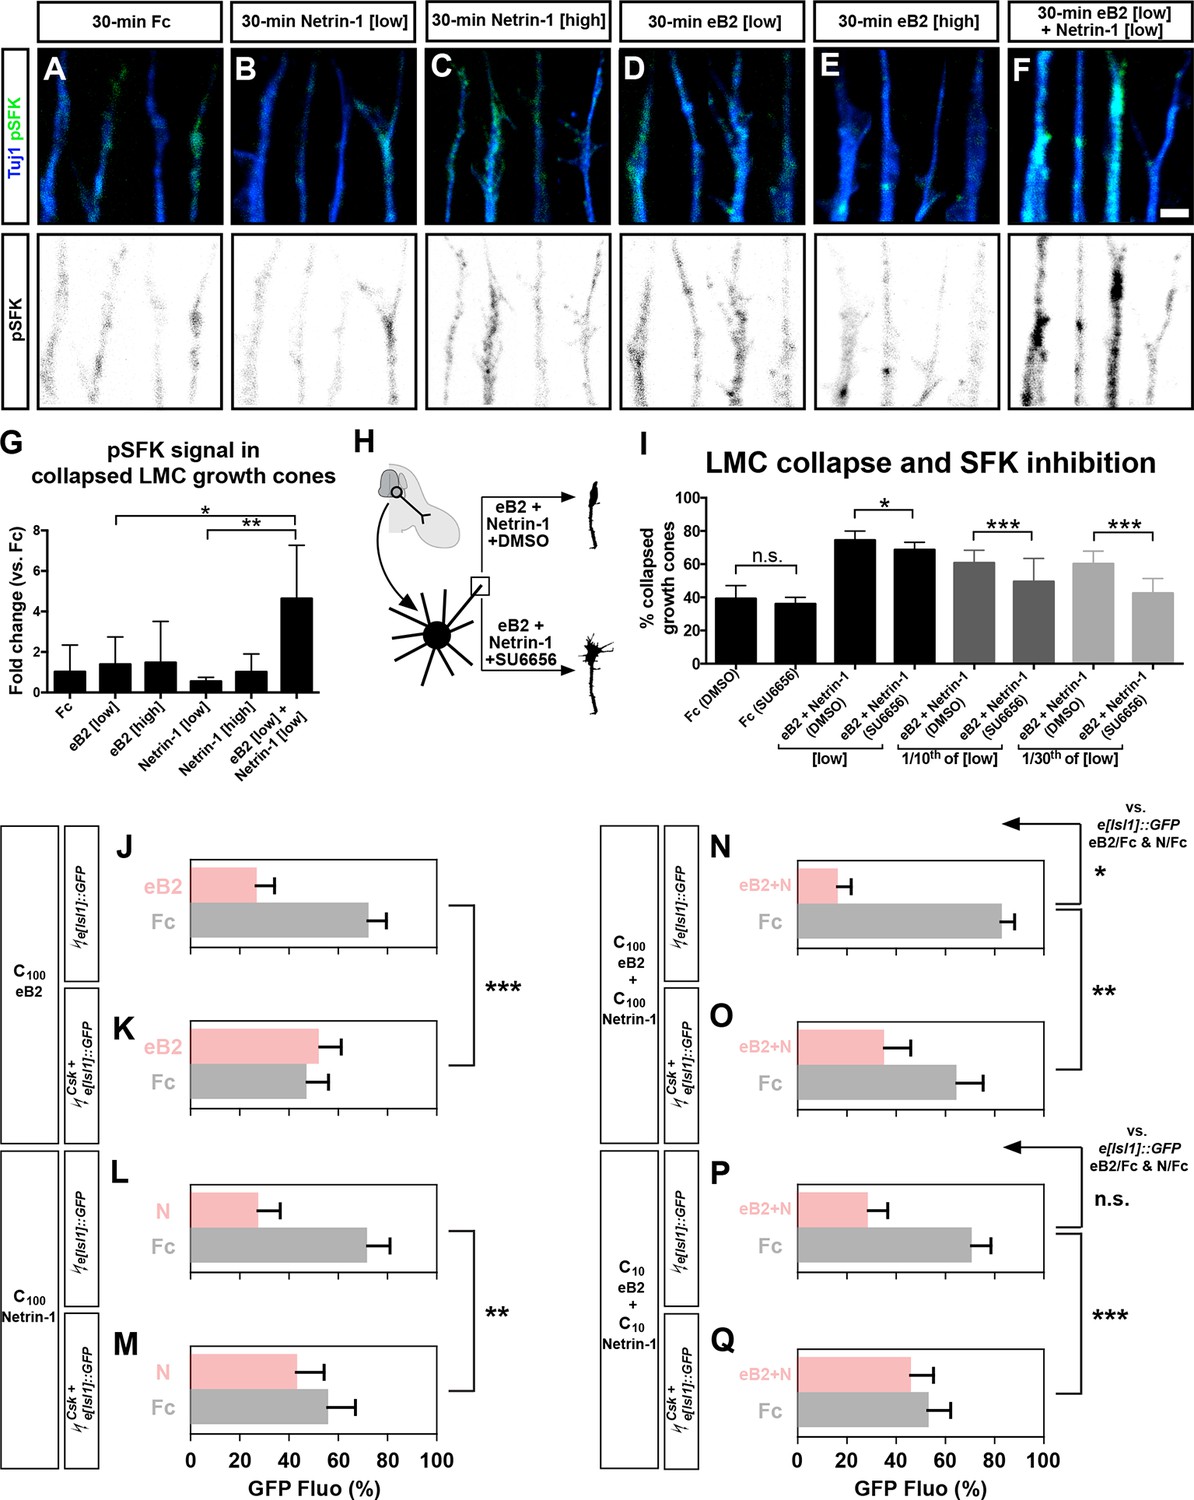
(A–F) Detection of pSFKs (green) and Tuj1 (blue) in collapsed growth cones after 30’ treatment with Fc (10 μg/ml), low Netrin-1 (0.3 μg/ml), high Netrin-1 (1 μg/ml), low eB2 (1 μg/ml), high eB2 (10 μg/ml), or low eB2 and low Netrin-1 (1 μg/ml and 0.3 μg/ml). Bottom panels show inverted images of the pSFK channel. (G) Quantification of pSFK detected in collapsed growth cones treated as above. In the presence of low Netrin-1 and eB2 concentrations, pSFK signal is increased when compared with low eB2 or low Netrin-1 alone. Statistical significance computed using one-way ANOVA and Tukey's multiple comparisons test; N = 3, n ≥ 10 growth cones per condition per experiment. (H) LMC neuron explant growth cone collapse assay and SFK inhibition scheme. (I) Percentage of collapsed LMC growth cones following 30 min exposure to Fc (10 μg/ml), or Netrin-1 and eB2-Fc (0.3 μg/ml and 1 μg/ml; 1/10th of this concentration; or 1/30th of this concentration), in the presence or absence of 0.1 μM SFK inhibitor SU6656. N ≥ 3, significance computed using Fisher’s exact test with n > 400 growth cones for each treatment. (J–Q) Quantification of medial (GFP+) LMC neurites of e[Isl1]::GFP-electroporated explants on C100 eB2/Fc (J), C100 N/Fc (L), C100 eB2+N/Fc (N), and C10 eB2+N/Fc (P), and Csk and e[Isl1]::GFP-co-electroporated explants on C100 eB2/Fc (K), C100 N/Fc (M), C100 eB2+N/Fc (O), and C10 eB2+N/Fc (Q). Quantification of neurites on first (pink) and second (gray) stripes expressed as a percentage of total GFP signals. Minimal number of neurites: 80. Minimal number of explants: 12. Statistical significance computed using Mann-Whitney U test. eB2, ephrin-B2-Fc; LMC, lateral motor column; N, Netrin-1; All error bars = SD; n.s.: not significant; *: p<0.05; **: p<0.01; ***: p<0.001; scale bar: 2 μm. All values (mean ± SD) can be found in Supplementary file 1B.
Figure 7—figure supplement 1
pSFK controls and Csk-electroporated axons in stripe assays.
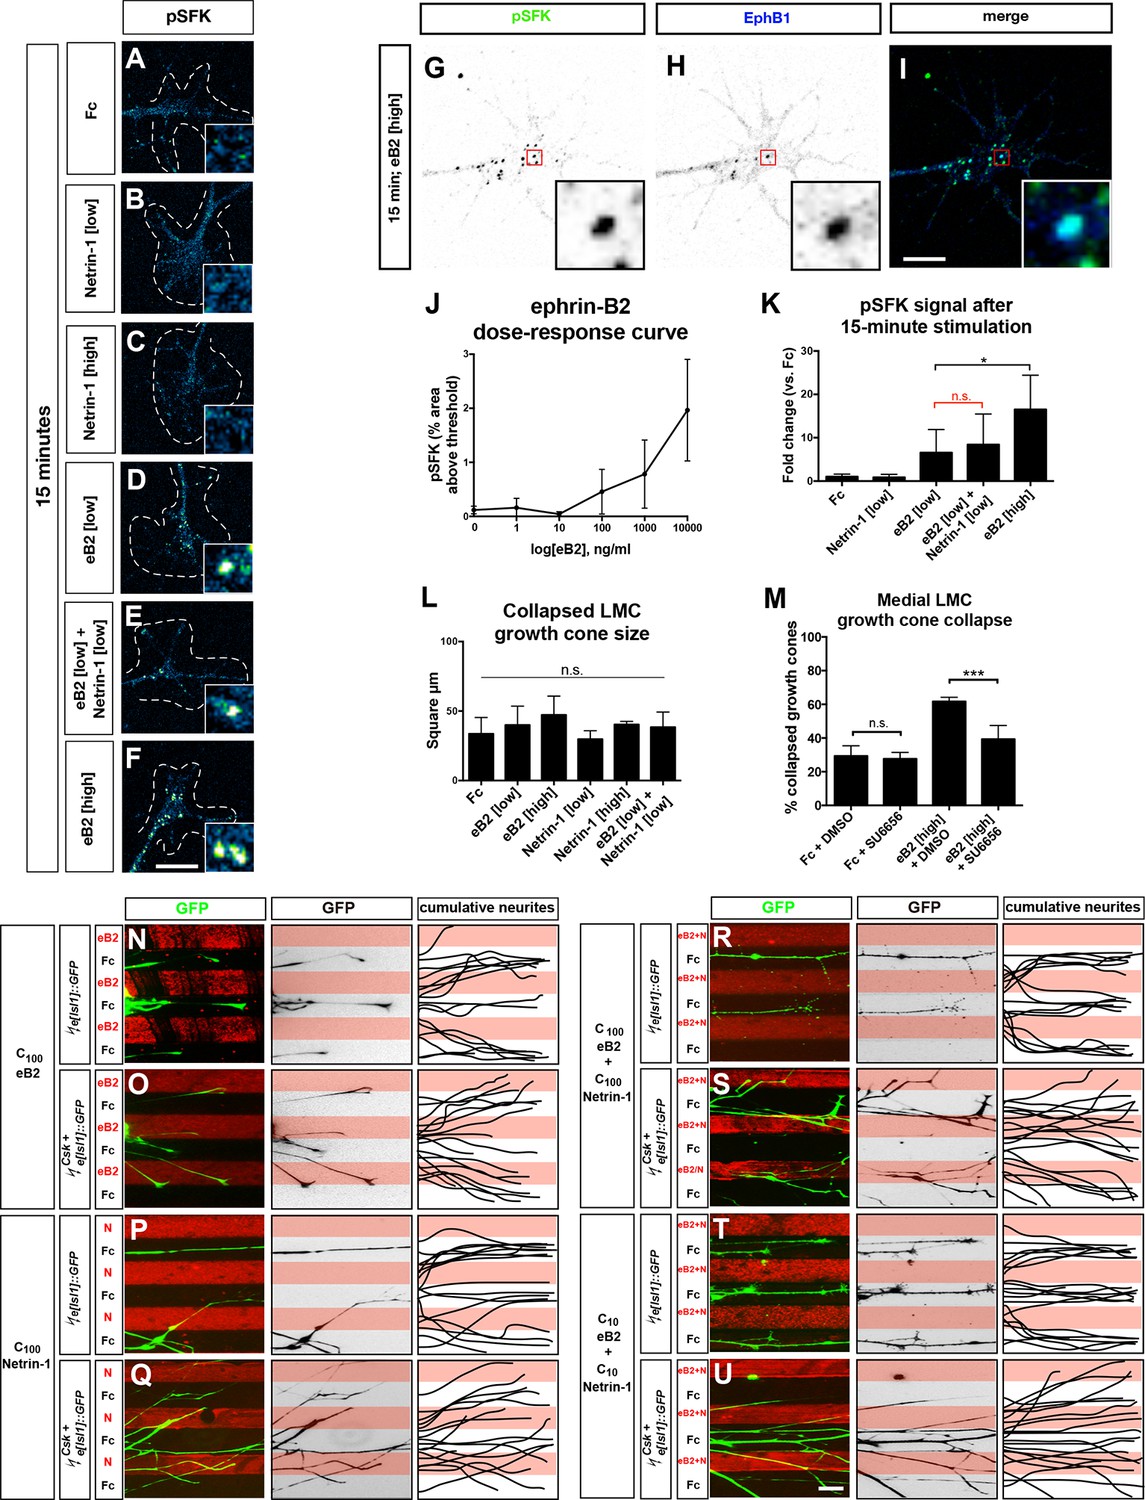
(A–F) Detection of pSFK in LMC growth cones treated for 15 min. (G–I) Co-localization of pSFK and EphB1 receptor clusters in LMC growth cones. (J) pSFK signal increases with increasing dose of ephrin-B2 ligand. (K) A 15-min. treatment with 1 μg/ml ephrin-B2 activates pSFK to the same extent as 1 μg/ml ephrin-B2 + 0.3 μg/ml Netrin-1, but not as much as 10 μg/ml ephrin-B2. Statistical significance computed using one-way ANOVA and Sidak’s multiple comparisons test; N ≥ 3, n ≥ 10 growth cones per condition per experiment. (L) Area of collapsed growth cones analyzed for pSFK quantification. Statistical significance computed using one-way ANOVA. (M) Medial LMC growth cones of e[Isl1]::GFP-electroporated explants collapse in response to a high dose of ephrin-B2 (10 μg/ml), and this can be blocked by including 0.1 μM SU6656 with the ligand. Statistical significance computed using Fisher’s exact test; N = 3, n > 190 growth cones per condition. (N–U) Left panels: medial (GFP+) LMC neurites of e[Isl1]::GFP-electroporated explants on C100 eB2-Fc/Fc (N), C100 N/Fc (P), C100 eB2-Fc+N/Fc (R), and C10 eB2-Fc+N/Fc (T), and Csk and e[Isl1]::GFP-co-electroporated explants on C100 eB2-Fc/Fc (O), C100 N/Fc (Q), C100 eB2-Fc+N/Fc (S), and C10 eB2-Fc+N/Fc (U). Middle panels: inverted images where GFP signal is dark pixels overlaid on substrate stripes. Right panels: superimposed images of five representative explants from each experimental group highlighting the distribution of LMC neurites. Images correspond to the experiments in Figure 7. eB2, ephrin-B2-Fc; LMC, lateral motor column; N, Netrin-1; SFK, Src family kinase; All error bars = SD; n.s. = not significant; ***: p<0.001; *: p<0.05; scale bars: (A–F) 8 μm; (G–I) 6 μm; (N–U) 50 μm.
Figure 8
Model summarizing EphB2 interactions with Unc5c.
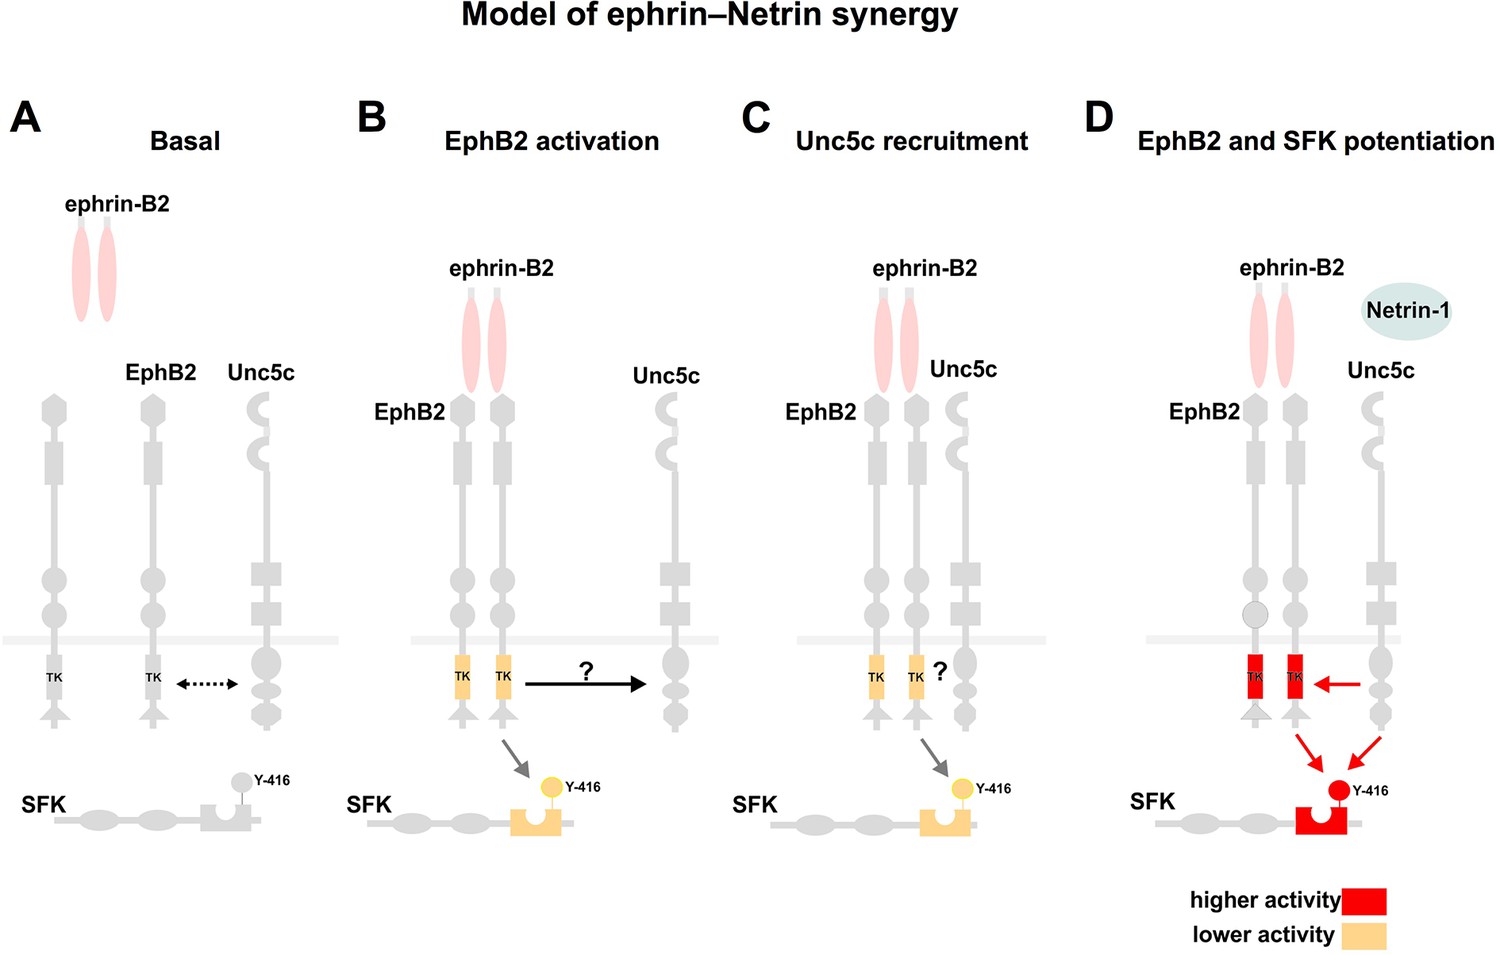
(A) Under non-stimulated conditions there is a low level interaction between EphB2 and Unc5c (depicted by dotted two-directional arrow). (B, C) Upon ephrin-B2 stimulation, signaling through EphB2 kinase activity induces direct or indirect association (arrow) with Unc5c. (D) Netrin-1 signals through the novel receptor complex resulting in elevated EphB2 phosphorylation and, together with EphB2, in SFK potentiation. SFK, Src family kinase; TK, tyrosine kinase domain. Y-416, tyrosine-416 of Src, whose phosphorylation positively correlates with Src kinase activity.
Additional files
-
Supplementary file 1
Antisera, recombinant proteins, and quantification values. (A) Table listing all antibodies and recombinant proteins used. (B) Values of quantifications in main figures. (C) Values of quantifications in figure supplements.
- https://doi.org/10.7554/eLife.10841.019
Download links
A two-part list of links to download the article, or parts of the article, in various formats.
Downloads (link to download the article as PDF)
Open citations (links to open the citations from this article in various online reference manager services)
Cite this article (links to download the citations from this article in formats compatible with various reference manager tools)
Synergistic integration of Netrin and ephrin axon guidance signals by spinal motor neurons
eLife 4:e10841.
https://doi.org/10.7554/eLife.10841


