CasExpress reveals widespread and diverse patterns of cell survival of caspase-3 activation during development in vivo
- University of California, Santa Barbara, United States
- Johns Hopkins School of Medicine, United States
Figures
Figure 1
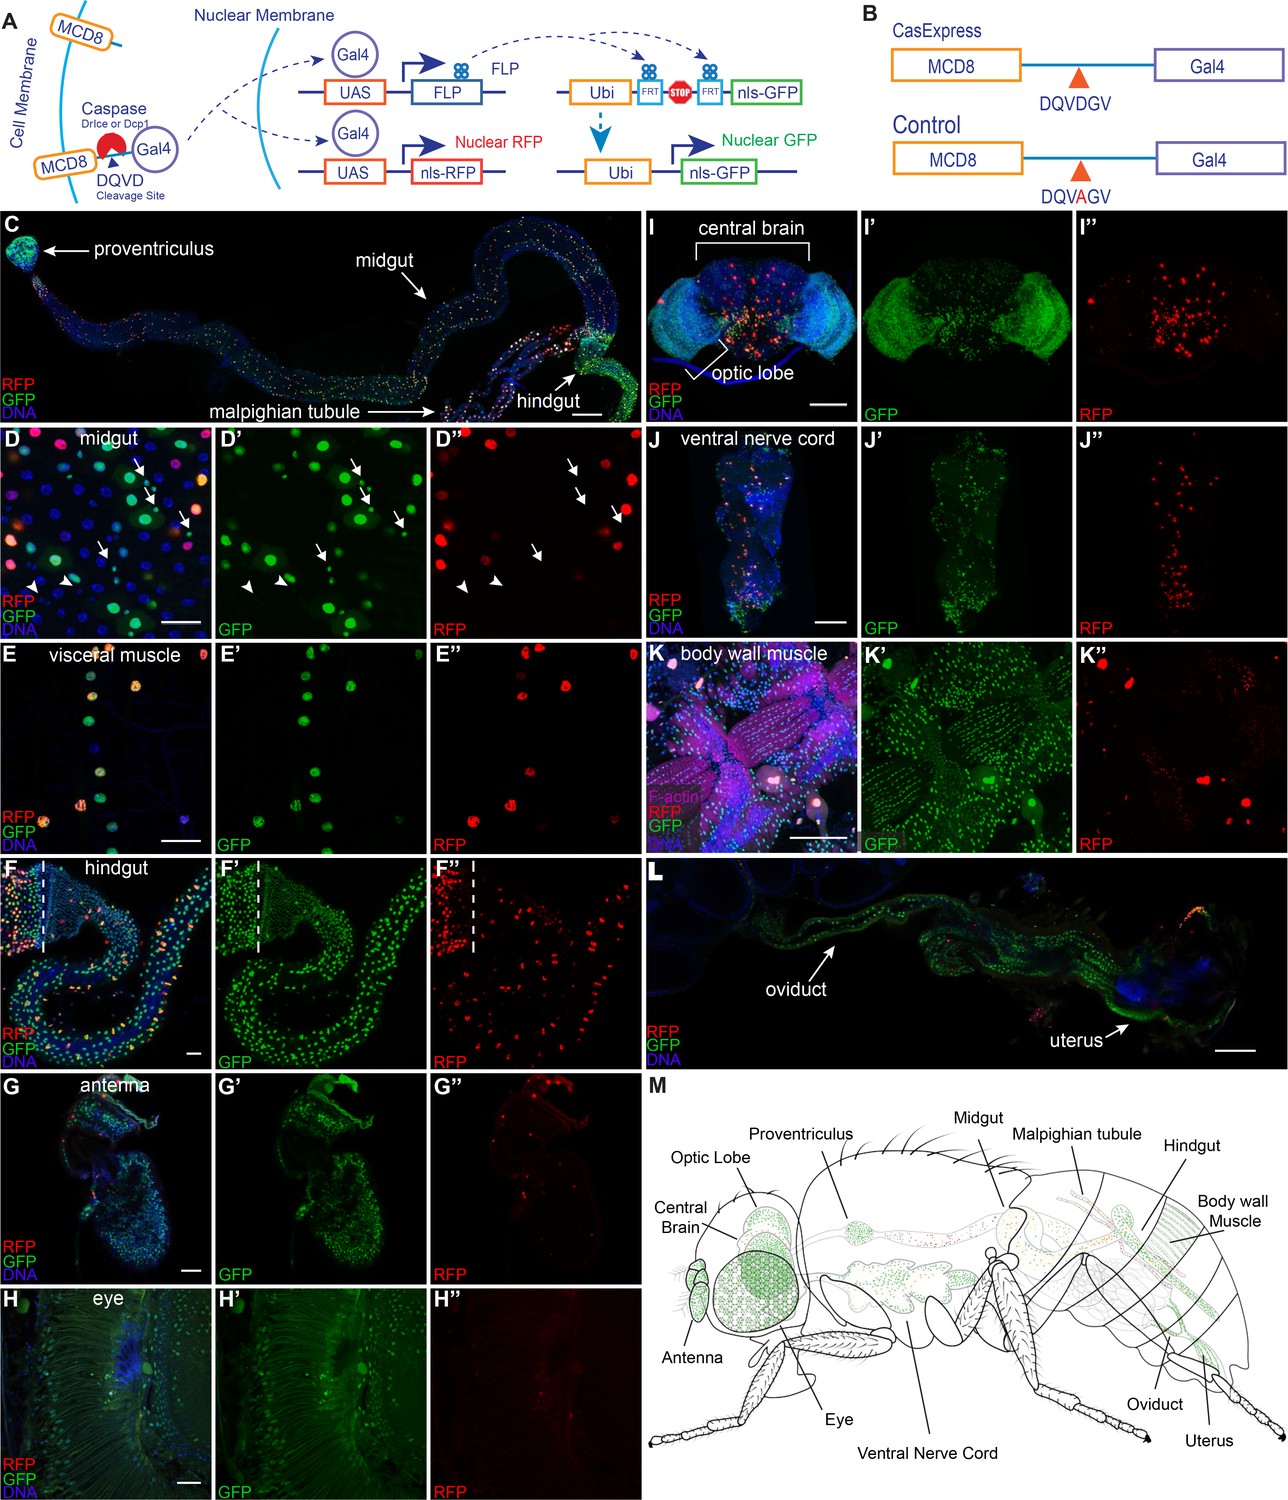
Widespread CasExpress activation in adult tissues.
(A) A schematic of CasExpress and G-trace. (B) A schematic showing the sequence of the DQVD caspase cleavage site in CasExpress and the point mutation in the DQVA control. (C–L) Confocal micrographs showing overlays of DAPI, RFP and GFP from CasExpress/G-Trace flies. (D’–L’) GFP channel only. (D”–L”) RFP channel only. Arrows in D–D’’ indicate examples of GFP+ progenitor cells, and arrowheads point to examples of GFP- progenitor cells. Dotted lines in F–F’’ mark the boundary between midgut and hindgut. Scale bars in C and I-L are 100 μm; scale bars in D–H are 25 μm. (M) A schematic summarizing the general pattern of GFP and RFP expression in adult. Although GFP expression was present in all body wall muscle, only part is shown in green for simplicity and presentation clarity.
Figure 2 with 1 supplement
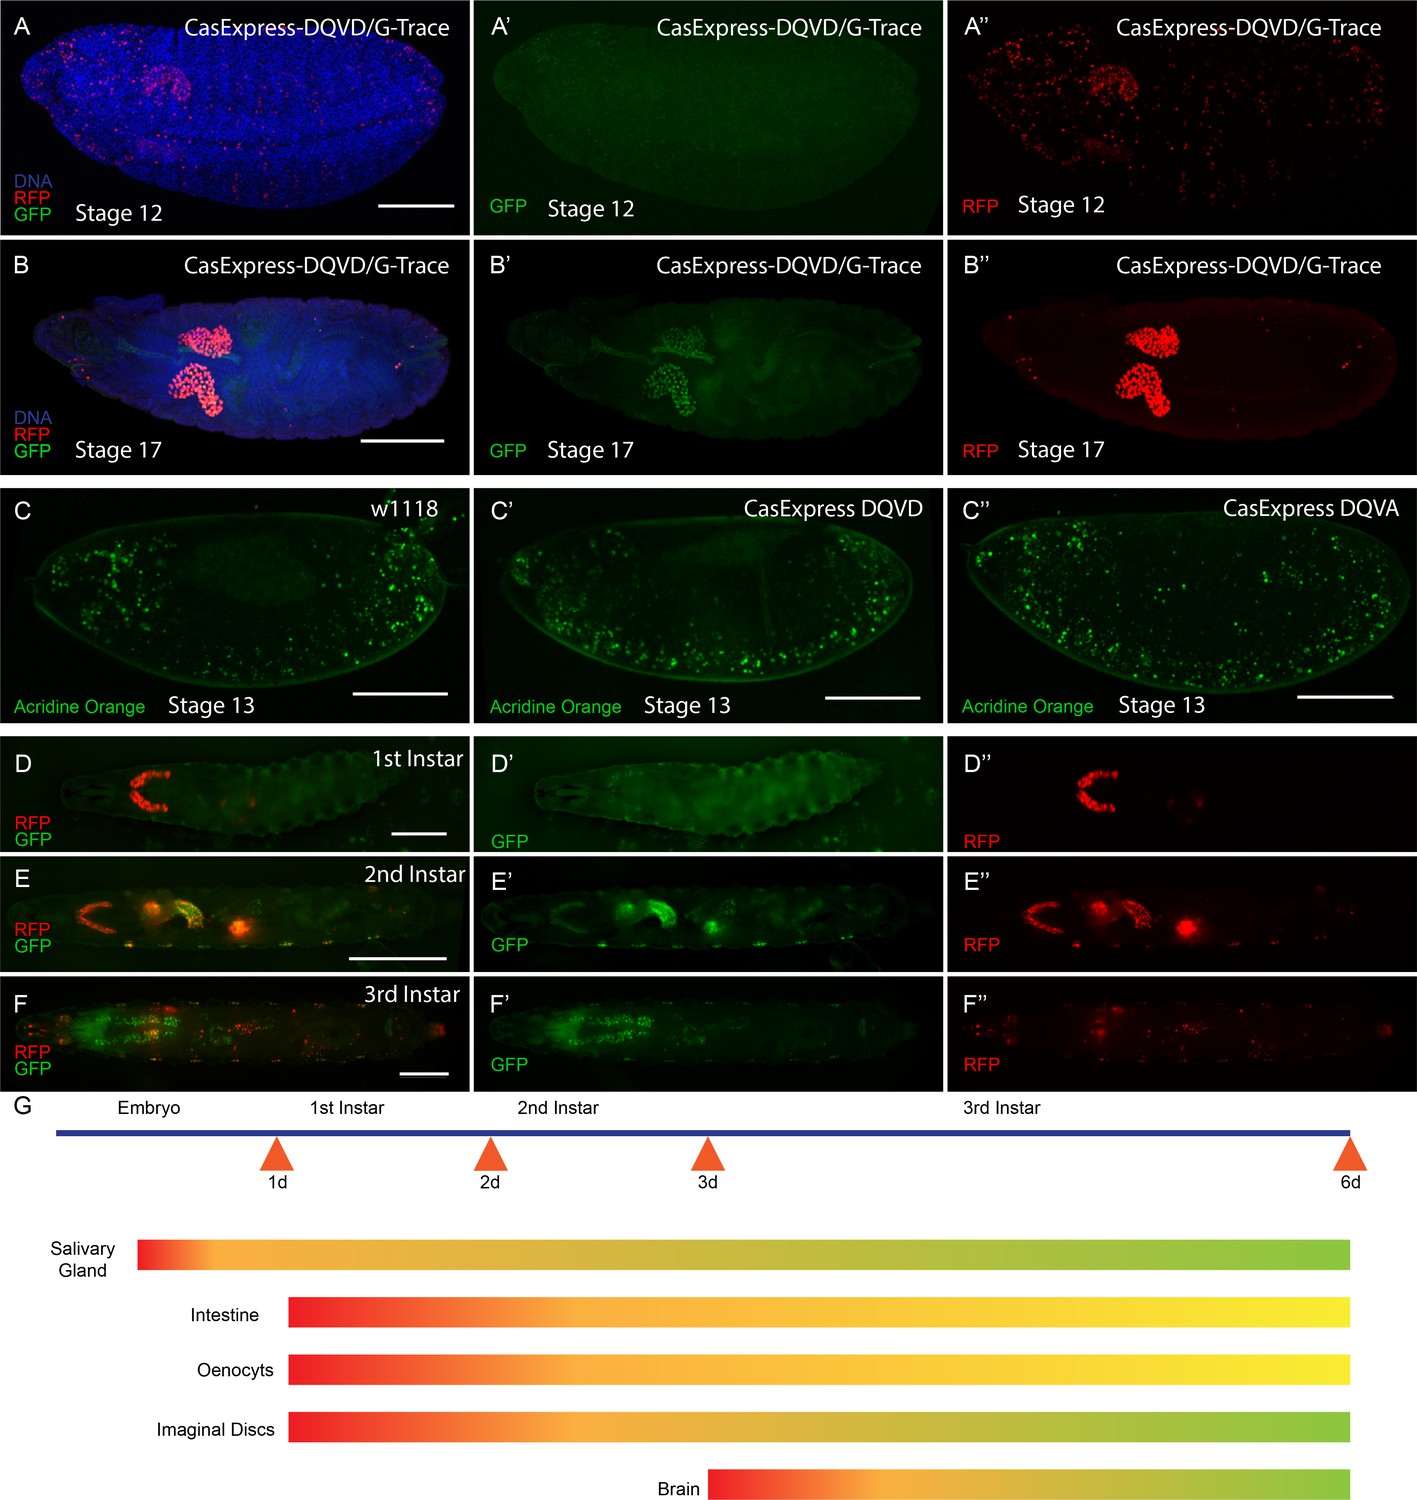
CasExpress activation in embryos and larvae.
(A–B”) RFP and GFP expression in Drosophila embryos (A–A”) stage 12, (B–B”) stage 17. (C–C”) Acridine orange detection of apoptotic cells in stage 13 embryos of the indicated genotypes. (D–D”) 1st instar larva, (E–E”) 2nd instar larva and (F–F”) 3rd instar larva. (G) A schematic summarizing of GFP and RFP expression in above stages. Red represents RFP expression. Green represents GFP. Yellow/Orange indicates either a mixture of GFP positive and RFP positive cell populations or the presence of cells expressing both. Scale bars represent: 100 μm (A–C); 200 μm (D); 400 μm (E); and 600 μm (F).
Figure 2—figure supplement 1
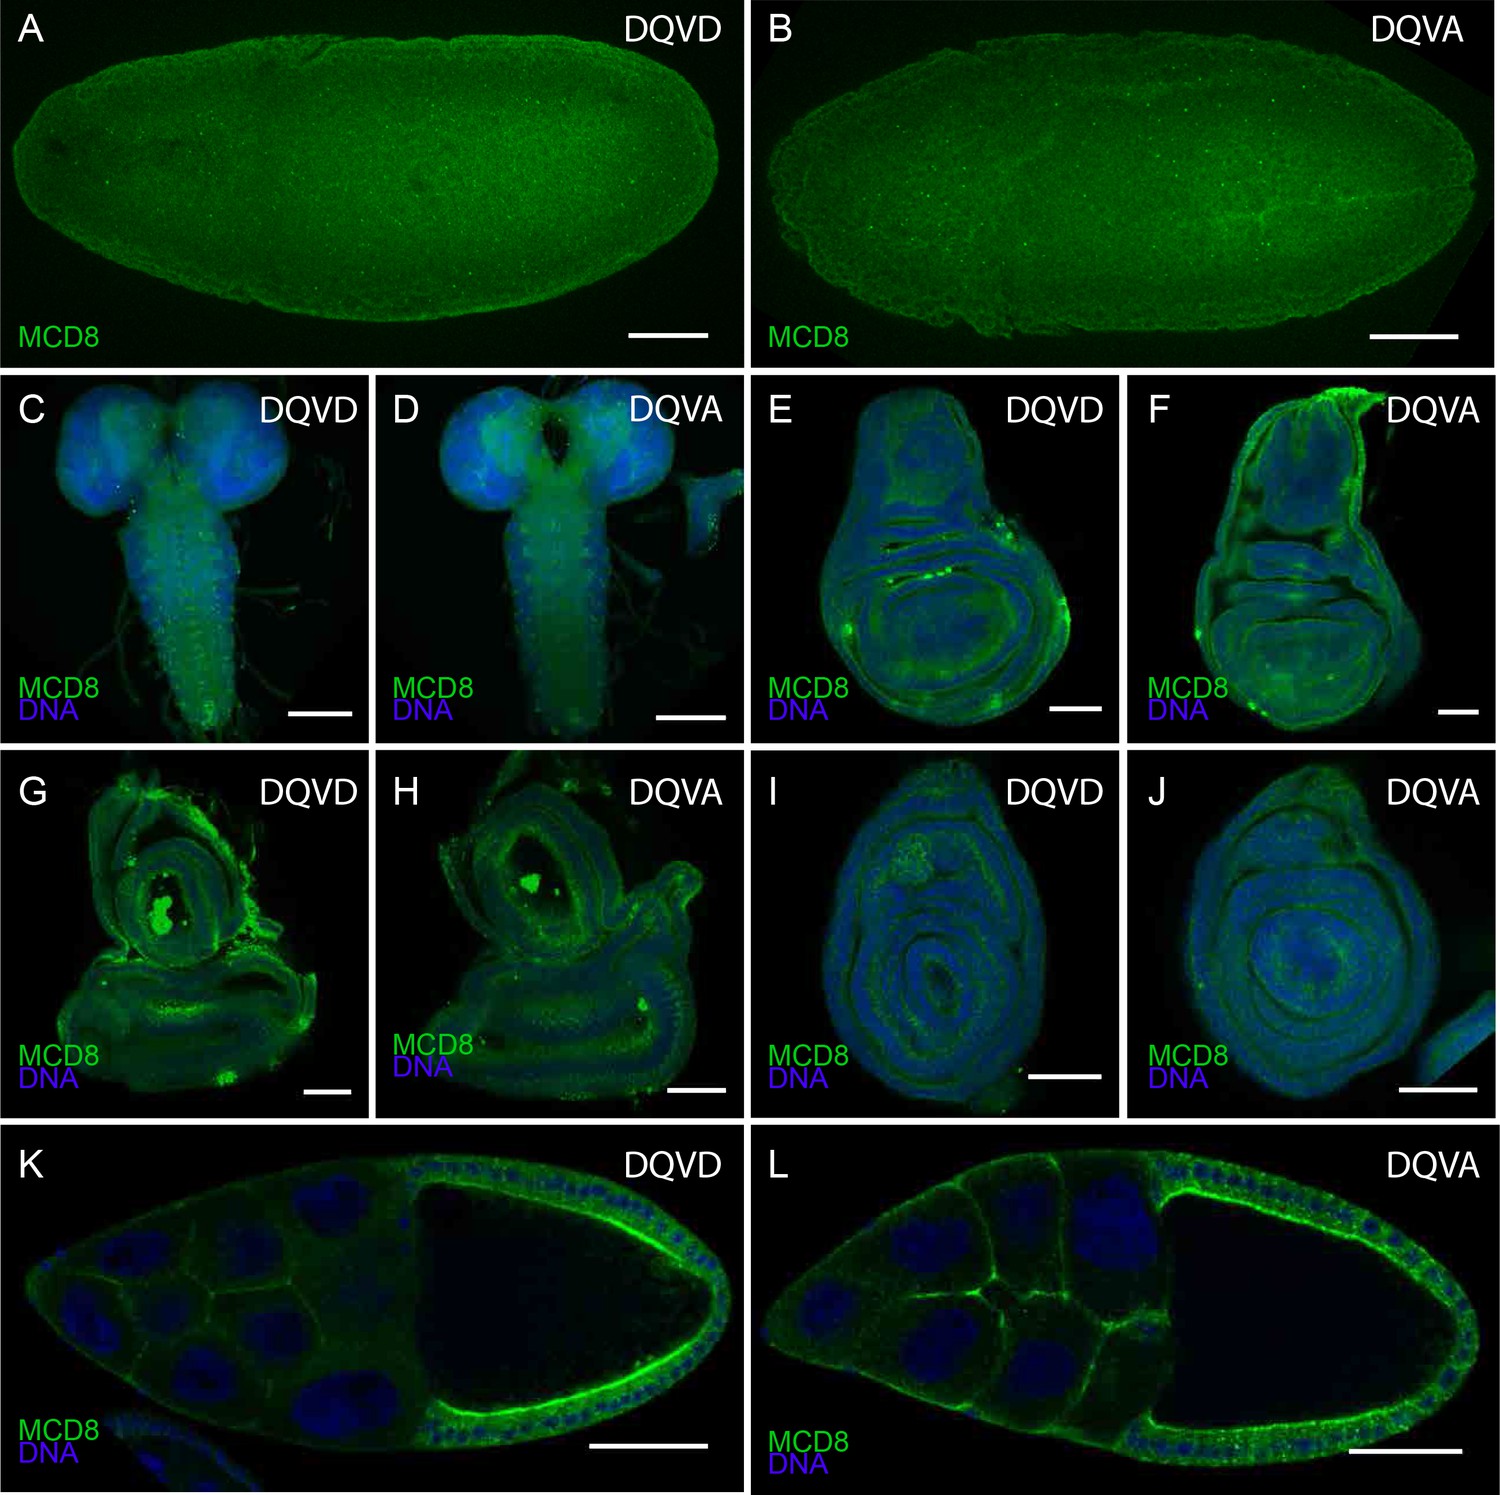
Expression of CasExpress DQVD and the DQVA control.
Anti mCD8 staining of the DQVD CasExpress sensor (A, C, E, G, I, K) or DQVA caspase-insensitive control (B, D, F, H, J, L) in stage 10 embryos (A, B), and 3rd instar larval central nervous system (C, D), wing disc (E, F), eye-antennal disc (G, H) and leg disc (I, J) Stage 10 egg chambers of the adult ovary (K, L). Scale bars in A–D and K, L are 100 μm, in G–J are 50 μm.
Figure 3 with 4 supplements

CasExpress activation in larval tissues.
(A–F) Confocal micrographs showing overlays of DAPI, RFP and GFP expression in the indicated tissues of wandering 3rd instar larvae. (A’–E’) GFP only. (A”–E”) RFP only. The brackets in D mark the eye and antenna parts of the disc, in E mark the position of optic lobe, central brain and ventral nerve cord, and in F mark the different regions of the gut. Scale bars in A and F are 200 μm, in B and C are 50 μm, in D and E are 100 μm. (G) A schematic summarizing of GFP and RFP expression in larvae. There is little GFP/RFP expression in trachea or muscles, which are not included in diagram.
Figure 3—figure supplement 1
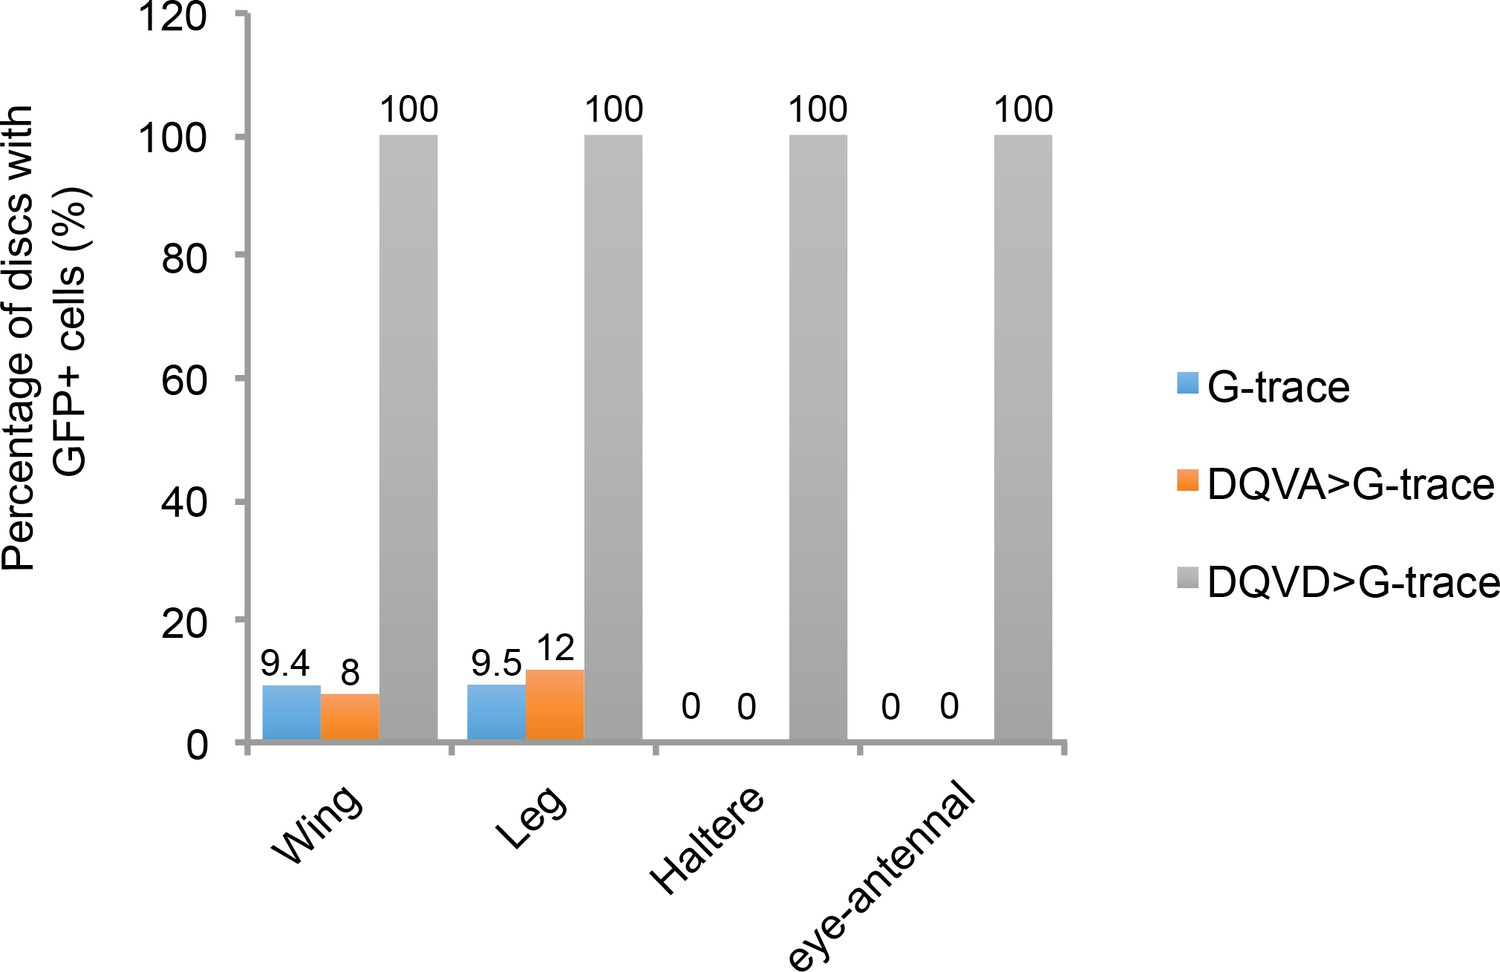
Comparison of GFP expression in the CasExpress DQVD sensor, the DQVA control or G-trace alone.
The percentage of wing, leg, haltere and eye-antennal discs containing GFP-expressing cells for the G-Trace alone (blue bars), G-Trace together with the DQVA caspase-insensitive control (orange bars), or G-Trace together with the DQVD caspase sensor (gray bars) are shown.
Figure 3—figure supplement 2
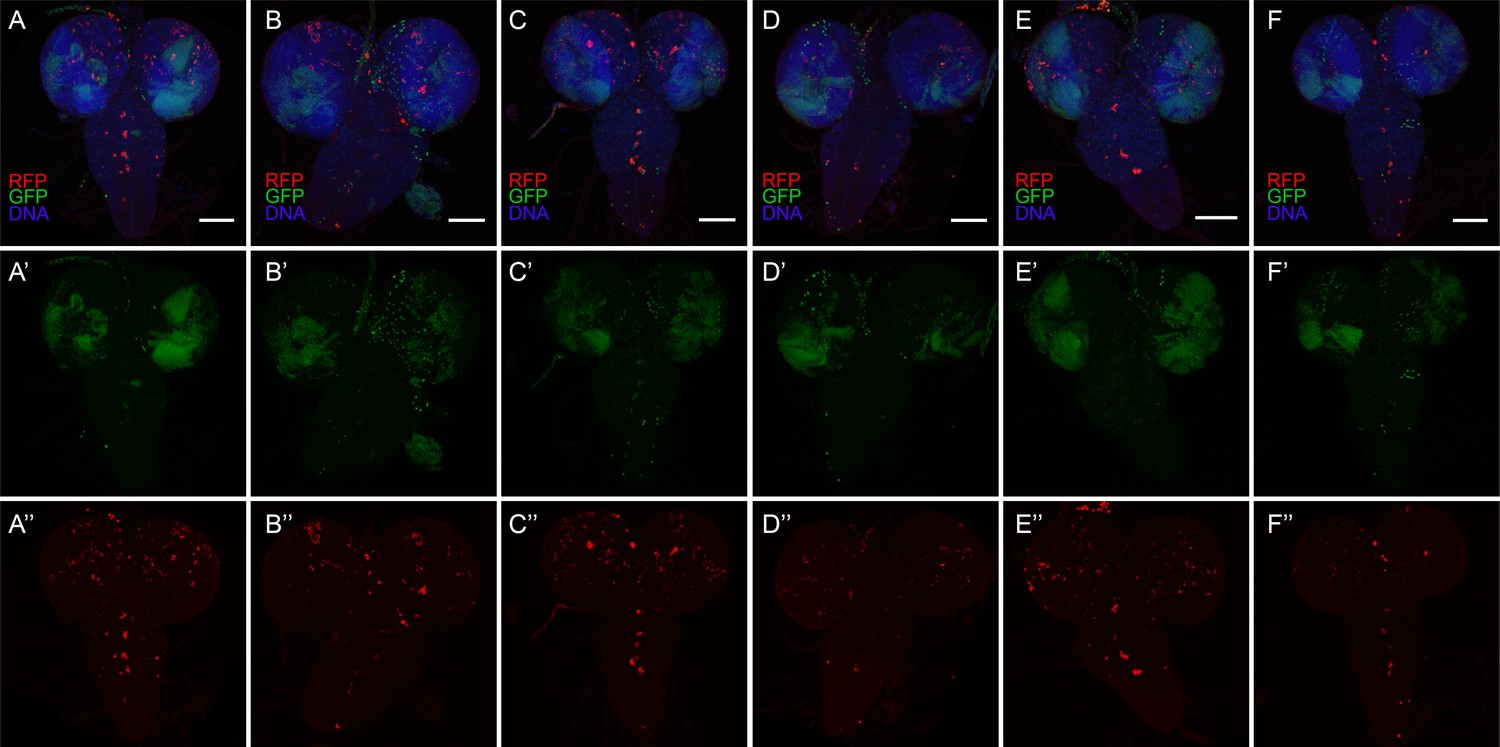
Diverse CasExpress activation patterns in larval CNS.
(A–F) Six different examples of RFP (red) and GFP (green) CNS expression patterns in late 3rd instar larvae. DAPI is shown in blue. (A’–F’) GFP only. (A”–F”) RFP only. All scale bars are 100 μm. Note that patterns differ from animal to animal and are not bilaterally symmetric.
Figure 3—figure supplement 3
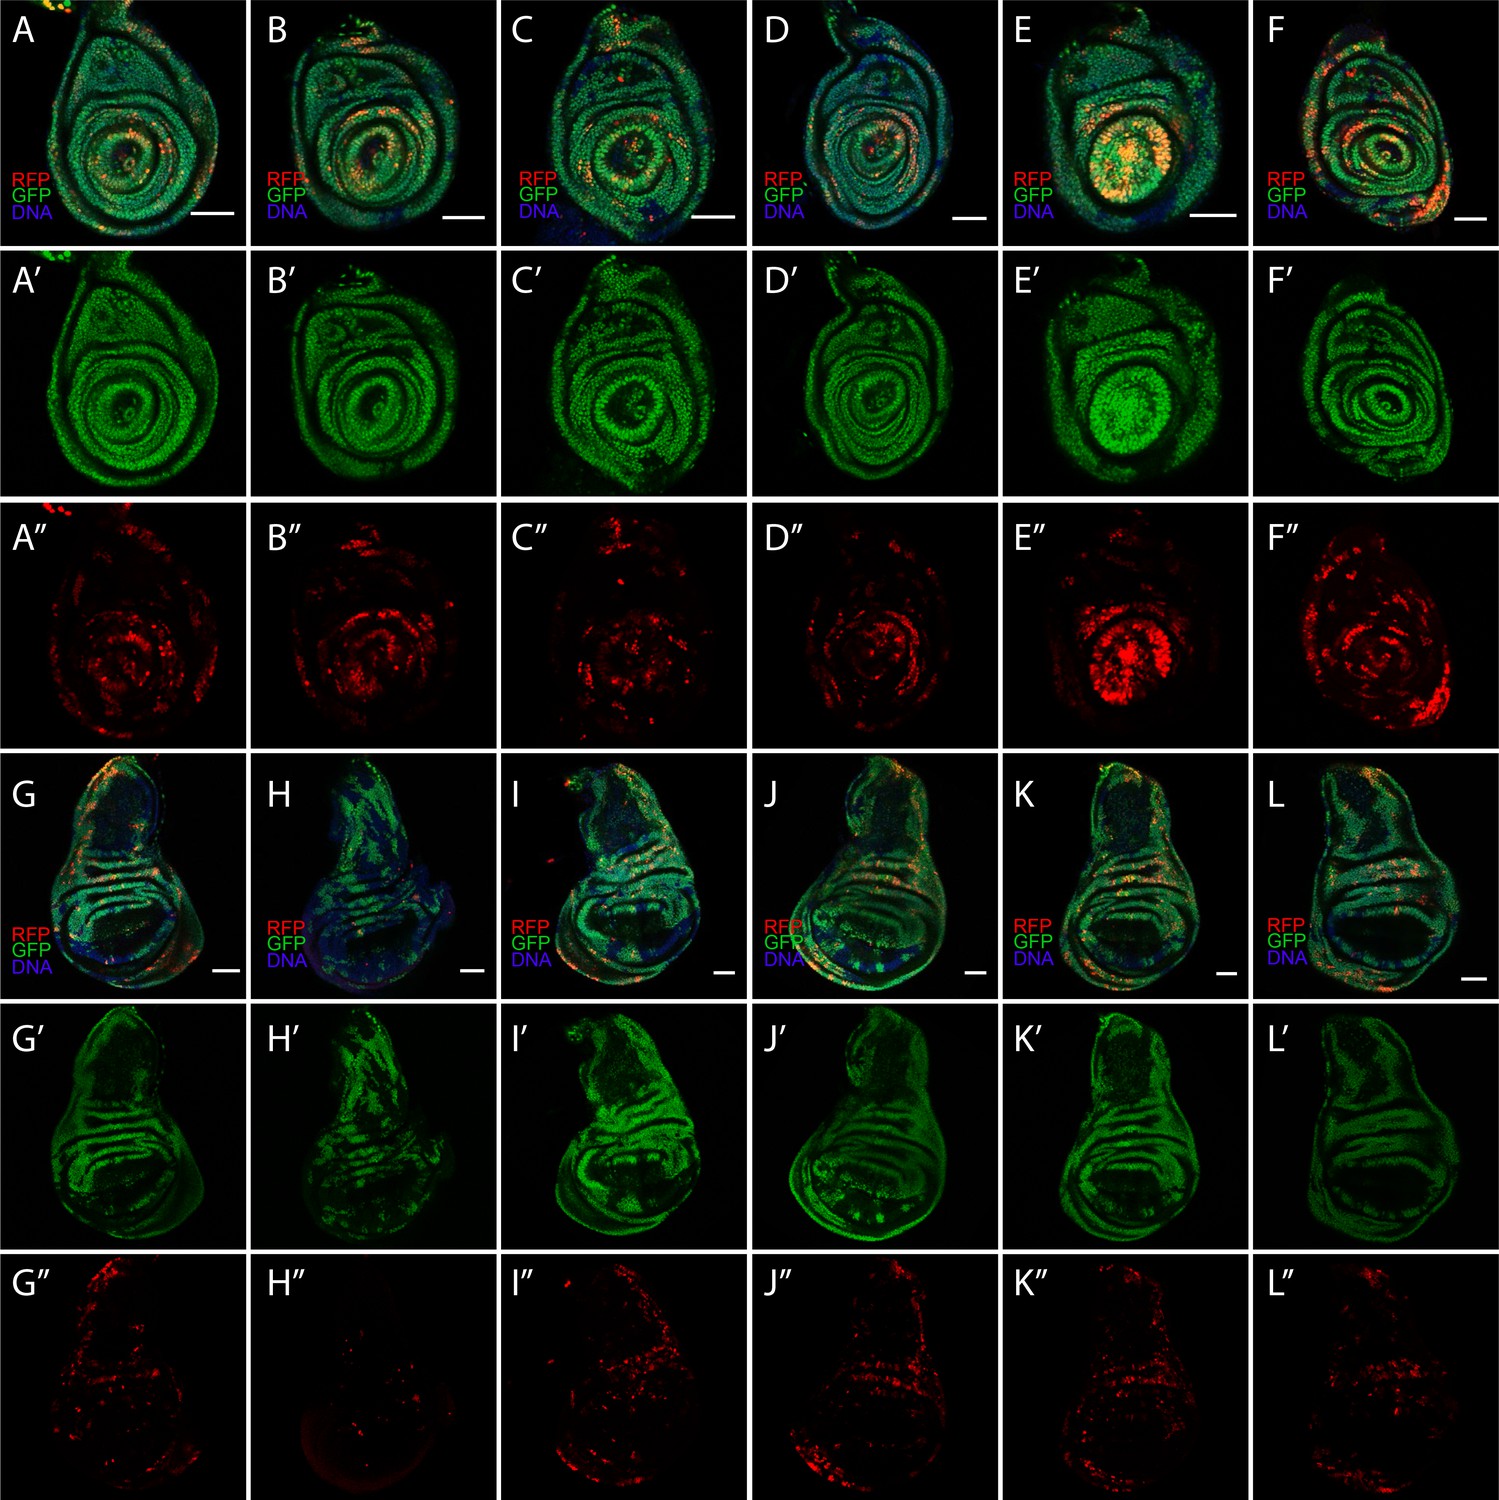
Diverse CasExpress patterns in leg and wing discs.
Six different examples of RFP and GFP expression patterns in leg (A–F) and wing (G–L) discs of late 3rd instar larvae. (A’–L’) GFP only. (A”–L”) RFP only. All scale bars are 50 μm.
Figure 3—figure supplement 4
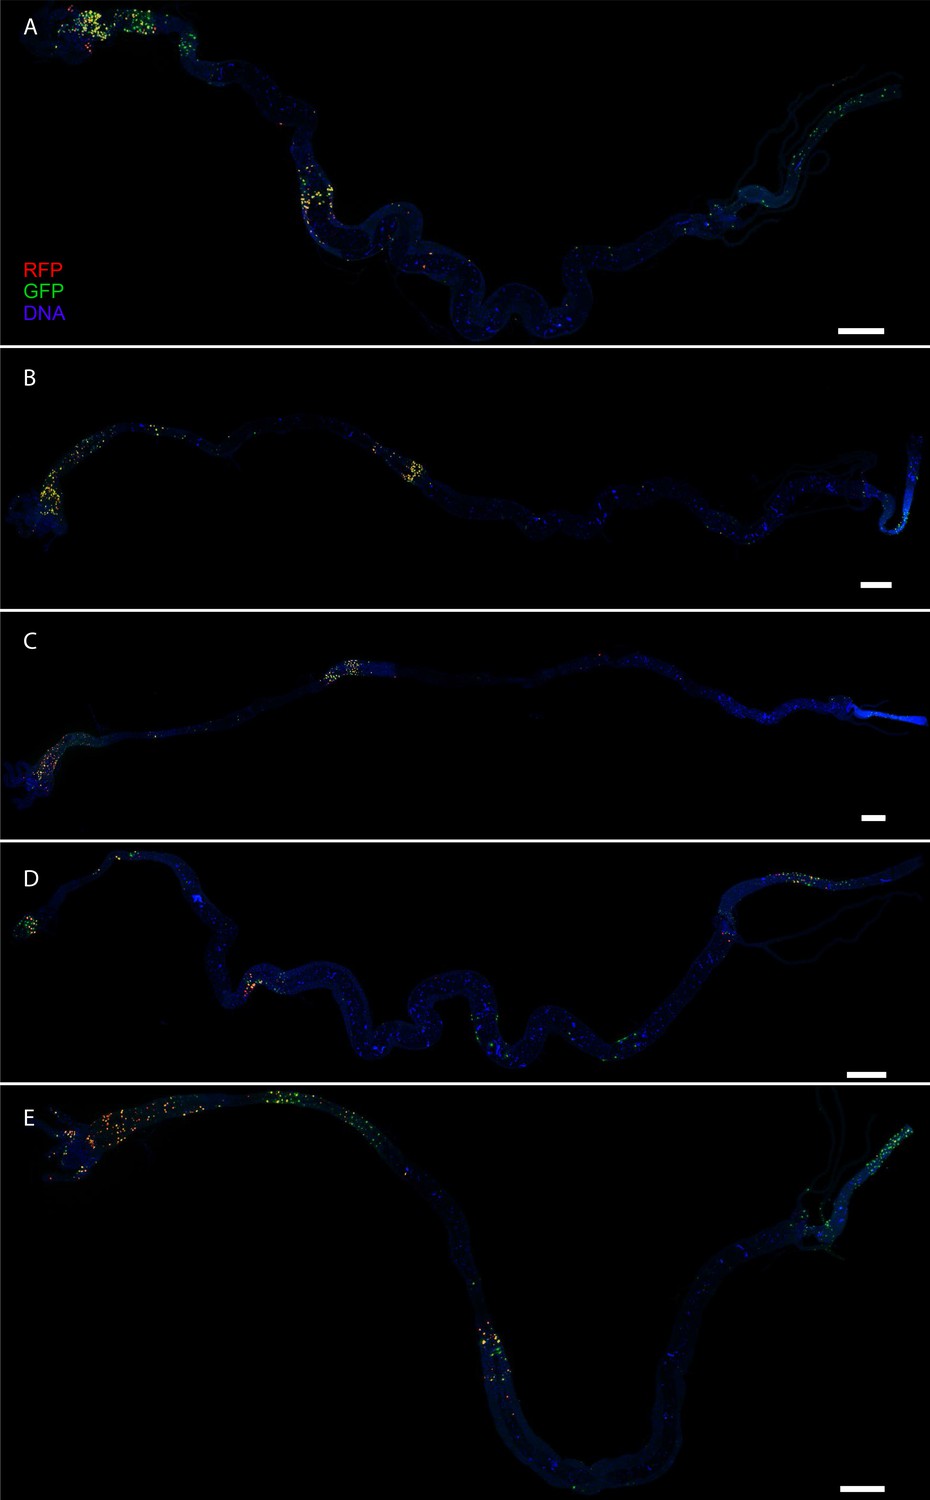
CasExpress patterns in larval intestines.
(A–E) Five different examples of RFP and GFP expression patterns in larval intestines. DAPI is shown in blue. All scale bars are 400 μm.
Figure 4 with 3 supplements
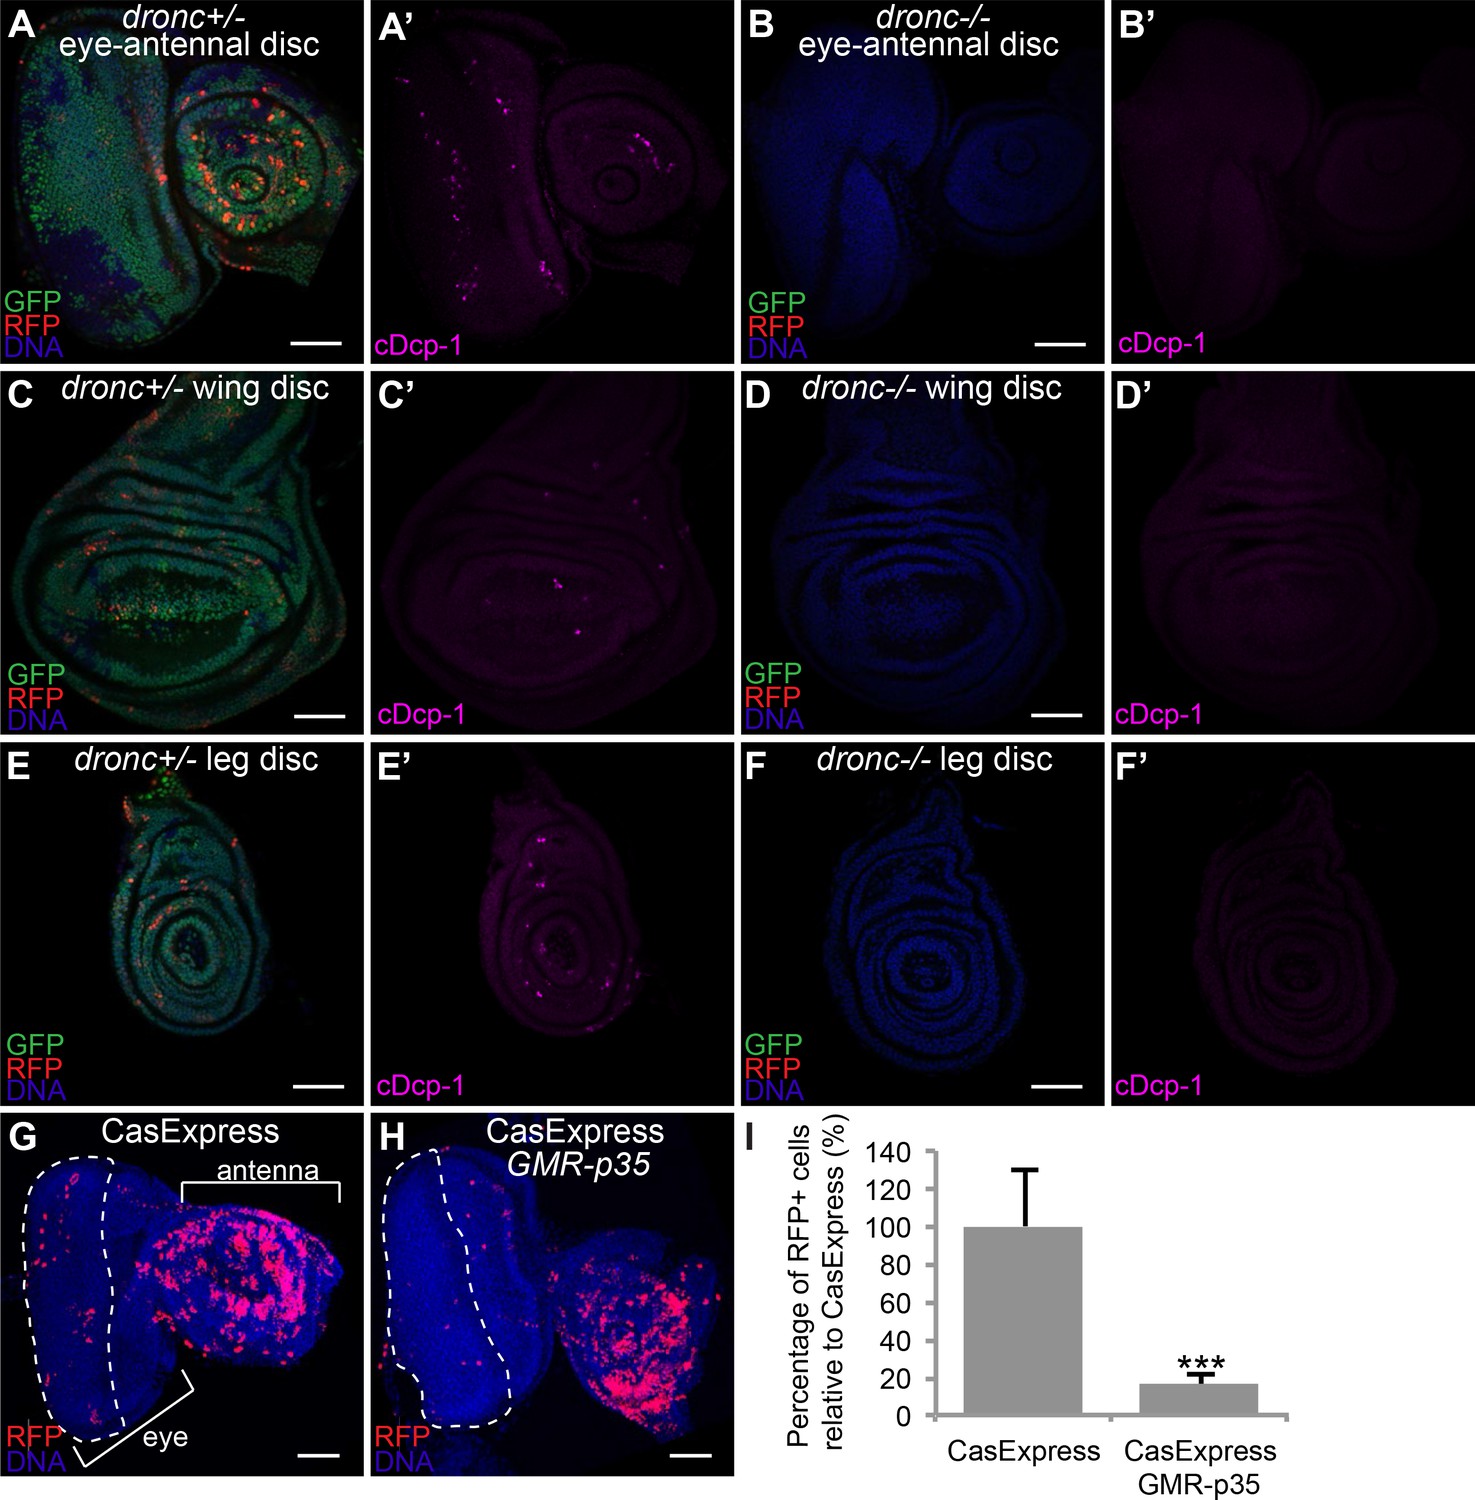
Caspase-dependence of CasExpress.
(A–F) Confocal micrographs showing overlays of DAPI, RFP and GFP expression in third-instar larval eye-antennal disc (A–B), wing disc (C–D), and leg disc (E–F). CasExpress and G-trace were crossed into heterozygous (A, C, E) or dronc homozygous (B, D, F) dronc mutants. (A’–E’) Cleaved Dcp-1 staining of corresponding discs. Scale bars are 50 μm. (G–H) RFP expression in eye-antennal discs of late third-instar larvae with CasExpress and G-trace with (H) or without (G) GMR-p35. The dashed line encircles the region where p35 is expressed. (I) Quantification of of RFP: DAPI area. Error bars show standard error of the mean, and *** indicates p<0.001.
Figure 4—figure supplement 1

Anti-cleaved caspase-3 (red) and DAPI (blue) staining of stage 14 embryo (A) and high magnification of a salivary gland (B).
(A'–B') are cleaved caspase-3 only. Scale bar in A is 20 μm, in B is 100 μm.
Figure 4—figure supplement 2
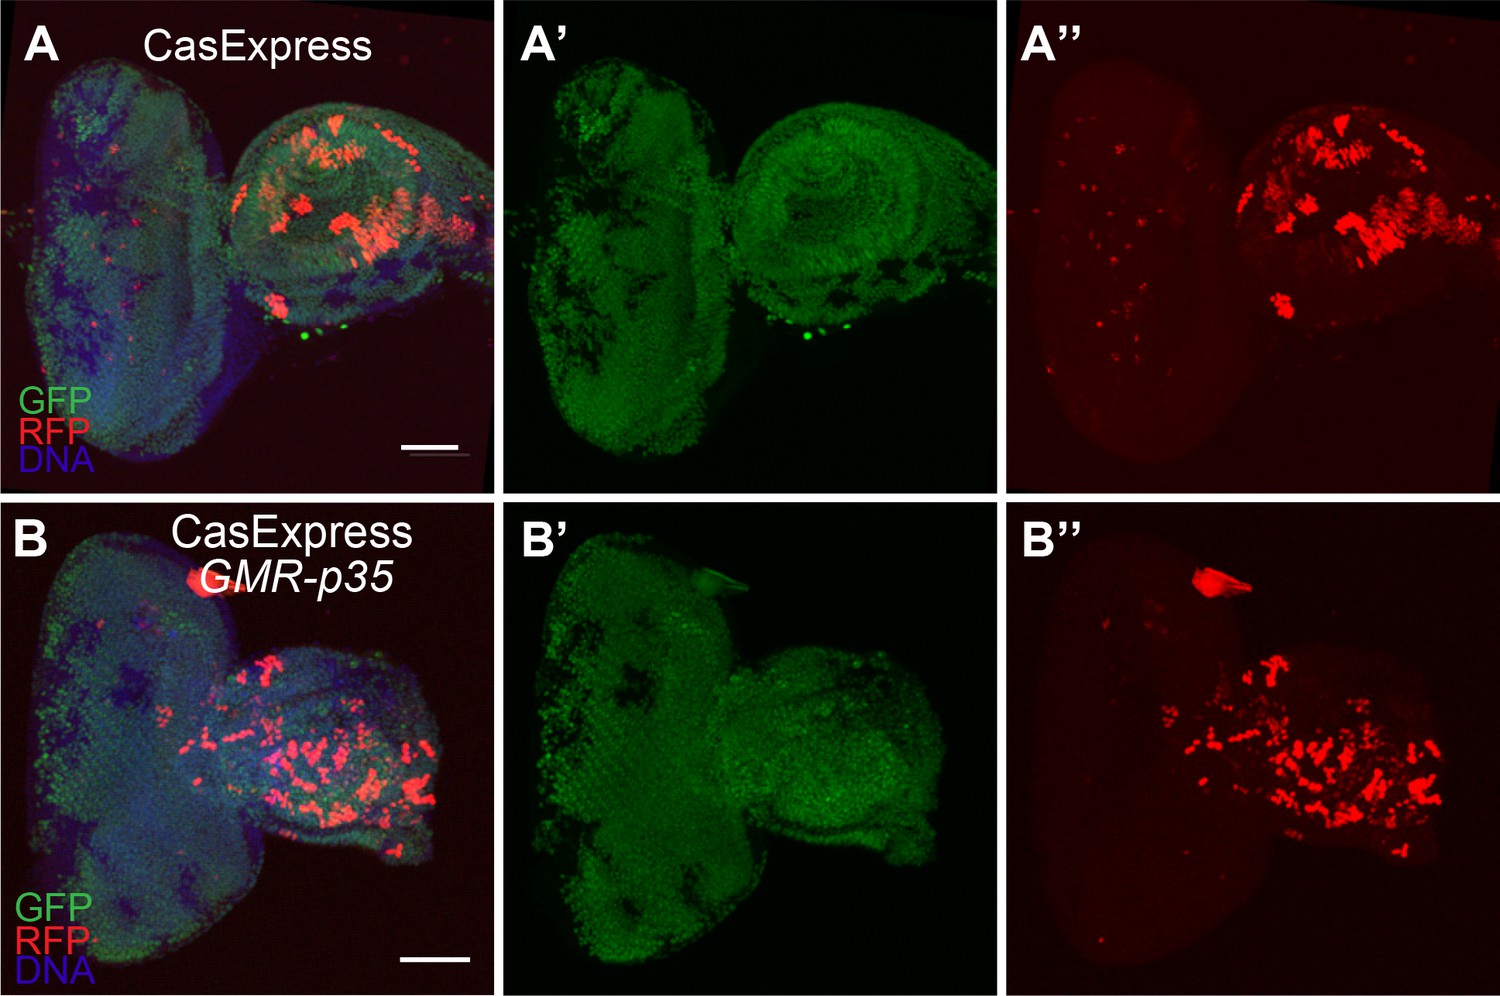
GFP and RFP expression of CasExpress in a wild type eye-antennal disc (A–A”), or one carrying the GMR-p35 transgene (B–B”).
Scale bars are 100 μm.
Figure 4—figure supplement 3
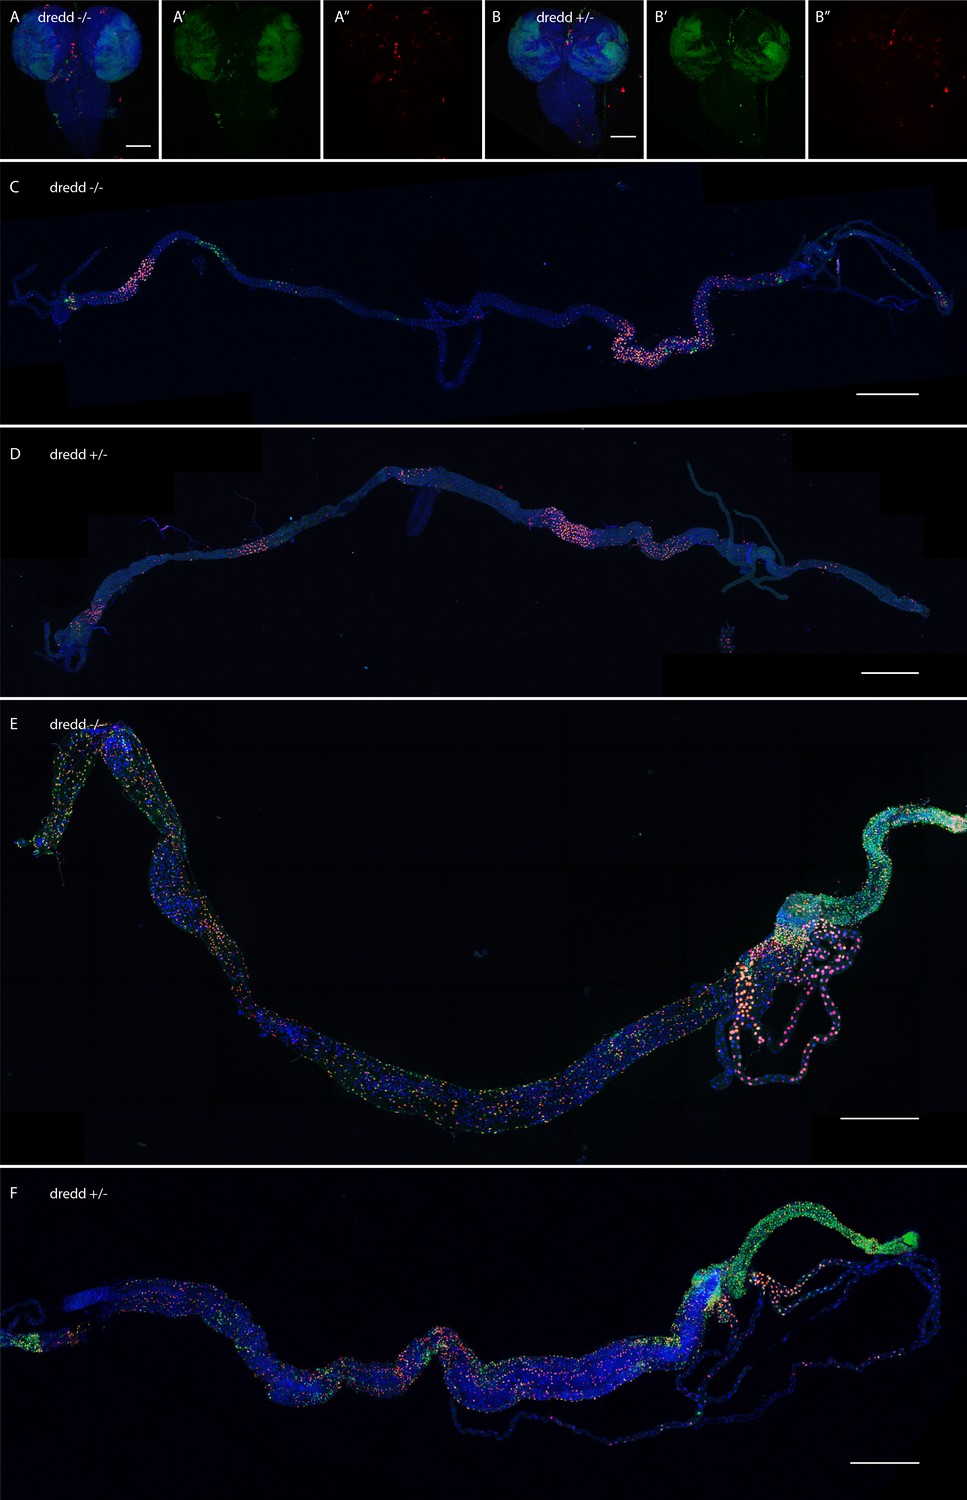
Loss of dredd does not change CasExpress patterns.
(A–F) Confocal micrographs showing overlays of DAPI, RFP and GFP expression in third-instar larval CNS (A–B), larval intestines (C–D), and adult intestines (E–F). CasExpress and G-trace were crossed into heterozygous (A, C, E) or homozygous (B, D, F) dredd mutants. (A'–B') GFP only, (A''–B'') RFP only. Scale bars in A and B are 100μm, in C and D are 800μm, in E and F are 400μm
Figure 5 with 1 supplement
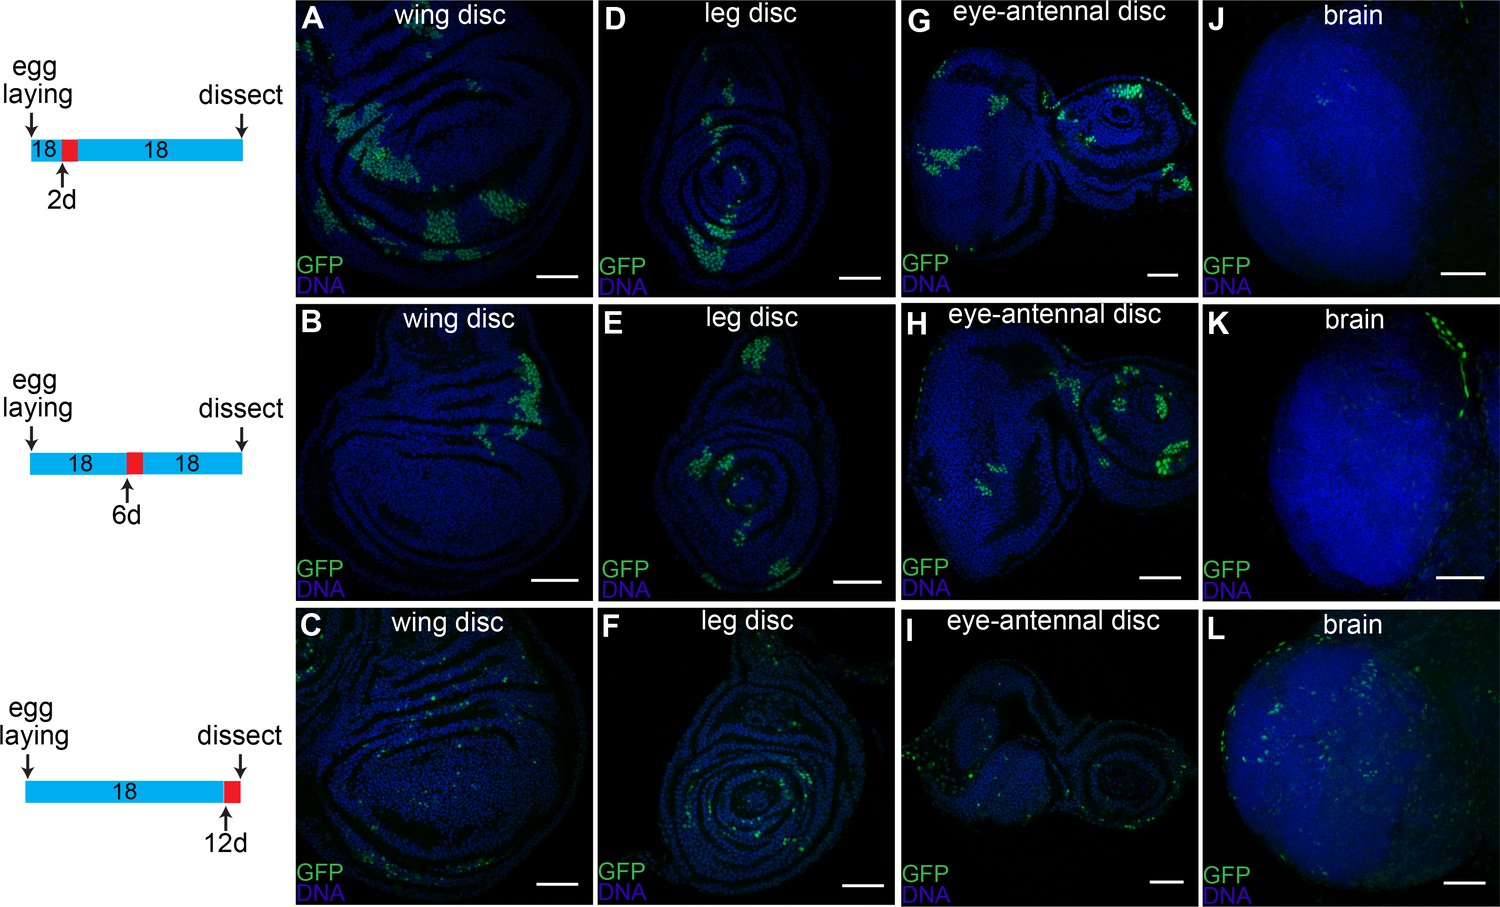
Timing of caspase activation in larval tissues.
Larvae with CasExpress, G-trace and Gal80ts were grown at 18°C (blue in the timeline bars on the left) for 2d (A, D, G, J), 6d (B, E, H, K), or 12d (C, F, I, L), shifted to 29°C (red in the timeline bars) for 1d, then kept at 18°C until late third instar. Induction of GFP expression occurs in wing discs (A–C), leg discs (D–F) and eye-antennal discs (G–I) throughout the larval stage; whereas few cells in brain (J–L) survive caspase activation before third instar. Scale bars are 50 μm.
Figure 5—figure supplement 1
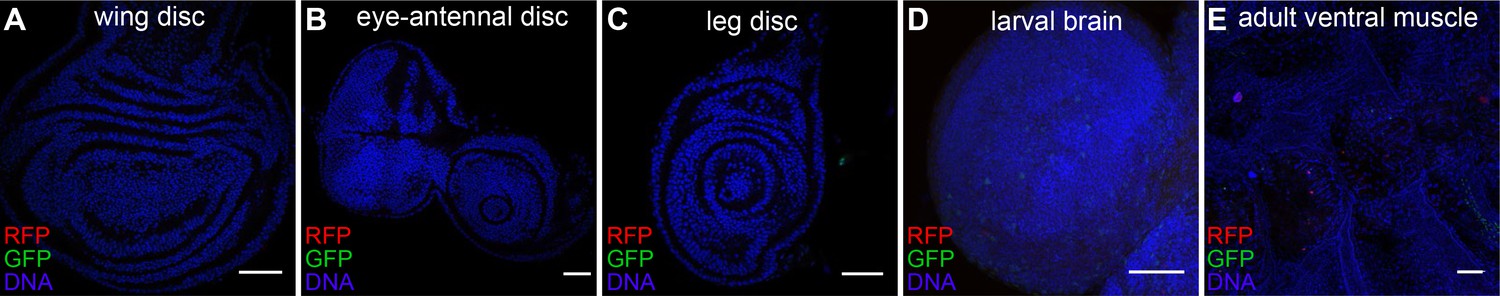
GFP, RFP and DAPI fluorescence in imaginal discs from flies carrying CasExpress, Gal80ts, and G-TRACE raised at 18°C.
GFP and RFP are completely repressed.
Figure 6 with 1 supplement
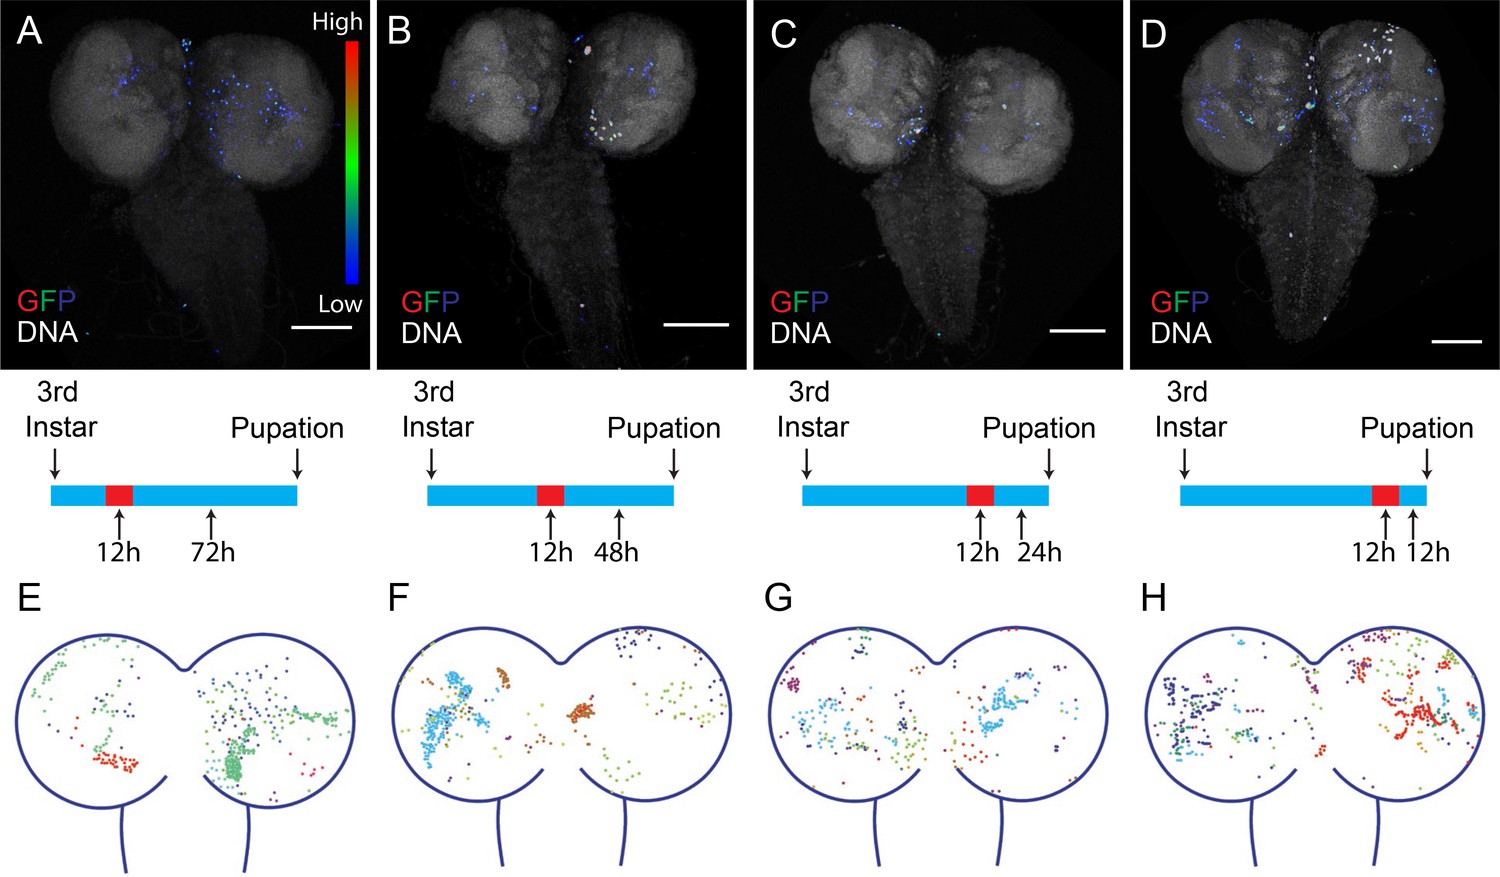
Timing of CasExpress activation in larval CNS.
Larvae with CasExpress G-Trace and Gal80ts were grown in 18°C (blue bars in the middle) until 3rd instar and shifted to 29°C for 12 hr. Then larvae were kept at 18°C for 72 hr (A, E), 48 hr (B, F), 24 hr (C, G) or 12 hr (D, H) until they reached late 3rd instar. (A–D) Four examples of GFP expression patterns in the larval CNS presented in Rainbow RGB, which shows different levels of GFP intensity in different colors. (E–H) Z-projections of different samples were slightly transformed and fit into the diagram of brain. The positions of GFP positive cells for each sample are indicated with different colors. Scale bars are 100 μm.
Figure 6—figure supplement 1
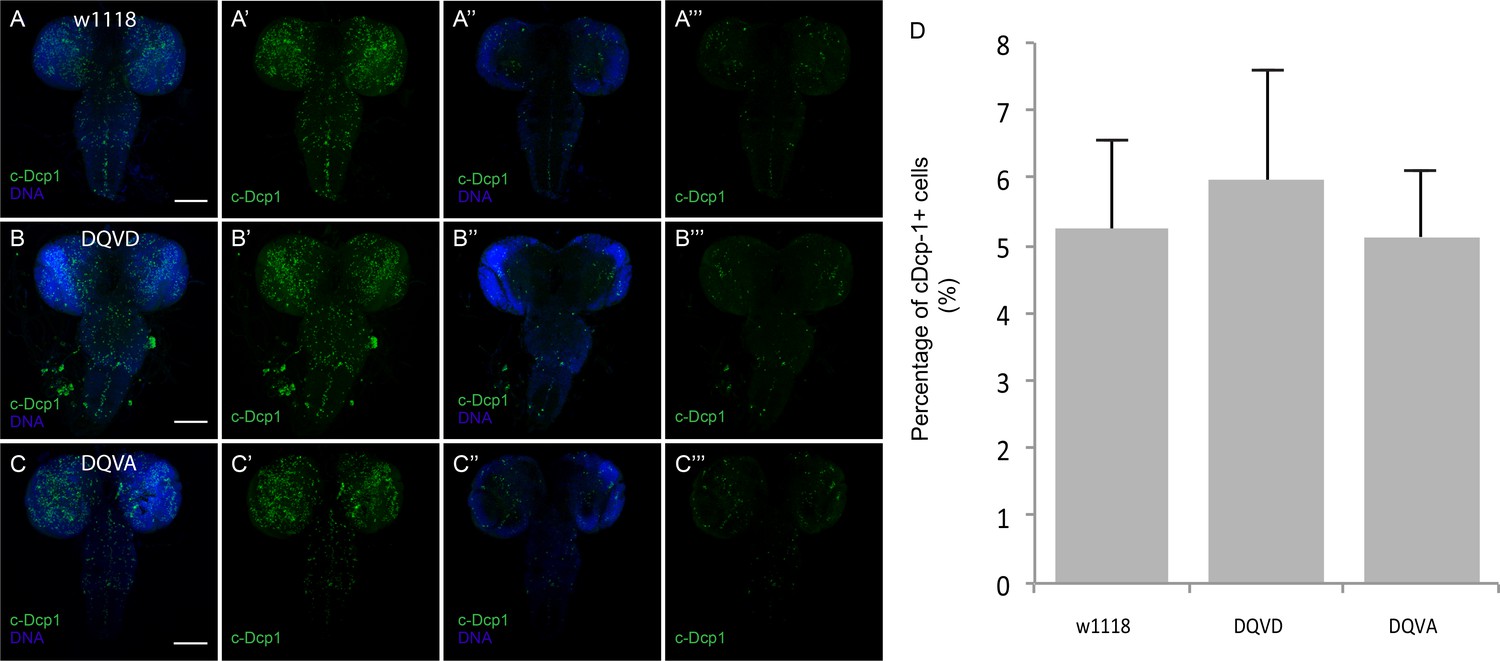
Caspase activity during larval CNS development.
(A,B,C) Anti-cleaved Dcp1 antibody staining (green) detects caspase activity during larval brain development in w1118 (A) CasExpress DQVD (B) and DQVA control (C). (A–C) (A'–C') are Z-projection of images generated by maximum intensity algorithm, (A''–C'') (A'''–C''') are single slices of each image. (A'–C') (A'''–C''') are cleaved Dcp1 only. (D) Quantification of the percentage of cDcp-1-expressing cells. Scale bars are 100μm.
Figure 7

Developmental timing of caspase activation in adult tissues.
(A) A schematic of the timing of the temperature shifts (blue: 18°C, red: 29°C) during the growth of flies with CasExpress, G-trace, and Gal80ts. (B–M) GFP and RFP expression in antenna (B–D), brain (E–G), midgut (H–I), visceral muscle surrounding midgut (J–K), and hindgut (L–M) in flies with CasExpress, G-trace, and Gal80ts that grown at the condition indicated in the panels. Panels marked with prime showed separated channels of the left. Arrows in H–I’’ point to some examples of GFP+ progenitor cells. Dotted lines in L–M’’ mark the boundary between midgut and hindgut. Arrows in L and M point to the hindgut proliferation zone. Scale bars in B–D, and H–M are 25 μm. Scale bars in E–G are 100 μm.
Figure 8
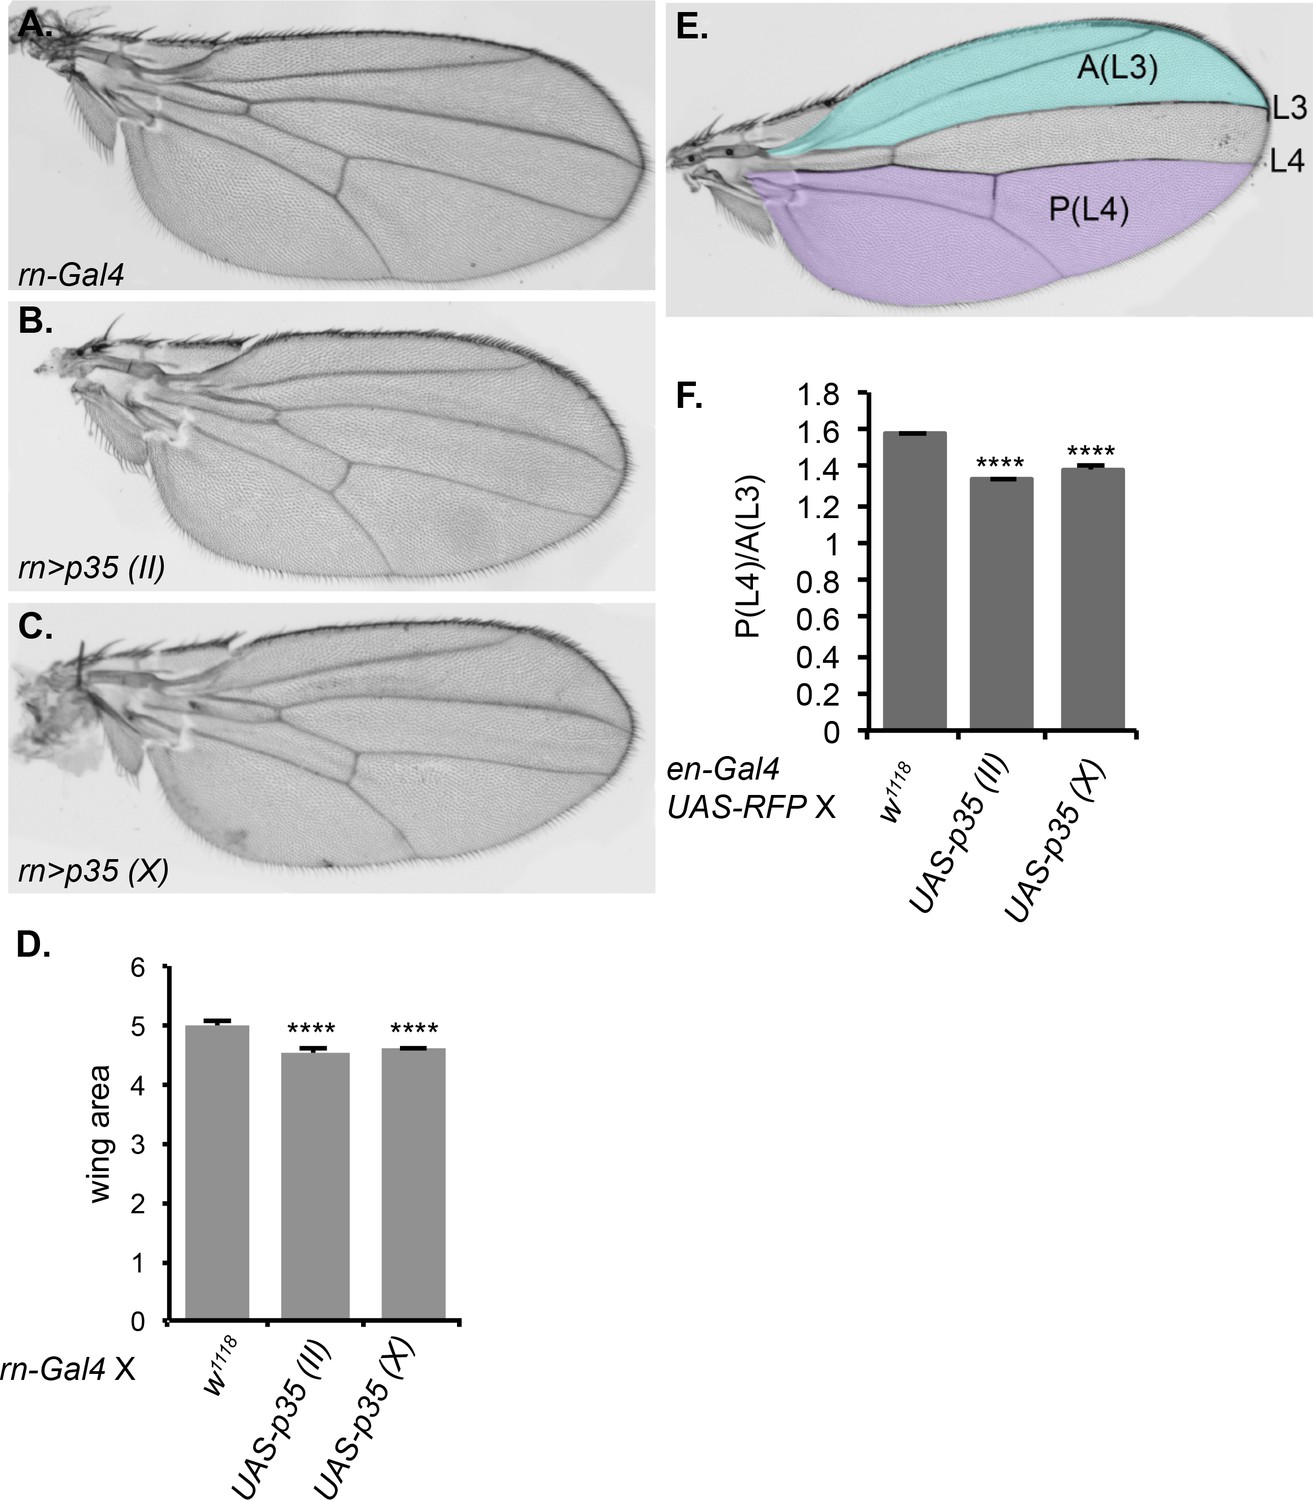
Inhibition of caspase activity reduces wing size.
(A–C) Representative wings from progeny of rn-Gal4 crossed to (A) control w1118, (B) UAS-p35 on chromosome II, or (C) UAS-p35 on the X chromosome. (D) Quantification of wing area in arbitrary units. (E) Schematic showing the regions used for area measurement in wings with or without p35 expressed under en-Gal4. In the anterior compartment, we measured the area anterior to L3 vein, which is highlighted in blue and marked as A(L3). In posterior compartment, we measured the area posterior to L4, which is highlighted in purple and marked as P(L4). (F) Quantification of the ratio between P(L4) and A(L3) in wings from progeny of en-Gal4 crossed to w1118, UAS-p35 on the second chromosome, and UAS-p35 on the X chromosome. Error bars show standard error of the mean, and **** indicates p<0.0001.
Download links
A two-part list of links to download the article, or parts of the article, in various formats.
Downloads (link to download the article as PDF)
Open citations (links to open the citations from this article in various online reference manager services)
Cite this article (links to download the citations from this article in formats compatible with various reference manager tools)
CasExpress reveals widespread and diverse patterns of cell survival of caspase-3 activation during development in vivo
eLife 5:e10936.
https://doi.org/10.7554/eLife.10936


