Sex difference in pathology of the ageing gut mediates the greater response of female lifespan to dietary restriction
- University College London, United Kingdom
- Max Planck Institute for Biology of Ageing, Germany
Figures
Figure 1 with 1 supplement

Intestinal stem cell activity produces severe epithelial pathology in females.
(A) Outline of the adult gut indicating specific regions and areas subjected to image analysis (orange dashed boxes). (B-D’) Surface (B) and corresponding zoom (C-D’) of the proventriculus (PV) from 7-day (B-D) and 42-day (C’,D’) –old females. Zoom panels show the green (epithelium; Resille-GFP) and blue (nuclei; DAPI) channels separately. Yellow arrowheads denote wound rosettes (C’) and yellow asterisks denote multinucleated cells (C’,D’). (E-G’) Central section of the PV (E) and corresponding zoom panels (F-G’) in 7-day (E-G) and 42-day (F’,G’) –old females. Yellow arrowheads denote extra, tumor-like cells in the epithelium (I’) and yellow asterisks denote their corresponding nuclei (J’). (H-J’) Surface of the gut at R2 (H) and zoom panels (I-J’), at 7days (H-J) and 42 days (I’,J’). Yellow arrowheads denote small, tumor-like cell clusters. (K-M’) Luminal section at R2 (K) and zoom panels (L-M’). Yellow arrowhead denotes basal ISC (L,M). (N-R’) pathology in very old (70 day-old) females: PV surface (N) and corresponding zoom (O); R2 surface (P) and corresponding zoom (O’). (Q-R’) R4 section and corresponding zoom. Zoom panels (R,R’) have had their colors inverted to better visualize tumor nuclei.
Figure 1—figure supplement 1
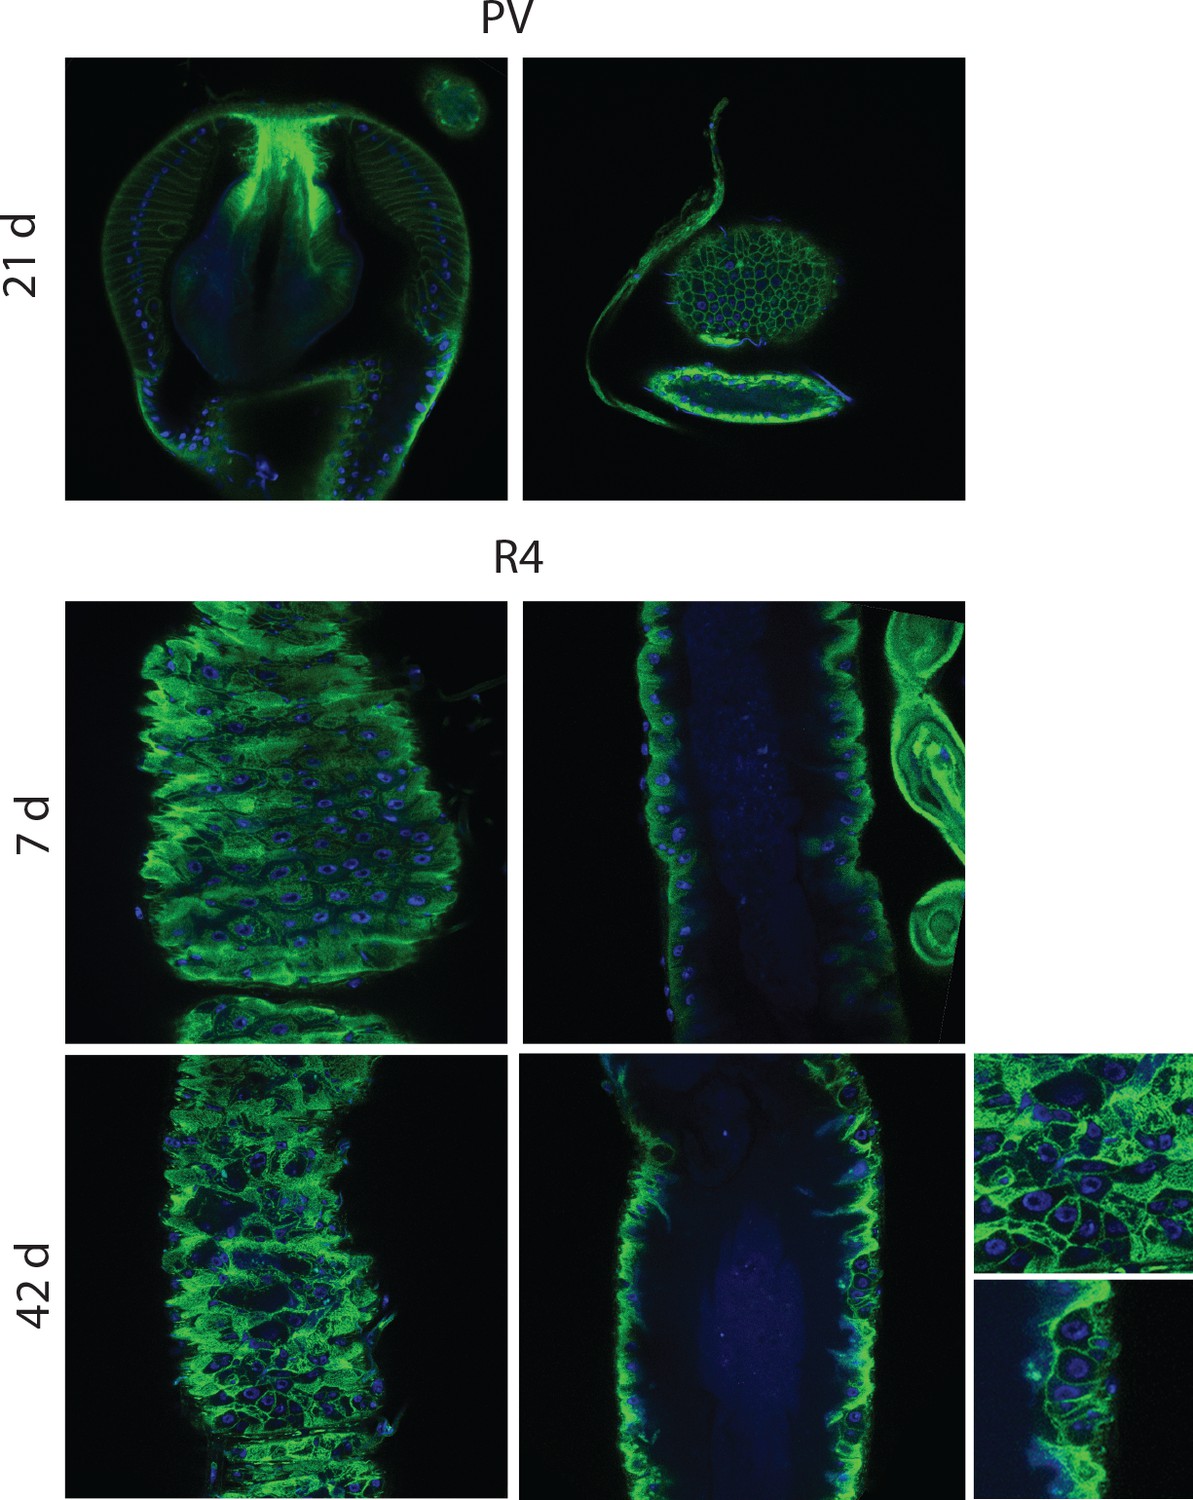
Epithelial pathology in females.
PV at 21 days, section and surface, an example of intermediate pathology (cat III). R4 at 7 days and 42 days for comparison. R4 pathologies here include epithelial holes and tumors. PV, proventriculus.
Figure 2 with 2 supplements
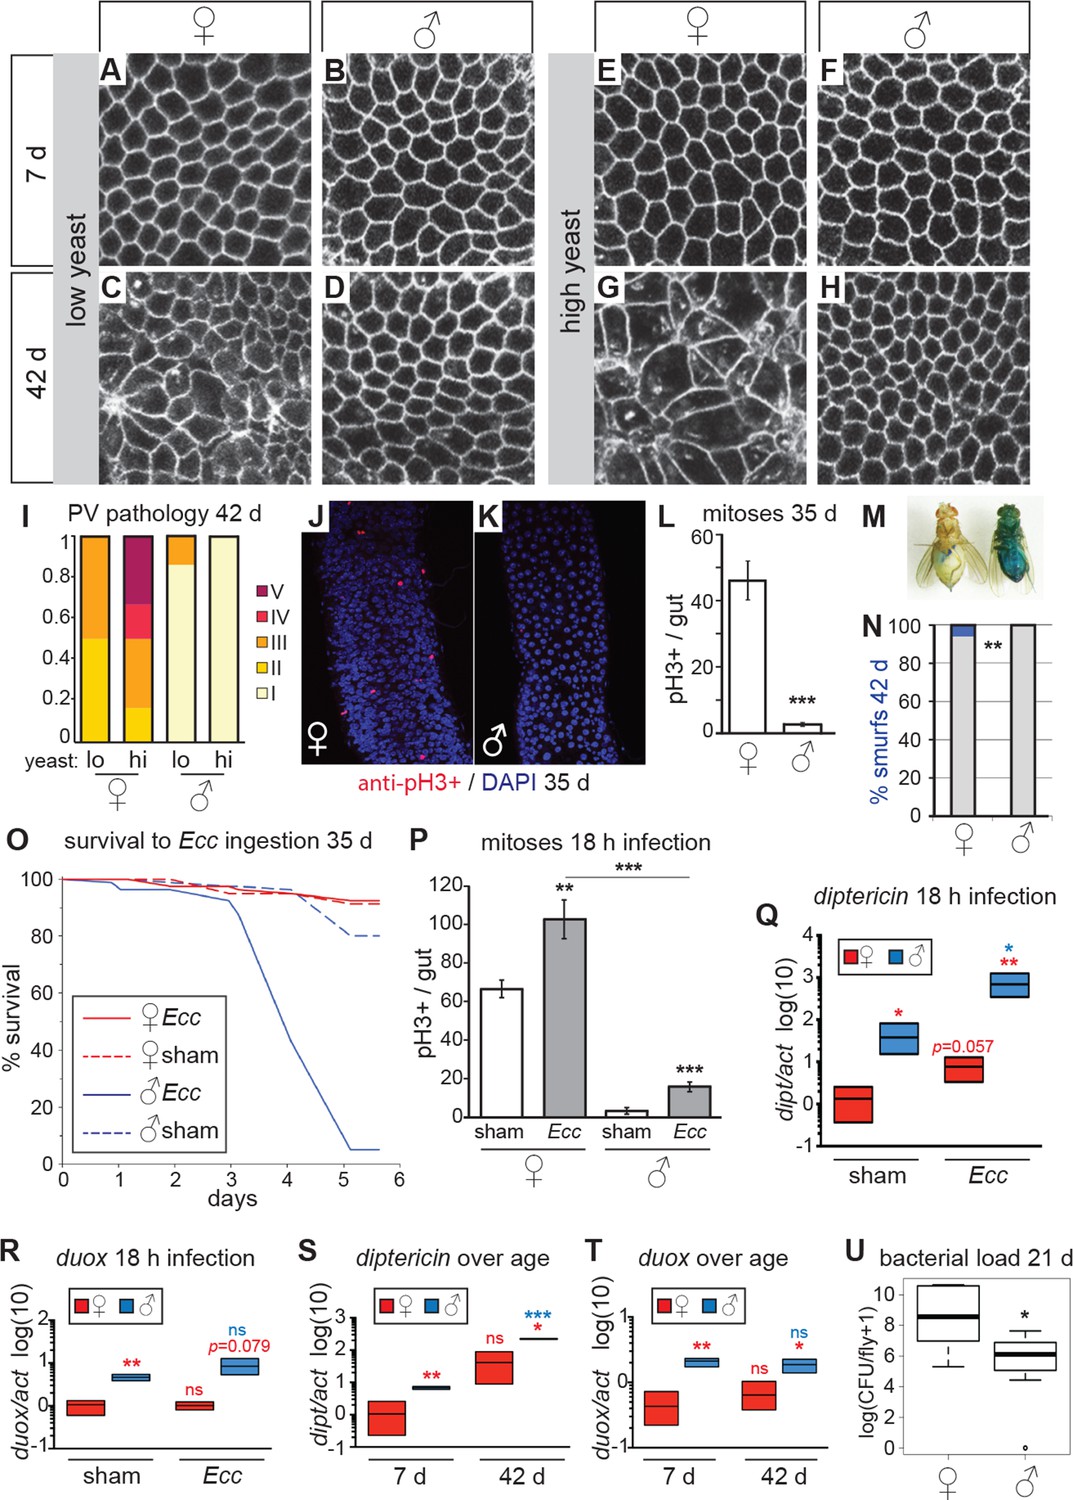
Females have more severe age-related intestinal pathologies than males.
(A-D) Young (7 day-old) male and female flies had comparable epithelial organization in the PV (A,B), but at old age (42 days) only females showed epithelial pathology (C,D). For R2 region, see Figure 2—figure supplement 1. (E-H) Females raised on a high-yeast diet developed a more severe pathology than males by 42 days (G,H). (I) PV pathologies were binned into scaled categories, where I = WT undisrupted honeycomb, II = loss of regularity in epithelial cell size and pattern; few (<5) rounded unpolarized cells on apical side. III = sporadic wound healing rosettes and/or 5–10 apical cells; IV = widespread rosettes and/or >10 apical cells; V = severe pathology including holes, scars and tumors. Low yeast females tended to have less pathology than high yeast females (n=12 guts per condition, ordinal logistic regression, OLR; p=0.07) (J-L) Female flies had more actively dividing ISCs than males, visualized by anti-pH3+ immunostaining. Images from R5 in 35-day-old flies are presented (J,K); quantification of pH3+ cells per gut demonstrated that females had more mitoses than males at 35 days (n=20 guts per sex; student’s t test, p < 0.001) (L). (M-N) Barrier function was compromised in old females but not males. ‘Smurf’ flies with leaky intestines (M) were present in female, but not male cohorts of wD;Resille flies at 42 days (n≥150 flies per condition, representative of three repeated experiments, Fisher’s exact, p = 0.008) (N). (O-P) Males succumbed to oral infection with the gram-negative bacterium Erwinia carotovora (Ecc) at 35 days, whereas females were resistant (O). PH3+ cell number per gut was increased in females (n≥10 per condition; student’s t test, p = 0.0042) and males (p = 0.0003) upon Ecc oral infection. More mitoses were induced in female compared to male guts (p = 3.6E-05) (P). (Q-T) AMPs and ROS were higher in challenged and unchallenged males compared to females. Diptericin expression was higher in both sham- and Ecc-infected males, compared to females at 35 days (n≥3 samples per condition, 10 individuals pooled per sample, 2 technical repeats; t test with Welch’s correction, p = 0.0135 for sham, p = 0.0012 for infected) and was upregulated significantly upon infection in males (p = 0.0132), and tended to be higher after infection in females (p = 0.0571) (Q). Duox expression was not upregulated after infection in 35-day-old males or females (n≥3 samples per condition, 10 individuals pooled per sample, 2 technical repeats; t test with Welch’s correction, p = 0.8639 for females, p = 0.2303 for males), but was higher in males than females overall (p = 0.0060 for sham, p= 0.0793 for infected) (R). Systemic diptericin was higher in males than females and increased with age in males (n≥3 samples per condition, 10 individuals pooled per sample, 2 technical repeats; t test with Welch’s correction, p = 0.0062 for 7-day-old females vs males; p = 0.0158 for 42-day-old females vs males; p = 0.2435 for 7-day-old vs 42-day-old females; p = 0.0003 for 7-day-old vs 42-day-old males) (S). Duox expression did not increase with aging in either sex, but expression was higher in males than females at both 7 and 42 days (n≥3 samples per condition, 10 individuals pooled per sample, 2 technical repeats; t test with Welch’s correction, p = 0.0029 for 7-day-old females vs males; p = 0.0206 for 42-day-old females vs males; p = 0.4531 for 7-day-old vs 42-day-old females; p = 0.4857 for 7-day-old vs 42-day-old males (T). Males had a lower aerobic bacterial load than females at 21 days, (n≥8 samples per condition, 5 individuals pooled per sample; Wilcoxon test, p = 0.05) (U). A similar result was obtained for anaerobic load.
Figure 2—figure supplement 1

Females have more severe age-related intestinal pathologies than males.
Examples of the R2 region in females and males on low- and high- yeast diets at 7 days and 35 days for comparison. Both surface and luminal section images are presented. In females at 35 days, groups of stem cells can be seen on the surface which are associated with multiple layered nuclei in luminal sections. Females on high-yeast food often presented a more severe pathology than those on low-yeast diets.
Figure 2—figure supplement 2
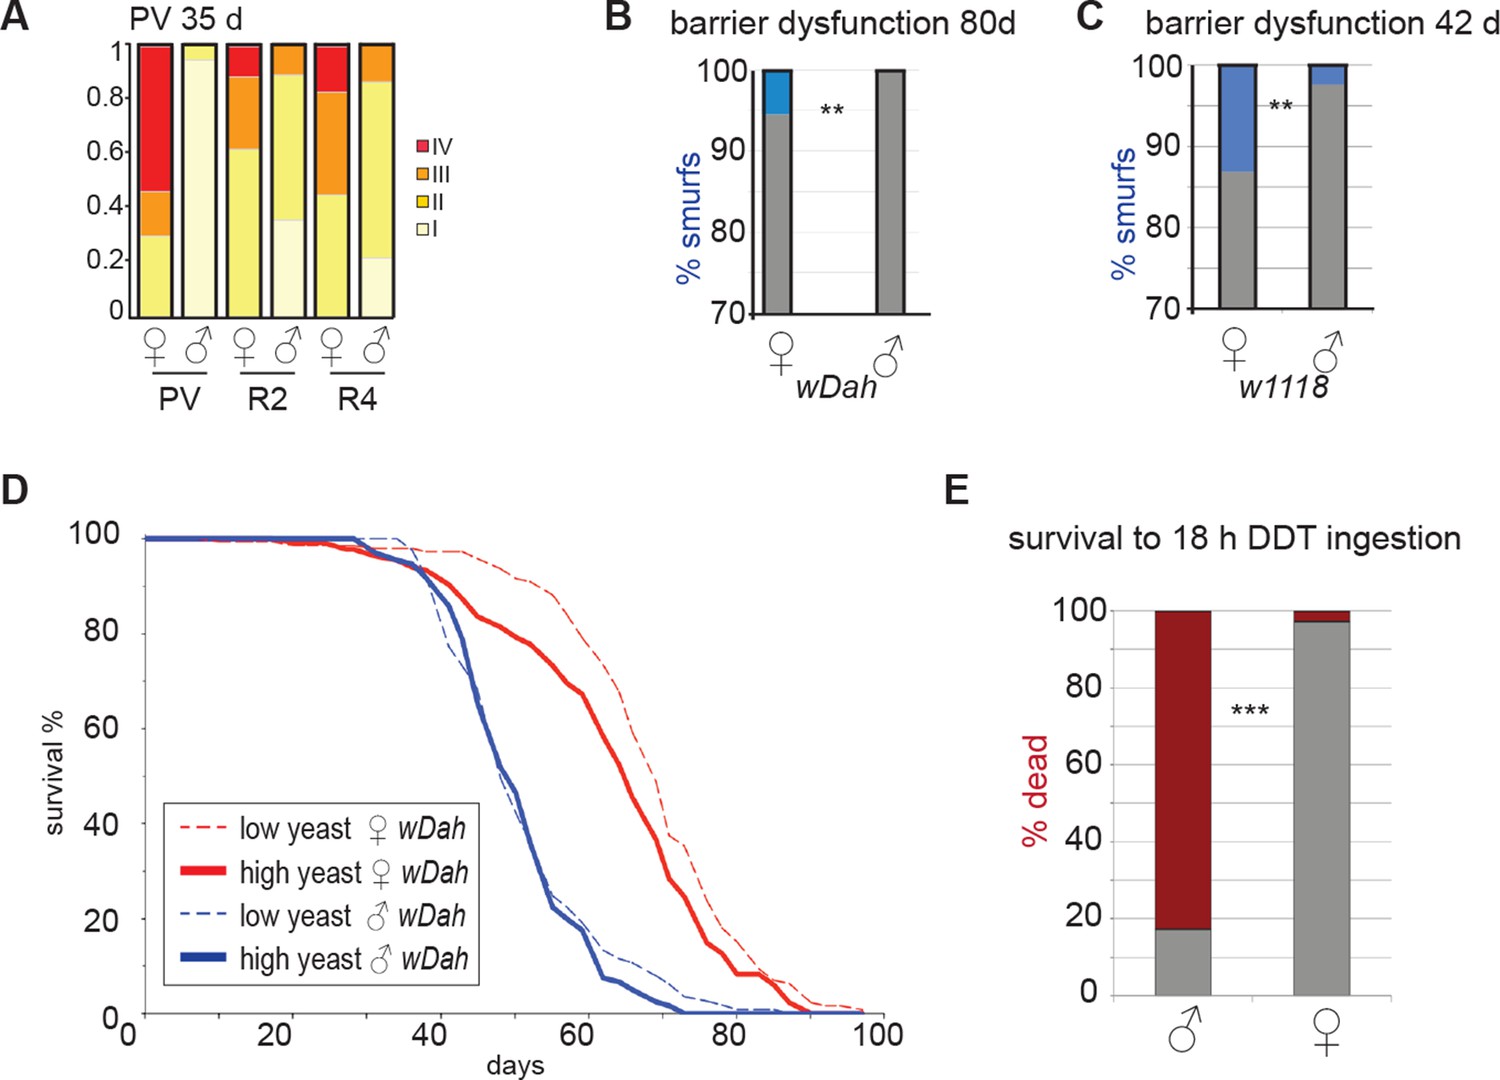
Sex differences in pathology, barrier dysfunction and response to intestinal challenge.
(A) Pathology at 64 days in wD;Resille males and females. Categories are described in Figure 2 legend. Males show significantly less pathology than females in all regions (n≥16 per group; ordinal logistical regression analysis, p<0.00000001 for PV, p<0.01 for R2, p<0.001 for R4). (B-C) Analysis of barrier dysfuction; at 80 days in wDah did not identify Smurf phenotype in males (n≥80 per group, Fisher’s exact, p<0.01) (B); at 42 days in w1118 identified the Smurf phenotype in a small proportion of males, but significantly more females (n≥200 per group, Fisher’s exact, p<0.01) (C). (D) Lifespan analysis of female (red) and male (blue) wDah flies on two different yeast dilutions. Females live longer than males on both diets (mean lifespans: female 1SYA = 68.2, male 1SYA = 51.6, female 2SYA = 63.7, male 2SYA = 50.7. Log rank; 1SYA, p=1.3E-26; 2SYA, p=1.34–20). Females live longer on 1SYA than 2SYA (Log rank, p=0.0088), but male lifespan is not extended on 1SYA compared to 2SYA (p=0.37) (E) 30-day-old males and females were exposed to DDT by feeding for 18 hr and total deaths were scored. By 18 hr, the majority of males had died (83%; red). Compare to females where most survived (2.7% dead; Fisher’s exact, p<0.0001) (G). PV, proventriculus
Figure 3 with 2 supplements
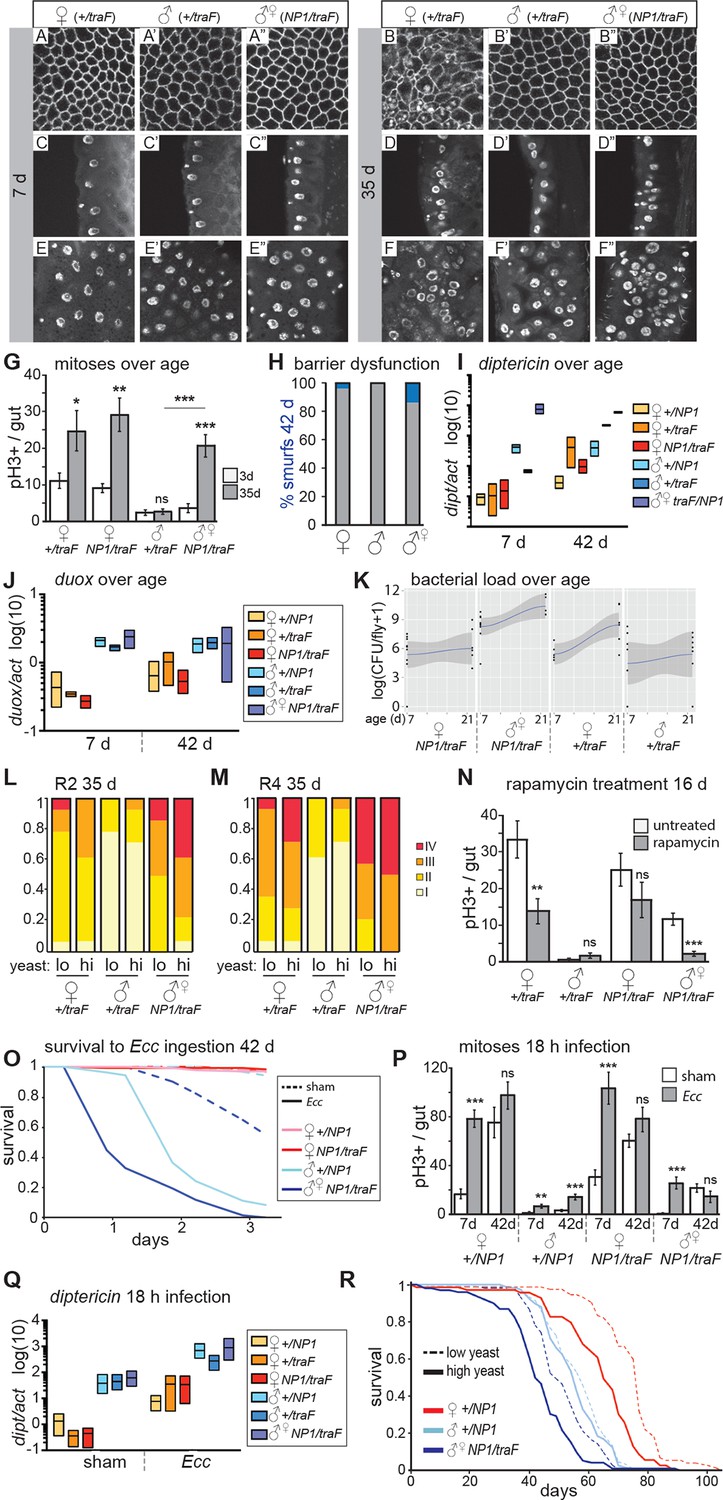
Feminized male guts develop female-like intestinal pathologies.
(A-G) Mis-expression of traF feminizes male midguts. (A-F”) PV (A-B”) and R2 (C-F”) morphology in +/traF females (A-F), +/traF males (A’-F’) and NP1>traF males (A”-F”) at 7 and 35 days, reveal female-like pathology in the R2 region of NP1>traF males at 35 days (F”). The NP1 driver is not expressed in the majority of the PV and accordingly, the PV is well-maintained at 35 days (B”). Control females and feminized males increased ISC proliferation over age, but control males did not (n=10–20 guts per condition, student’s t test, p=0.0366 for 3 vs 35 day-old +/traFfemales, p=0.0015 for 3 vs 35 day-old NP1>traF females, p=0.7057 for 3 d vs 35 d +/traFmales, p=0.00022 for 3 vs 35 day-old NP1>traF feminized males). Feminized male guts (NP1>traF) had more mitoses at 35 days than control (+/traF) male guts (p=0.00018) (G). (H-J) barrier dysfunction and systemic AMP expression were increased in feminized males. Barrier dysfunction was significantly higher in feminized males than control (+/traF) males at 42 days (n≥150 per group, Fisher’s exact, p=0.0001) and control (+/traF) females (p=0.0002) (H). Diptericin expression was increased over aging in all genotypes (n≥3 samples per condition, 10 individuals pooled per sample, 2 technical repeats; 2-way ANOVA, age p=0.0487, condition p=0.1031, interaction p=0.3485) and was increased in feminized males relative to control males at 7 days only (t test with Welch’s correction, p=0.0018 for NP1>traFvs +/NP1 at 7 days; p=0.5152 for NP1>traFvs +/NP1 at 42 days; p=0.0011 for NP1>traFvs +/traF at 7 days; p=0.8907 for NP1>traFvs +/traF at 42 days) (I). Doux expression did not increase over aging in any genotype, but was higher in males than females overall (J). (K) Aerobic bacterial load tended to increase between 7 and 21 days for both sexes and genotypes (n≥8 samples per condition, 5 individuals pooled per sample; Monte Carlo Markov Chain Generalised Linear Model with Poisson Error Family, where pMCMC=0.040 for males and pMCMC=0.064 for females). Feminized males had a significantly higher load than control males (pMCMC<0.001). In addition, the direction of bias compared to females was switched in feminized males, such that control males had lower load than females, but feminized males had a higher load. A similar result was obtained for anaerobic load. (L-N) Pathologies in feminized males are responsive to diet and rapamycin treatment. Pathologies were binned into scaled categories and quantified, n≥12 per condition. PV categories as described in Figure 2 legend (see Figure 3—figure supplement 2 for PV scoring). R2 and R4 categories were defined as follows: I = WT, single layer epithelium with low number of basal ISCs. II = sporadic pathology of small nuclei ‘nests’ without significant disruption to the epithelium; III = widespread pathology, majority of epithelium has several layers of nuclei; IV = widespread pathology plus clear tumor formation. Gut feminized males have significantly worse pathology than control males on both diets in R2 (OLR, low-yeast, z=-3.916, p=0.0000899; high-yeast z=-4.339, p=0.0000143) and R4 (low-yeast, z=-4.012, p=0.0000602; high-yeast z=-4.520, p=0.0000617). The incidence of severe pathology and tumors (cat IV) in R2 was greater in feminized males than control females on high yeast diet (p=0.04) but not low yeast diet (p=0.48), suggesting that there was a cost of feminization that was partly alleviated by DR (L-M). Rapamycin treatment decreased mitoses in females and feminized males at 16 days (n≥10 guts per condition, students t test; control (+/traF) females, p=0.0079; control (+/traF) males, p=0.1; control females (NP1/traF), p=0.22; feminized males (NP1/traF), p=0.0001). (N) O-R Feminized males were more sensitive to oral infection, but acquired a lifespan response to dietary restriction. At 42 days males succumbed to Ecc oral infection while females did not. Feminized males died significantly sooner than controls (O). After Ecc oral infection at 7 days, males and females of all genotypes increased gut mitoses compared to sham infected (n≥10 guts per condition, students t test; control (+/NP1) females, p=2.082E-06; control (+/NP1) males, p=0.0011; control females (NP1/traF), p=0.00017; feminized males (NP1/traF), p=0.00045). However, females and feminized males lost the response to infection against a background of high proliferation in unchallenged individuals at 42 days (n≥10 guts per condition, students t test; control (+/NP1) females, p=0.2; control (+/NP1) males, p=0.0088; control females (NP1/traF), p=0.1478; feminized males (NP1/traF), p=0.2344) (P). Systemic dipt expression was increased after 18 hr continuous infection in all genotypes at 42 days (n≥10 guts per condition, t test with Welch’s correction; +/NP1 females, p=0.0571; +/NP1 males, p=0.0132; +/traF females, p=0.0376; +/traF males, p=0.0282; NP1/traF females, p=0.0110; NP1/traF feminized males p=0.0331), but at a higher level in males than females in both sham and infected conditions (sham: +/NP1 females vs males, p=0.0135; +/traF females vs males, p=0.0428; NP1/traF females vs males, p=0.0022. Infected: NP1/+ females vs males, p=0.0012; +/traF females vs males, p=0.0964; NP1/traF females vs males, p=0.0237.) (Q). Lifespan analysis of NP1>traF males and +/NP1 control males and females on two yeast dilutions. NP1>traF males were significantly shorter lived than control males on both standard (low yeast; log rank, p=0.0023) and double (high yeast; log rank, p=2.06E-11) yeast dilutions, whereas +/NP1 control males did not differ between food conditions (log rank, p=0.34). This is a representative lifespan of three with similar outcomes. Cox proportional hazards analysis of the lifespan demonstrated a significantly increased risk of dying on high-yeast vs low-yeast food overall (p=2 x 10–16), and a significant difference in the response to food between control male genotypes and NP1>traF (gut feminized) males (p=0.0298). For full analysis, see Figure 3—source data 1. PV, proventriculus.
-
Figure 3—source data 1
Output table for Cox Proportional Hazards analysis of the NP1>traF (feminized gut) lifespan (Figure 3Q), showing hazard ratios, z and p values, and significance for all interactions.
- https://doi.org/10.7554/eLife.10956.009
Figure 3—figure supplement 1
Feminization by misexpression of traF.
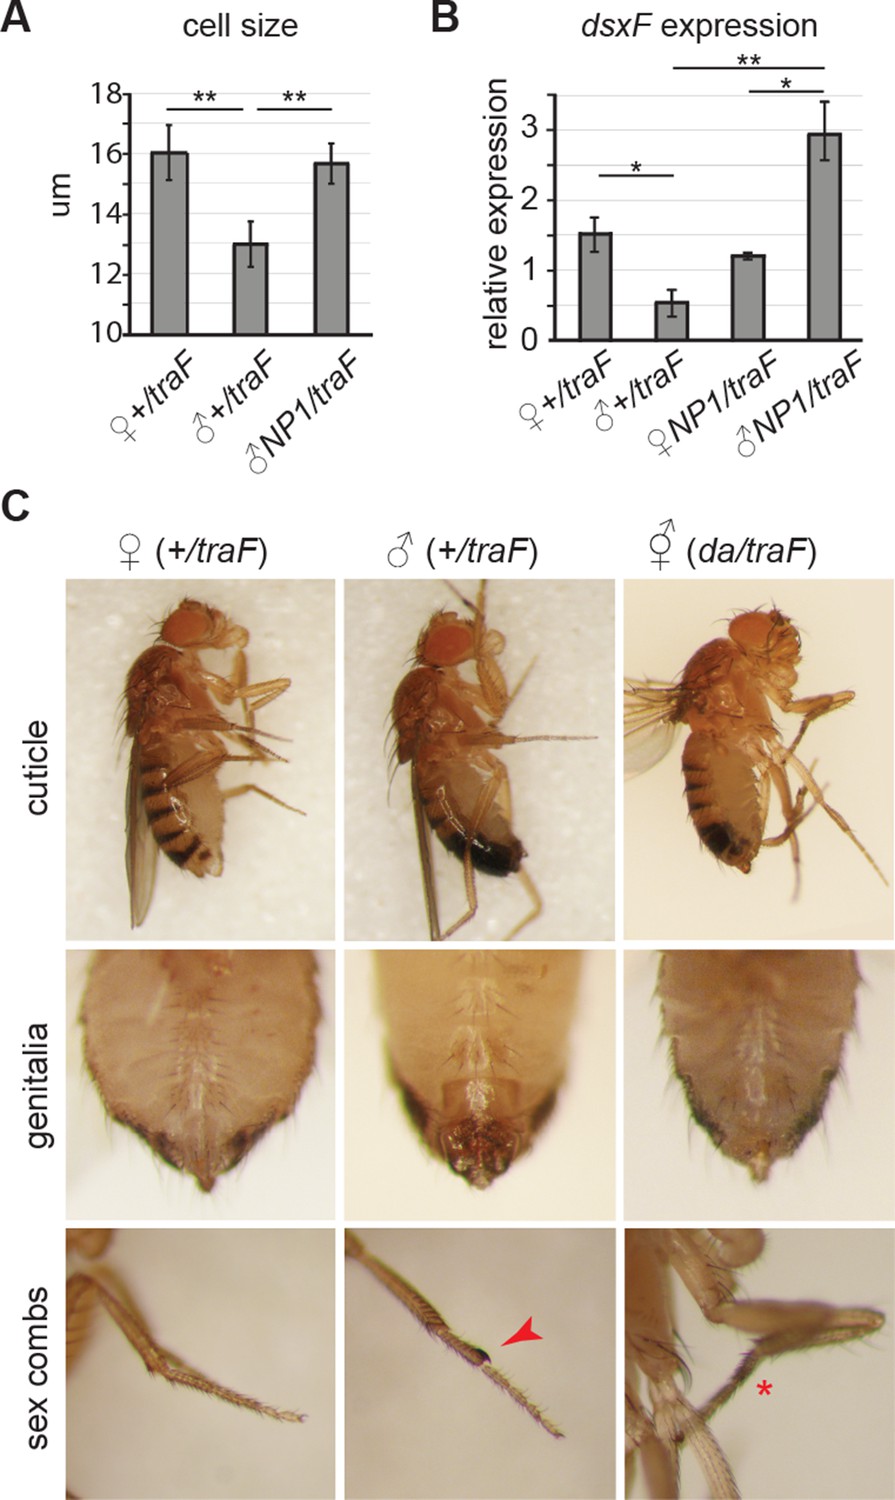
(A-C) Misexpression of traF feminized males. Enterocyte cell size was greater in control females (wD;+/UAS-traF,Resille-GFP; traF/+) than control males (student’s t test, p=0.003), and was increased in 7-day-old feminized male (wD;NP1-Gal4/UAS-traF,Resille-GFP; NP1>traF) guts, compared to control male guts (student’s t test, p=0.005) (A). The female-specific form of doublesex (dsxF), the direct downstream target of traF, was expressed at higher levels in the midguts of NP1>traF compared to control traF/+ male guts (student’s t test, p=0.037) by quantitative PCR. Expression in NP1>traF feminized males was approx. Two fold higher than in control traF/+ females (student’s t test, p=0.05) and NP1>traF females (student’s t test, p=0.04). NB traF/+ and NP1>traF females expressed comparable levels of dsxF (student’s t test, p=0.263), suggesting feedback regulation of dsxF expression in females (B). Males flies were feminized in sexually dimorphic structures by ubiquitous mis-expression of the female-specific isoform of transformer (UAS-traF), using the daughterless-Gal4 (da-Gal4) driver. Feminized males (da/traF) partially regained female stripe pattern on the posterior dorsal cuticle, had feminized genitalia and loss (red asterisk) of sex combs (red arrow) (C).
Figure 3—figure supplement 2
Feminized males increase mitoses but do not resist oral Ecc infection.
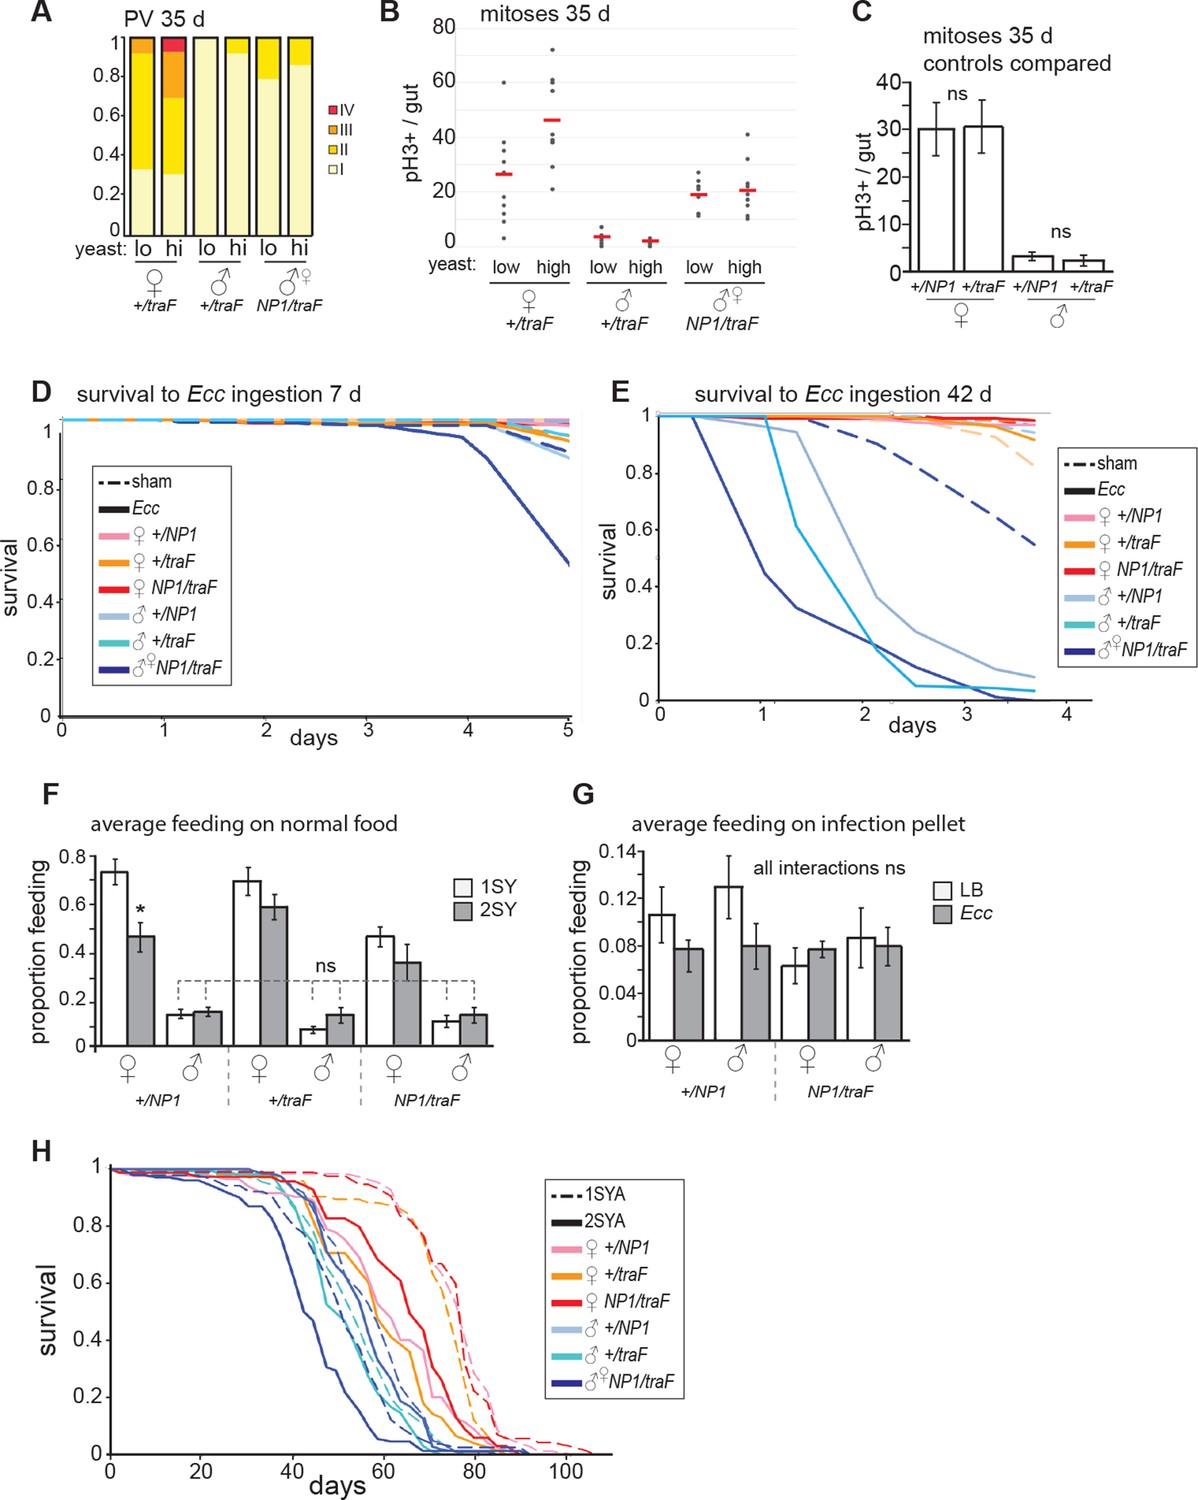
(A) The driver NP1-Gal4 was not expressed at high levels in the PV. Accordingly, pathologies did not appear in the PV in NP1>traF males, where control females developed worse pathologies than feminized males (z=-2.182, p=0.0291). (B) Analysis of midgut mitoses. pH3+ cell number was increased in NP1>traF midguts at 35 days, compared to control traF/+ males (student’s t test, p=1.52E-05). There was a higher number of mitoses in high-yeast traF/+ females (student’s t test, p=0.033) compared to low yeast. NP1>traF males did not increase mitoses on high yeast (means; low yeast = 18.7, high yeast = 20.7; p=0.6). (C) Control males and females (NP1/+ and traF/+) do not differ in mitoses per gut at 35 days (n=10, students t test, p=0.956 for females and p=0.601 for males). (D-E) Survival to oral infection at 7 days (D). Survival to oral infection at 42 days showing all controls (E) (F-G) Average feeding on normal and infected food. Feminized males (NP1>traF) do not feed differently from control males on normal food (n=8 groups of five individuals, students t test, NP1>traF males vs control males: NP1/+ 1SYA (low yeast) p=0.352, 2SYA (high yeast) p=1; traF/+ 1SYA p=0.272, 2SYA p=0.852) (F). No significant differences between sexes, or between sham and infected (with students t test) (G). (H) Full NP1>traF lifespan with all controls (see Figure 3 legend and Figure 3—source data 1 for statistical analyses).
Download links
A two-part list of links to download the article, or parts of the article, in various formats.
Downloads (link to download the article as PDF)
Open citations (links to open the citations from this article in various online reference manager services)
Cite this article (links to download the citations from this article in formats compatible with various reference manager tools)
Sex difference in pathology of the ageing gut mediates the greater response of female lifespan to dietary restriction
eLife 5:e10956.
https://doi.org/10.7554/eLife.10956


