Population genomics of intrapatient HIV-1 evolution
- Max Planck Institute for Developmental Biology, Germany
- Karolinska Institute, Sweden
- Stockholm South General Hospital, Sweden
- Karolinska University Hospital, Sweden
Figures
Figure 1 with 2 supplements
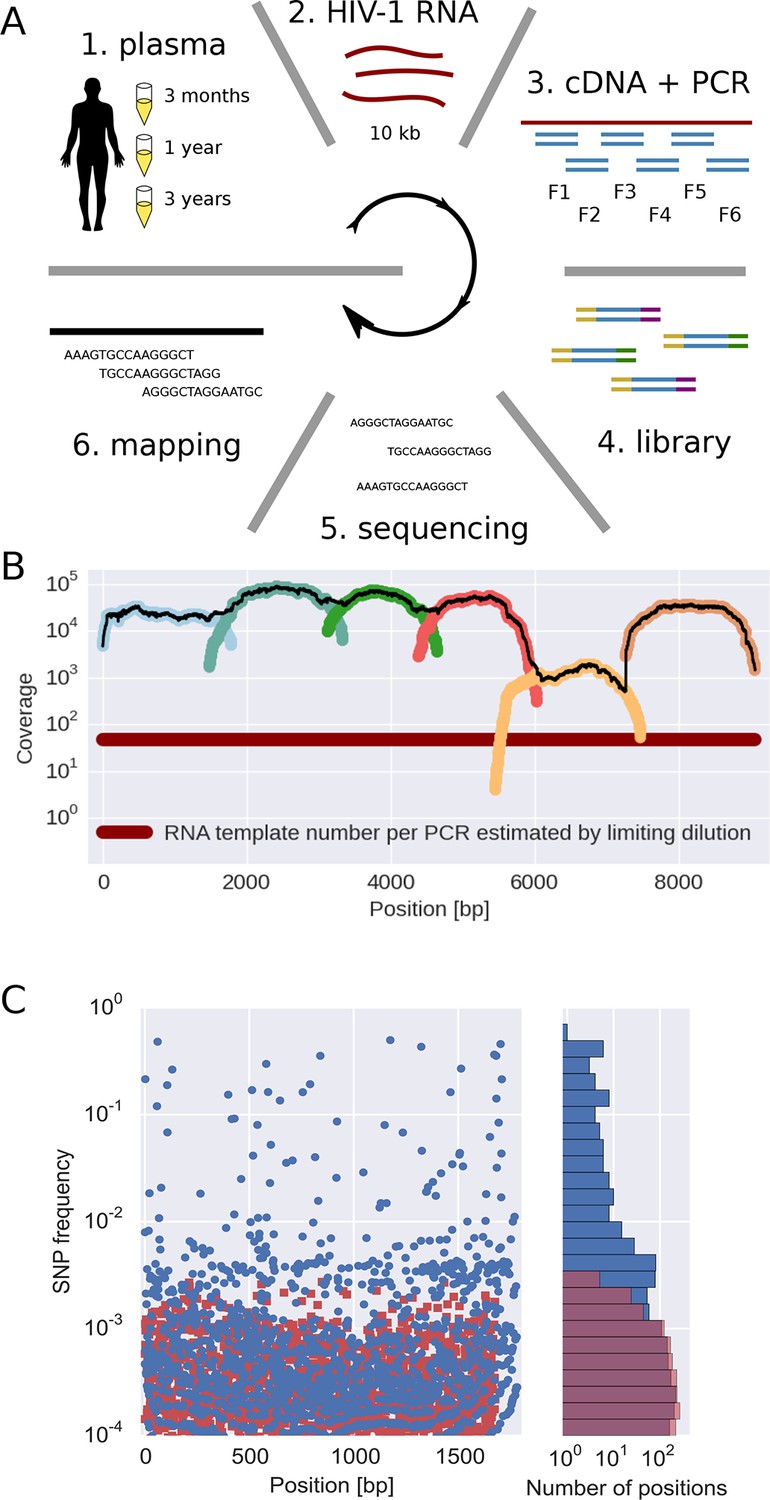
Sequencing, coverage, and error rates.
(A) Schematics of the sample preparation protocol, see text and Materials and methods for details. (B) Read coverage for a representative sample. Coverage of separate PCR amplicons is shown in different hues, the black line is the total coverage. The coverage of PCR fragment F5 is lower than the other amplicons, but it is still larger than number of input HIV-1 RNA molecules; this situation is typical in our samples. (C) Each blue circle corresponds to a SNP frequency in amplicon F1 of a late sample of patient 11, while red squares are SNP frequencies in the sequence data generated from 10,000 copies of plasmid NL4-3. The histogram on the right shows the distribution of SNP frequencies in the patient sample and the control. Minor SNPs observed in reads generated from the plasmid, which represent PCR and sequencing errors, did not exceed 0.3%. SNP, single nucleotide polymorphism; RT-PCR, reverse transcriptase polychromase chain reaction.
Figure 1—figure supplement 1
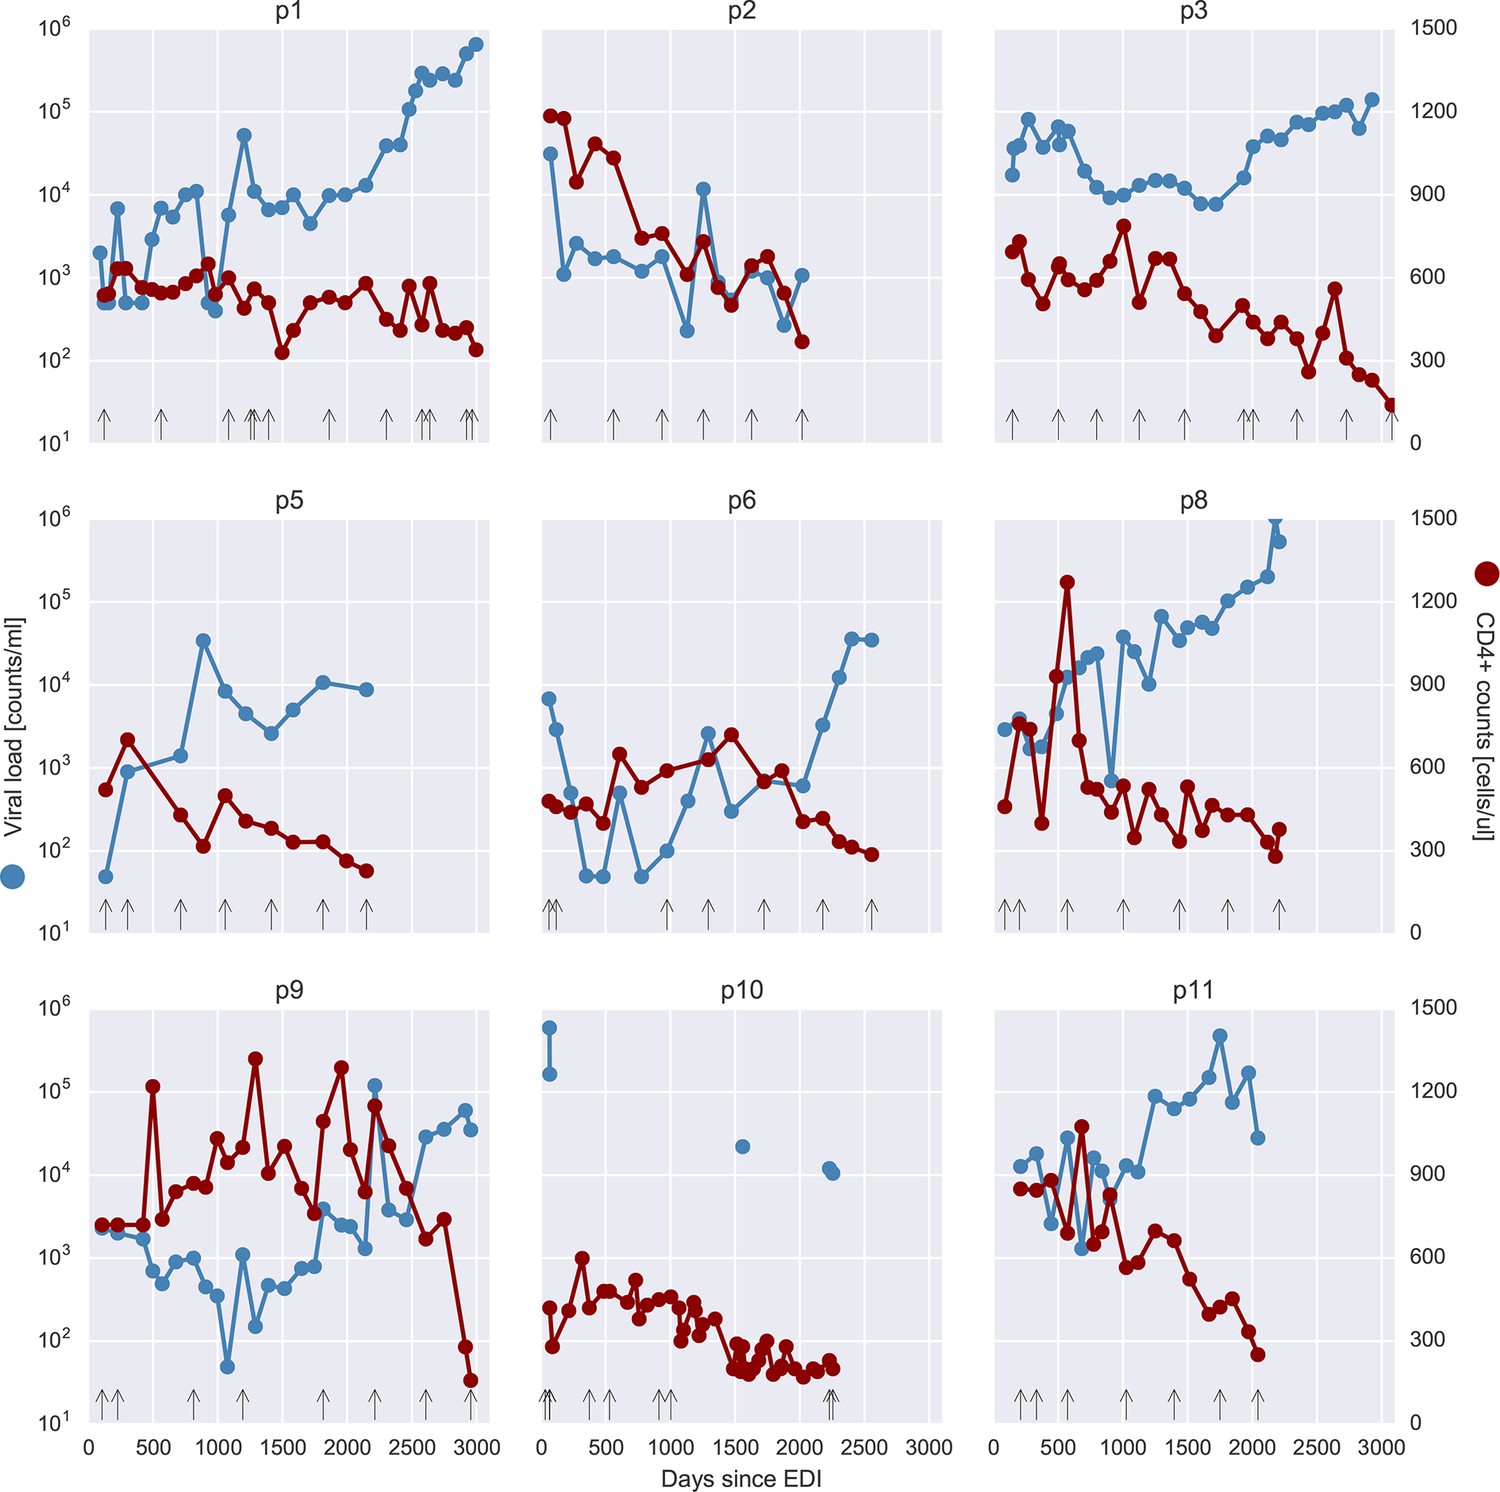
Viral load and CD4+ cell counts for all nine patients.
Samples that were selected for deep sequencing are indicated as black vertical arrows at the bottom of each panel. Viral load values at 499 or 49 counts/ml actually indicate negative tests, at the respective level of sensitivity (500 or 50 counts/ml). EDI, estimated date of infection.
Figure 1—figure supplement 2
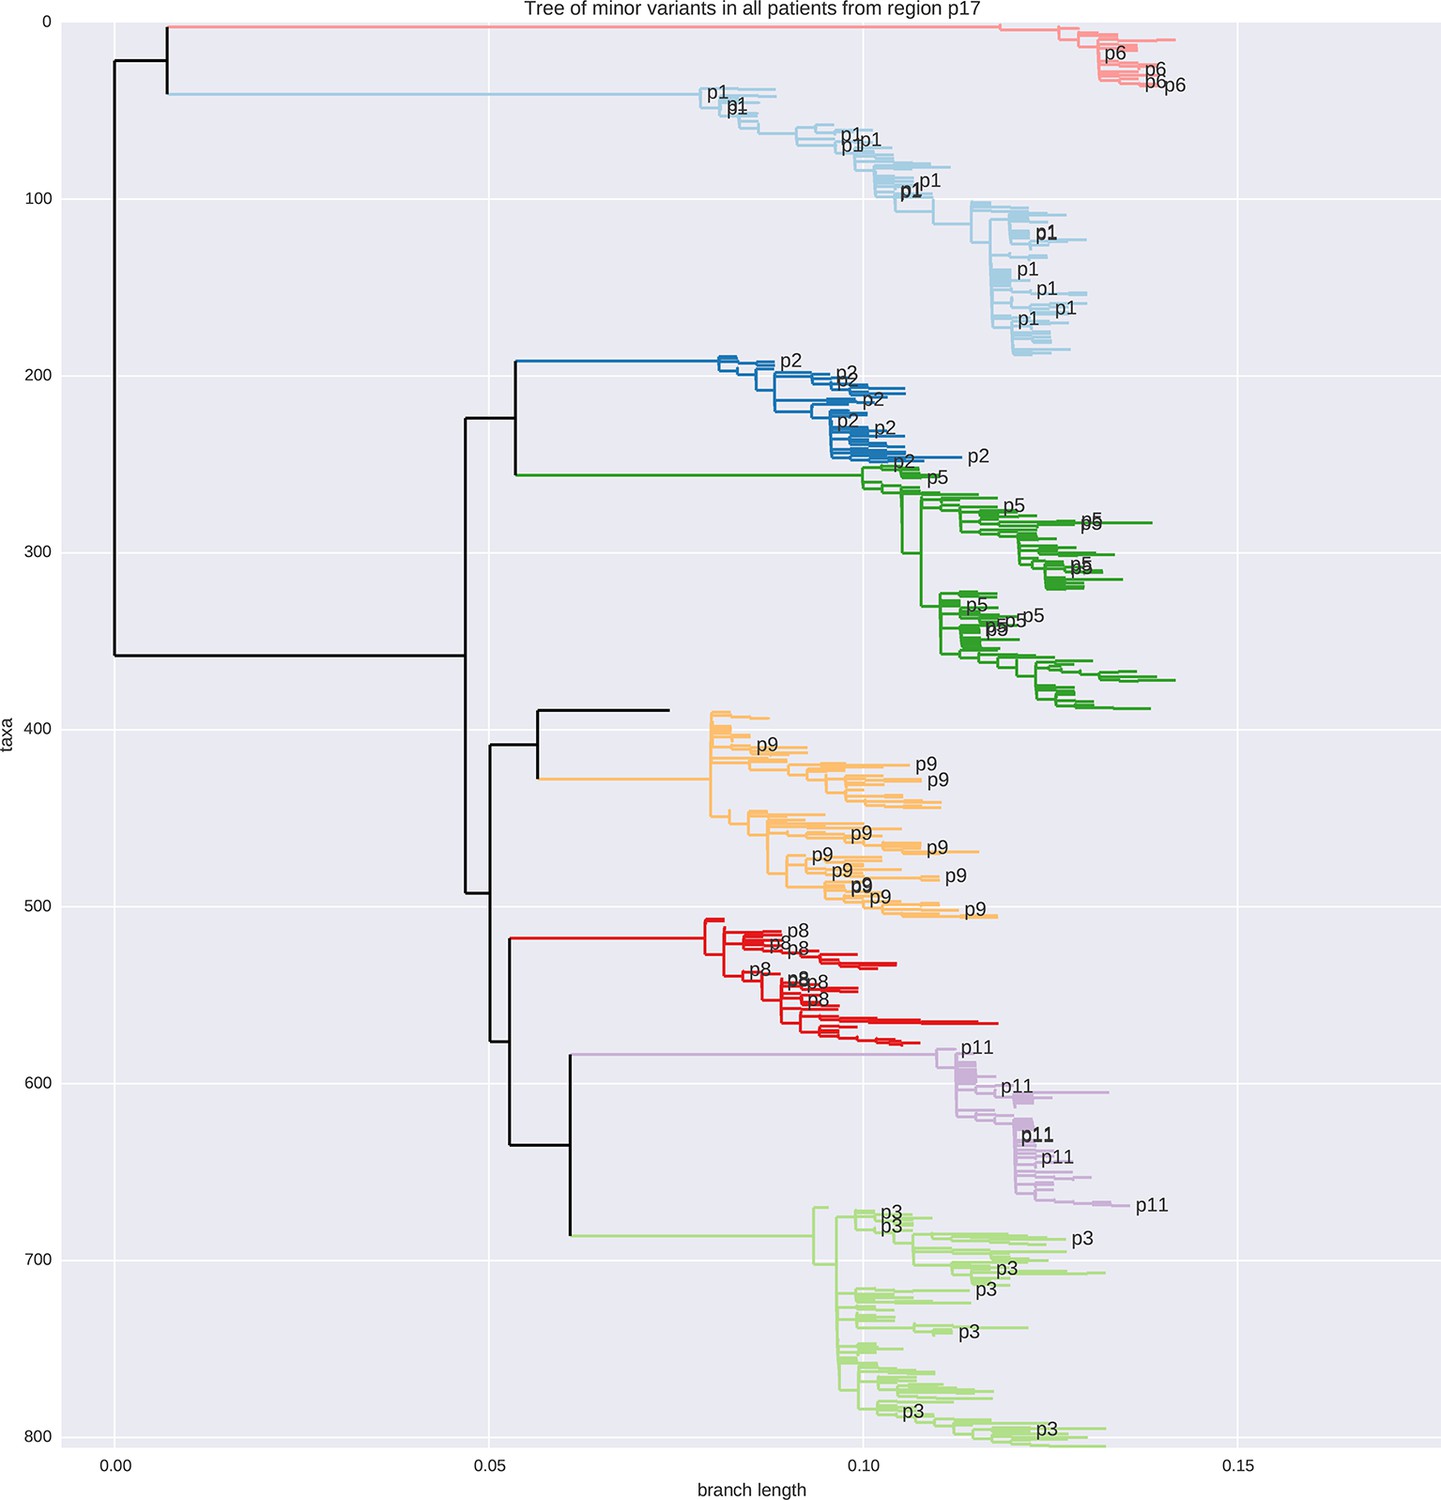
Tree of minor reads covering p17 from all samples colored by patient ID.
No sample cross-contamination is observed. The isolated black tip is the HxB2 reference sequence.
Figure 2
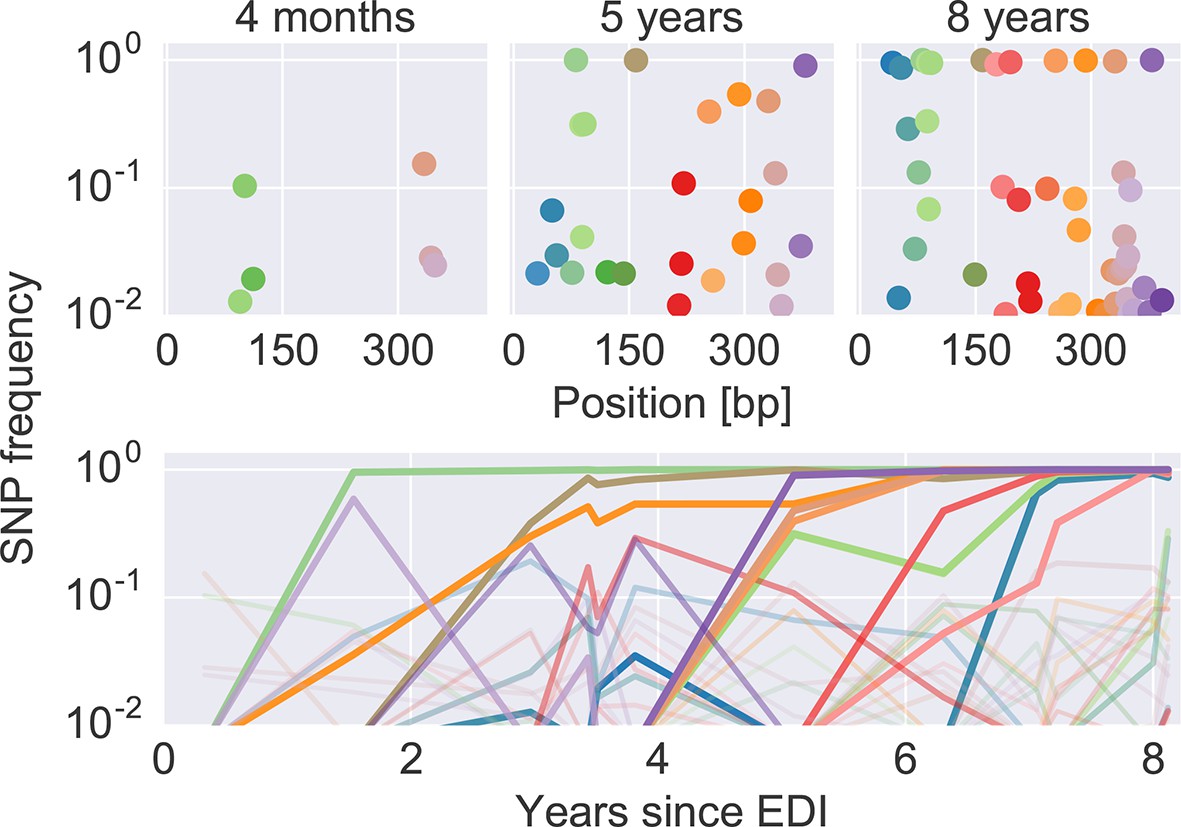
The dynamics of SNP frequencies.
The upper panels show single nucleotide polymorphism frequencies along p17 at three time points in patient p1. The lower panel shows the trajectories of SNPs through time. Color corresponds to position in the sequence. Trajectory that reach high frequencies are shown with thicker and more opaque lines. Analogous data is available for all patients for most of the HIV-1 genome. EDI, estimated date of infection; SNP, single nucleotide polymorphism.
Figure 3 with 2 supplements
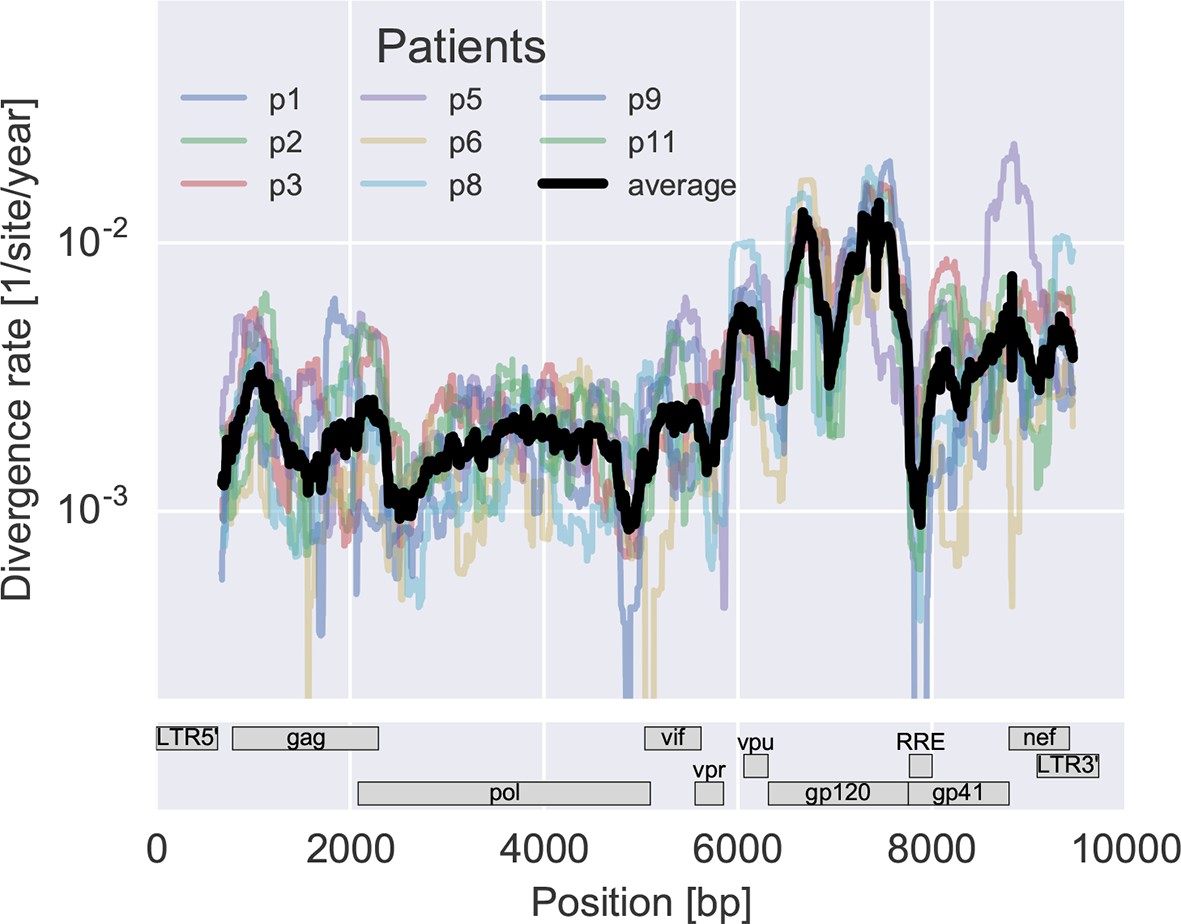
Consistent evolution across the viral genome.
The figure shows the rate of sequence divergence averaged in a sliding window of length 300 bp for individual study participants (in color) and averaged over all (black). Rapidly evolving (V loops in gp120) and conserved (RRE) regions are readily apparent. The divergence rates are determined by linear regression of the distance from the putative founder sequence against time since EDI. This distance includes contributions of minor variants. All positions are given in HxB2 numbering. The corresponding figure for amino acid evolution is provided as Figure 3—figure supplement 2.
Figure 3—figure supplement 1
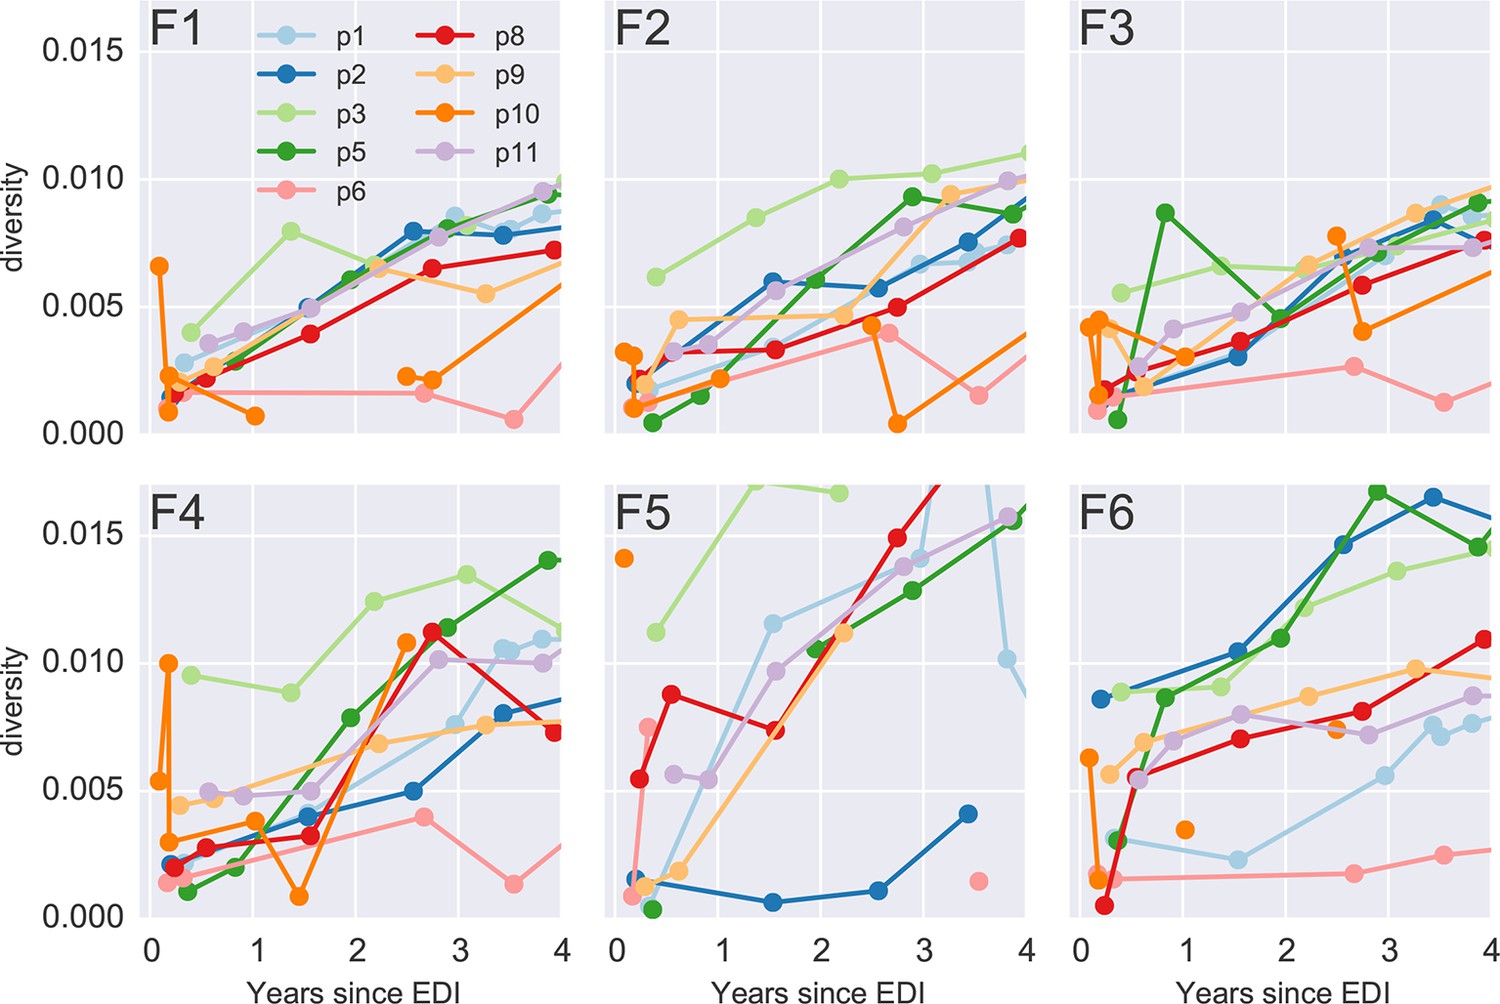
Diversity over time for all six PCR fragments and all patients.
Early samples of p3 and p10 show diversity at levels suggesting an infection with multiple founder viruses, while the remaining infections appear to be founded by a single variant. EDI, estimated date of infection.
Figure 3—figure supplement 2

Divergence rate like Figure 3 but for amino acids rather than nucleotides.
Divergence is estimated in a sliding window of 100 amino acids across the genome (including tat but excluding rev and the LTRs). The resulting picture is similar to what we observe at the nucleotide level.
Figure 4 with 2 supplements
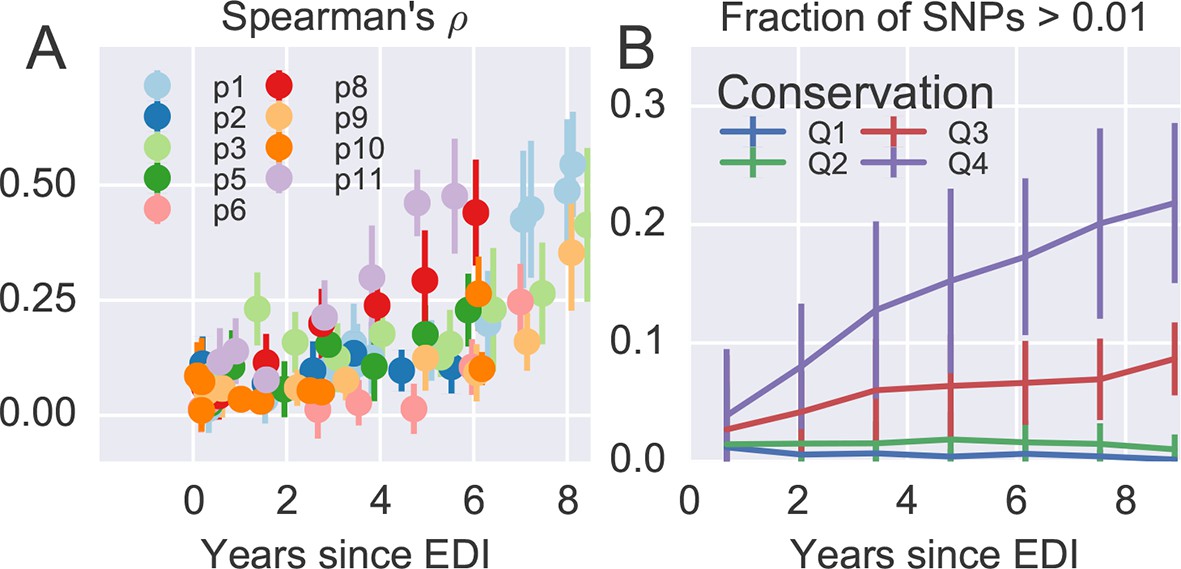
Within patient variation mirrors global variation.
(A) Intrapatient variation at individual sites is correlated with diversity at homologous positions in an alignment of sequences representative of HIV-1 group M. This correlation increases reproducibly throughout the infection. Error bars show standard deviations over genomic regions. (B) Similarly, the fraction of sites with minor variants above 1% increases over time at the least constrained positions (quartiles Q3 and Q4), while few sites in the most conserved quartiles (Q1 and Q2) are polymorphic. Figure 4—figure supplements 1 and 2 show the corresponding results for amino acid rather than nucleotide comparisons and patient–patient correlations of diversity, respectively. EDI, estimated date of infection.
-
Figure 4—source data 1
Tab-delimited files with plotted data.
- https://doi.org/10.7554/eLife.11282.012
Figure 4—figure supplement 1
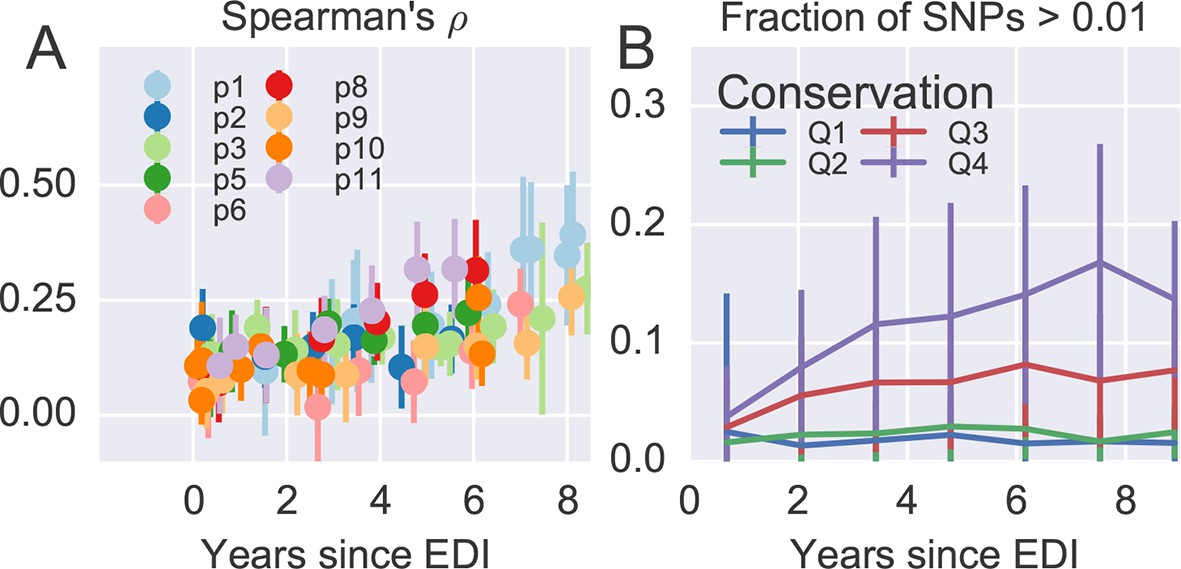
Within–patient variation mirrors global variation at the amino acid level, similar to what we observed at the nucleotide level.
Reference alignments against NL4-3 were used instead of HxB2 to ensure good translation (HxB2 has frameshift mutations). EDI, estimated date of infection; SNP, single nucleotide polymorphism.
-
Figure 4—figure supplement 1—source data 1
Tab-delimited files with plotted data.
- https://doi.org/10.7554/eLife.11282.014
Figure 4—figure supplement 2
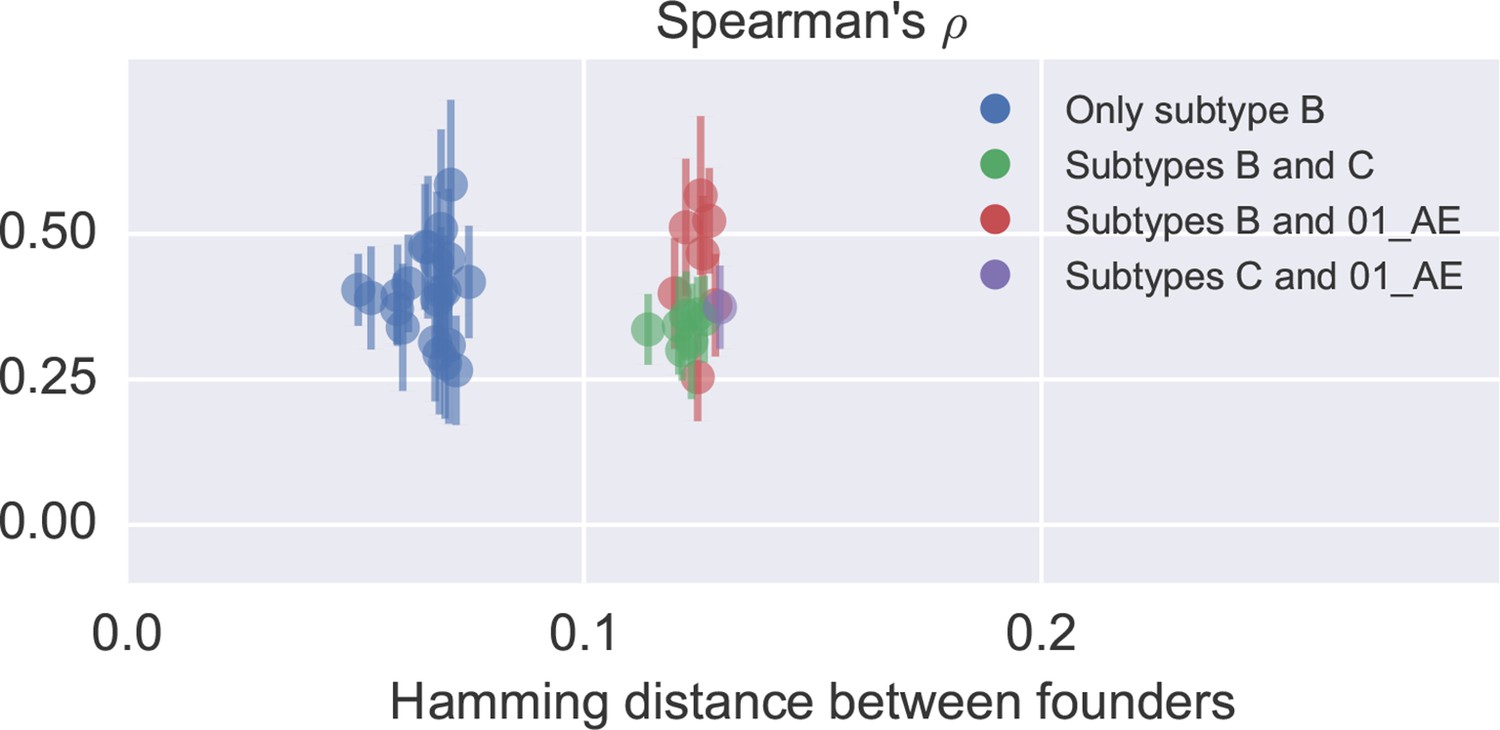
Correlation in nucleotide variation between study participants.
Each dot corresponds to one patient pair and reports the mean and standard deviation of diversity correlations over different genomic regions. No clear difference between comparisons within and across subtypes is observed, but the study included only one subtype C (p6) and one recombinant 01_AE (p1) infection. Only late samples were used (days since EDI ≥ 1500). In general, the correlation between patients is similar to the one to cross-sectional diversity.
Figure 5
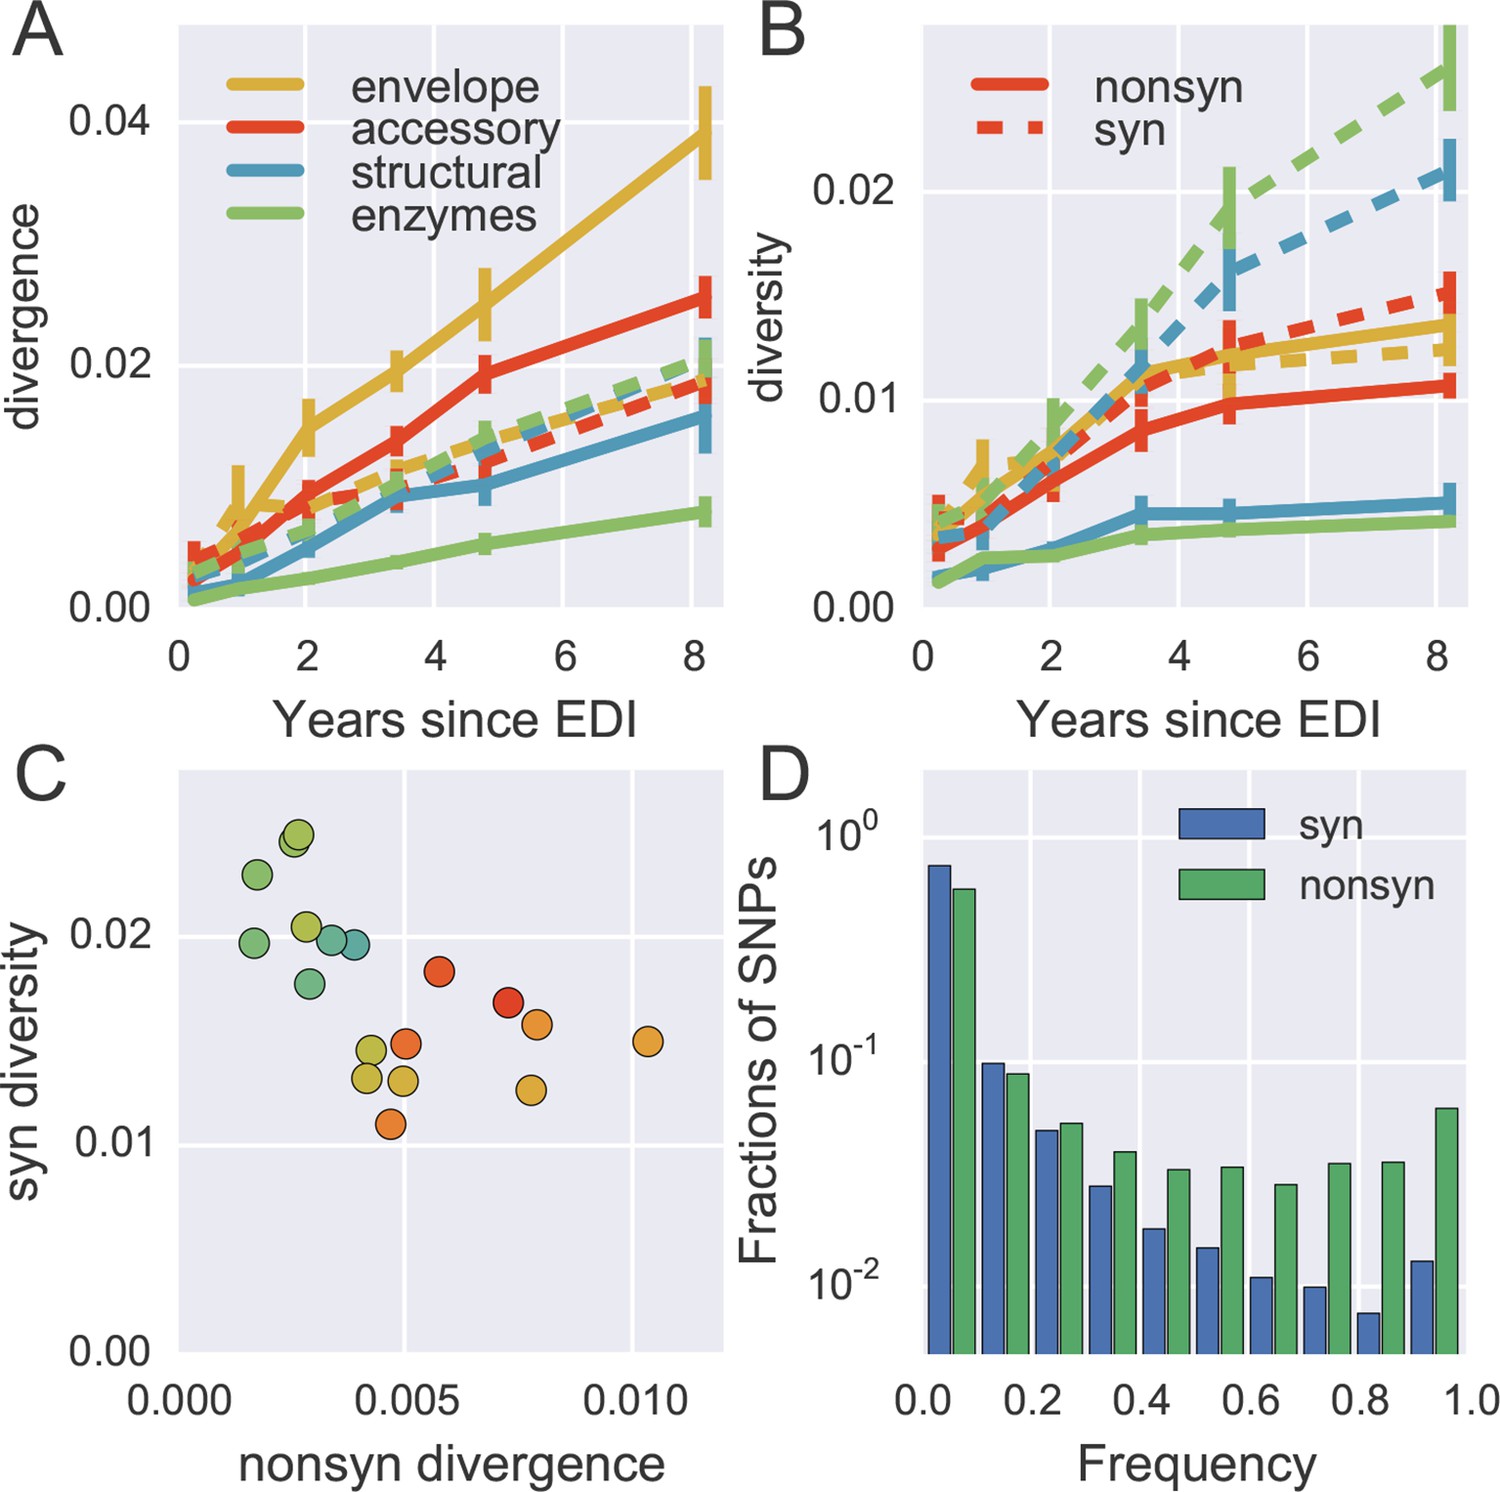
Distinct patterns of evolution across mutation types and regions.
(A) shows divergence at nonsynonymous (solid) and synonymous (dashed) positions over time for different genomic regions averaged over all patients, measured as average Hamming distance from founder. While synonymous divergence is very similar in different regions, nonsynonyous divergence varies. (B) shows diversity through time, measured as average pairwise Hamming distance. Regions with high nonsynonymous diversity (and divergence) tend to have low synonymous diversity. Error bars represent standard deviations of patient bootstrap replicates. (C) shows the anti-correlation between the rate of nonsynonymous divergence and synonymous diversity in 1kb windows across the genome (color indicates position on the genome blue→green→yellow→red). (D) shows the site frequency spectrum of synonymous (blue) and nonsynonymous (green) SNPs. EDI, estimated date of infection; SNP, single nucleotide polymorphism.
-
Figure 5—source data 1
Tab-delimited files with plotted data.
- https://doi.org/10.7554/eLife.11282.017
Figure 6 with 1 supplement
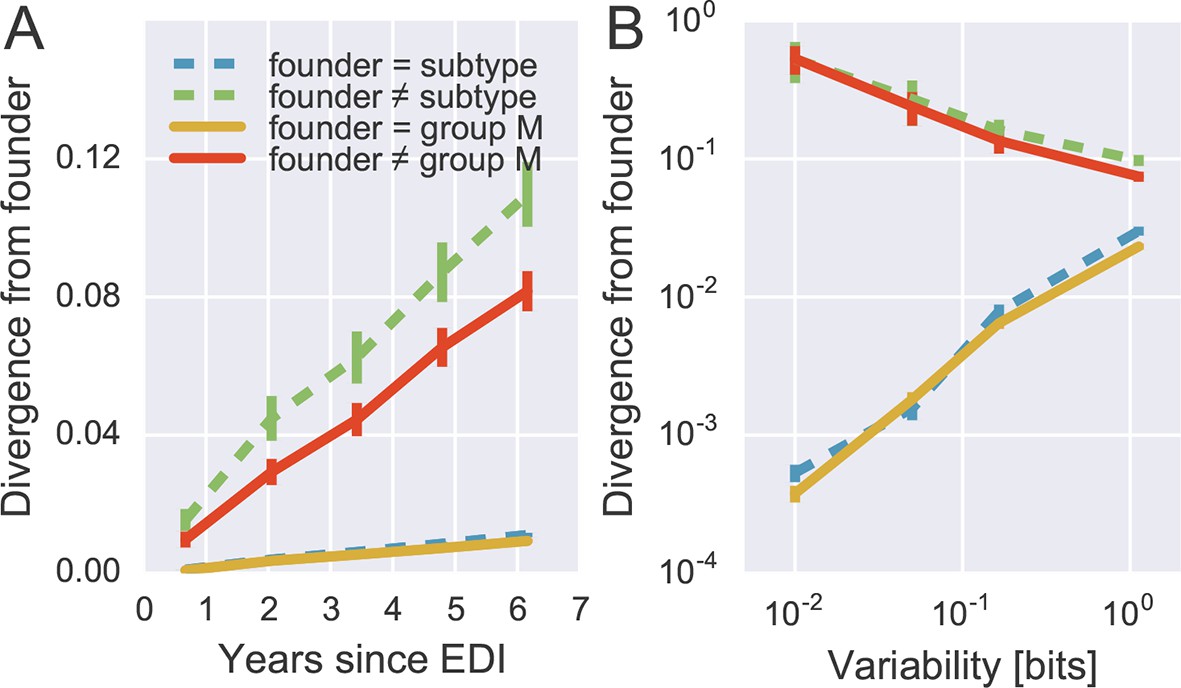
Rapid reversion at conserved sites.
(A) Sites where the founder sequence differed from the subtype or group M consensus (upper curves) diverged about tenfold more rapidly than sites that initially agreed with the consensus (lower curves). (B) The rate of reversion increased with conservation (lower variability), while divergence away from consensus showed the opposite behavior (divergence is measured at 5−6 years). Error bars report the standard deviation of patient bootstraps. Figure 6—figure supplement 1 shows the corresponding figure for amino acids rather than nucleotides.
-
Figure 6—source data 1
Tab delimited files with plotted data.
- https://doi.org/10.7554/eLife.11282.019
Figure 6—figure supplement 1
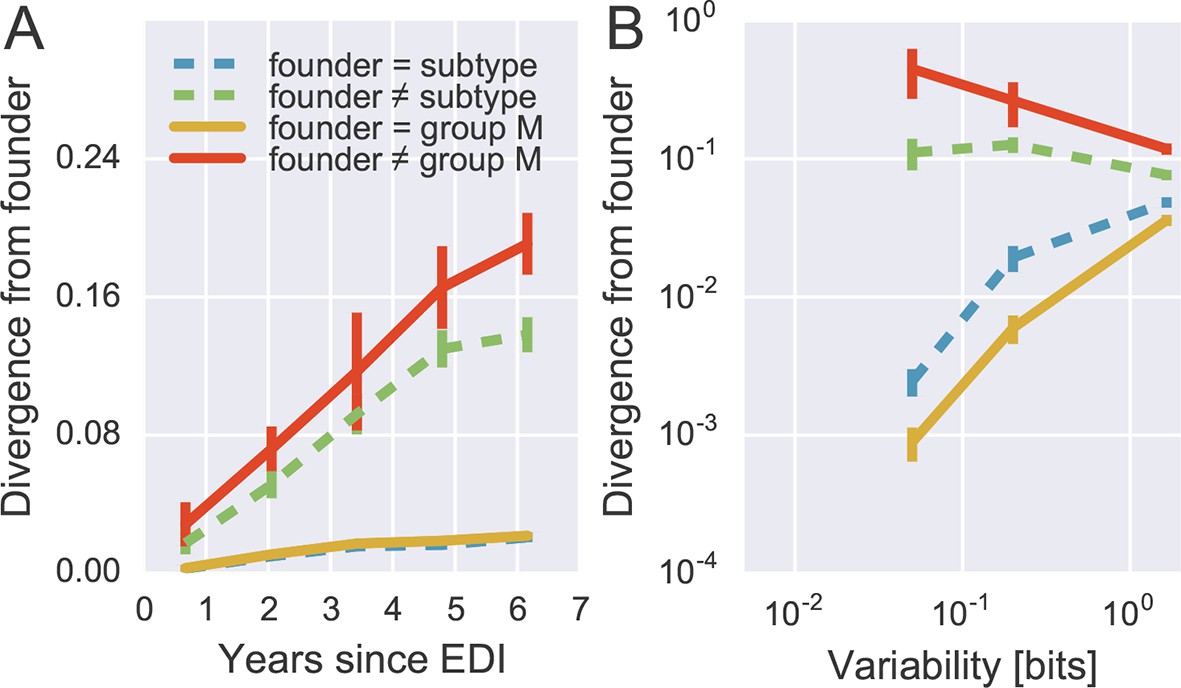
Patterns of reversion at the amino acid level are similar to those at the nucleotide level.
Reference alignments against NL4-3 were used instead of HXB2 to ensure good translation (HXB2 has frameshift mutations).
-
Figure 6—figure supplement 1—source data 1
Tab-delimited files with plotted data.
- https://doi.org/10.7554/eLife.11282.021
Figure 7

Linkage and recombination.
Linkage disequilibrium decays rapidly with distance between SNPs. Colored lines correspond to the different fragments, each averaged over patients. The dashed line shows data from a control experiment for PCR recombination, where two cultured virus populations were mixed. No PCR recombination is observed.
-
Figure 7—source data 1
Tab-deliminated files with plotted data.
- https://doi.org/10.7554/eLife.11282.023
Figure 8

Phylogenetic trees of minor genetic variants.
In rapidly evolving genomic regions, trees that include minor genetic variants (haplotypes) approximate the true phylogeny. Here p17 in gag and the variable loop 3 in env from patient p1 are compared; many more trees are available on the website. Trees are reconstructed using FastTree (Price et al., 2009).
Figure 9 with 2 supplements
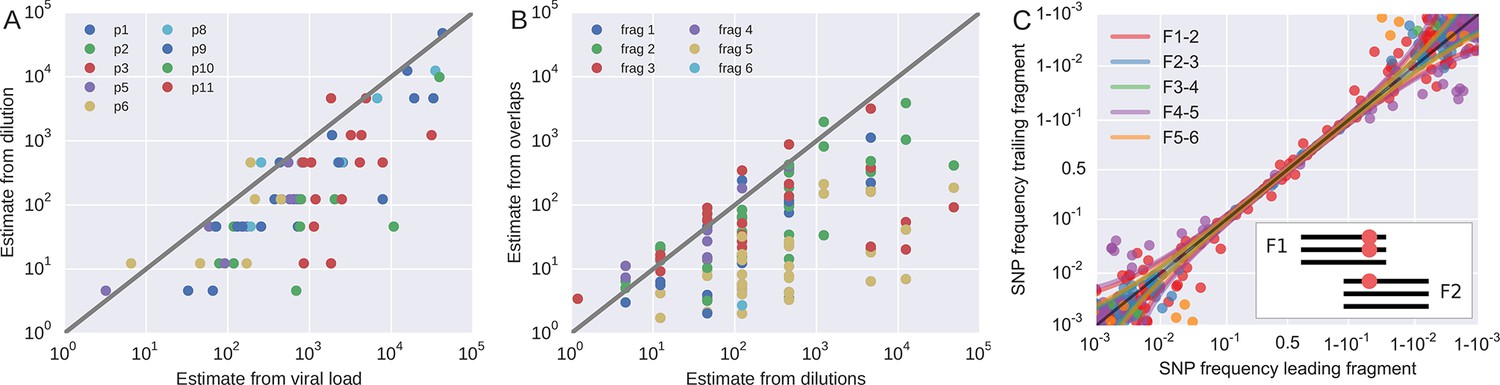
Template quantification and accuracy of SNP frequency estimates.
The left panel shows actual template numbers as experimentally determined by end point dilution (y-axis) vs. the maximum theoretical template input as estimated based on plasma virus levels. The estimates from the dilutions are typically a factor of three below the expectation from viral load, suggesting generally good template recovery. The center panel show the correlation of fragment-specific effective template numbers estimated from the concordance of SNPs in fragment overlaps. Again, the correlation is generally good, but fragment F5 often has estimates lower than those from the dilution series consistent with problems faced in amplification of this fragment. Information from fragment F6 is largely absent, since there is very little variation in the F5–F6 overlap. The right panel plots SNP frequencies in overlaps measured in the leading fragment against the trailing fragment. Deviations from the diagonal are due PCR bias and random sampling from limited template molecules. Given enough diversity in overlap regions, the concordance of variant frequencies can be used to estimate fragment specific template input and accuracy of SNP frequencies. SNP frequencies in overlaps of the individual fragment pairs are shown in Figure 9—figure supplement 2.
Figure 9—figure supplement 1
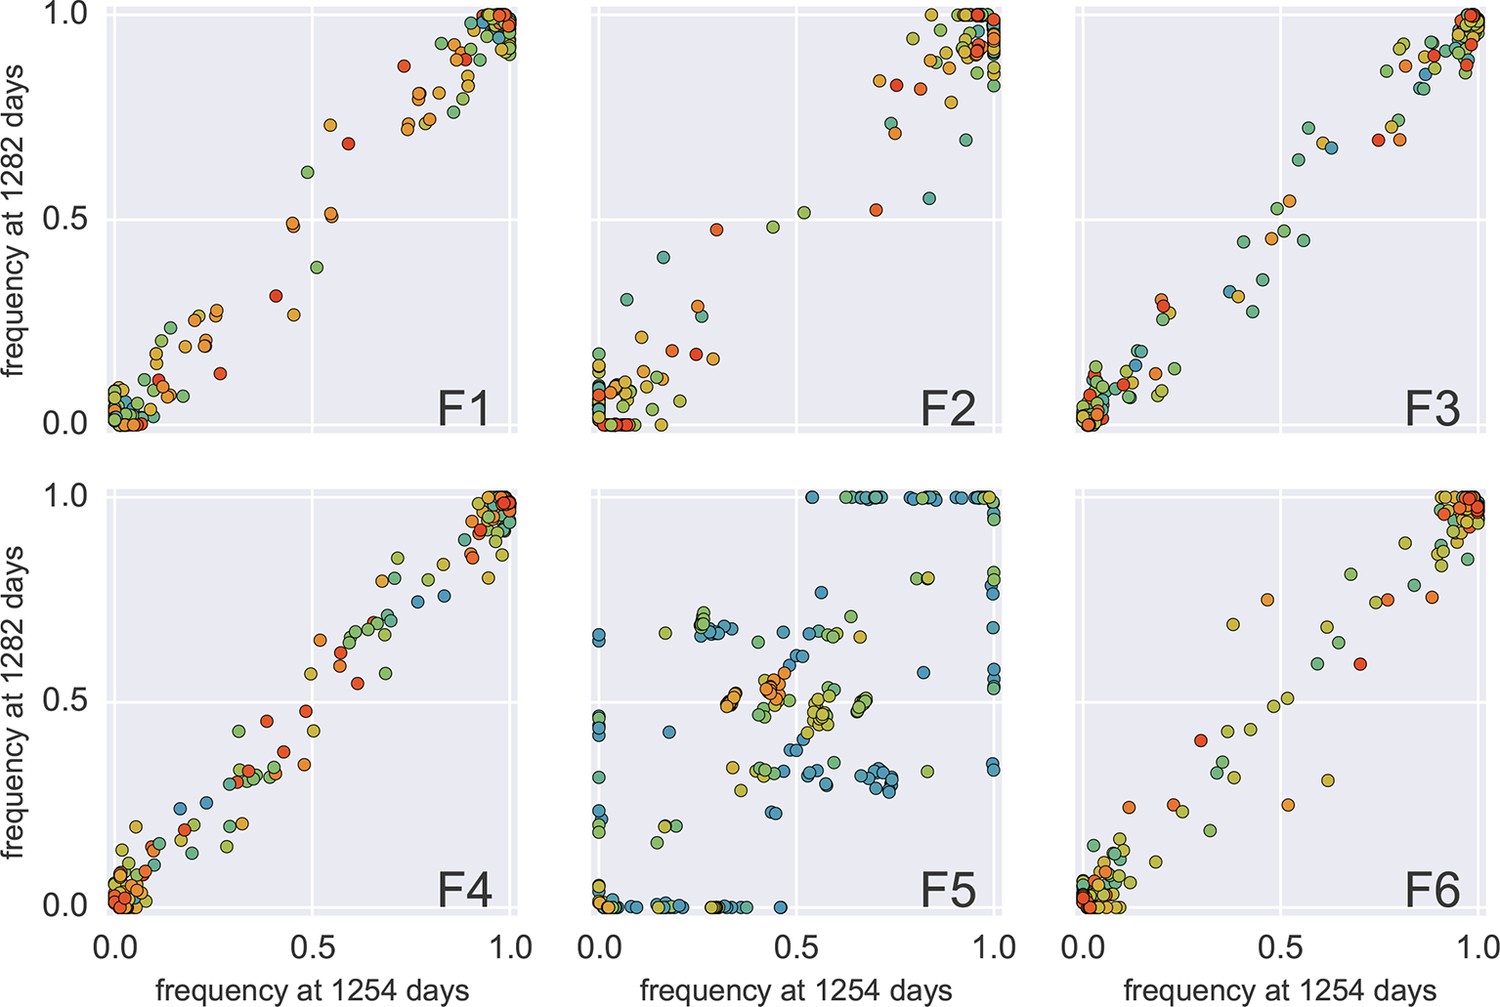
Concordance between two samples 30 days apart (samples 4 and 5 of p1).
In all fragments but F5, the SNP frequencies agree with each other within the variability expected during 1 month of evolution. Fragment 5, however, amplified poorly in both samples (something we encountered in frequently for F5) and apparently only a small number of templates contribute to the sequencing library. The discrete levels of SNP frequencies suggest that the number of templates contributing to F5 is below 10 in both samples 4 and 5.
Figure 9—figure supplement 2
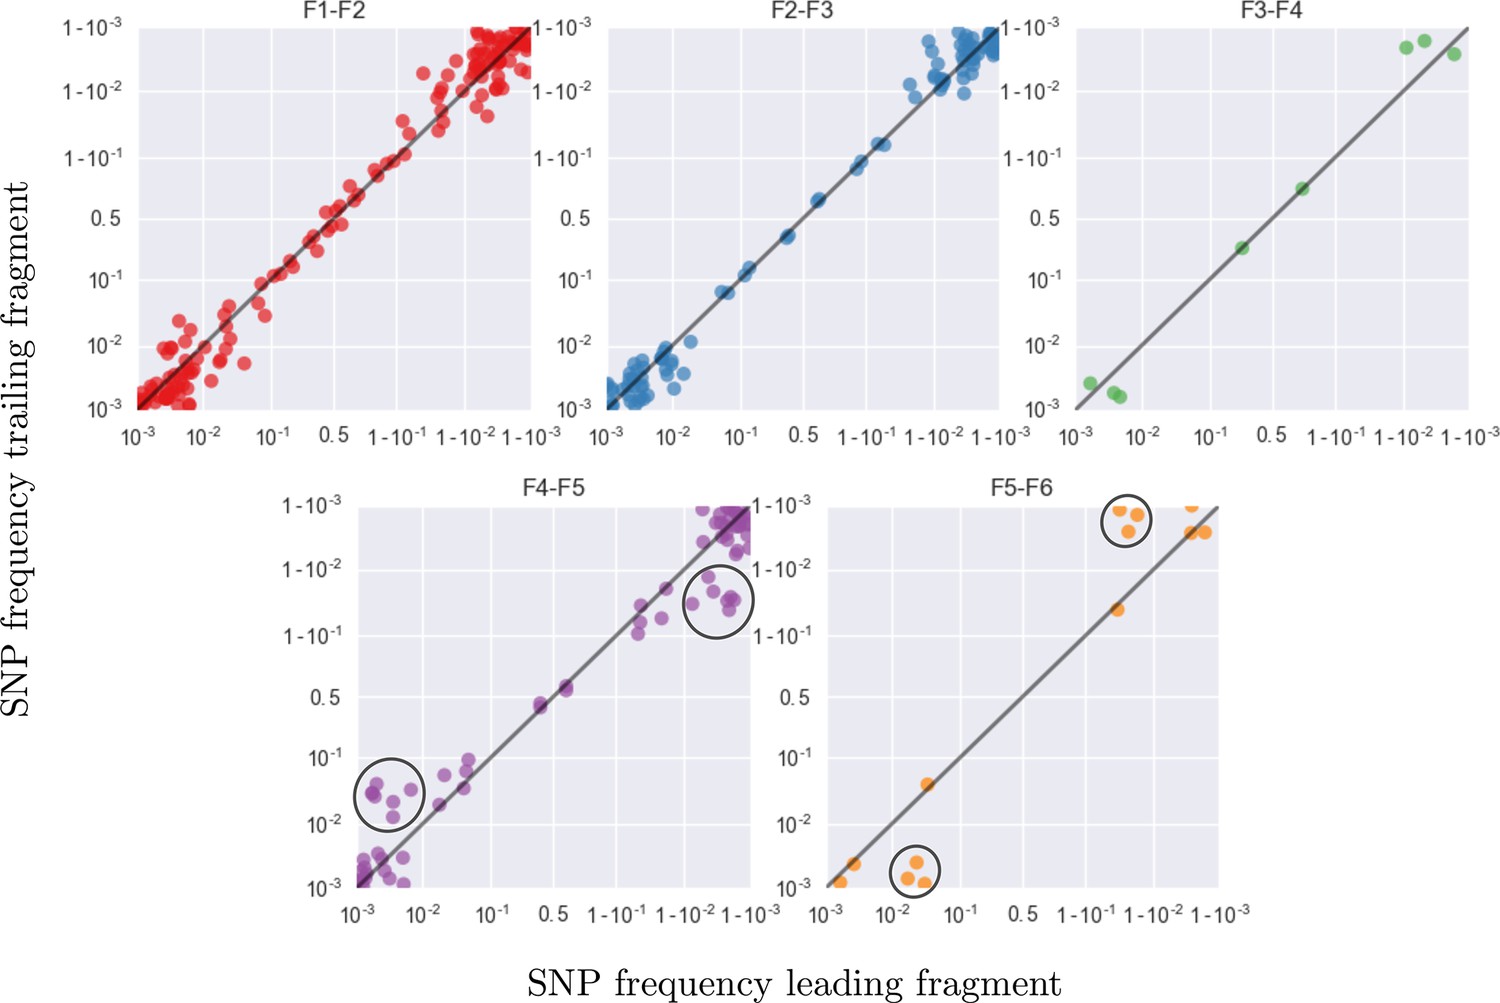
This figure shows the same data as figure 9C, but different overlaps are shown in separate panels.
Most SNP frequencies are reproduced to 1%, except for fragment F5 which typically has less amplified templates. Lower performance in F5 is visible as a flock of points at frequency 0.05 and 0.95 in the vertical coordinate in panel F4–F5 and horizontal coordinate in panel F5–F6, respectively (black circles).
Tables
Table 1
Summary of patient characteristics. Sample times from estimated date of infection.
| Patient | Gender | Transmission route | Subtype | Age* [years] | Fiebig stage* | BED* [ODn] | No. of samples | First sample [days] | Last sample [years] | HLA type | ||
| A | B | C | ||||||||||
| p1 | F | HET | 01_AE | 37 | VI | 0.42 | 12 | 122 | 8.2 | 02/02 | 08/15 | 03/06 |
| p2 | M | MSM | B | 32 | V | 0.17 | 6 | 74 | 5.5 | 01/24 | 08/39 | 07/12 |
| p3 | M | MSM | B | 52 | VI | 0.90 | 10 | 146 | 8.4 | 02/11 | 15/44 | 03/16 |
| p5 | M | MSM | B | 38 | VI | 0.15 | 7 | 134 | 5.9 | 03/33 | 14/58 | 03/08 |
| p6 | M | HET | C | 31 | IV | 0.29 | 7 | 62 | 7.0 | 02/02 | 44/51 | 05/16 |
| p8 | M | MSM | B | 35 | V | 0.16 | 7 | 87 | 6.0 | 03/32 | 07/40 | 02/07 |
| p9 | M | MSM | B | 32 | VI | 0.28 | 8 | 106 | 8.1 | 25/32 | 07/44 | 04/07 |
| p10 | M | MSM | B | 34 | II | 0.10 | 9 | 33 | 6.2 | 32/32 | 44/50 | 06/16 |
| p11 | M | MSM | B | 53 | VI | 1.22 | 7 | 209 | 5.6 | 02/32 | 39/44 | 05/12 |
-
*, at base line; MSM, men who have sex with men; HET, heterosexual; MSM, men who have sex with men.
Additional files
-
Supplementary file 1
Data on viral load, CD4 count, date, and average coverage for all samples sequenced.
- https://doi.org/10.7554/eLife.11282.028
-
Supplementary file 2
Primers used to amplify the HIV-1 genome in six overlapping fragments.
- https://doi.org/10.7554/eLife.11282.029
-
Supplementary file 3
Data used to estimate the date of infection for all study participants.
- https://doi.org/10.7554/eLife.11282.030
Download links
A two-part list of links to download the article, or parts of the article, in various formats.
Downloads (link to download the article as PDF)
Open citations (links to open the citations from this article in various online reference manager services)
Cite this article (links to download the citations from this article in formats compatible with various reference manager tools)
Population genomics of intrapatient HIV-1 evolution
eLife 4:e11282.
https://doi.org/10.7554/eLife.11282


