Sources of noise during accumulation of evidence in unrestrained and voluntarily head-restrained rats
- Princeton University, United States
- New York University Shanghai, China
Figures
Figure 1 with 2 supplements
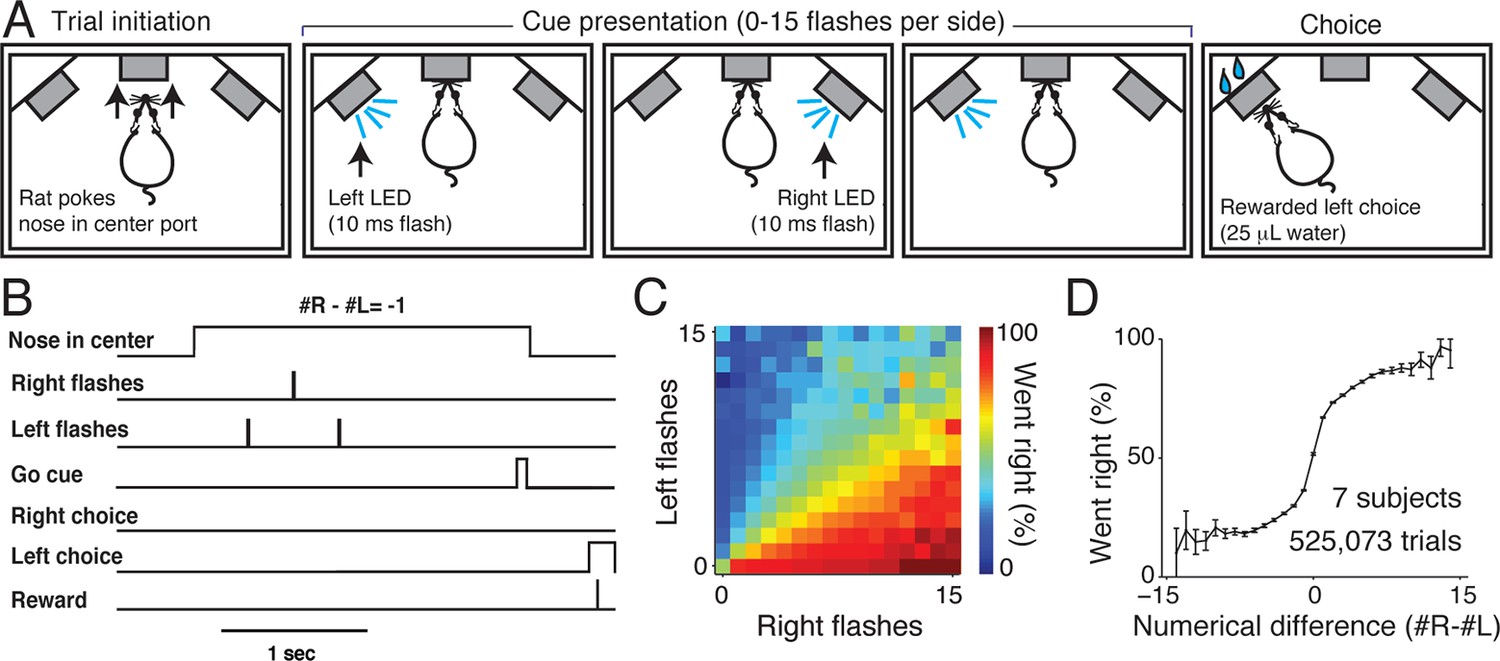
Visual accumulation of evidence task, unrestrained version.
(A) Task schematic. A rat initiates a behavioral trial by inserting his nose into a center port along one wall of an operant training box (left panel). The rat is presented with a series of pseudo-randomly timed flashes from LEDs presented from the left and right side ports (middle panels). Following cue presentation and a variable delay period (see Materials and methods: Stimulus Generation), the subject makes a behavioral report by poking his nose to one of the side ports (right panel). Water reward (25 μL) was baited on the side that had the greater number of flashes. (B) Timing of task events in an example trial. Rat was presented with two left flashes and one right flash and correctly oriented to the left side poke after an auditory cue. (C) Behavioral performance of data pooled from all unrestrained rats across the set of all stimuli. Color indicates the percentage of trials in which the subjects chose the right sideport. (D) Psychophysical performance on the accumulation task pooled from all unrestrained rats.
Figure 1—figure supplement 1
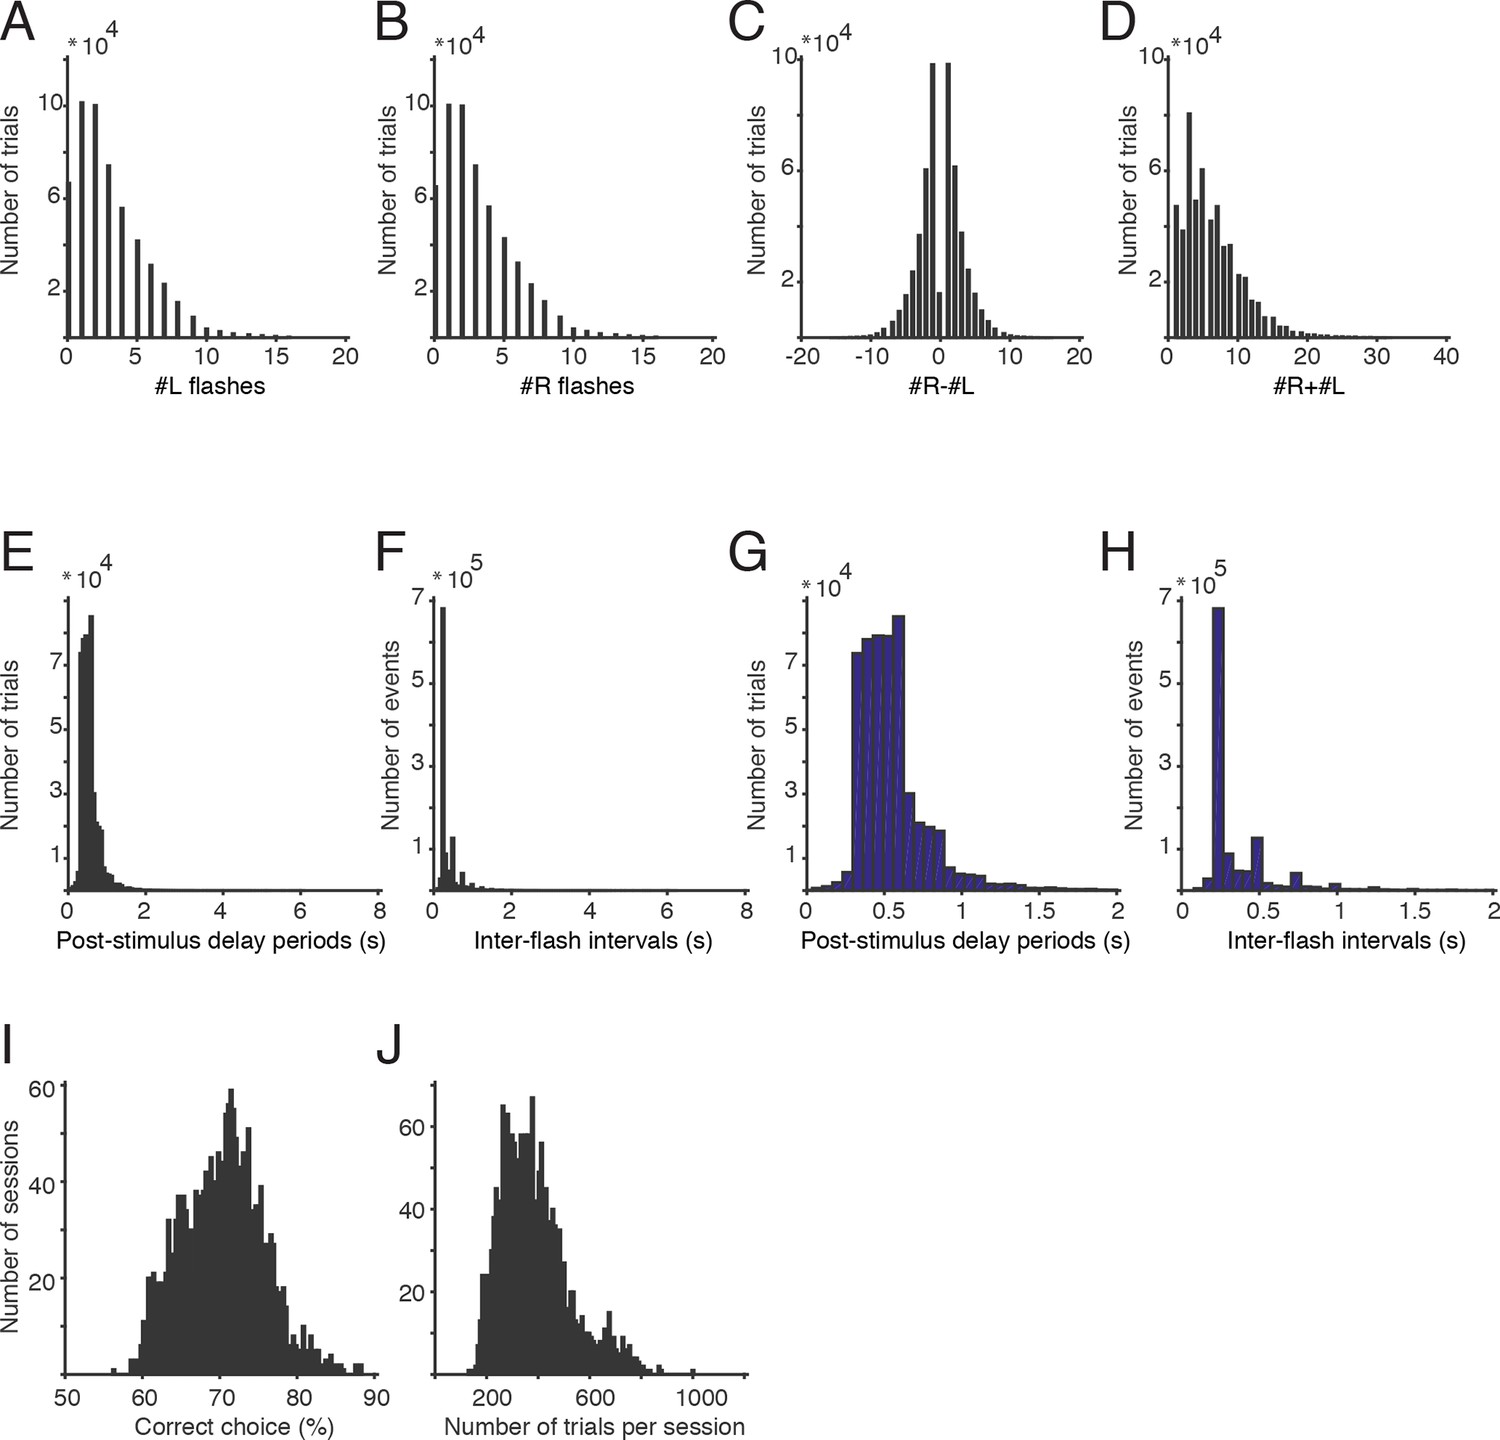
Stimuli and performance.
(A) A histogram of the number of left flashes presented on all trials included in this paper (data is pooled across all unrestrained rats). (B) Histogram of the number of right flashes presented on all trials. (C) Histogram of the difference in flash number on all trials. (D) Histogram of the total number of flashes presented on each trial. (E) Histogram of post-stimulus delay durations (seconds). Delay durations on some trials were greater than 6 s, but those represented a small portion of the dataset. (F) Distribution of inter-flash intervals (seconds). (G) The distribution of delay durations from panel E, replotted from 0–2 s. (H) The distribution of inter-flash intervals from panel F, replotted from 0–2 s. (I) Percent correct for each of the 1956 behavioral sessions included in this paper. All sessions with more than 100 trials in the final training stage were included. (J) Number of trials completed for all behavioral sessions included in this paper.
Figure 1—figure supplement 2
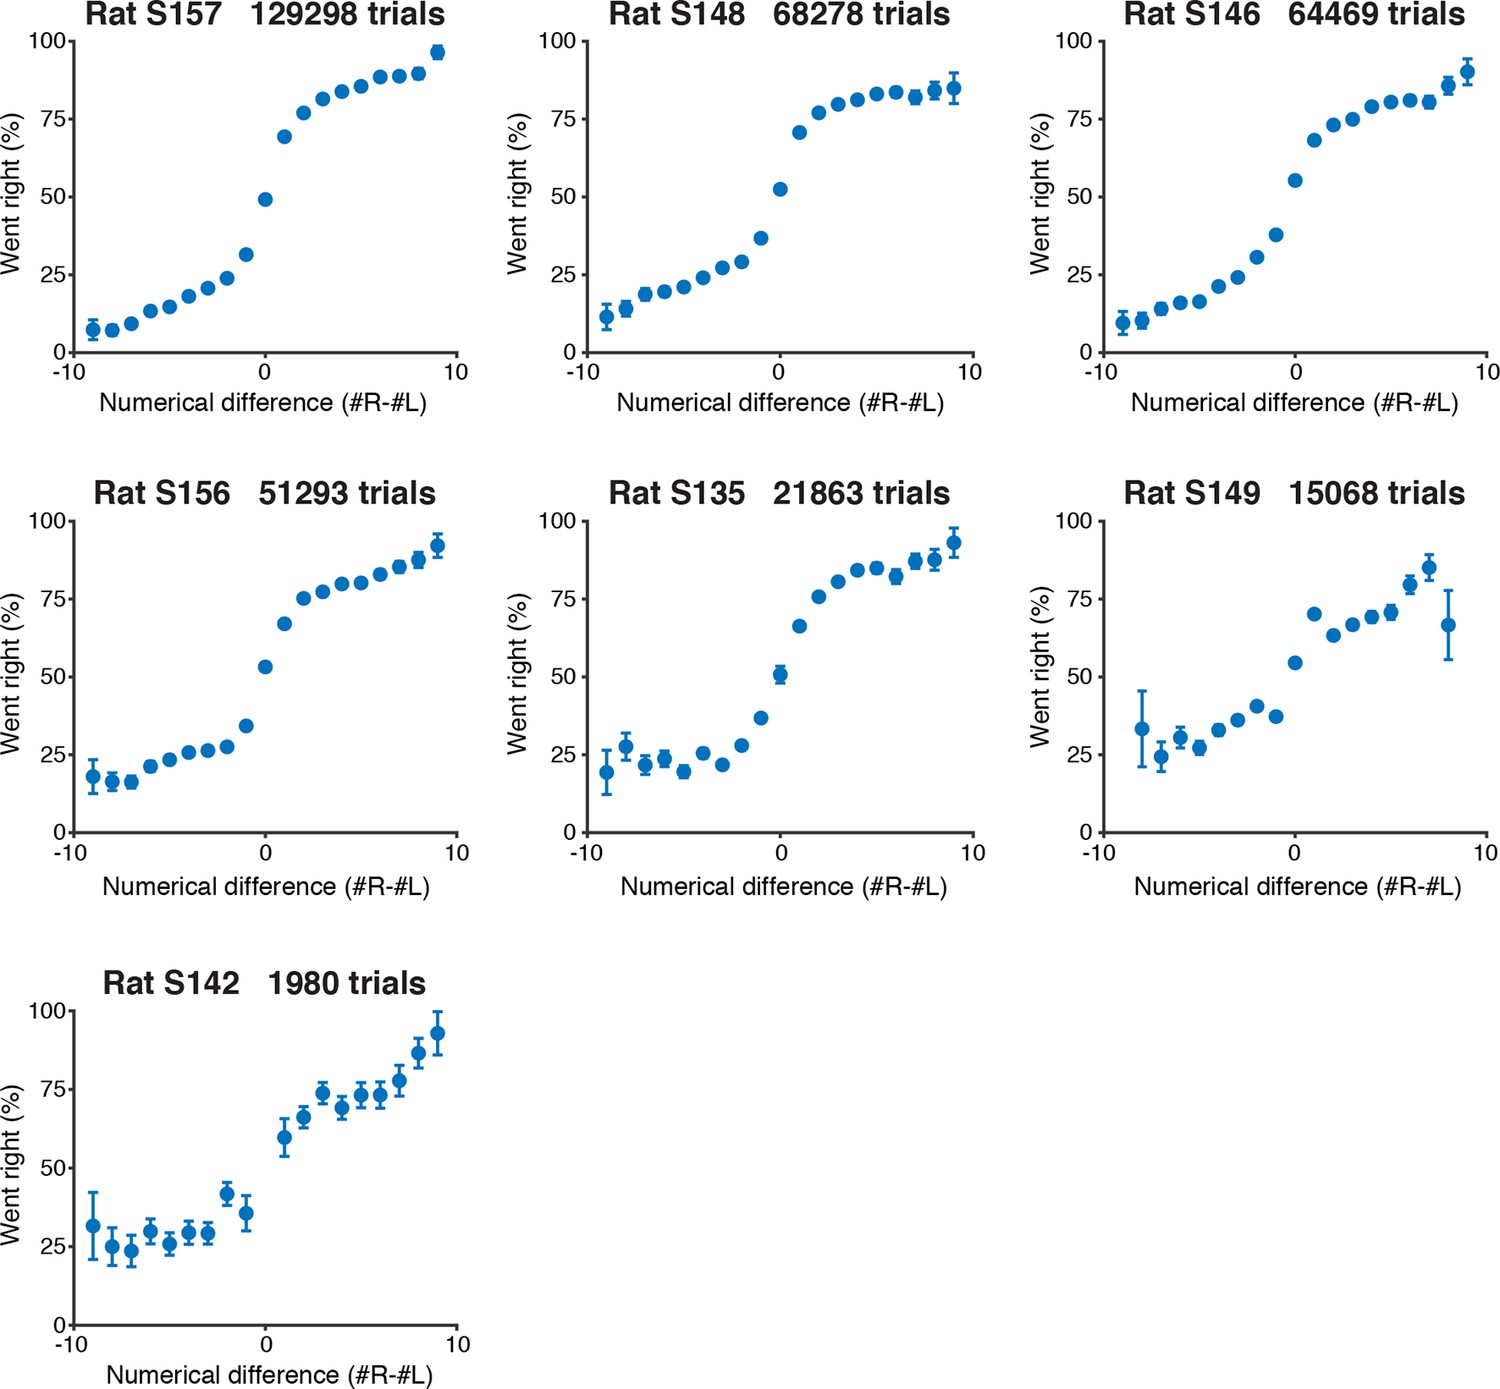
Psychometric performance of individual rats on the visual accumulation of evidence task.
Behavioral performance of each rat included in this study, including trials with up to 10 flashes on each side. Rats are sorted by number of behavioral trials included in each plot.
Figure 2 with 4 supplements
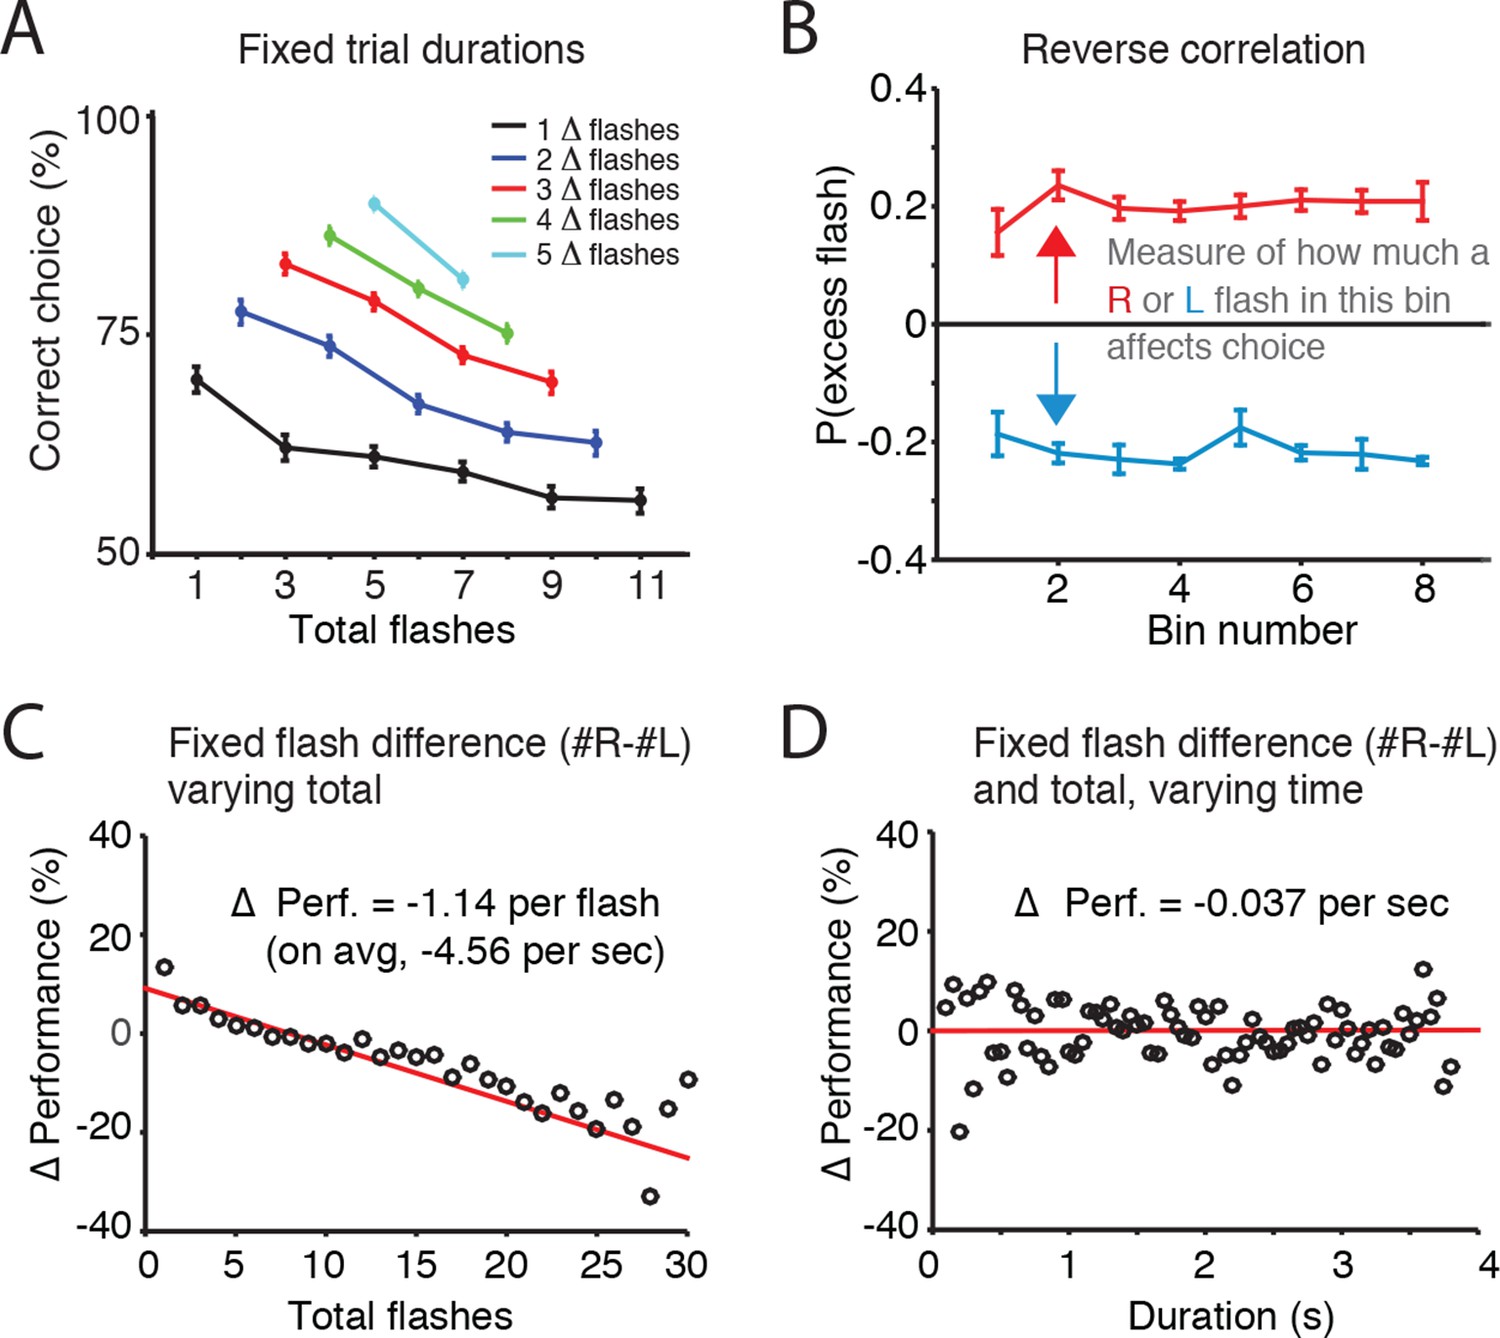
Error rate increases with number of flashes, not trial duration.
(A) For trials of fixed duration and fixed difference in number of flashes (Δ-flashes, colored lines), behavioral performance decreased with more flashes. (B) Reverse correlation analysis indicating the relative contribution of flashes occurring at different times in the trial to the subject’s behavioral choice. Each point on the upper line represents the probability that on trials in which the subject poked to the right, there was an extra right flash in each time bin. The lower lines represent the same analysis for trials in which the subject poked left. The flatness of the lines suggests that rats use early, middle and late flashes equally to guide their decision. Lines and error bars represent mean and standard error across rats. This result suggests a long time constant of accumulation. (C) Changes in behavioral performance (% correct) as a function of the number of total flashes presented. Data points indicate behavioral performance relative to the average performance (Δ Performance) across trials with identical differences in flash number (|#R-#L| = ΔF) but with varied total flash number (#R+#L=F). Red lines are regression lines to those points, weighted by the number of behavioral trials contributing to each point. (D) Changes in behavioral performance as a function of the trial duration. Performance across all delay durations was computed for each unique combination of total number of flashes and difference in the number of flashes. For each unique combination of flash number and difference, performance relative to that average performance (Δ Performance) was computed for different trial durations binned in 50 ms bins (black circles). Red lines are regression lines to those points, weighted by the number of behavioral trials contributing to each point.
Figure 2—figure supplement 1
Fits of drift diffusion-like model to individual rats.
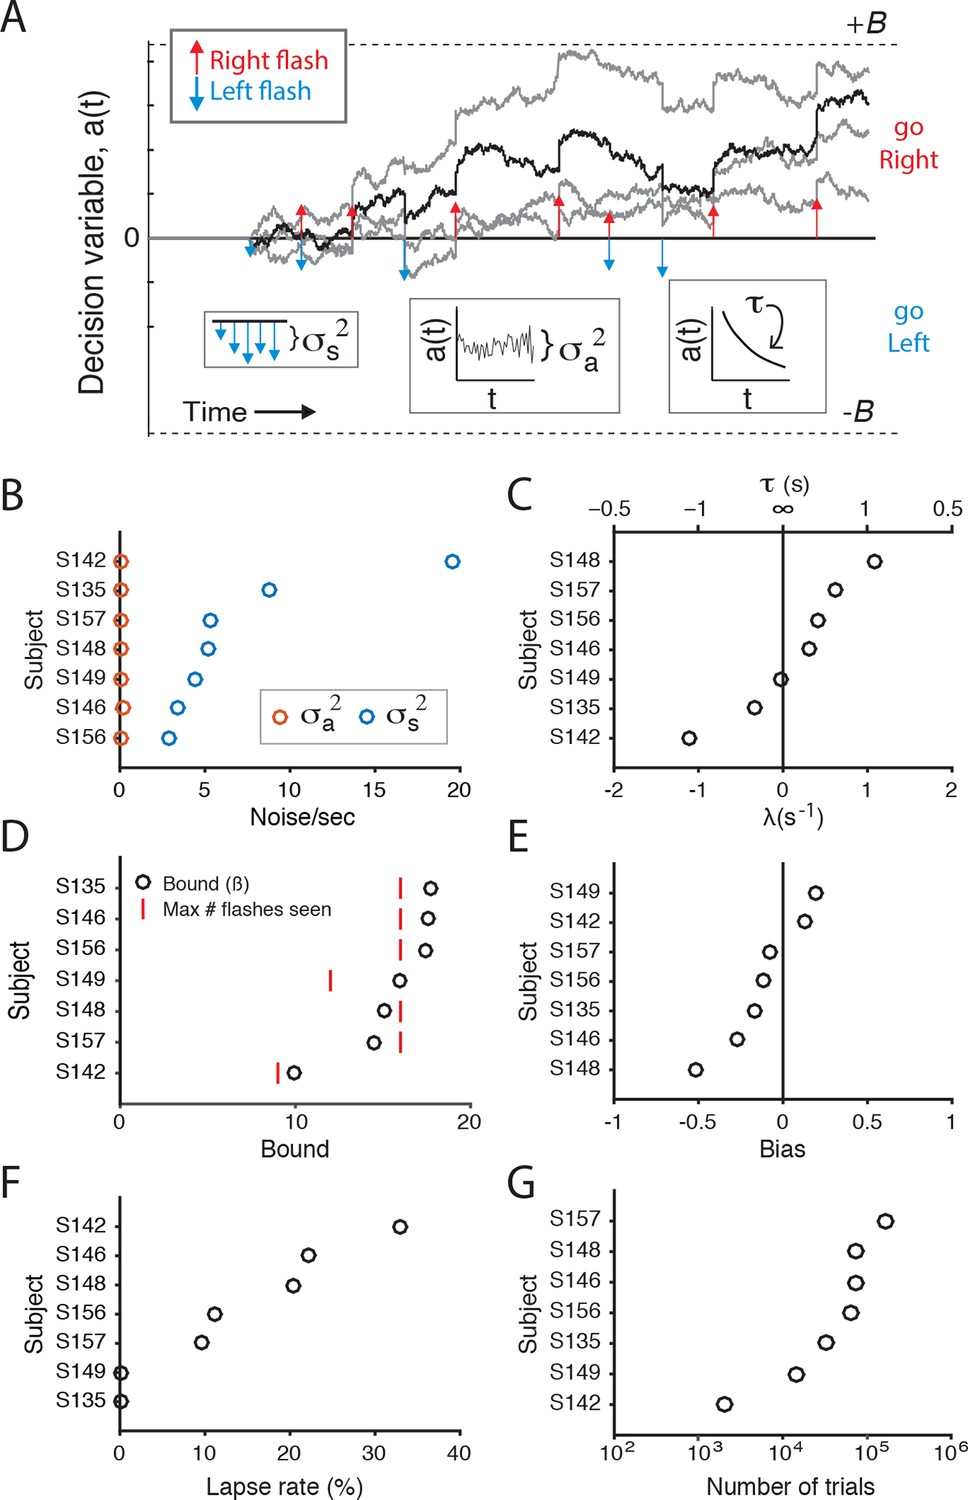
(A) Schematic of the accumulation model of Brunton et al. (2013) used here to compare the contribution of flash- and time-associated noise to behavioral variability. At each moment in time the model represents the accumulated evidence as a decision variable, a(t)(black line). Colored arrows indicate the timing of left (blue) and right (red) flashes. σs2 parameterizes the noise added with each flash, σa2 parameterizes the noise added at each time point, τ (or 1/λ) parameterizes the memory time constant of a(t). λ<0 suggests that the memory decays to a = 0 with time, λ>0 suggests that the magnitude of a(t) increases over time. B parameterizes sticky bounds: if a(t) ever reaches +/-B, integration stops and the animal is committed to that decision (go right/go left, respectively). There are a few other terms in the model that are not represented in the schematic. A bias term represents an offset of a(t) at the beginning of each trial. A lapse rate parameterizes the percent of trials on which the animal behaves randomly. φ and τφ parameterize sensory adaptation dynamics. After a flash, φ is a constant that scales the effect of the flash; it recovers to an unadapted/facilitated magnitude with time constant τφ. φ >1 indicates that successive flashes facilitate; φ <1 indicates that they depress. Fits to those parameters are not shown here, because we found that the inter-flash-intervals presented here were sufficiently long to minimize any adaptation/facilitation effects of subsequent flashes. Light gray lines indicate alternative runs of the model on the same trial. (B) Model fits of flash-associated noise (σs2; blue circles) and noise associated with time (σa2; red circles). To evaluate these parameters in comparable units, σs2 was divided by the average number of flashes per second for each rat. For each subject, noise associated with time (σa2) is close to zero, whereas noise correlated with flashes (σs2) is predominant, consistent with previous studies (Brunton et al., 2013; Hanks et al., 2015). (C) The drift in the accumulator’s memory is parameterized by λ. A leaky integrator would have negative values of λ, an impulsive integrator would have positive values. The time constant of the integrator, τ, is 1/λ. For many, but not all, of the rats, the time constant is close to or greater than 2 s ( λ <= 0.5). (D) The bound value for all except two rats is larger than the maximum number of flashes (on one side) that each rat experienced. This suggests that rats accumulated/used all of the flashes to inform their decision. (E) The bias term for the each rat. (F) The lapse rate term for each rat, represented as the percent of trials in which animals behaved randomly. (G) The number of behavioral trials that were used to fit the model parameters for each rat, represented on a logarithmic scale.
Figure 2—figure supplement 2
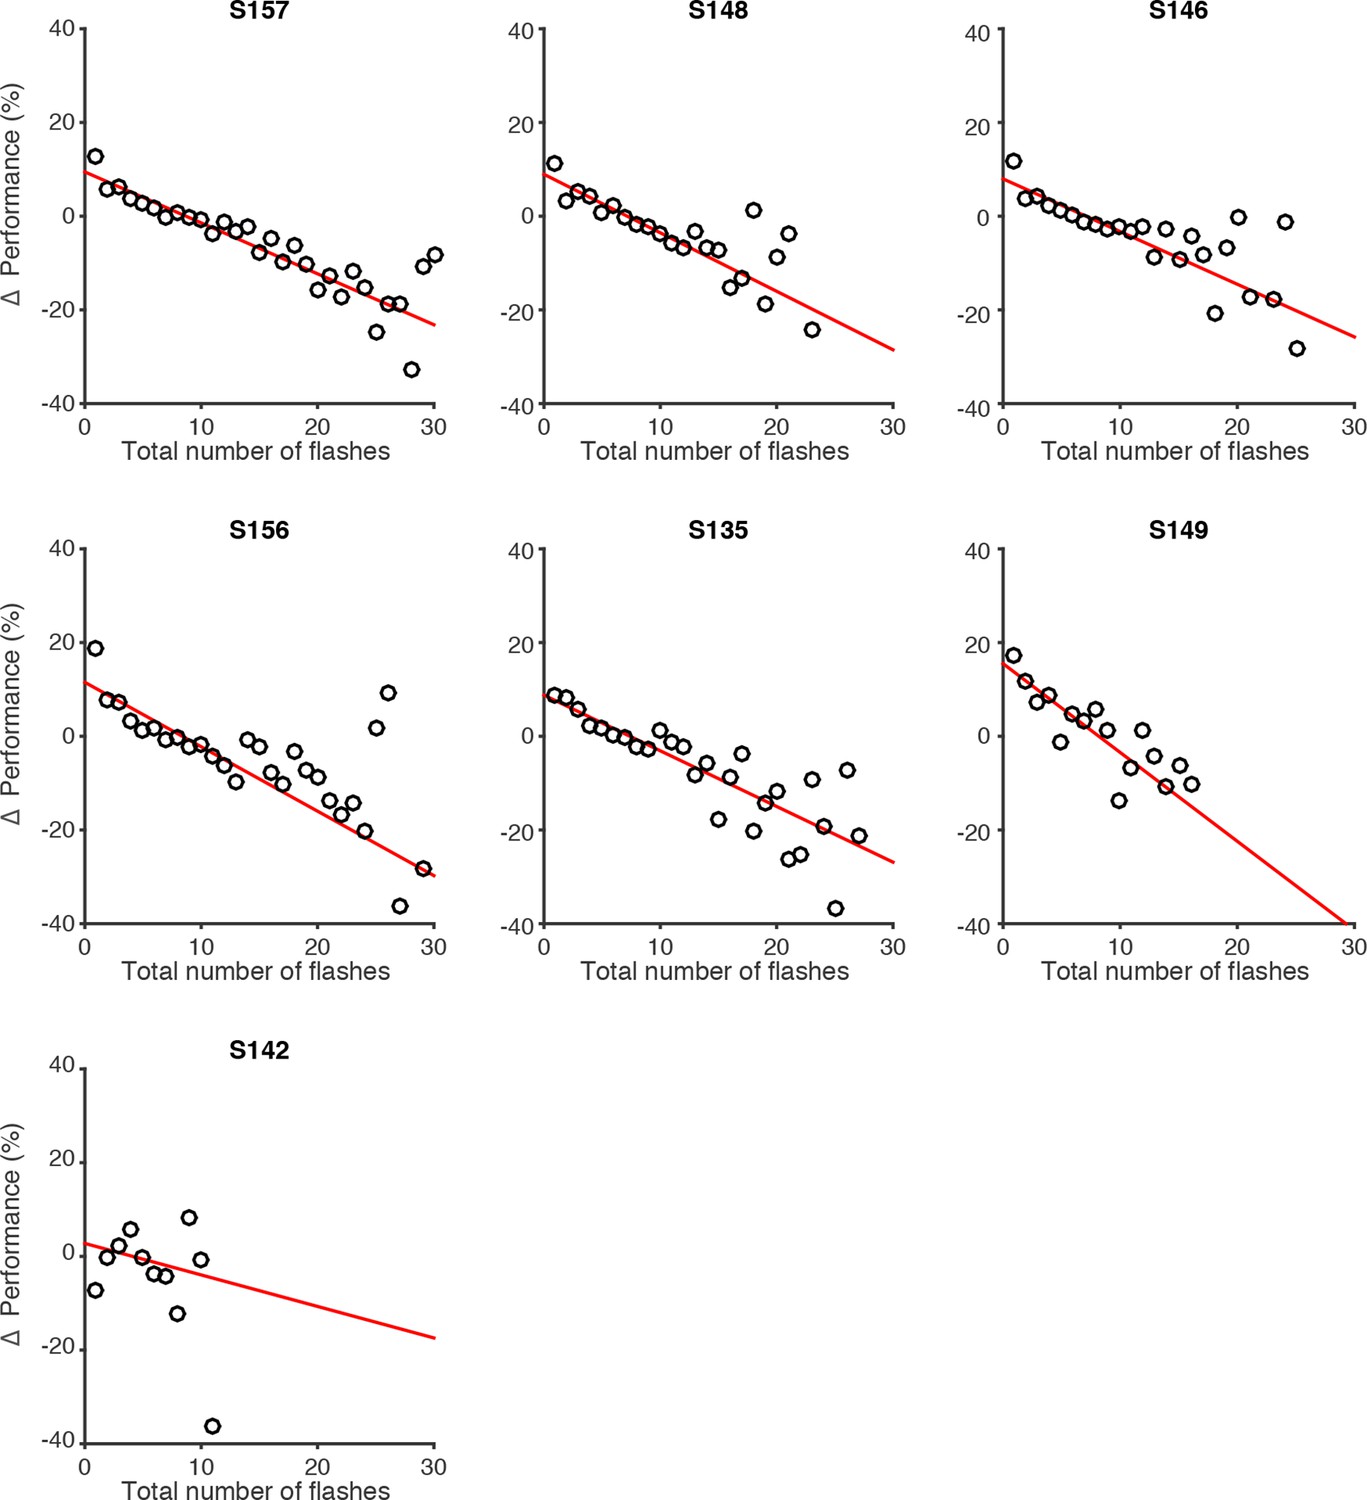
Effect of flash number on performance of individual rats.
Changes in behavioral performance (% correct) for each rat as a function of the number of total flashes presented. Data points indicate behavioral performance relative to the average performance (Δ Performance) across trials with identical differences in flash number but with varied total flash number. Red lines are regression lines to those points, weighted by the number of behavioral trials contributing to each point.
Figure 2—figure supplement 3

Effect of trial duration on performance of individual rats.
Changes in behavioral performance (% correct) for each rat as a function of trial duration. Δ Performance was computed by estimating the average performance (% correct) across all trials with a unique combination of #R-#L and #R+#L, regardless of trial duration. Then, for each unique combination of flash number and difference, performance relative to the average performance in that condition (Δ Performance) was computed for different delay durations, binned in 50 ms bins (black circles). Red lines are regression lines to those points, weighted by the number of behavioral trials contributing to each point.
Figure 2—figure supplement 4
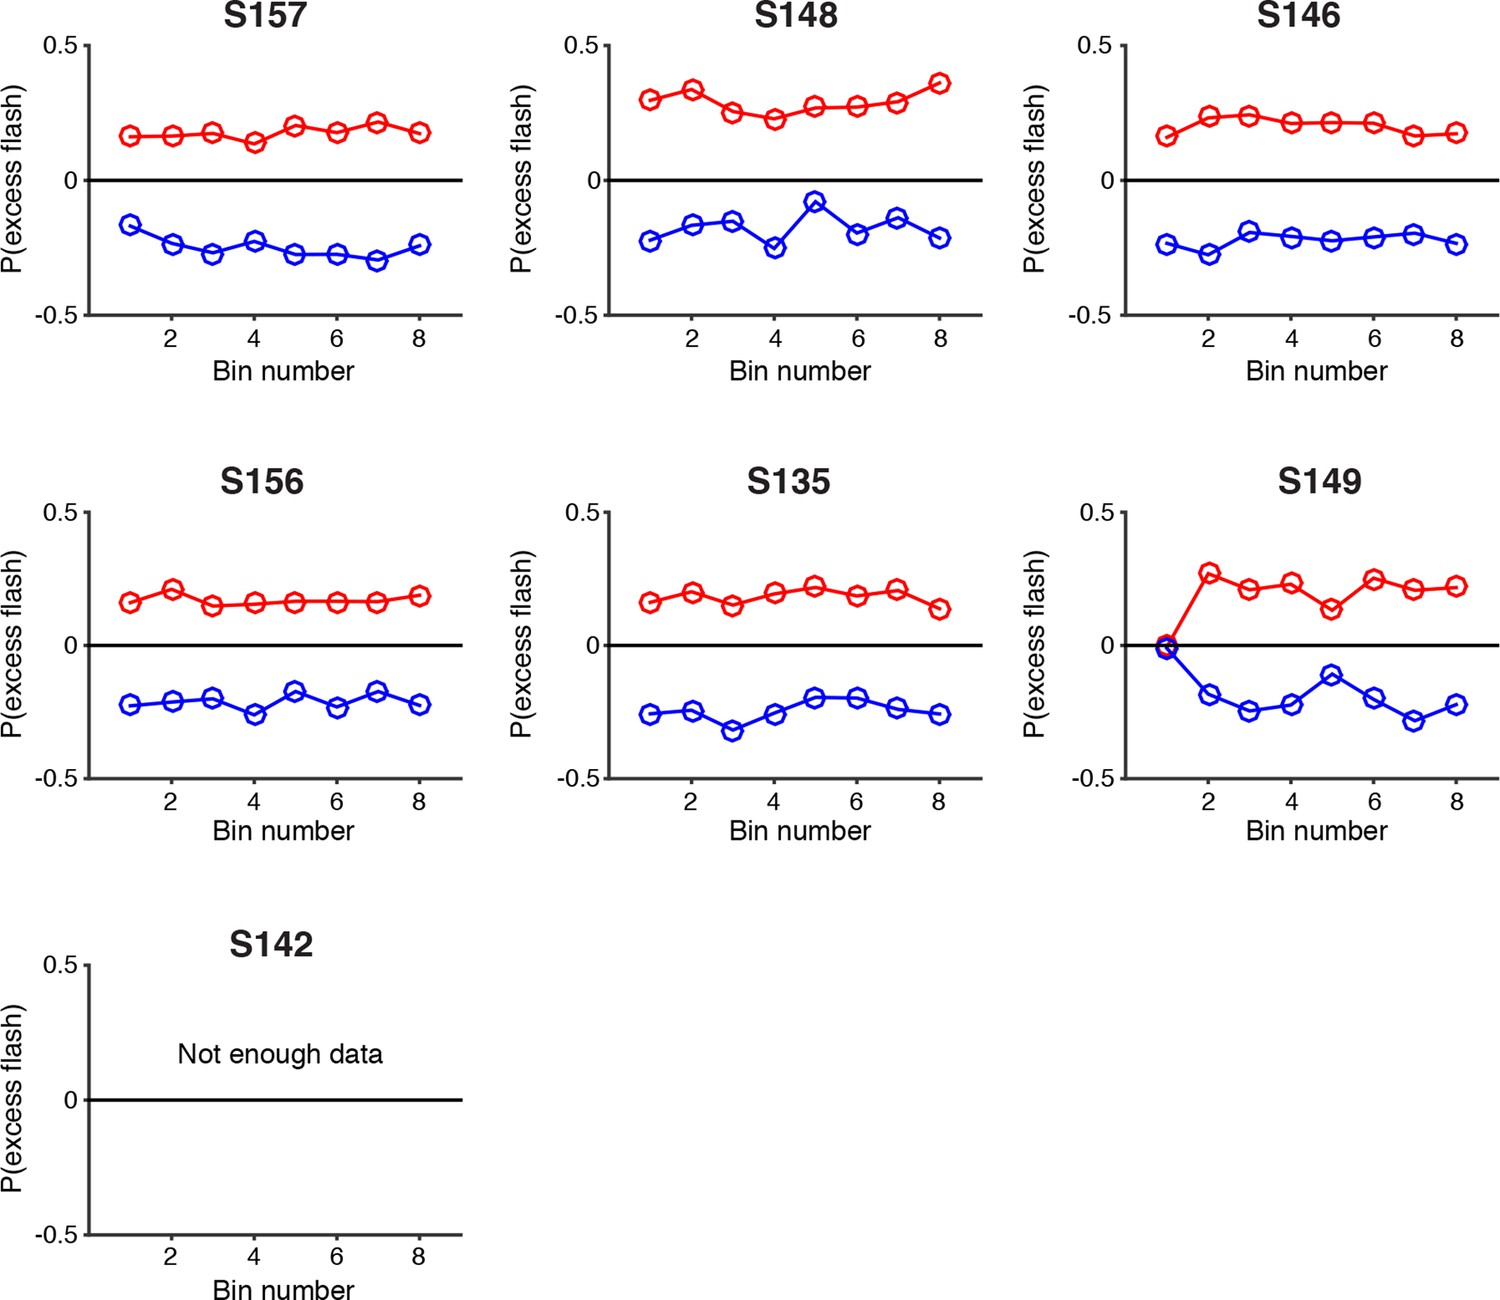
Psychophysical reverse correlation for each individual rat.
Reverse correlation analysis indicating the relative contribution of flashes occurring at different times in the trial to the subject’s behavioral choice. Each point on the upper (red) lines represents the probability that on trials in which the subject poked to the right, there was an extra right flash in each time bin. The lower (blue) lines represent the same analysis for trials in which the subject poked left. The flatness of the lines for all rats suggests that they use evidence from early, middle and late flashes equally to guide their decision. S142 did not have enough trials with 8 time bins to be included in this analysis. These results suggest time constants of accumulation that are longer than the duration of the trial.
Figure 3 with 7 supplements
Signal detection theory-based model reveals linear scaling of standard deviation of numerical estimates.
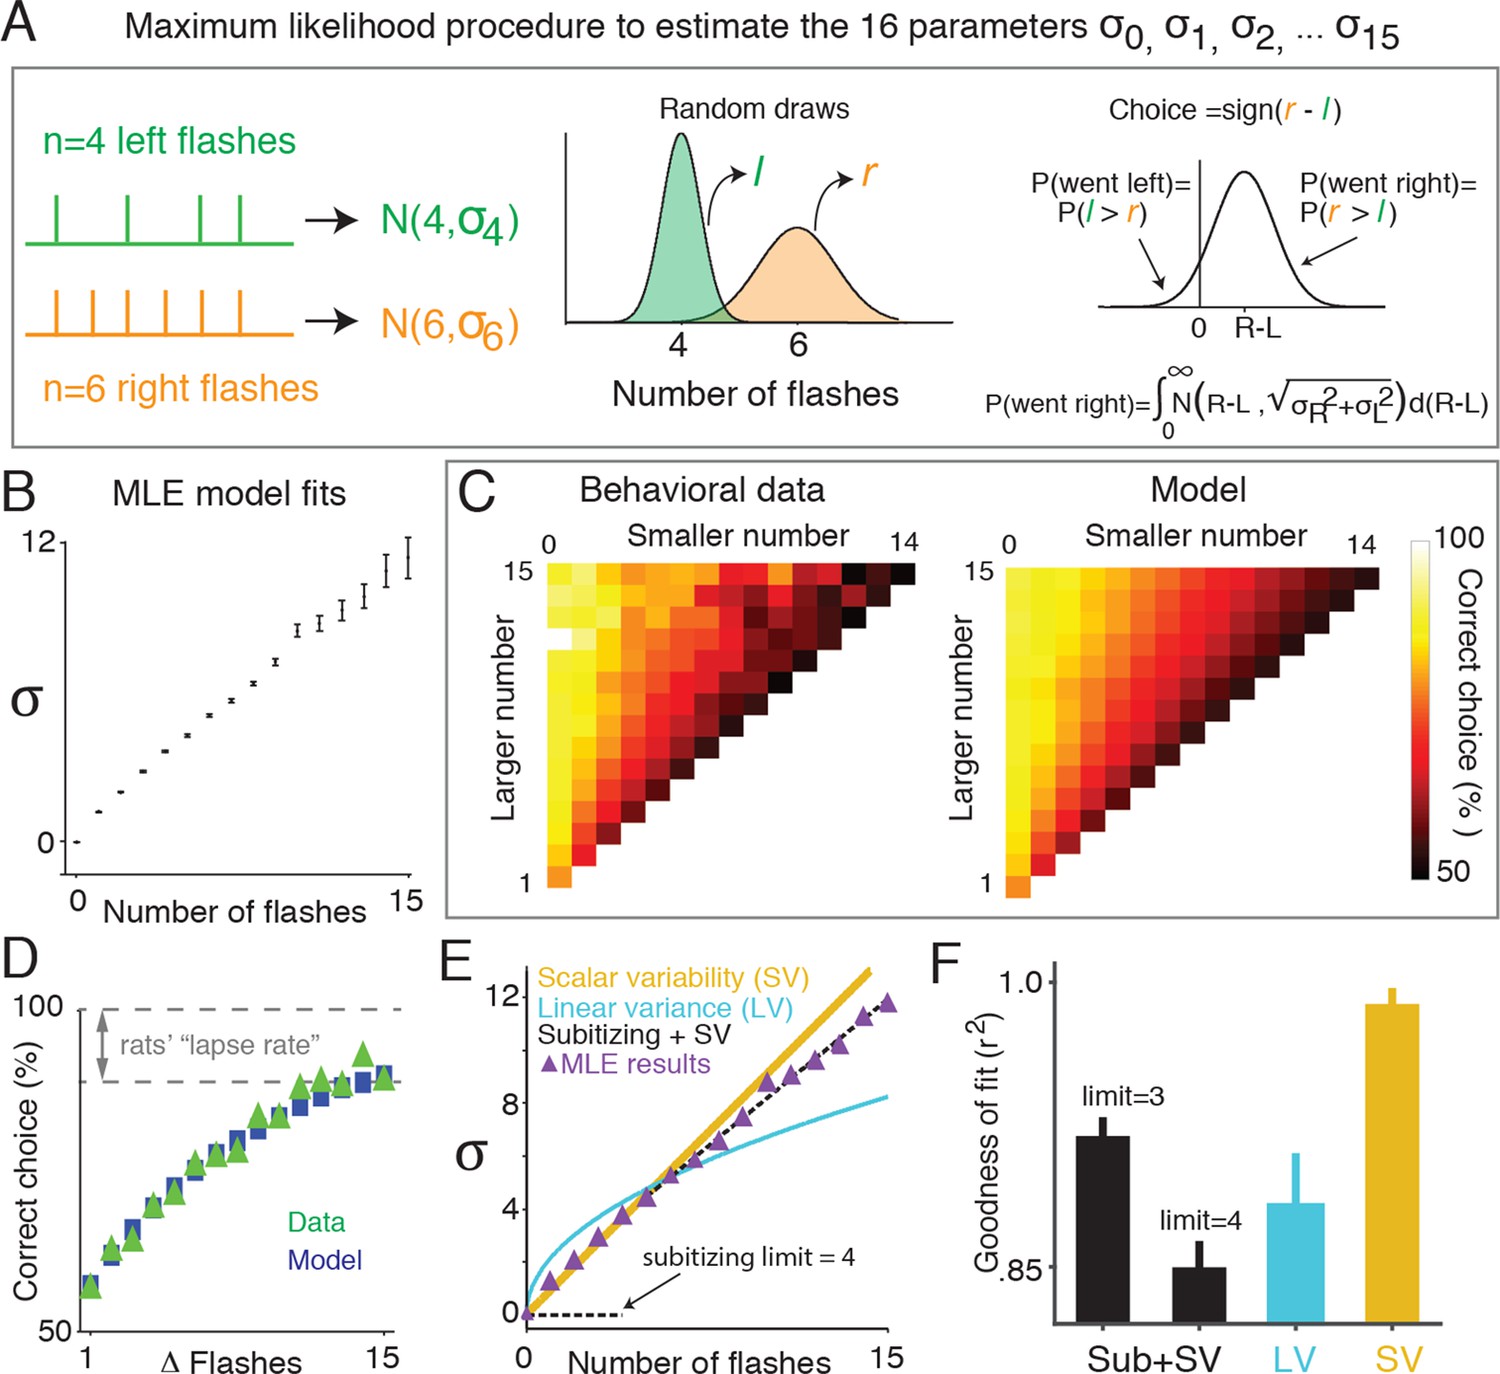
(A) Schematic of the model used to determine the standard deviation (σ) of the subjects’ estimate of flash number. Left panel indicates the stimuli from an example trial in which four flashes were presented to the left side (green) and six flashes were presented to the right (orange). The model assumes that on any given trial, a subjects’ estimate of flash number on each side is a continuous random variable drawn from a Gaussian distribution whose mean is the number of flashes on that side (n), and whose variance is a free parameter () (middle panel). The choice on each trial is determined by comparing these two random variables. Errors occur when the difference of the two random variables (greater magnitude – lesser magnitude) is less than zero. The variance for each Gaussian representing a given flash number ( … ) was fit to the behavioral data (right panel) using maximum likelihood estimation. (B) Model fits of the standard deviations ( …) in the rats’ estimate for different numbers of flashes. Error bars indicate the 95% confidence intervals for the mean based on one thousand-fold resampled data. Note the deviation from pure linear dependence of the parameters on n for n<2. (C) Comparison of the behavioral data (left panel) with the predictions of the model (right panel) based on the values calculated as shown in Figure 3B. Color indicates the percentage of trials on which the subject responded correctly. (D) Comparison of psychometric performance of the rats (data, green triangles) and model prediction of performance (model, blue squares). (E) Three models that predict how the standard deviation (σ) of the numerical estimate scales with the number of flashes. Scalar variability predicts that σ scales linearly with the number of flashes (SV, yellow). Subitizing predicts that σ is zero until a limit (3 or 4), and then follows scalar variability prediction (black dashed). The drift diffusion models predict that the variance of the estimate scales linearly, and σ scales with the square root of the number of flashes (LV, blue). Purple triangles are model estimates of σ, replotted from Figure 3B. Each model was fit using linear regression to the model estimate of σ, weighted by the number of data points contributing to each triangle. Additionally, all models were constrained to intersect with the origin. (F) Goodness of fit of the shown in Figure 3B to subitizing (SUB+SV, black), the drift diffusion model (LV, blue) and scalar variability (SV, yellow) using least squares regression. Analysis indicates that the data is best fit by a scalar variability model. Error bars represent the 95% confidence intervals based on fits derived from a thousand-fold resampling of the data.
Figure 3—figure supplement 1

Signal detection theory-based model fit to individual rats.
Results of fitting the model described in Figure 3 for each rat: model fits of the standard deviations ( …) in each rat’s estimate for different numbers of flashes. Error bars indicate the 95% confidence intervals for the mean based on one thousand-fold resampled data. Red lines are regression lines weighted by the number of behavioral trials contributing to each data point.
Figure 3—figure supplement 2
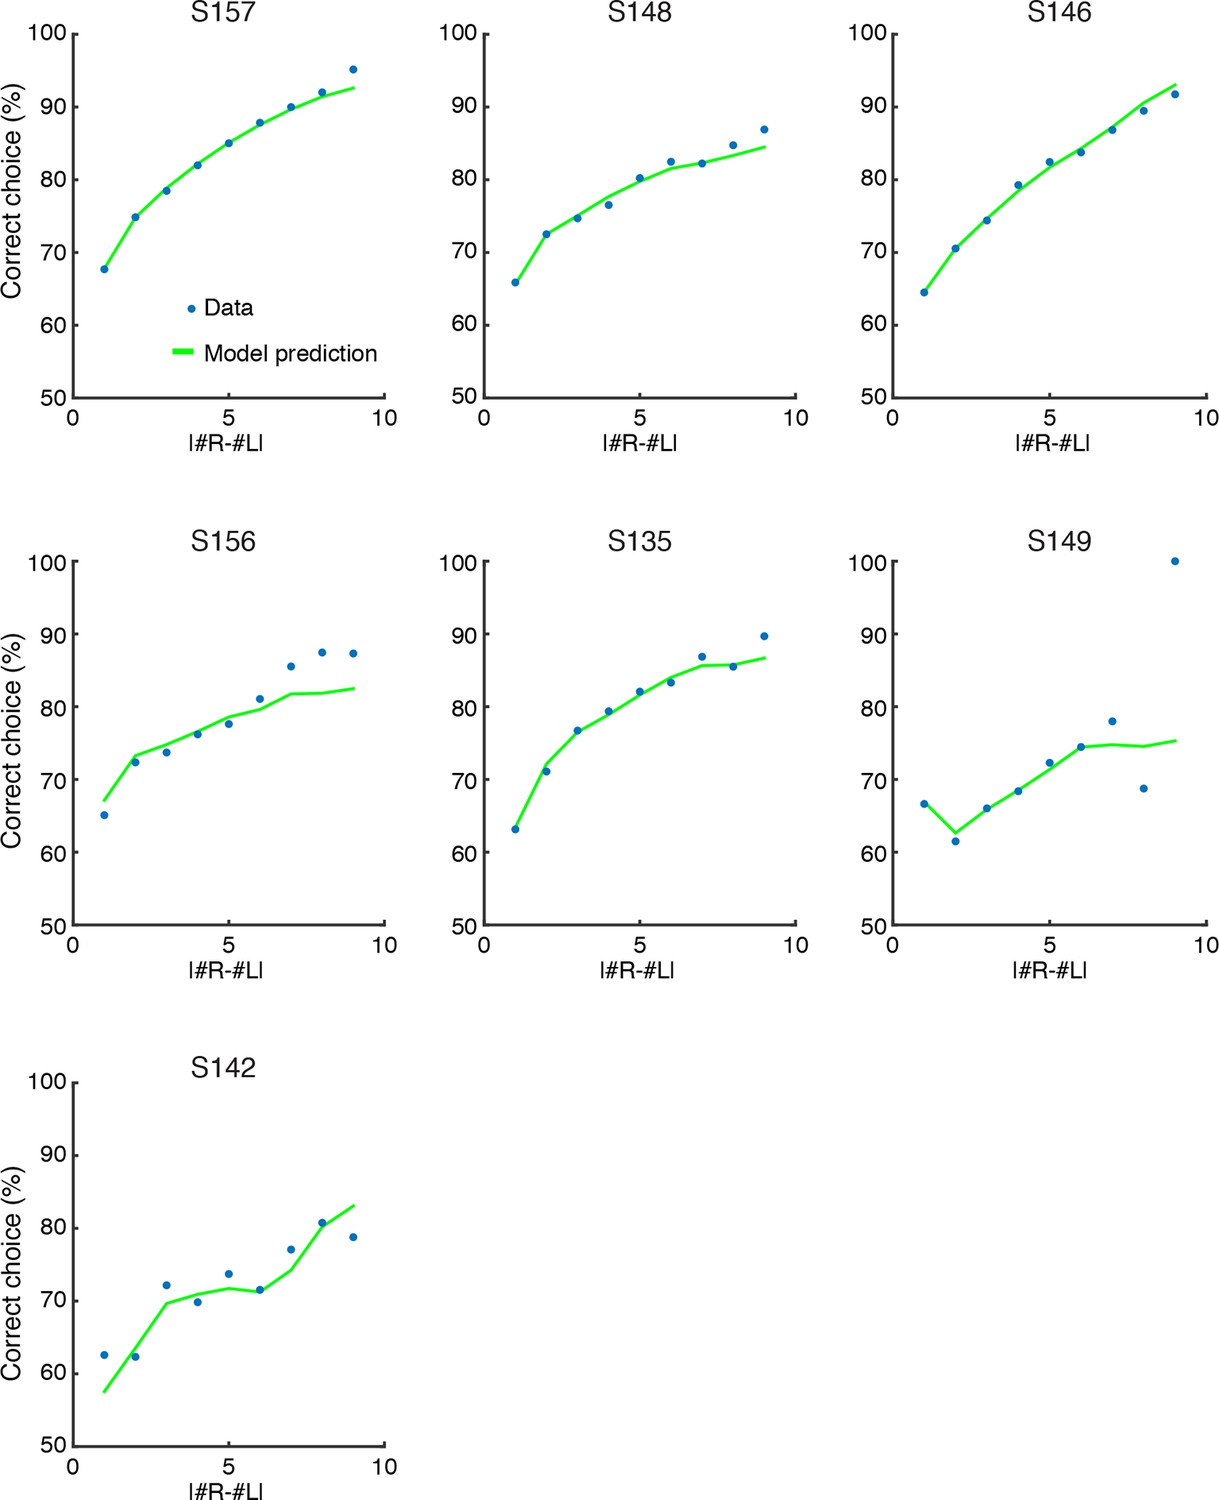
SDT model prediction vs. data for each rat.
Comparison of psychometric performance of each rat (data, blue circles) and the signal detection theory-based model prediction of performance (model, green lines). For each rat, the model recapitulates the behavioral data, including the lapse rate (i.e. imperfect performance on the easiest trials), which was not explicitly parameterized in the model.
Figure 3—figure supplement 3

Behavior and SDT model approximate scalar variability.
Scalar variability (and Weber’s law) predicts that scaling the number of flashes by the same factor would lead to identical discriminability/performance. Here we sought to test that directly. Circles represent behavioral performance (pooled across rats) on trials with different ratios of flashes on the unrewarded (i.e. “low”) and rewarded (i.e. “high”) sides. Error bars are 95% confidence intervals for a binomial distribution. Each color represents a fixed low:high ratio; each point within a color group represents a fixed ratio of low:high flash numbers multiplied by a constant factor. The solid lines represent the signal detection theory model prediction on trials with different low:high ratios. If performance were constant for a fixed ratio of low:high flashes, points within a color group should lie on a horizontal line. The data and model prediction approximate scalar variability, but interestingly, deviate from it for trials with flashes on only one side (purple circles, line).
Figure 3—figure supplement 4
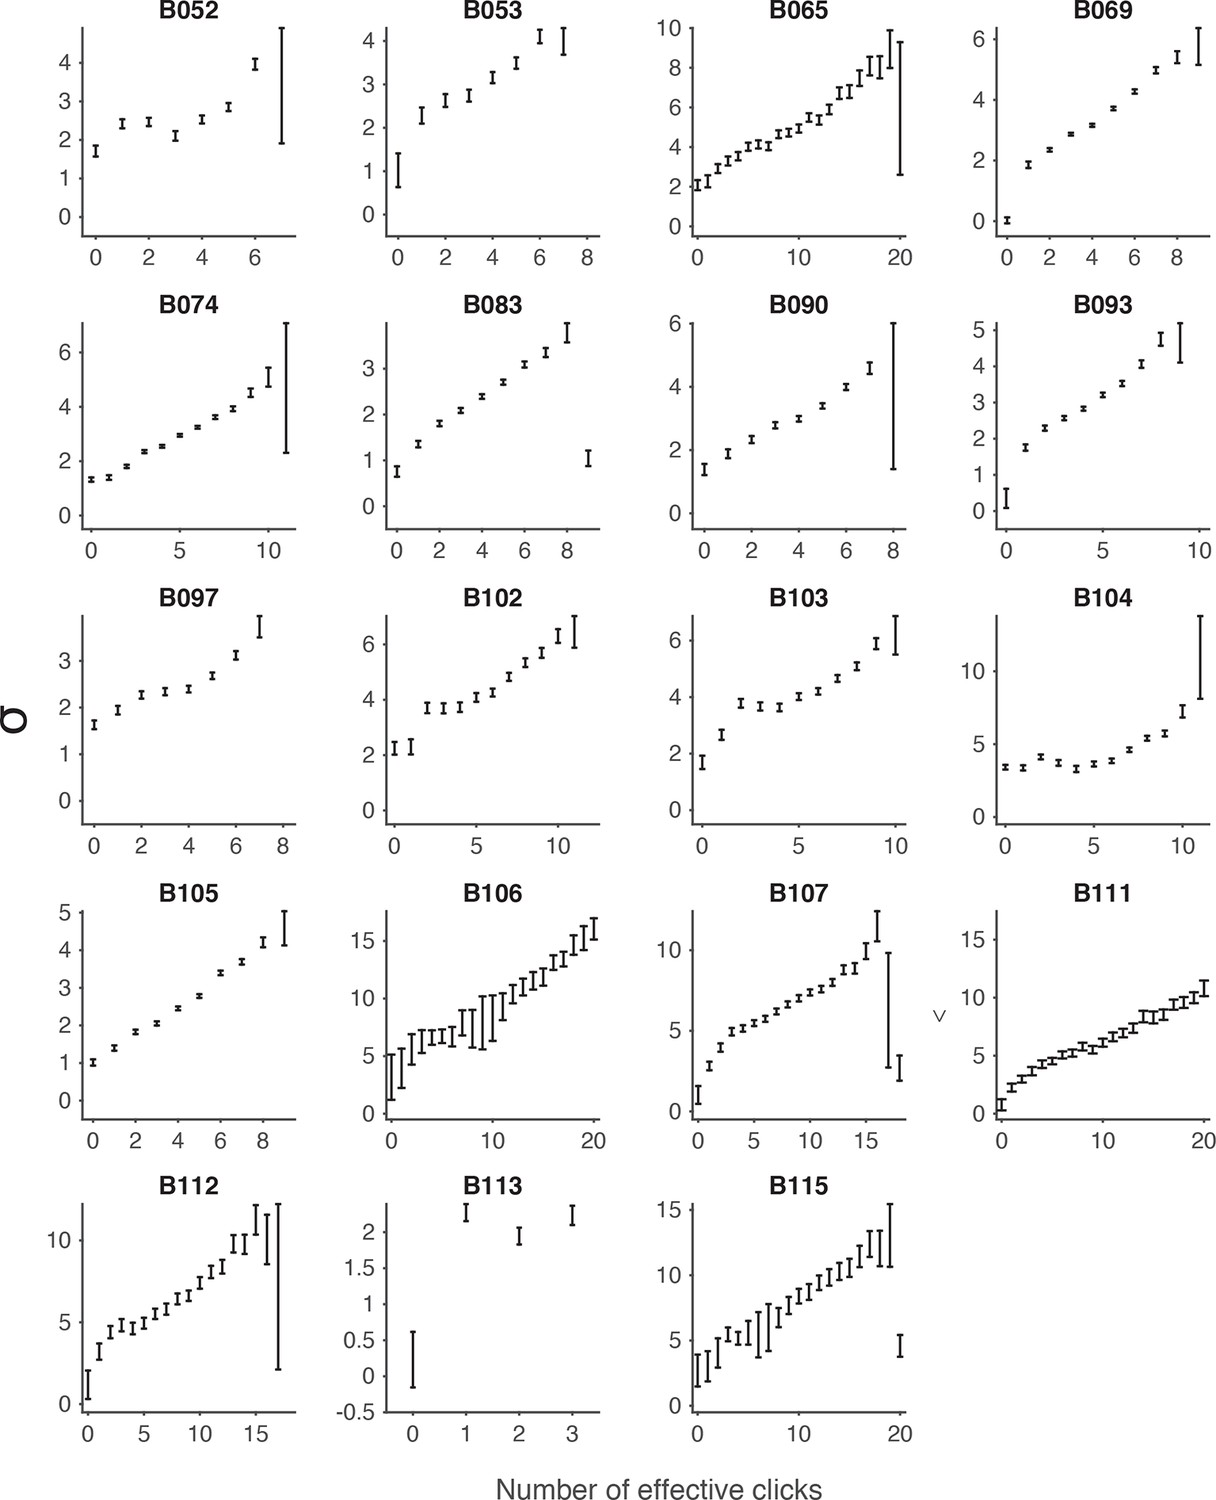
Signal detection theory-based model fit to the auditory (clicks) data.
Each panel shows model fits of the standard deviations (σ) in the rat’s estimate of the effective number of clicks for an individual rat performing the auditory accumulation of evidence task. Error bars indicate the standard deviations of the mean based on repeated calculations of one thousand-fold resampled data. Effective numbers of clicks were estimated based on sensory adaptation parameters (see Materials and methods).
Figure 3—figure supplement 5
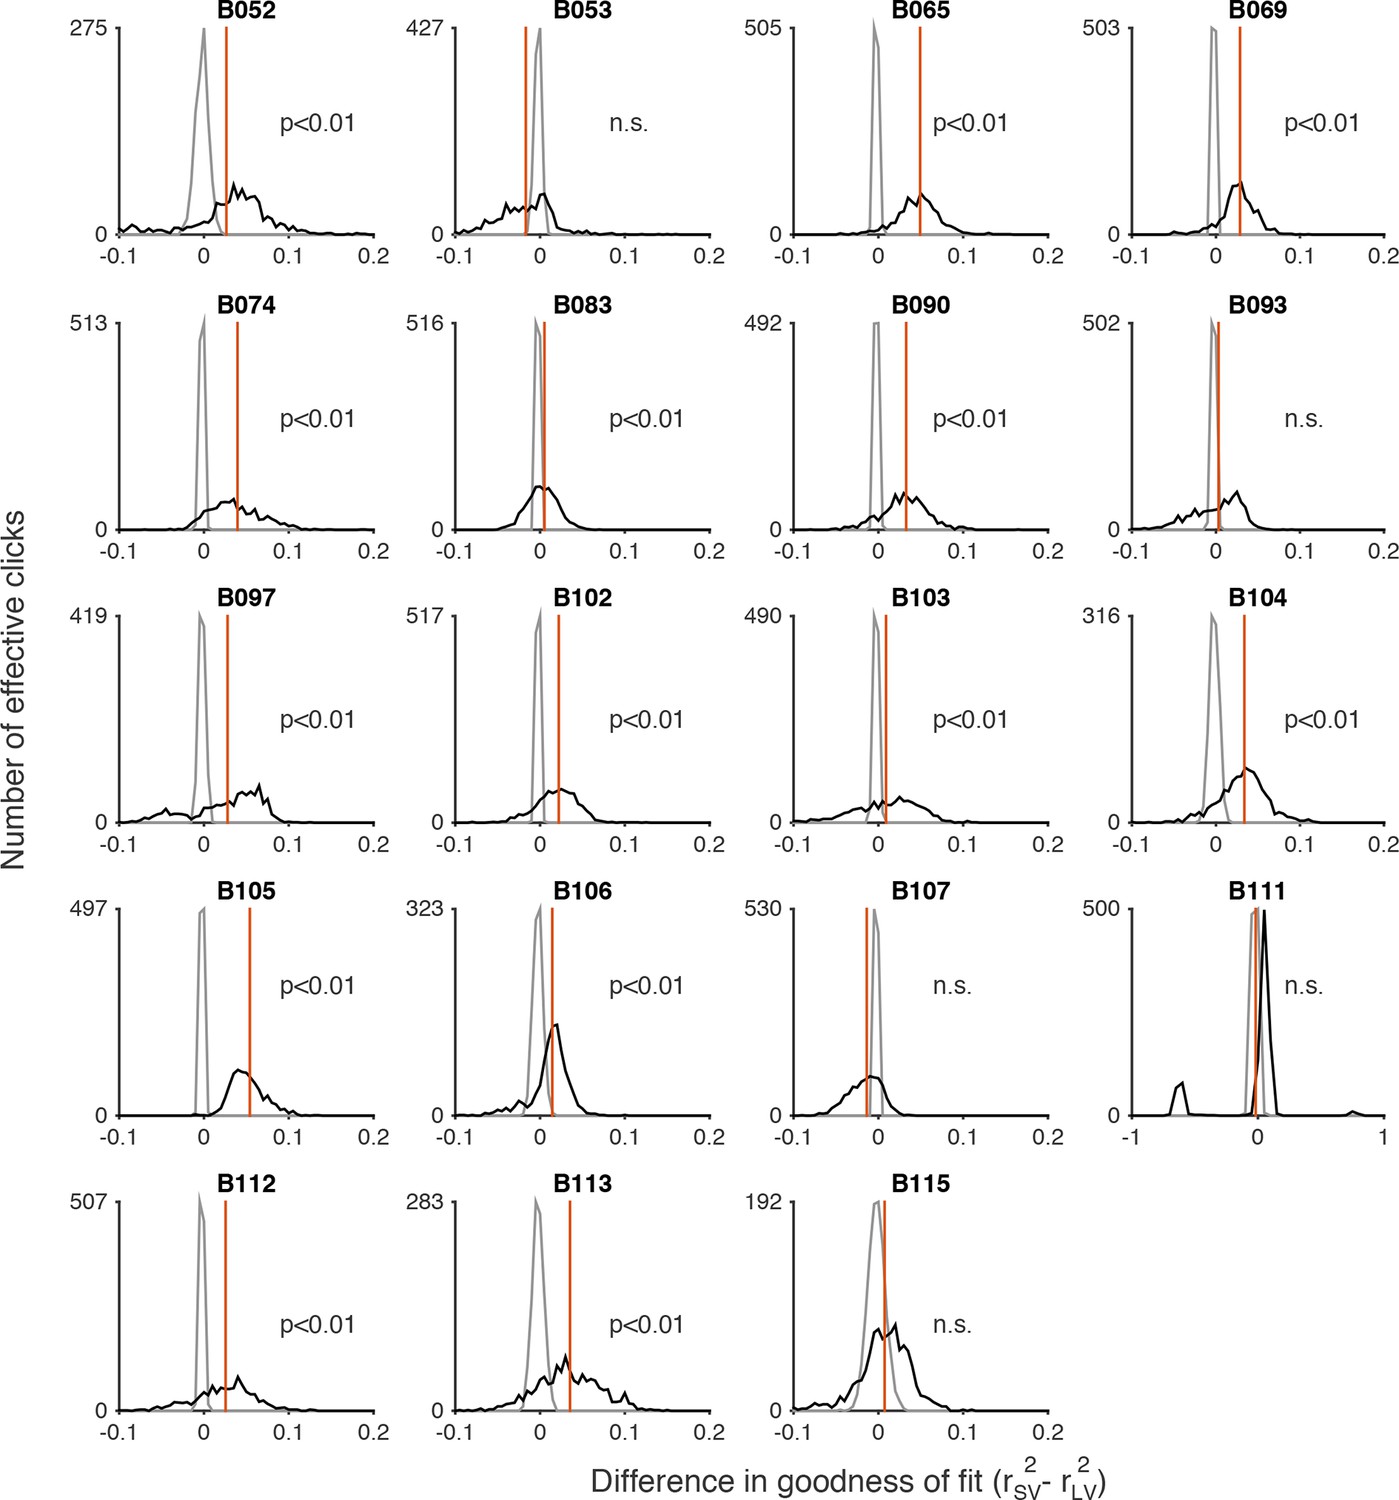
Permutation test comparing goodness-of-fit of scalar variability and linear variance to the auditory (clicks) data.
A nonparametric permutation procedure (see Materials and methods: Model Comparison) was used to evaluate whether the MLE fits of the standard deviations in the rat’s estimate of number of effective clicks (shown in Figure 3—figure supplement 4) were better fit by scalar variability or linear variance. The black line is a histogram of the difference of r2 values for scalar variability (SV) and linear variance (LV) () for a thousand bootstrapped samples. The gray line is a histogram of the null hypothesis distribution for a thousand bootstrapped samples. The red line indicates the p-value for the permutation test: the area under the gray line at the value corresponding to the observed difference in the distribution of r2 values (i.e. the mean of the black distribution).
Figure 3—figure supplement 6
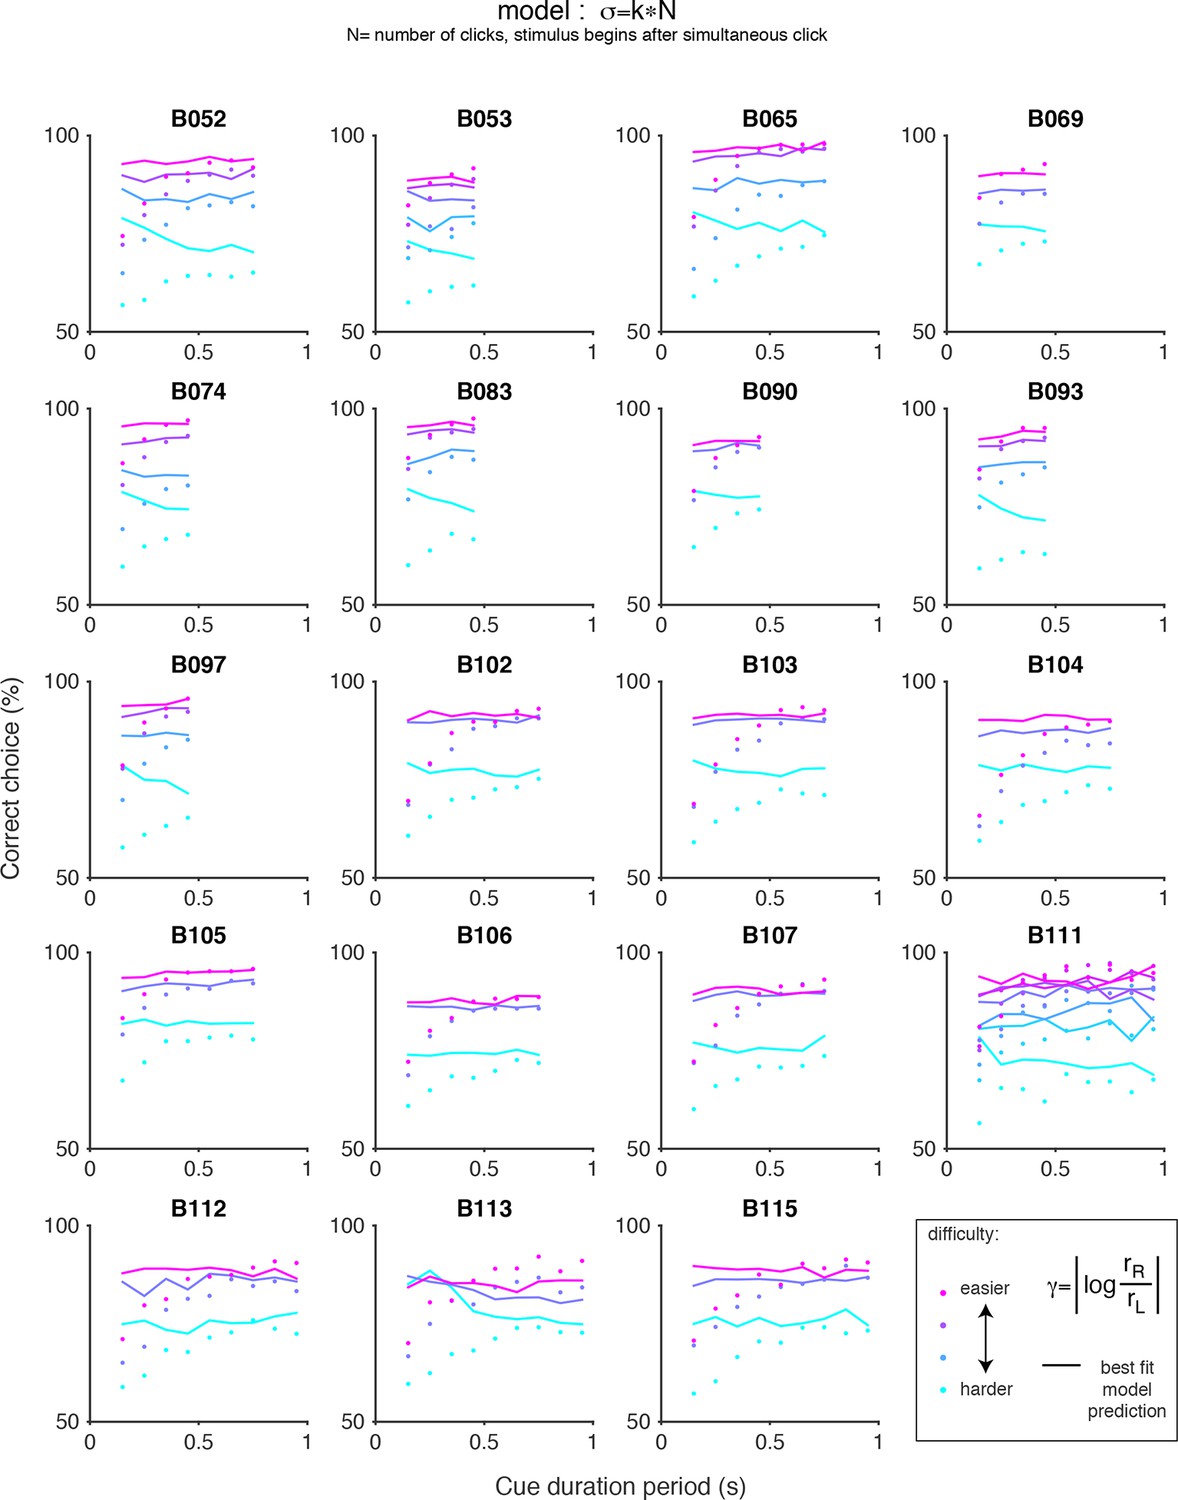
Chronometric plots for the auditory (clicks) data and predictions of scalar variability.
Each panel shows the performance of an individual rat on the auditory accumulation task as a function of the duration of the cue period. Colored dots indicate the data and colored lines indicate the prediction of pure scalar variability: σ = kN, where N is the number of clicks after the simultaneous click. Color indicates trial difficulty, parameterized by γ, the log of the ratio of the rates of the clicks on each side. Across all animals, performance increases as a function of cue duration for a fixed γ (colored dots), however, pure scalar variability predicts flat psychometric function (colored lines).
Figure 3—figure supplement 7
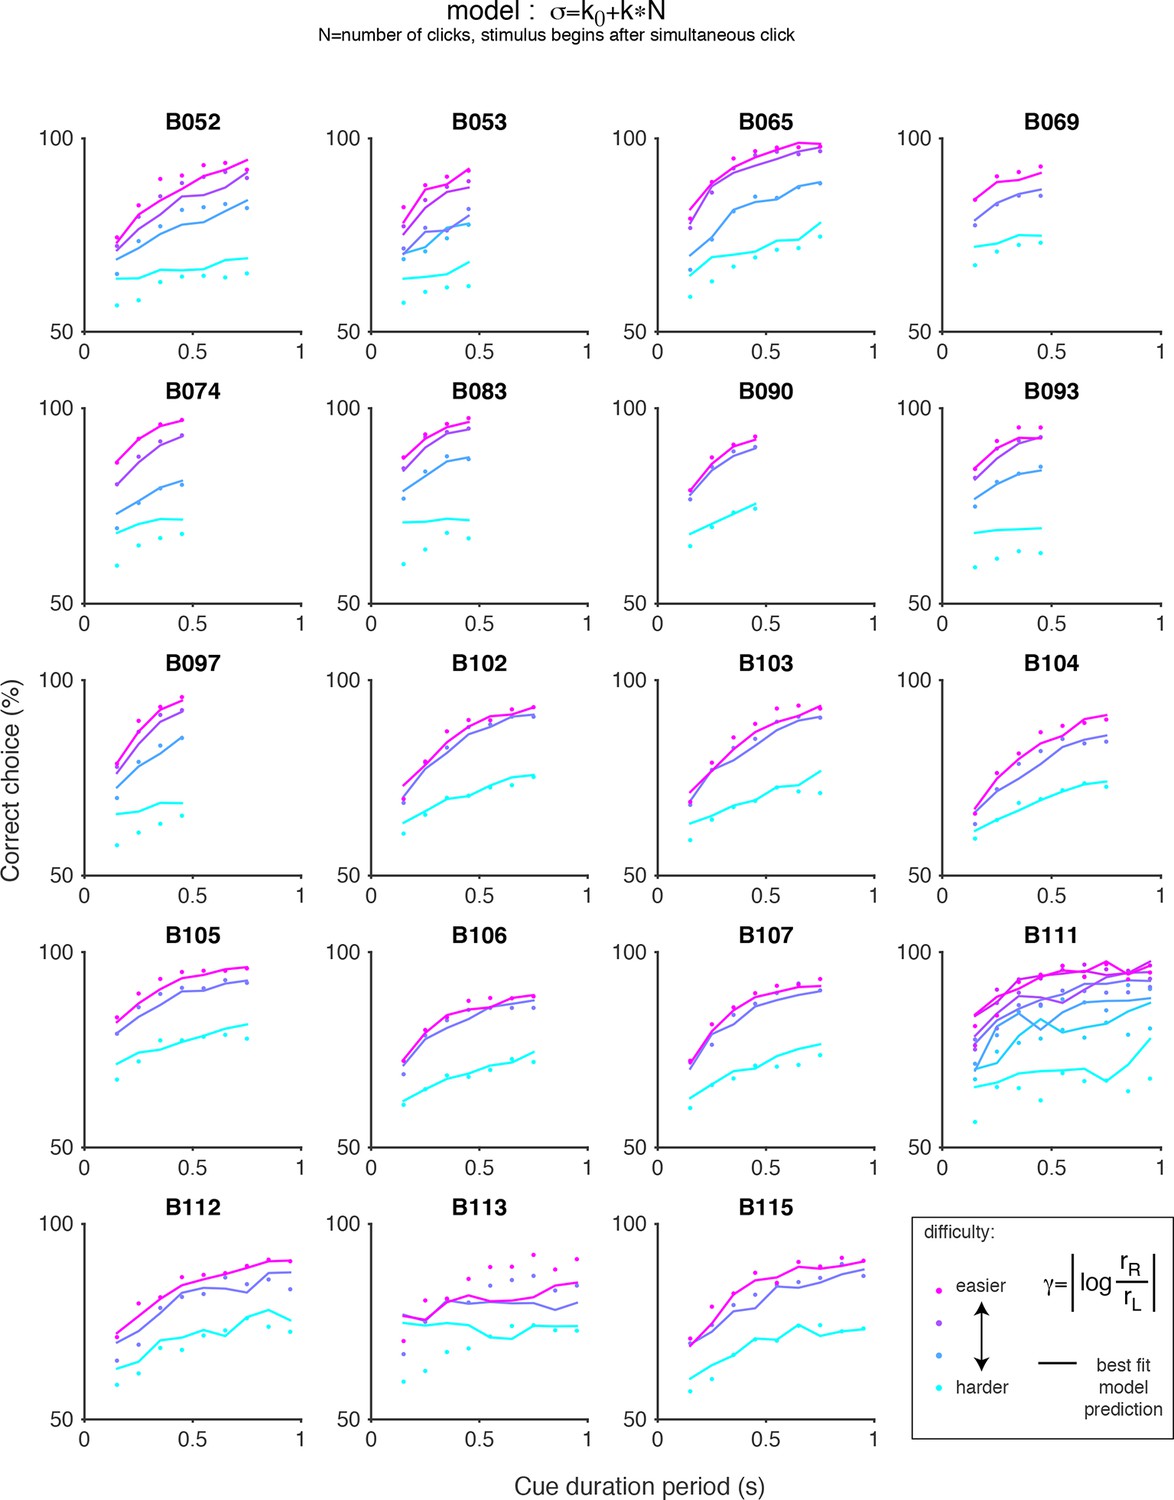
Chronometric plots for the auditory (clicks) data and predictions of scalar variability with an offset.
Each panel shows the performance of an individual rat on the auditory accumulation task as a function of the duration of the cue period. Colored dots indicate the data and colored lines indicate the prediction of scalar variability with an offset: σ = k0+kN, where N is the number of clicks after the simultaneous click. Color indicates trial difficulty, parameterized by γ, the log of the ratio of the rates of the clicks on each side. Across all animals, performance increases as a function of cue duration for a fixed γ (colored dots). Whereas pure scalar variability predicts flat psychometric function (see Figure 3—figure supplement 6), inclusion of an offset term captures increased performance with cue duration.
Figure 4 with 2 supplements
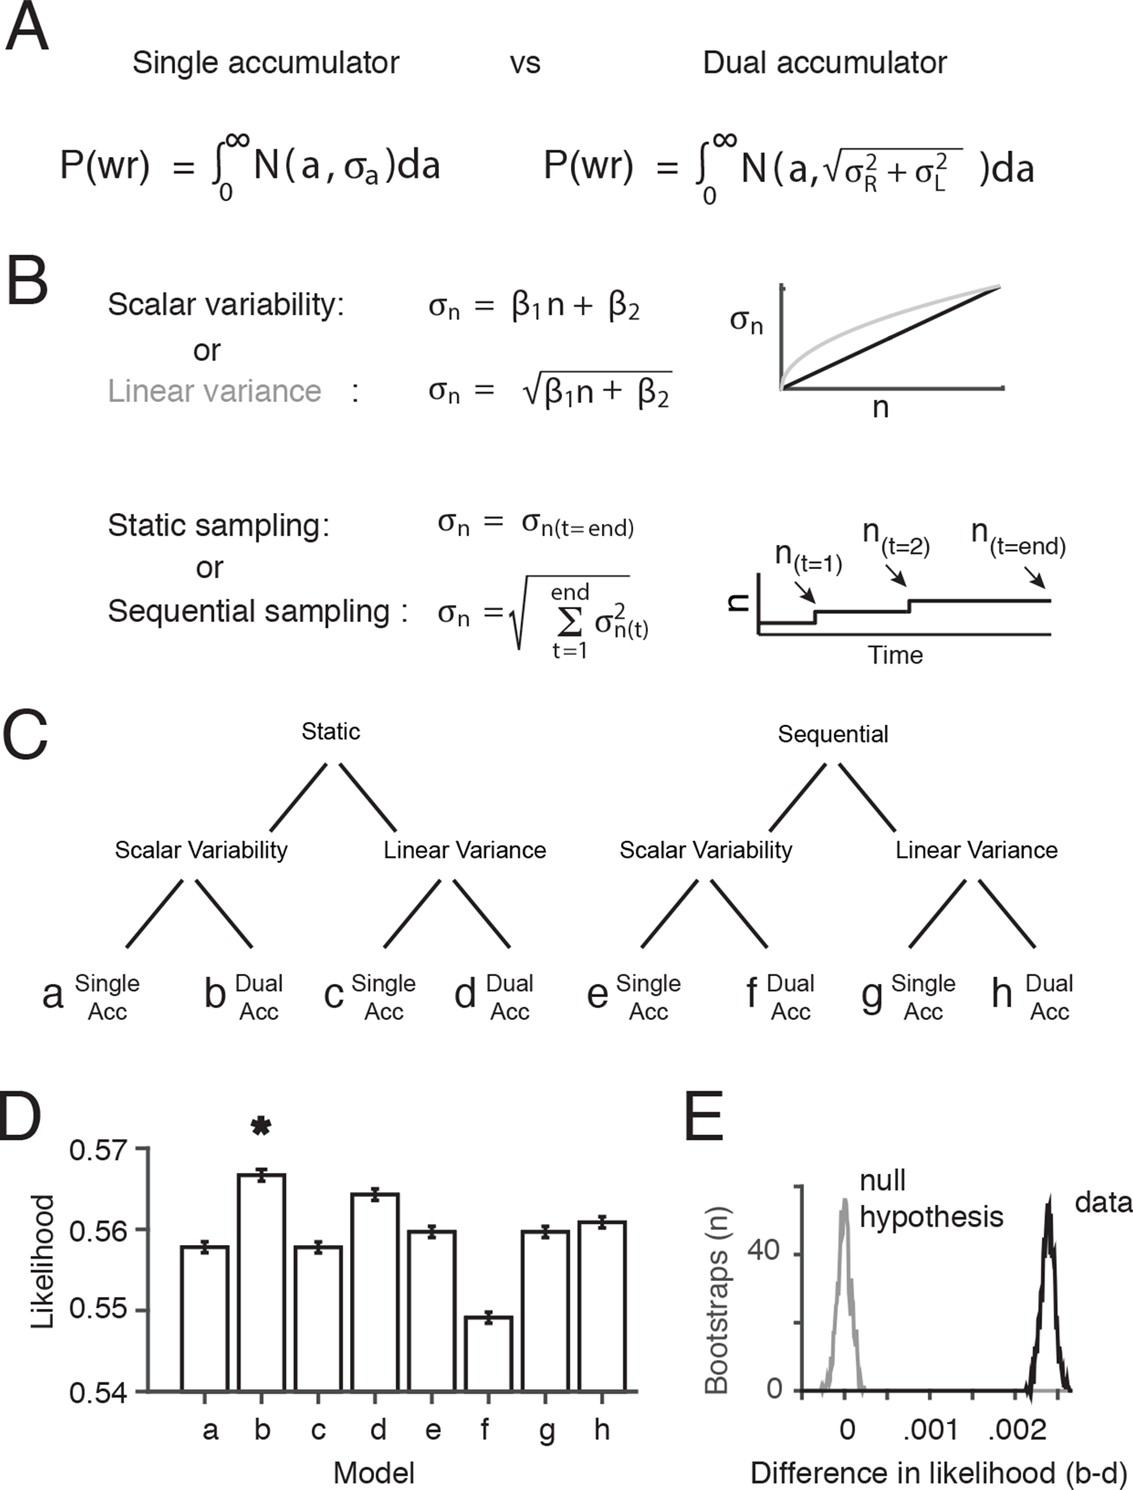
Comparison of behavioral models suggests the presence of at least two accumulators.
(A) General forms of the signal detection theory-based models that were compared assumed either single or dual accumulators. Each model determines which choice to make on each trial, by randomly selecting a value (a) from a Gaussian with mean equal to the difference in total right minus left flashes, and standard deviation . If a>0, the model decides “Right”, and if a<0 the model decides “Left”. Noise, parameterized as the standard deviation of the distributions of flash number or flash difference (), enters the accumulation process differently in each model. Single accumulator models assume that noise depends only on the difference in the number of flashes (R-L) while dual accumulator models assume that noise depends on the total number of flashes (R+L). (B) For each class of models (single vs. dual accumulators), we implemented versions that assumed scalar variability or linear variance and that assumed a static or a sequential sampling process. For the static model, equivalent to our original signal detection theory-based model, noise scales with the number of flashes seen at the end of the trial. For the sequential sampling model, noise is added to the subject’s estimate with each flash, and the magnitude of the noise depends on the value of the accumulator at the time of the flash (a(t)). (C) Cladogram indicating the details of each of the eight models (a-h). (D) Comparison of the likelihood of the model given the data for each of the eight model versions. A bootstrapping procedure was used, in which behavioral trials were resampled (with replacement) and each model was fit to each resample. Error bars indicate the 95th percentiles of the model likelihoods using the best-fit parameters for all resamples. The number of parameters is equal across all models, allowing direct comparison of likelihoods. (E) The permutation test used to assess statistical significance. Black line indicates the distribution of the differences of likelihoods between the two models with the largest likelihood, scalar variability, dual accumulator static version (b) and linear variance, dual accumulator, static version (d), across all resamples. Gray line indicates the distribution under the null hypothesis (see Materials and methods: Model comparison). Model b has a significantly larger likelihood than model d and all other models (p<<.001; see Materials and methods: Model comparison).
Figure 4—figure supplement 1
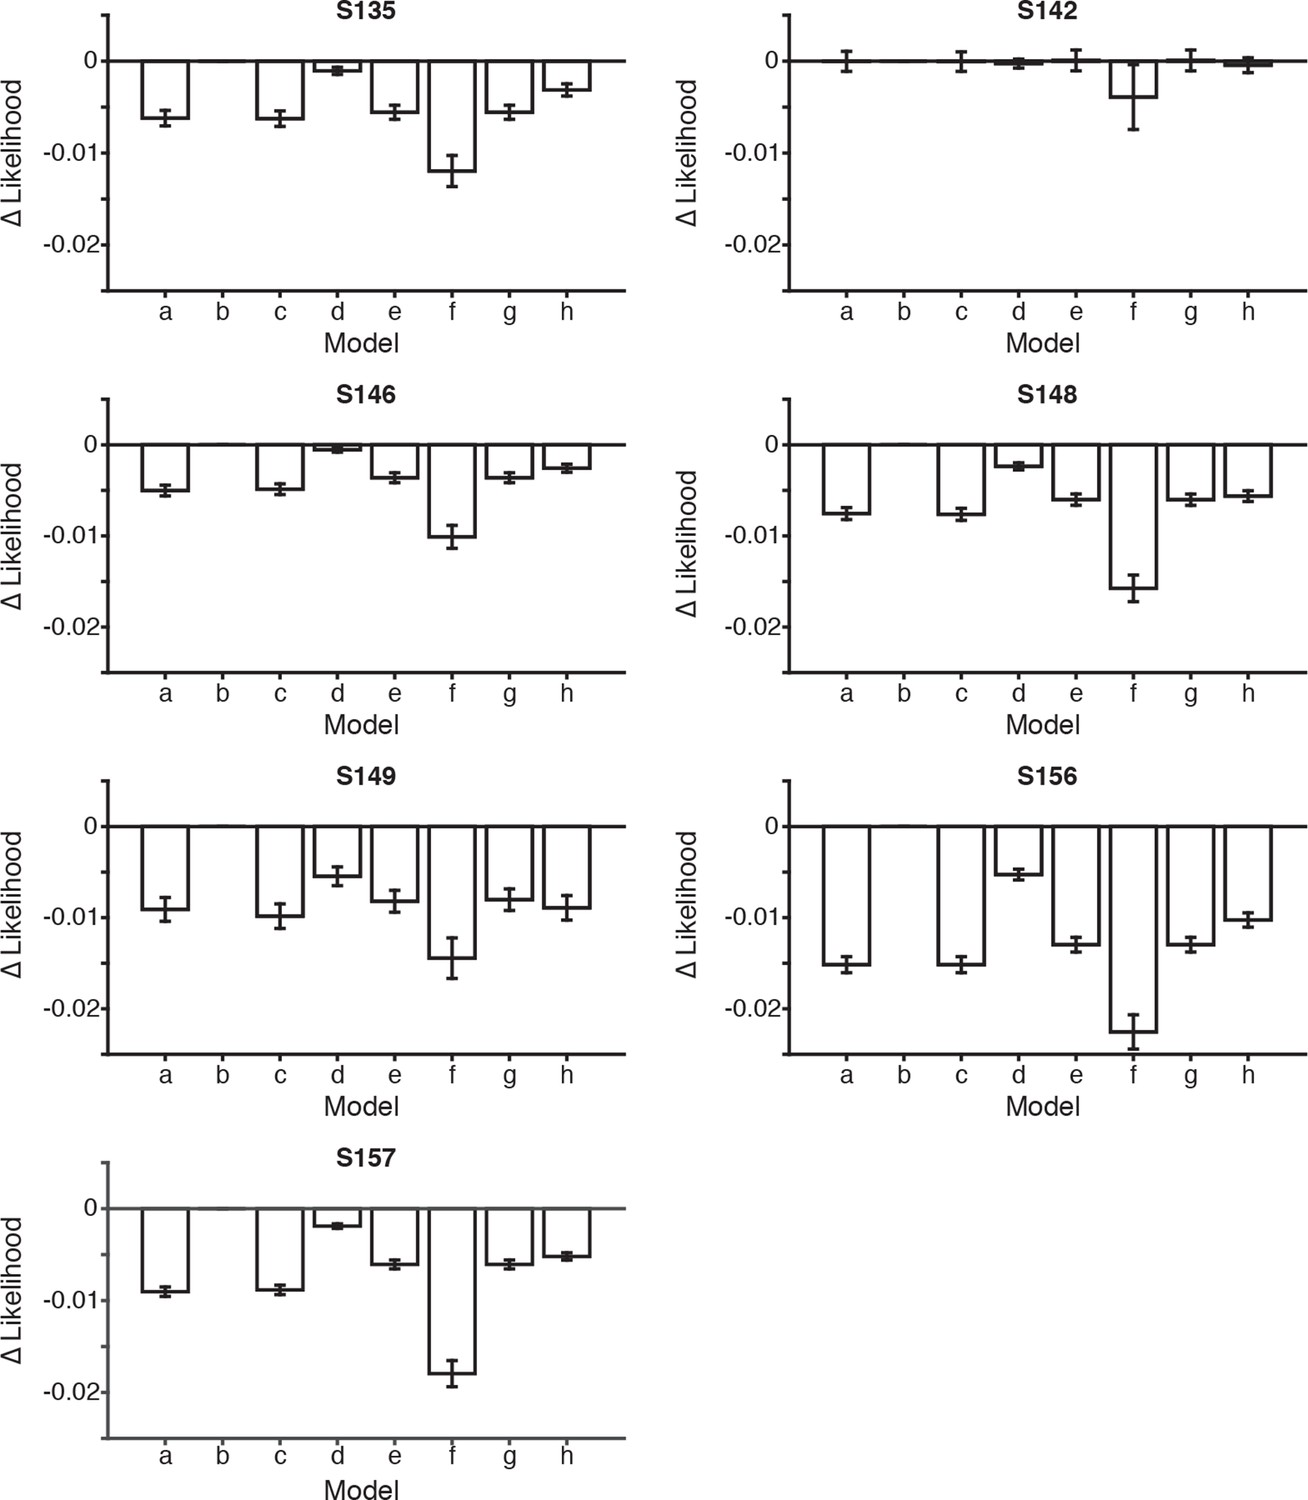
Model comparisons for each rat.
Bar plots indicate the difference in the likelihoods between the scalar variability, dual accumulator static sampling model (b) and the seven other model versions, described in Figure 4, for each rat. Error bars indicate the 95th percentiles of the model likelihoods using the best-fit parameters for all resamples. The number of parameters were equal across all models, allowing direct comparison of likelihoods. A bootstrapping procedure was used, in which behavioral trials were resampled (with replacement) and each model was fit to each resample. Permutation test revealed that in 6/7 rats the scalar variability, dual accumulator static sampling model (model b) had a significantly greater likelihood than all other models (a,c-h) (p<0.001). For rat S142 model b was not significantly greater than other models (p>0.001) except model (f) (p<0.001). Note that rat S142 may not have performed enough trials (n<2000) to accurately fit the model.
Figure 4—figure supplement 2
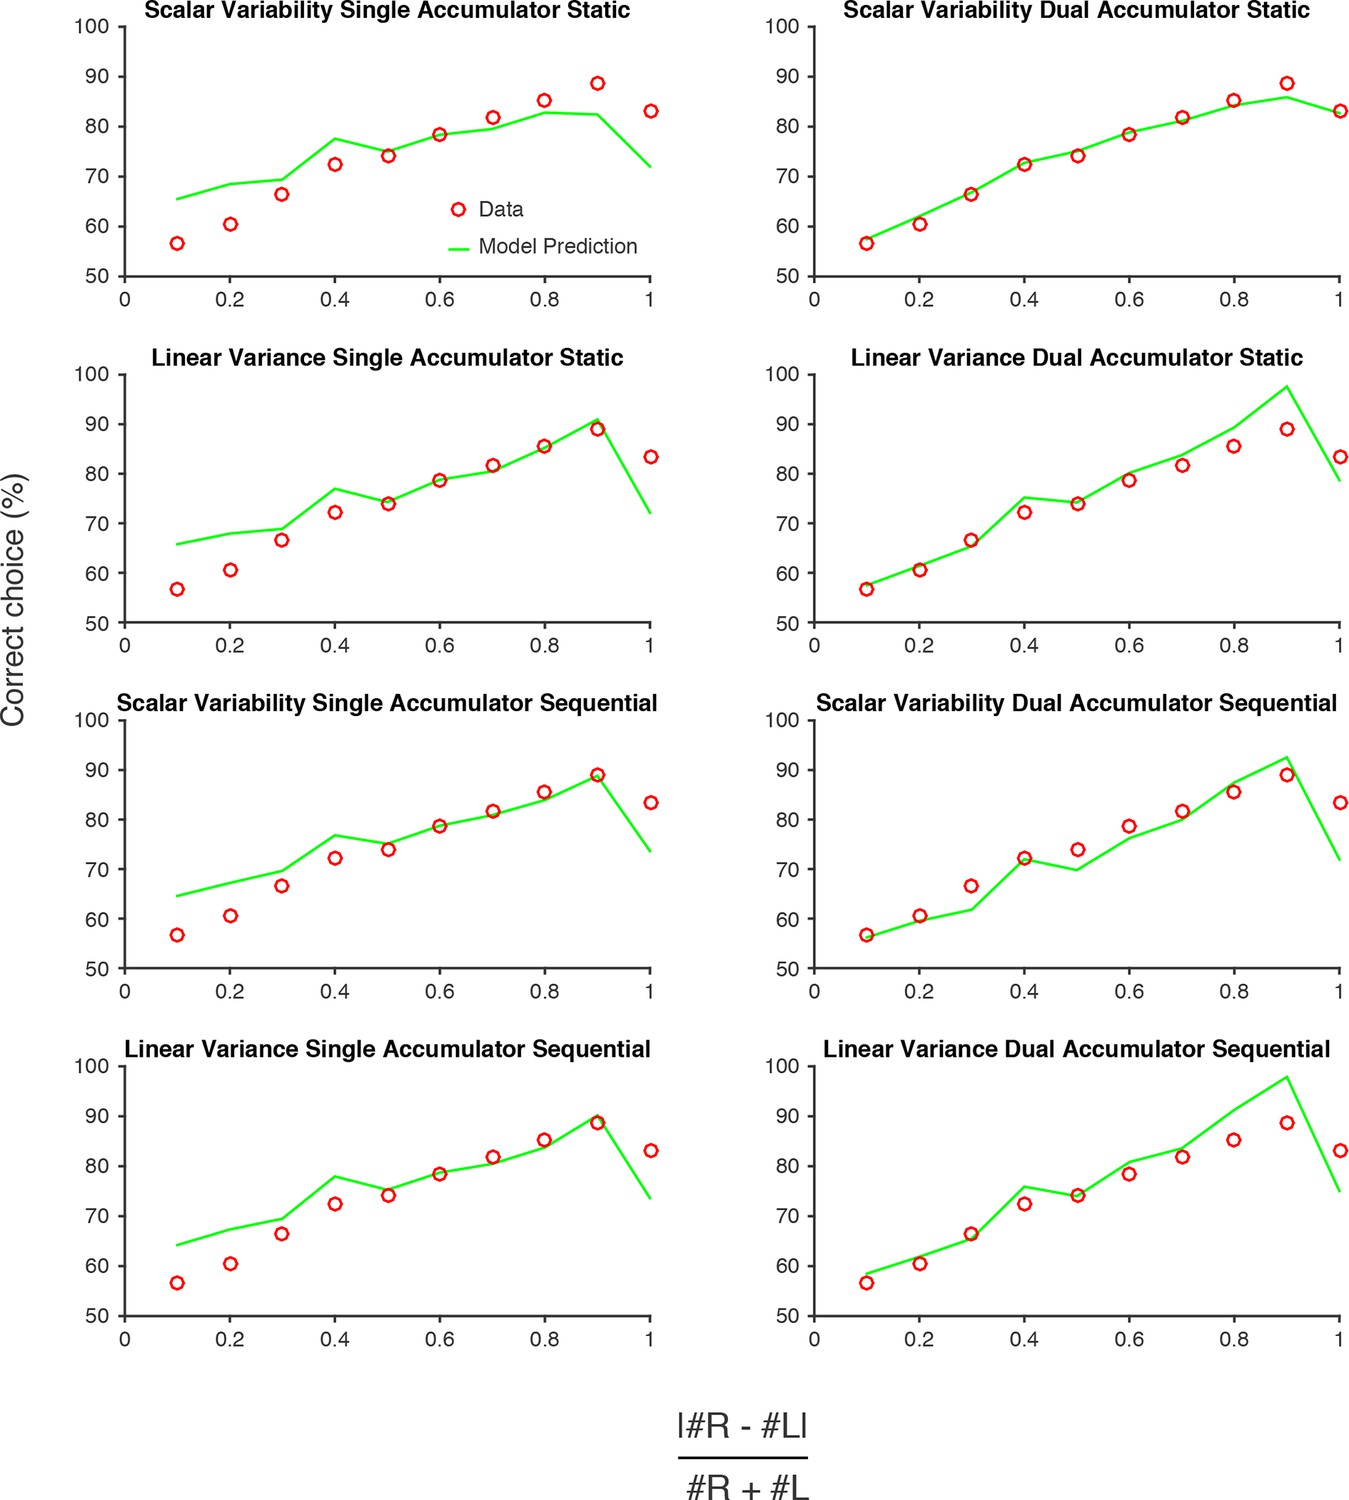
Model predictions versus data.
Performance of each model described in Figure 4. Red circles are data pooled from all rats. Green lines are model predictions, using parameters fit to the pooled data. The 'Scalar variability dual accumulator static' model exhibited the highest likelihood of all the models, for the pooled data and for individual rats (see Figure 4; Figure 4—figure supplement 1).
Figure 5
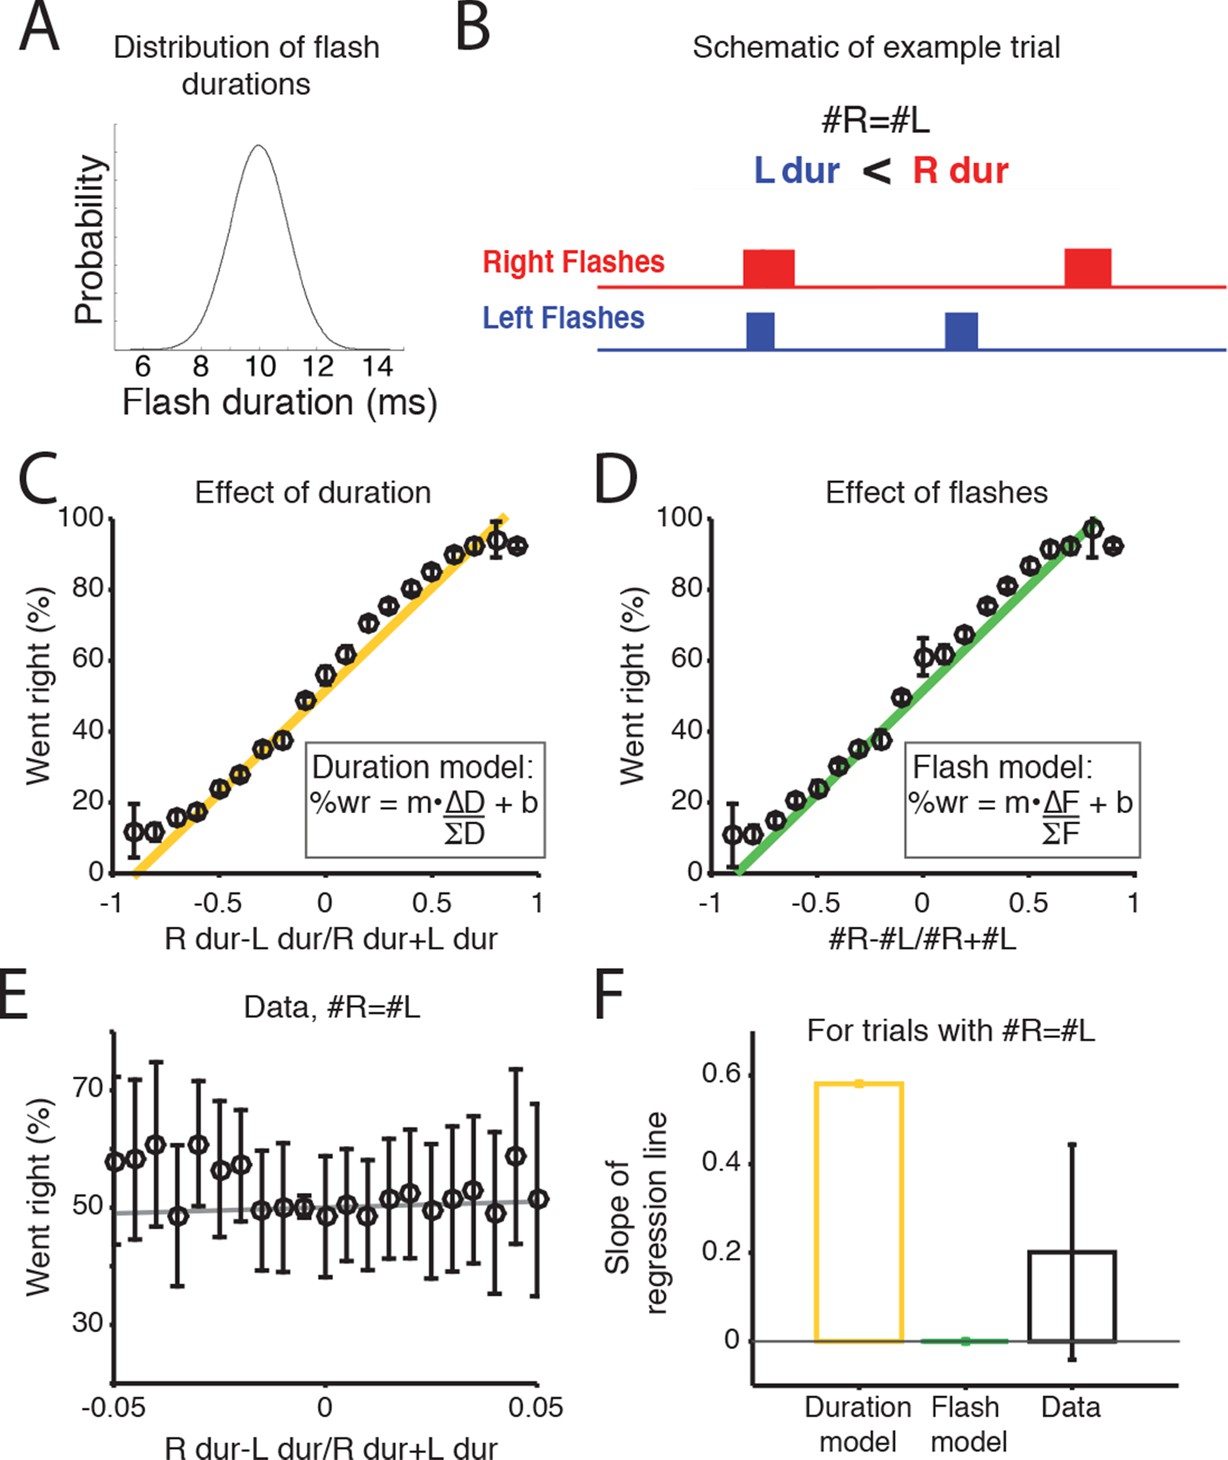
Rats accumulate flash number, not duration.
(A) Distribution of flash durations. In a subset of experiments, flash durations were drawn from a Gaussian distribution with a mean of 10 ms. As a consequence, on some trials in which the same number of flashes were presented to both sides (#R=#L), there was a greater overall flash duration on one side (up to 50 ms) (B) Schematic of the timing and duration of left (blue) and right (red) flashes on an example trial in which #R=#L, but there was greater overall flash duration from the right LED. (C) Percent of trials on which the animal went right as a function of difference in right-left LED duration (specifically (durR-durL)/(durR+durL)) across all combinations of left and right flash number. Because LED duration is correlated with number of flashes on most trials, this looks very similar to performance as a function of flash number. Yellow line is the regression line to the data. (D) Percent of trials on which the animal went right as a function of difference in flash number ((#R-#L)/(#R+#L)). Green line is the regression line to the data. (E) Behavioral choice as a function of the difference in the overall flash duration ((durR-durL)/(durR+durL)) on trials with equal numbers of flashes on both sides (#R=#L). Black circles indicate the percent of trials in which animals went right on trials of different overall flash durations. Error bars indicate 95% confidence intervals for the mean assuming a binomial distribution. Solid gray line is the regression line to the data, whose slope is displayed in panel F. (F) Bar plots indicate the slope of the regression lines in panels C and D for trials with equal numbers of flashes. Error bars are standard error of the coefficient (slope) estimates. These represent different models of what the slope of the regression line to the data would be if the animal were integrating flash duration (‘Duration model’, yellow) or flash number (‘Flash model’, green). The slope of the regression line fit to the data (‘Data’) is significantly different from the line relating the LED duration to choice, but not significantly different from zero. This suggests that rats integrate flash number.
Figure 6
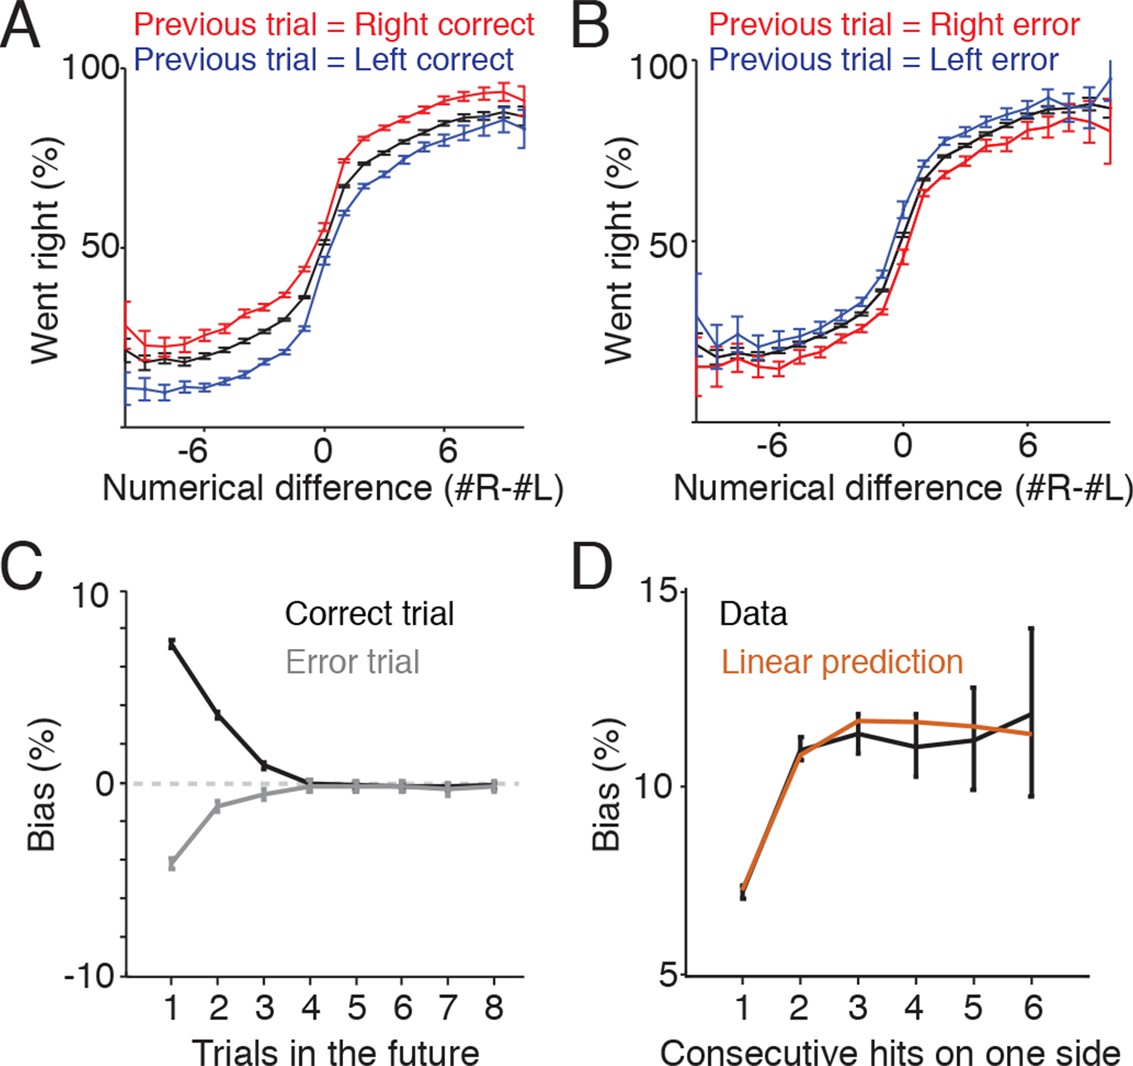
Trial history contributes to behavioral variability.
(A) Reward biases decision on subsequent trials. Plot indicates psychometric performance on trials following correct right (red) and correct left (blue) trials. Black line indicates the mean. Data is pooled across all sessions for all rats. Error bars are 95% confidence intervals for a binomial distribution. (B) Psychometric performance on trials following errors. Making an error on one side modestly decreased the probability that subjects would orient to that side on the subsequent trial. (C) Following a rewarded trial, subjects exhibited increased probability of returning to the same side poke up to three trials in the future (black line). Following an error trial, they exhibited a decreased probability of orienting to the same side up to three trials in the future (gray). (D) Effects of reward history for correct trials are additive. Black line indicates the probability of returning to the same side given 1-6 consecutive rewards on the side. Brown line indicates the bias predicted from the linear sum of the biases observed for non-consecutive rewards as shown in Figure 6C.
Figure 7
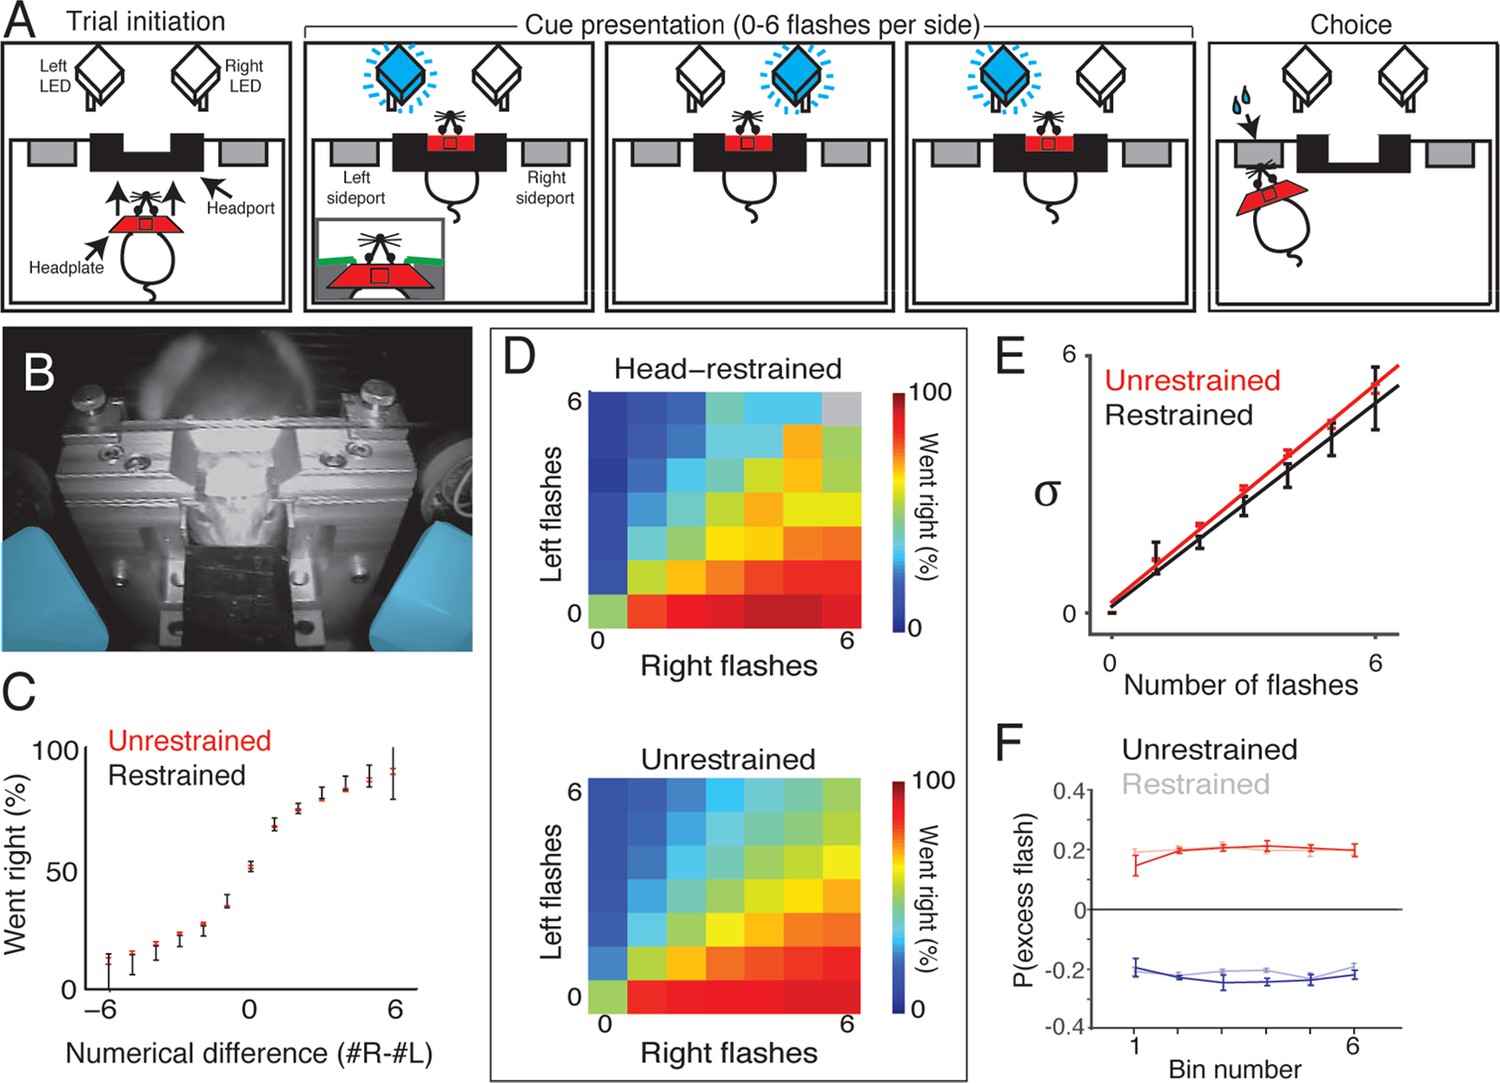
Head-restrained and unrestrained rats exhibit comparable task performance.
(A) Schematic of the accumulation of evidence task during head restraint. A rat initiates a behavioral trial by inserting his headplate into a custom headport along one wall of an operant training box (left panel). While voluntarily head restrained, the rat is presented with a series of pseudo-randomly timed flashes from blue LEDs to the left and right in front of him (middle panels). Following flash presentation, the subject is released from restraint and is free to withdraw his head from the headport and orient to one of the side ports to obtain reward (right panel). (B) Image of a rat training on voluntary head restraint. The left and right stimulus LEDs, which are mounted in light diffusing boxes, are pseudo-colored in blue. (C–F) Direct comparison of behavioral performance between seven head restrained rats and seven unrestrained rats. (C) Comparison of psychophysical performance indicates similar sensitivity to the difference in the number of flashes between restrained (black) and unrestrained rats (red). Error bars indicate 95% binomial confidence intervals on the data. (D) Comparison of behavioral performance between restrained (upper panel) and unrestrained (lower panel) rats across all different stimulus types in the restrained version of the task. Color indicates the percentage of trials on which the subjects oriented to the right. Gray indicates no data. (E) Comparison of the noise (standard deviation) in the estimates of the number of flashes for restrained rats (black) and unrestrained rats (red) using the procedure described in Figure 3. Lines indicate the best linear fit for the restrained (black) and unrestrained (red) cohorts. Error bars indicate the 95% estimates of the means of . (F) Reverse correlation analysis indicating the relative contribution of flashes occurring at different times in the trial to the subjects’ behavioral choice for restrained (transparent) and unrestrained (solid) rats. Data from unrestrained rats are a subset of the data plotted in Figure 2F (color convention is also adopted from Figure 2F). Lines and error bars are mean and standard error across rats.
Download links
A two-part list of links to download the article, or parts of the article, in various formats.
Downloads (link to download the article as PDF)
Open citations (links to open the citations from this article in various online reference manager services)
Cite this article (links to download the citations from this article in formats compatible with various reference manager tools)
Sources of noise during accumulation of evidence in unrestrained and voluntarily head-restrained rats
eLife 4:e11308.
https://doi.org/10.7554/eLife.11308


