Sister kinetochore splitting and precocious disintegration of bivalents could explain the maternal age effect
- Medical Research Council Laboratory of Molecular Biology, United Kingdom
- Bourn Hall Clinic, United Kingdom
- Max Planck Institute for Biophysical Chemistry, Germany
Figures
Figure 1 with 4 supplements

Most sister kinetochores are not unified and attach to two discrete k-fibers during meiosis I in human oocytes.
(A) Maximum intensity z-projection immunofluorescence images of kinetochores and chromosomes in meiosis I oocytes from young donors (≤30 years old). Representative examples from 5 different oocytes. Scale bar represents 1 µm. (B) Categories of sister kinetochore configurations shown in (A) and their frequency in oocytes from young donors (≤30 years old). 1,051 kinetochore pairs from 23 oocytes were analyzed. (C) Examples of kinetochore configurations from 26 human oocytes across all age groups in which sister kinetochores are separated (marked with white arrows). Scale bar represents 1 µm. (D) Maximum intensity z-projection immunofluorescence images of microtubules and distinct sister kinetochore pairs in cold-treated meiotic spindles from human oocytes across all age groups. Drawings illustrate the different modes of microtubule attachments in the immunofluorescence images. Scale bar represents 5 µm in overview and 1 µm in insets. (E) Quantification of the number of individual k-fibers attaching to sister kinetochore pairs. 949 attachments from 25 cold-treated human oocytes from donors across all age groups were evaluated. (F) Frequency of the different modes of kinetochore-microtubule attachments shown in (D).
Figure 1—figure supplement 1
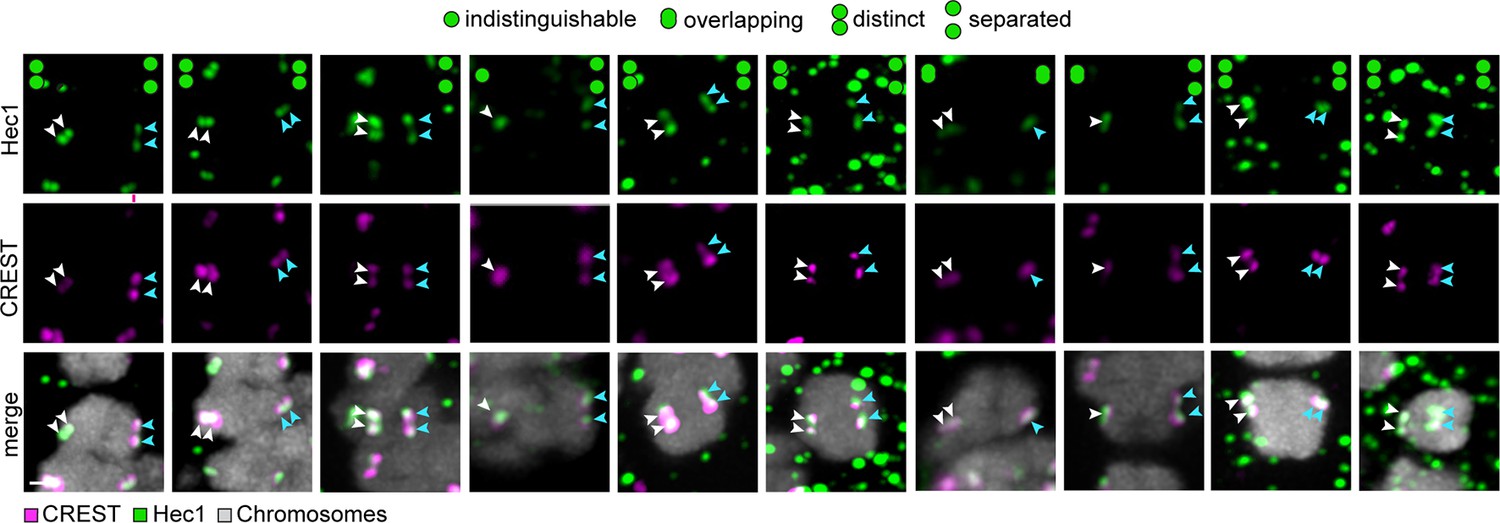
The majority of sister kinetochores are split during meiosis I in human oocytes.
Representative images of kinetochores from 5 human oocytes co-labelled with CREST (magenta) and Hec1 (green). Schemes on top of the panel show the different kinetochore configurations as determined from Hec1 labelling. Arrows of the same colour highlight sister kinetochores. Scale bar represents 1 µm.
Figure 1—figure supplement 2
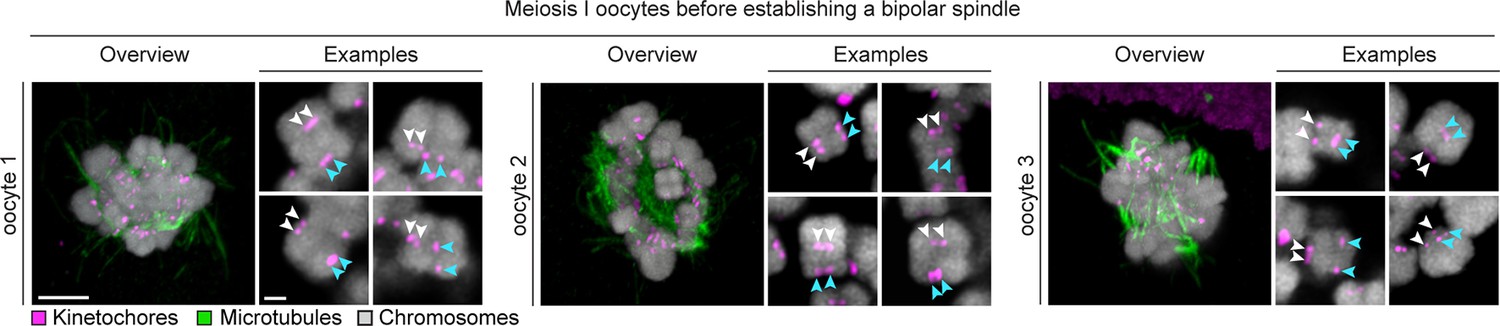
Sister kinetochore separation is already evident in the initial stages of spindle assembly.
Representative bivalents from 3 different human oocytes fixed before completion of bipolar spindle assembly are shown. Arrows of the same colour highlight sister kinetochores. Scale bar represents 5 µm in overview and 1 µm in insets.
Figure 1—figure supplement 3
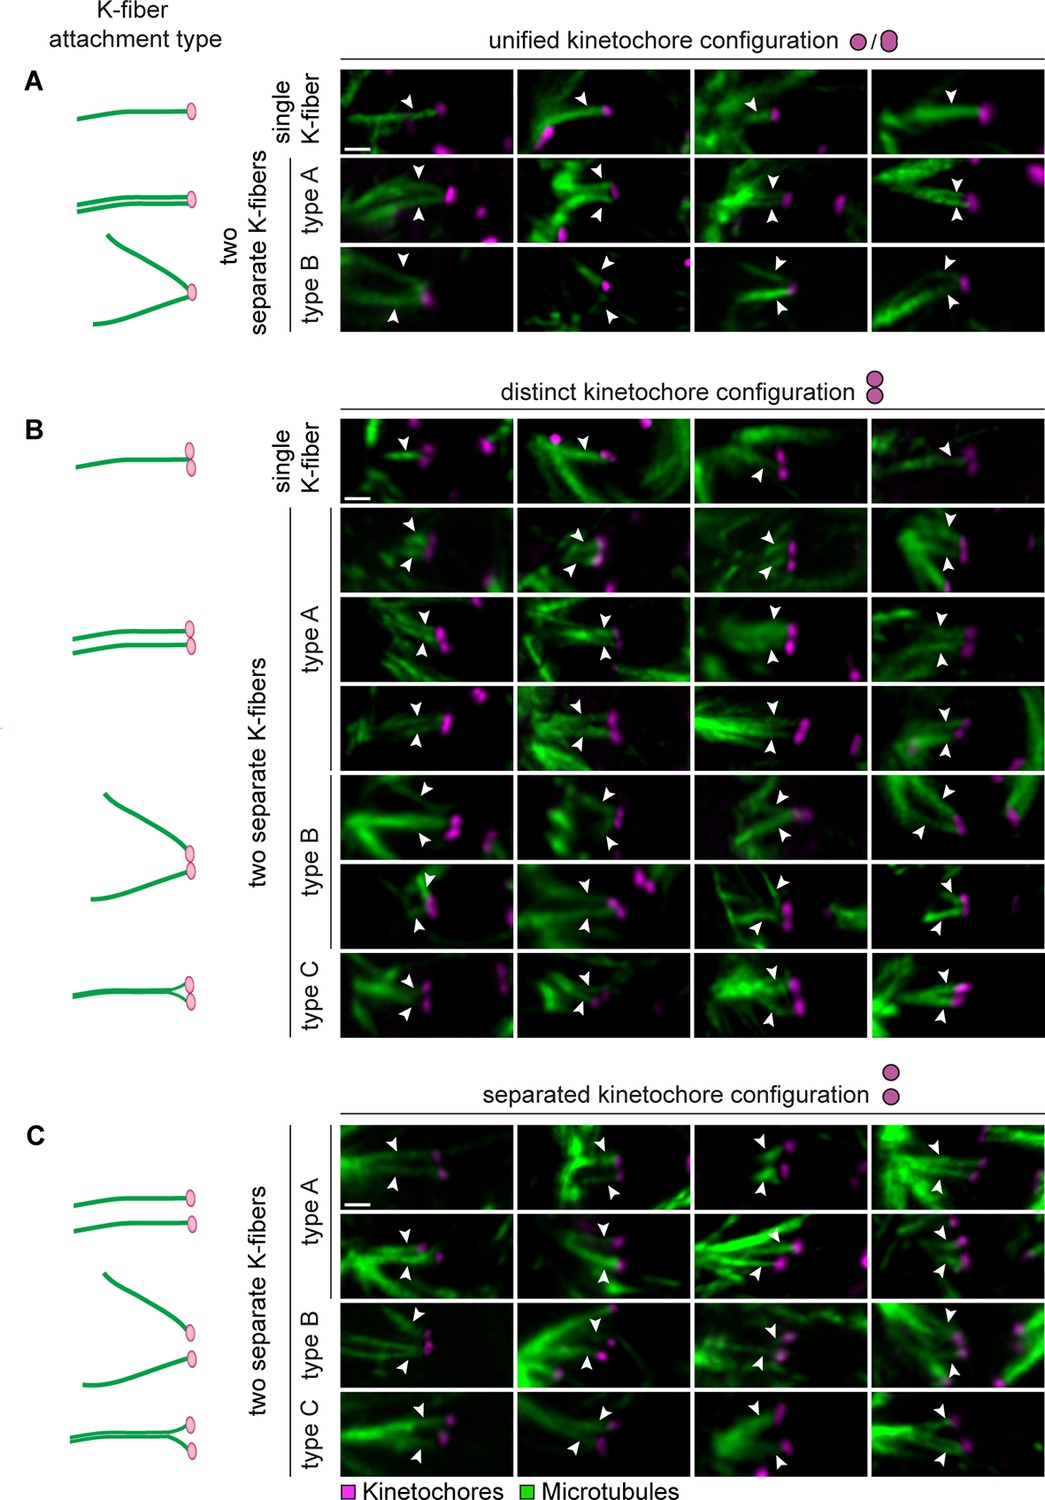
Sister kinetochores can interact with k-fibers that originate from different regions of the meiotic spindle.
(A) Illustrations and representative images of k-fiber attachment types to unified sister kinetochore pairs in cold-treated human oocyte spindles. Arrows indicate attachment types defined in (1D). Scale bar represents 1 µm. (B) Illustrations and representative images of k-fiber attachment types to distinct kinetochore pairs in cold-treated human oocyte spindles. Arrows indicate attachment types defined in (1D). Scale bar represents 1 µm. (C) Illustrations and representative images of k-fiber attachment types to separated kinetochore pairs in cold-treated human oocyte spindles. Arrows indicate attachment types defined in (1D). Scale bar represents 1 µm.
Figure 1—figure supplement 4
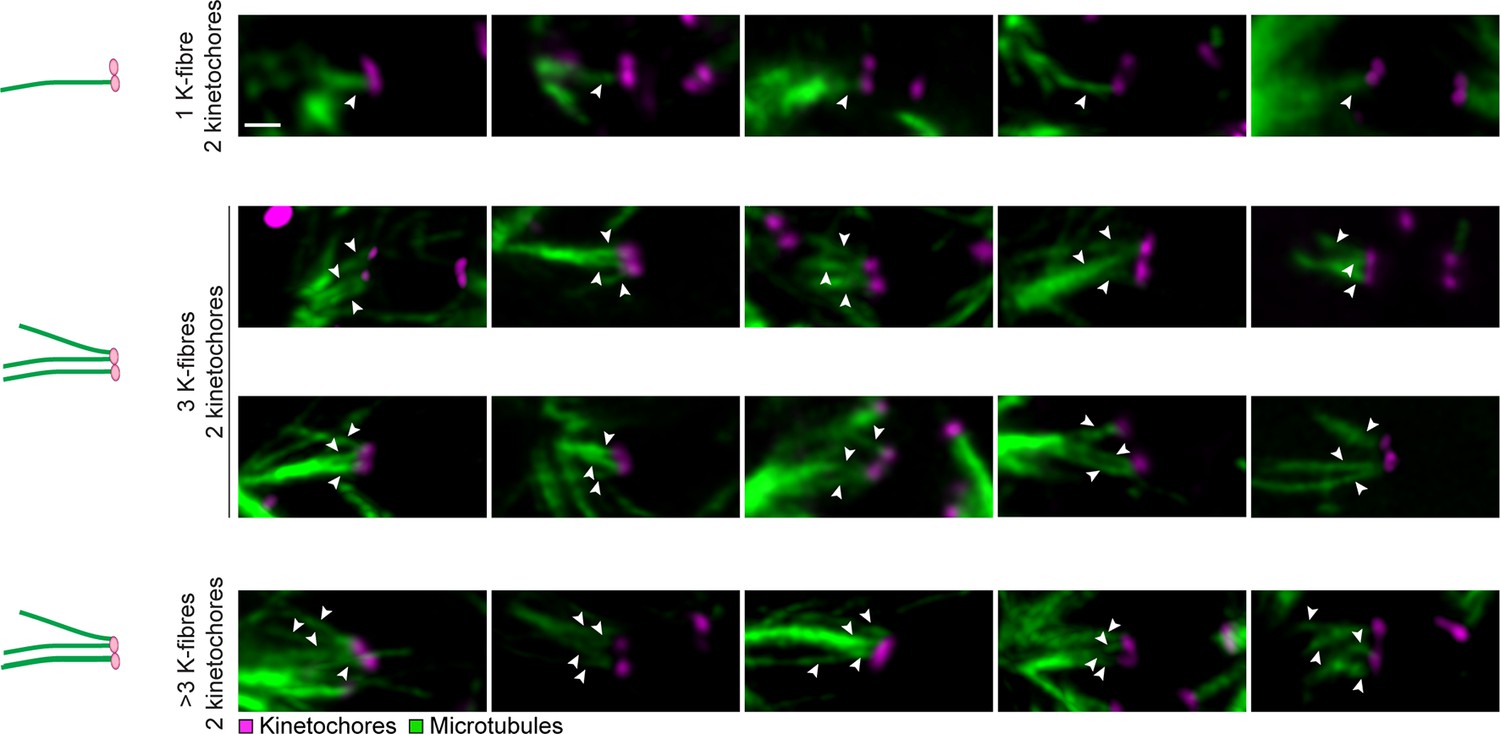
Individual kinetochores can attach to multiple k-fibers during meiosis I in human oocytes.
Illustrations and representative images of kinetochore-microtubule interactions in cold-treated human oocyte spindles showing multiple k-fiber attachments (indicated by arrows) to individual kinetochore pairs. Scale bar represents 1 µm.
Figure 2 with 3 supplements
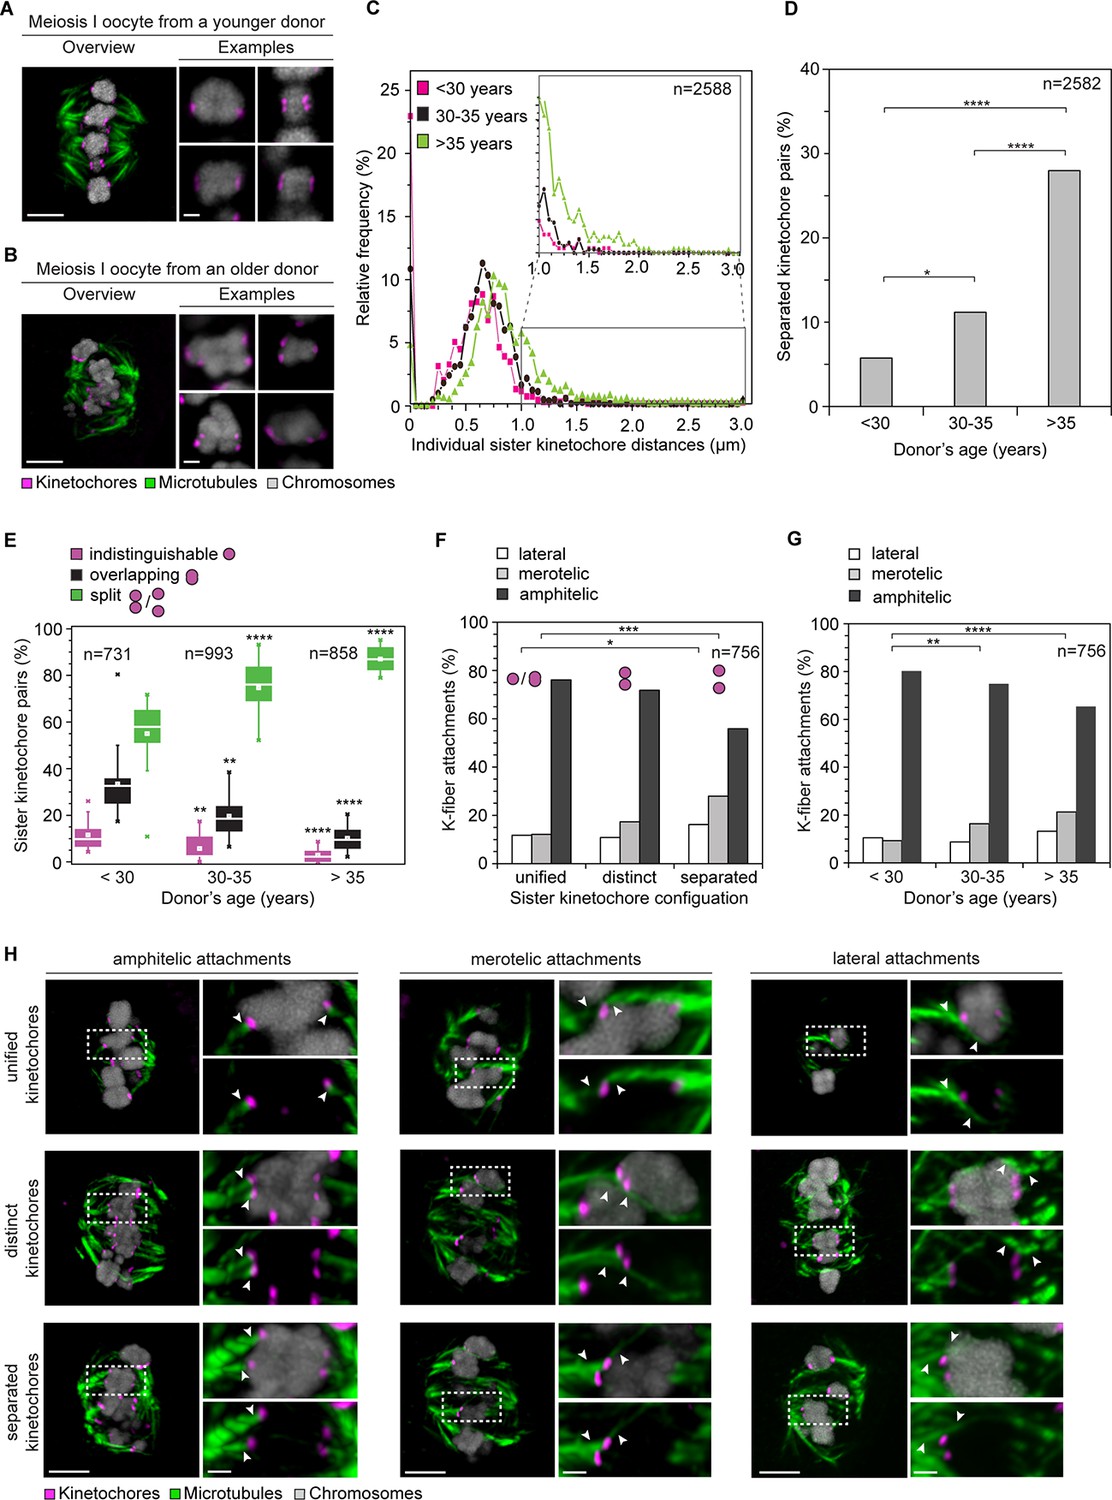
Age-dependent increase in sister kinetochore separation correlates with abnormal kinetochore-microtubule attachments.
(A, B) Overview of a cold-treated meiotic spindle and examples of its bivalents in an oocyte from (A) a young (24 years old) and (B) an older (40 years old) donor. Scale bars represent 5 µm in overviews and 1 µm in examples. (C) Relative frequency of individual sister kinetochore pair distances across different age groups. 2,588 measurements were obtained from 57 oocytes. Distances between unresolvable sister kinetochore configurations of the indistinguishable and overlapping categories (as shown in (1B)) are presented as 0 µm. (D) Age-related increase in the incidence of separated sister kinetochores in 58 human oocytes. ****p≤0.0001. (E) Occurrence of kinetochore configurations defined in (1B) across different age groups. *p≤0.05, **p≤0.01, ***p≤0.001, ****p≤0.0001. Significance analyses were performed for changes relative to <30 years old age group. (F) Quantification of the proportion of microtubule attachments (shown in H) in each category of sister kinetochore configurations. *p≤0.05, **p≤0.01, ***p≤0.001 (Fisher’s exact test). Significance analyses were performed for changes in the frequency of merotelic (***) and lateral (*) attachment modes relative to the unified kinetochore group. (G) The proportion of kinetochore-microtubule attachments (shown in (H)) in cold-treated spindles of oocytes from each age group. N=25 oocytes. *p≤0.05, **p≤0.01, ***p≤0.001, ****p≤0.0001. Significance analyses were performed for changes in the frequency of merotelic attachment mode relative to <30 years old age group. (H) Representative maximum intensity z-projections of immunofluorescence images of cold-treated spindles showing different microtubule attachment types across the three categories of sister kinetochore configurations defined in (1B). Arrowheads indicate kinetochore pairs with the specified microtubule attachment type. Scale bar represents 5 µm in overview, 1 µm in insets.
Figure 2—figure supplement 1
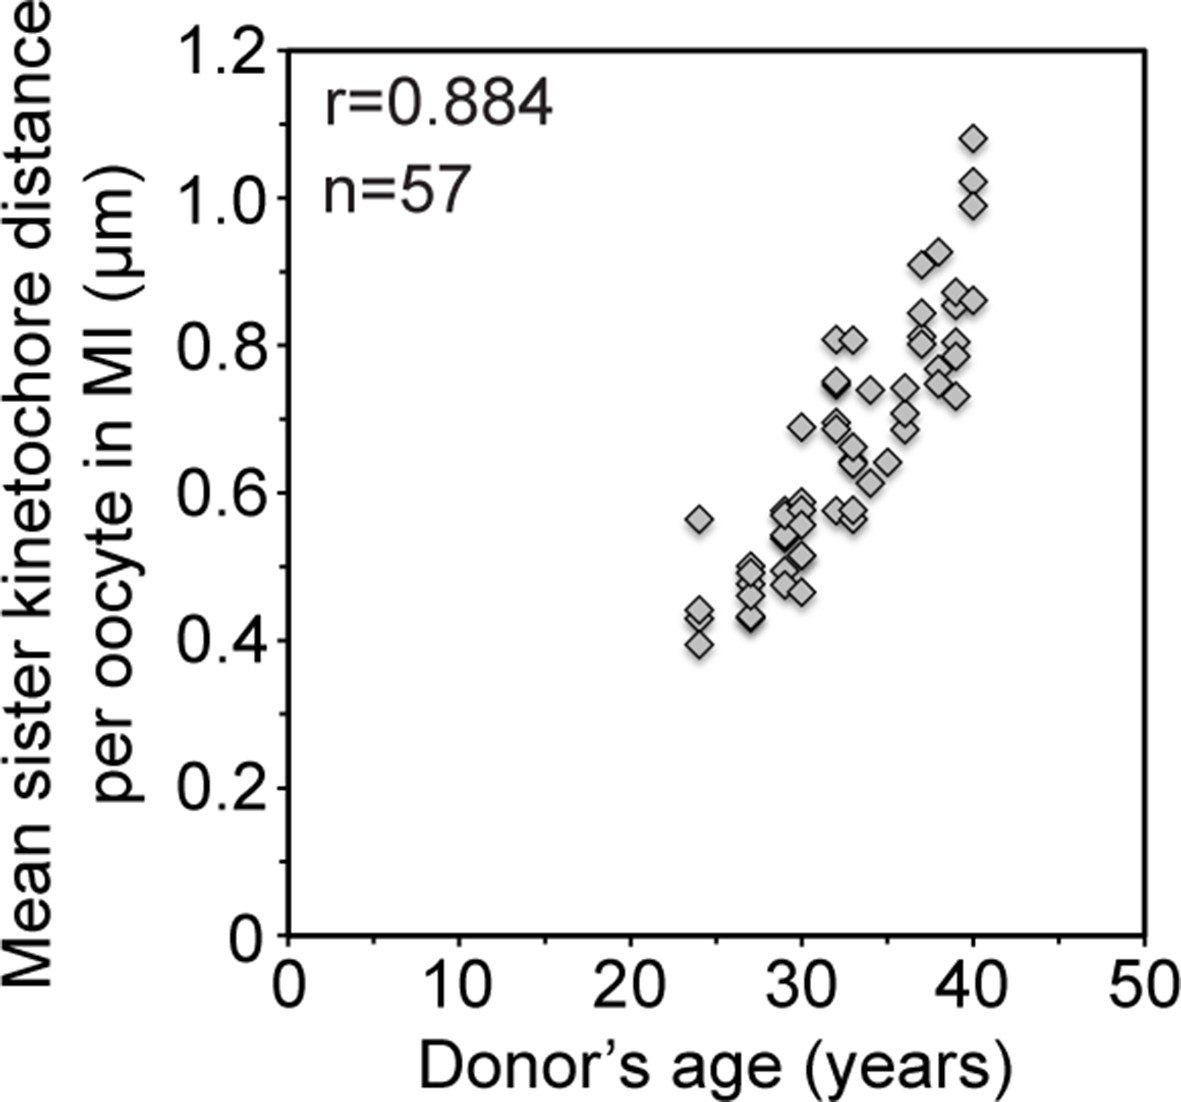
Mean sister kinetochore distance in meiosis I increases with donor’s age in a linear manner.
Correlation analysis between mean sister kinetochore distance and donor’s age. 57 oocytes from donors aged 24–40 years were analyzed. 98% of the sister pairs were resolved and included in the analysis.
Figure 2—figure supplement 2
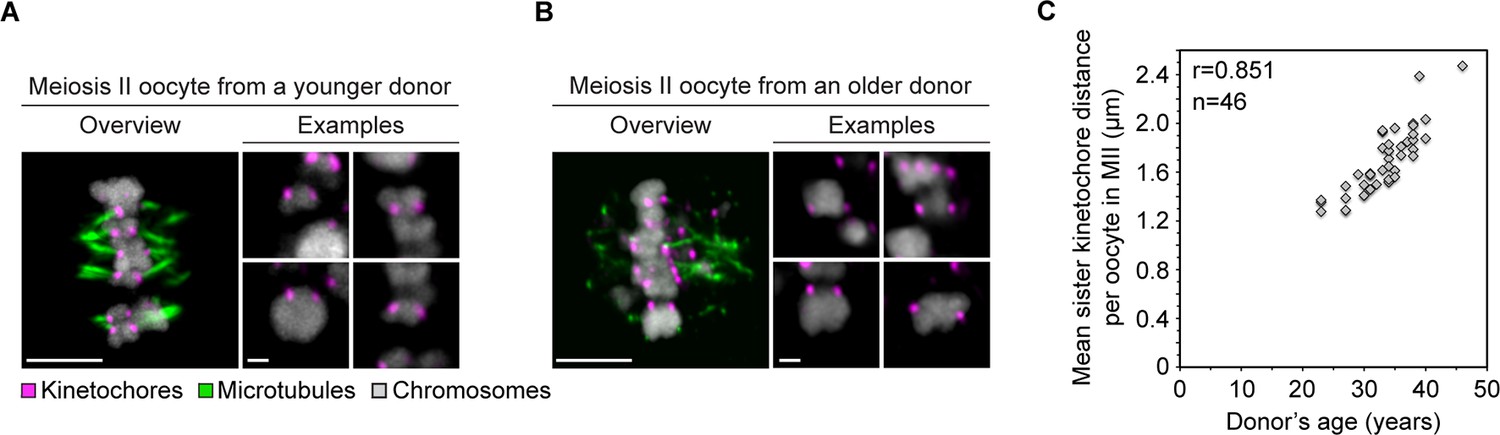
Age-dependent increase in separation of sister kinetochores in human oocytes is conserved from meiosis I to meiosis II.
(A) Overview of a cold-treated MII spindle and examples of its chromosomes in an oocyte from a young (23 years old) donor. Scale bars represent 5 µm in overviews and 1 µm in examples. (B) Overview of a cold-treated meiotic spindle and examples of its bivalents in an oocyte from an older (40 years old) donor. Scale bars represent 5 µm in overviews and 1 µm in examples. (C) Correlation analysis between mean sister kinetochore distance in meiosis II and oocyte donor age. 46 oocytes from donors aged 23–46 years were analyzed.
Figure 2—figure supplement 3
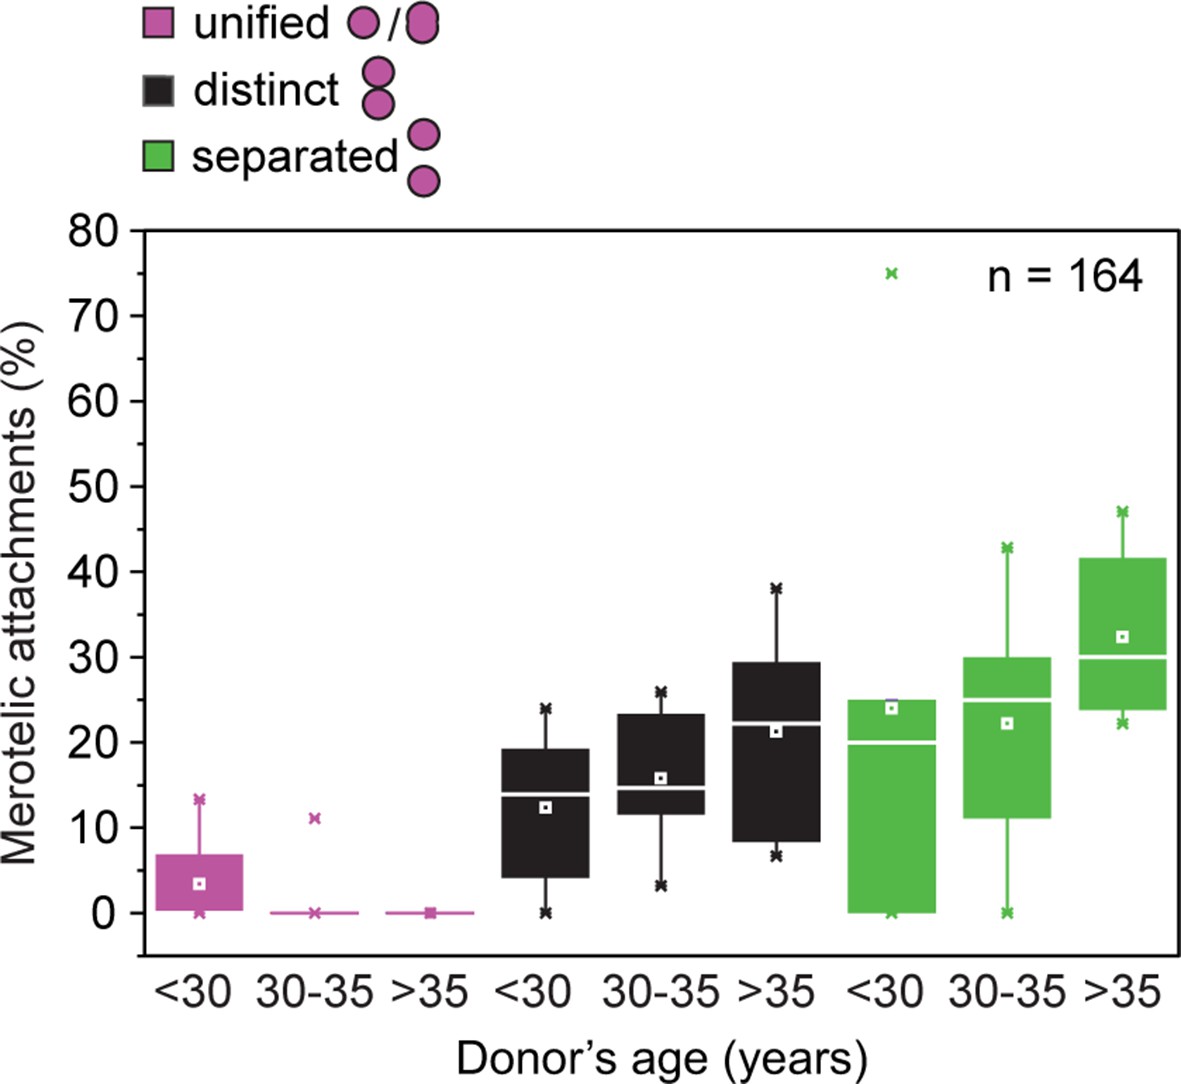
Frequency of merotelic attachments are correlated with kinetochore configuration and donor’s age.
Frequency of merotelic kinetochore-microtubule attachments as in Figure 2G stratified by kinetochore configuration and donor’s age.
Figure 3 with 2 supplements
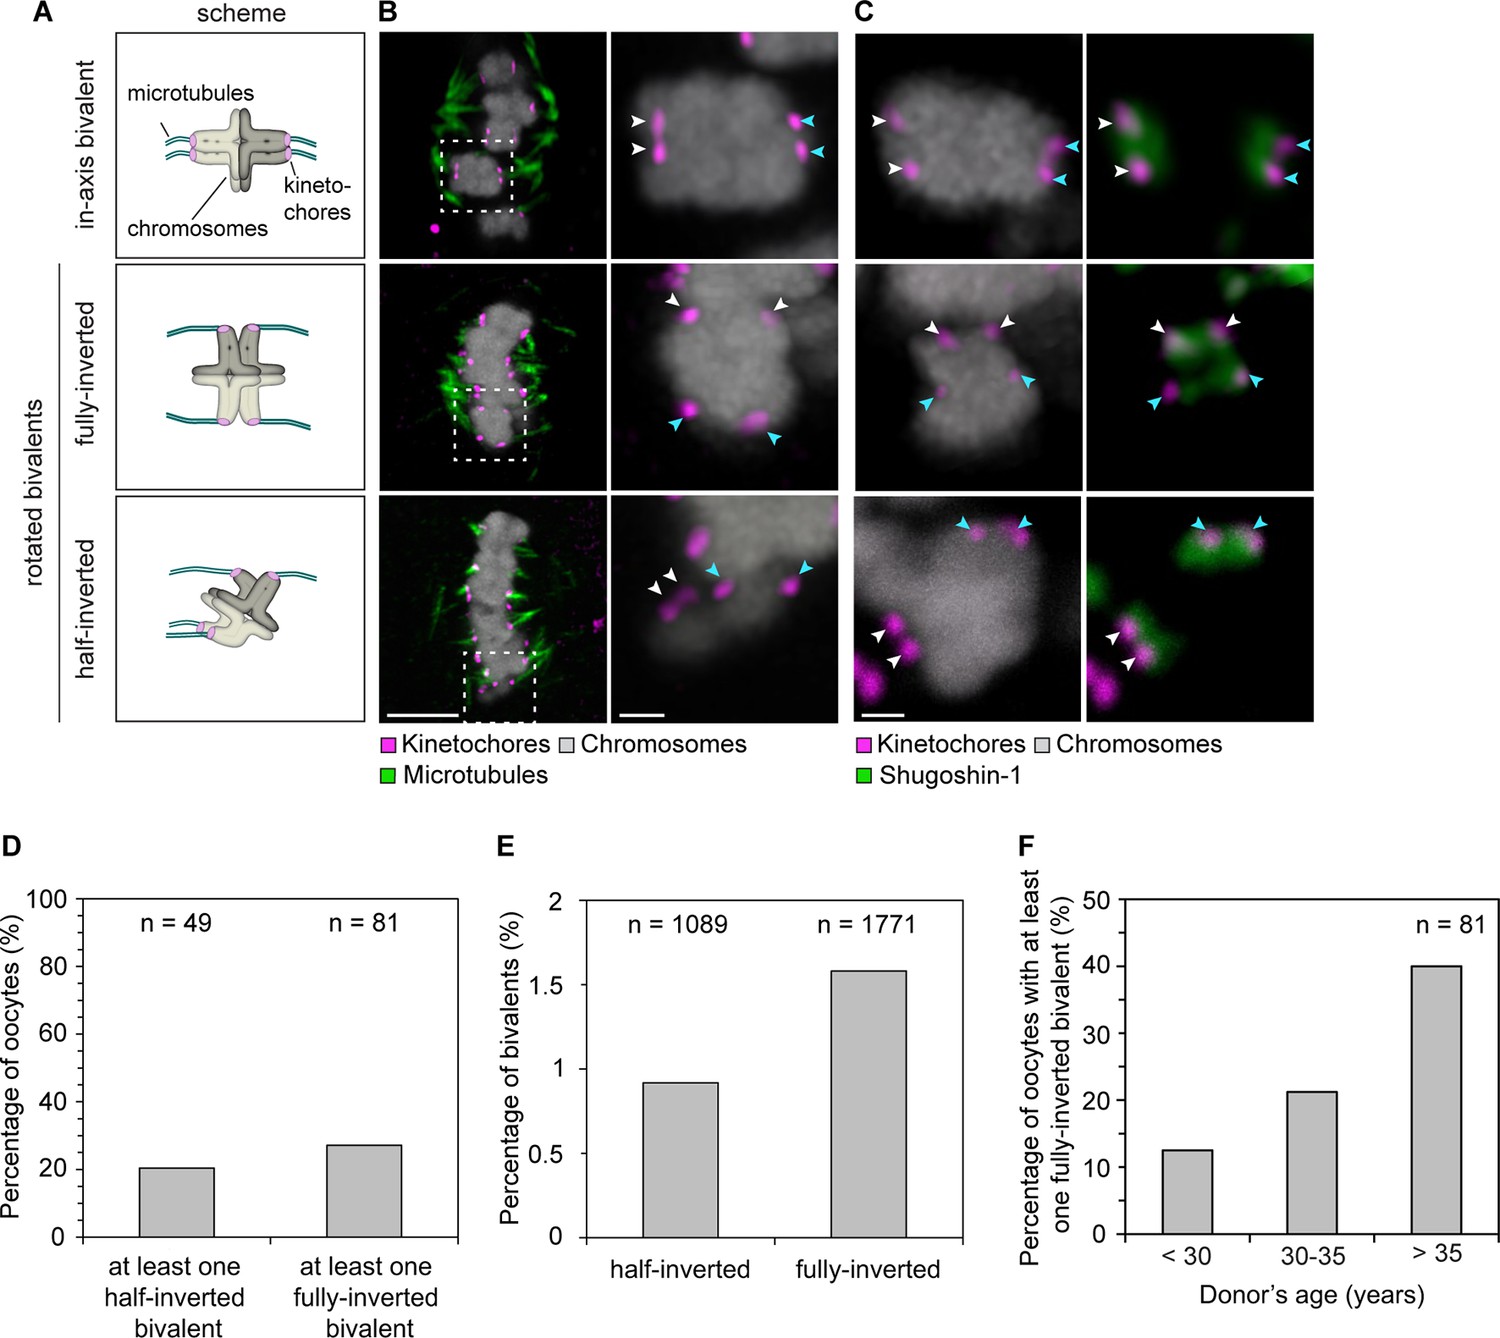
Sister kinetochore separation allows bivalents to rotate and twist on the meiotic spindle.
(A) Schematic representation of the possible orientations of bivalents on the meiosis I spindle. (B) Representative images of the different orientations that bivalents can adopt relative to the axis of the metaphase I spindle. Arrows of the same colour highlight sister kinetochores. Scale bar represents 5 µm, 1 µm in insets. (C) Representative images of Shugoshin-1 staining in bivalents rotated relative to the axis of the metaphase I spindle. Arrows of the same colour highlight sister kinetochores. Scale bar represents 1 µm. (D) Occurrence of one or more inverted bivalents in fully assembled metaphase I spindles. Half-inverted bivalents were scored only in oocytes subjected to cold treatment which selectively preserves kinetochore fibers and hence allows for detection of bioriented kinetochore pairs. Fully-inverted bivalents were scored both in cold-treated and non-treated meiosis I spindles. (E) Proportion of bivalents that are fully- or half-inverted on late metaphase I spindles. (F) Occurrence of fully inverted bivalents in oocytes from donors across all age groups.
Figure 3—figure supplement 1
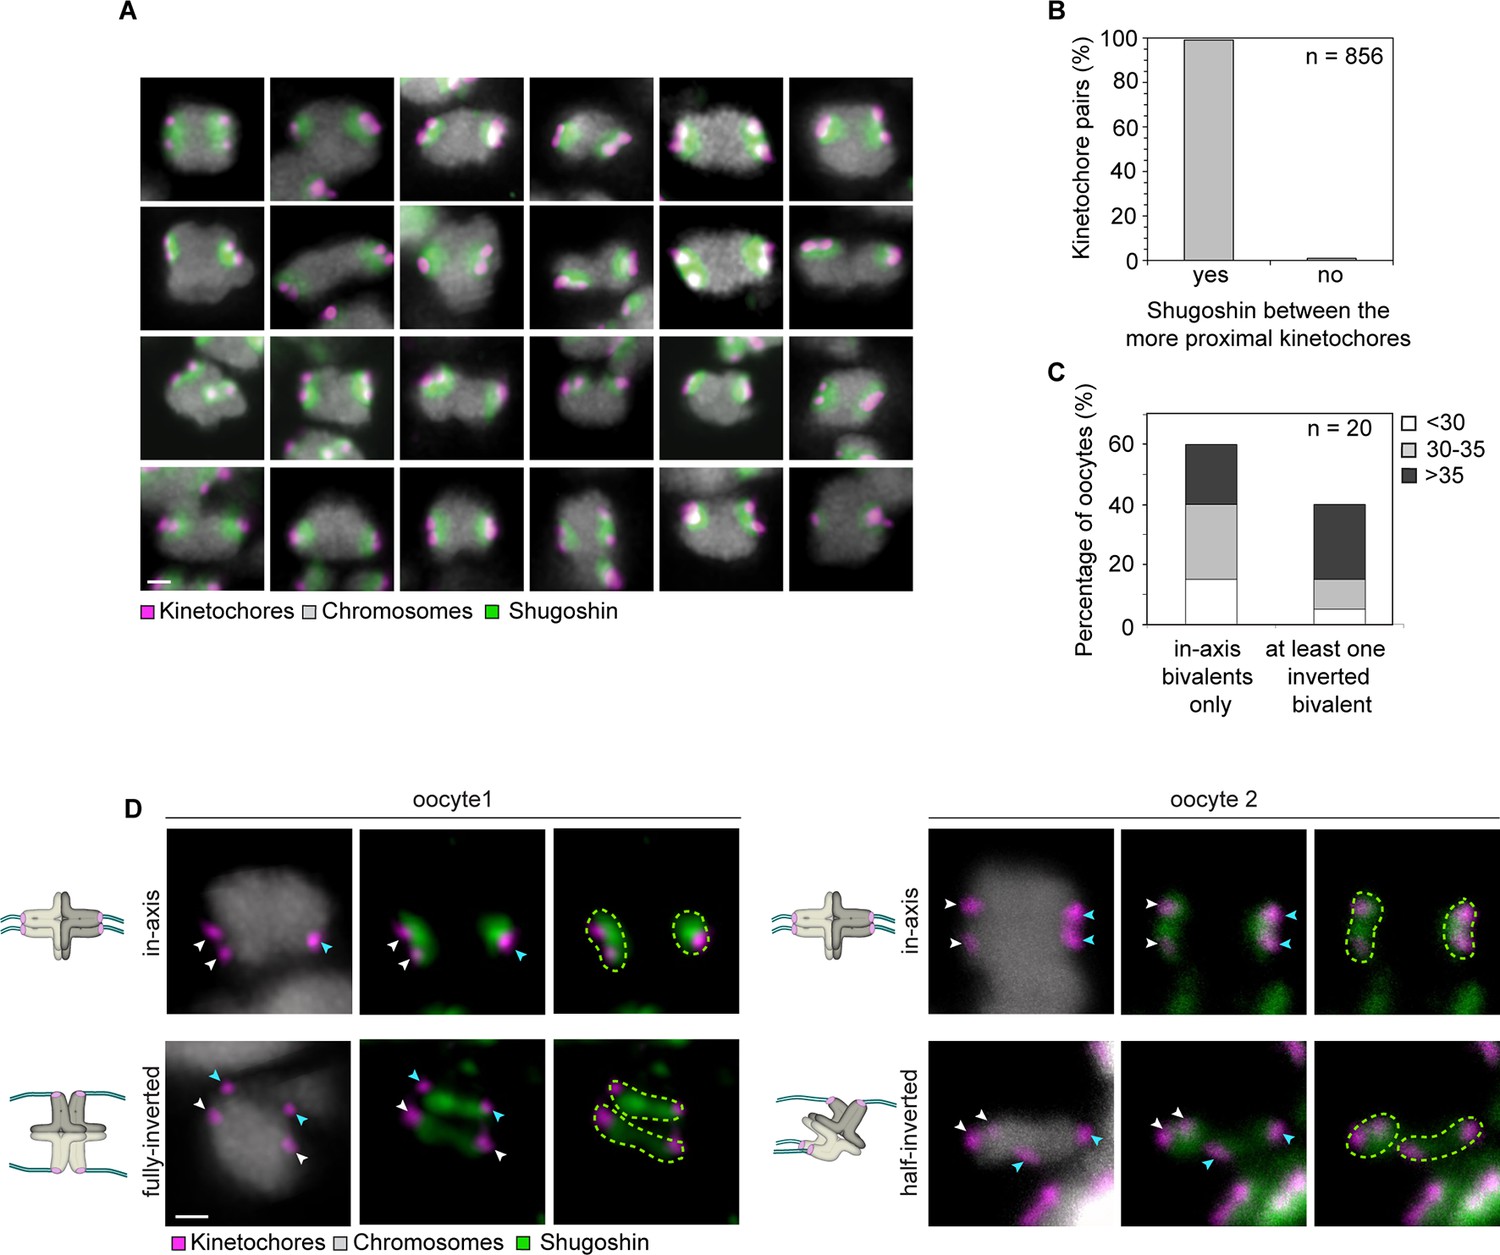
Shugoshin-1 is a reliable marker of sister kinetochores in meiosis I human oocytes and can be used to identify rotated bivalents.
(A) Representative images of Shugoshin-1 localization in bivalents from 10 oocytes. Scale bar represents 1 µm. (B) Distribution of Shugoshin-1 labelling relative to inter-kinetochore distance within bivalents from 20 meiosis-I oocytes. (C) Percentage of oocytes containing at least one fully-inverted bivalent. Inversion was scored based on inter-kinetochore distance and localization of Shugoshin-1 labelling. The majority of oocytes analysed were from donors older than 30 years. (D) Representative images and schematic diagrams of Shugoshin-1 labelling in inverted bivalents. For each inverted bivalent, an additional in-axis bivalent from the same spindle is shown for comparison. Arrows of the same colour highlight sister kinetochores. Scale bar represents 1 µm.
Figure 3—figure supplement 2
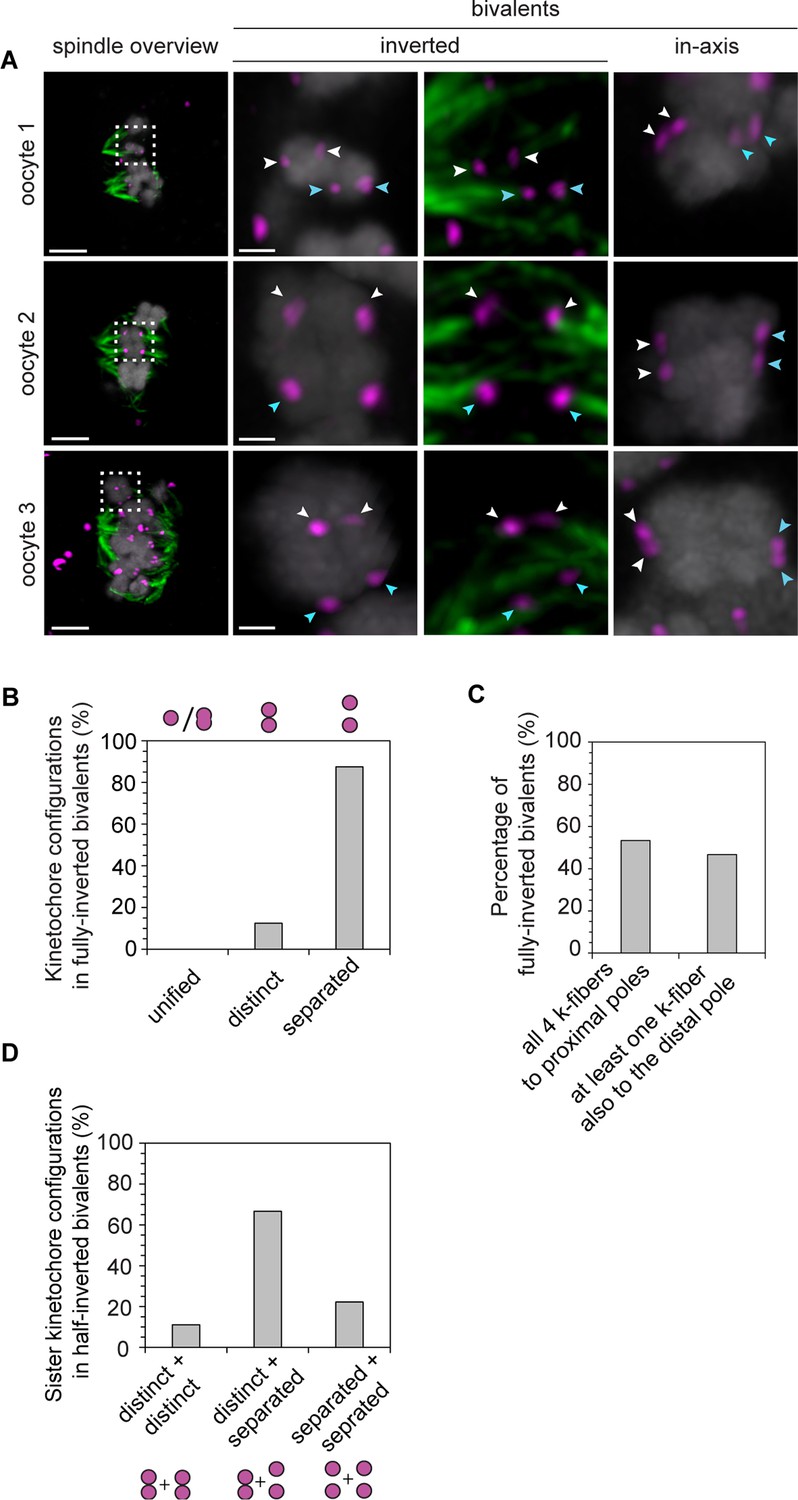
Despite their non-conventional geometry, rotated bivalents can form stable k-fiber attachments.
(A) Representative immunofluorescence images of in-axis and rotated bivalents in cold-treated human oocyte meiotic spindles. Chromosomes labelled with Hoechst. Arrows of the same colour highlight sister kinetochores. Scale bars represent 5 µm in overviews and 1 µm in insets. (B) Proportion of kinetochore configurations in fully-inverted bivalents in human oocytes. (C) Microtubule attachment states of each of the four kinetochores in rotated bivalents in cold-treated human oocyte spindles. (D) Configuration of kinetochore pairs in half-inverted bivalent chromosomes.
Figure 4
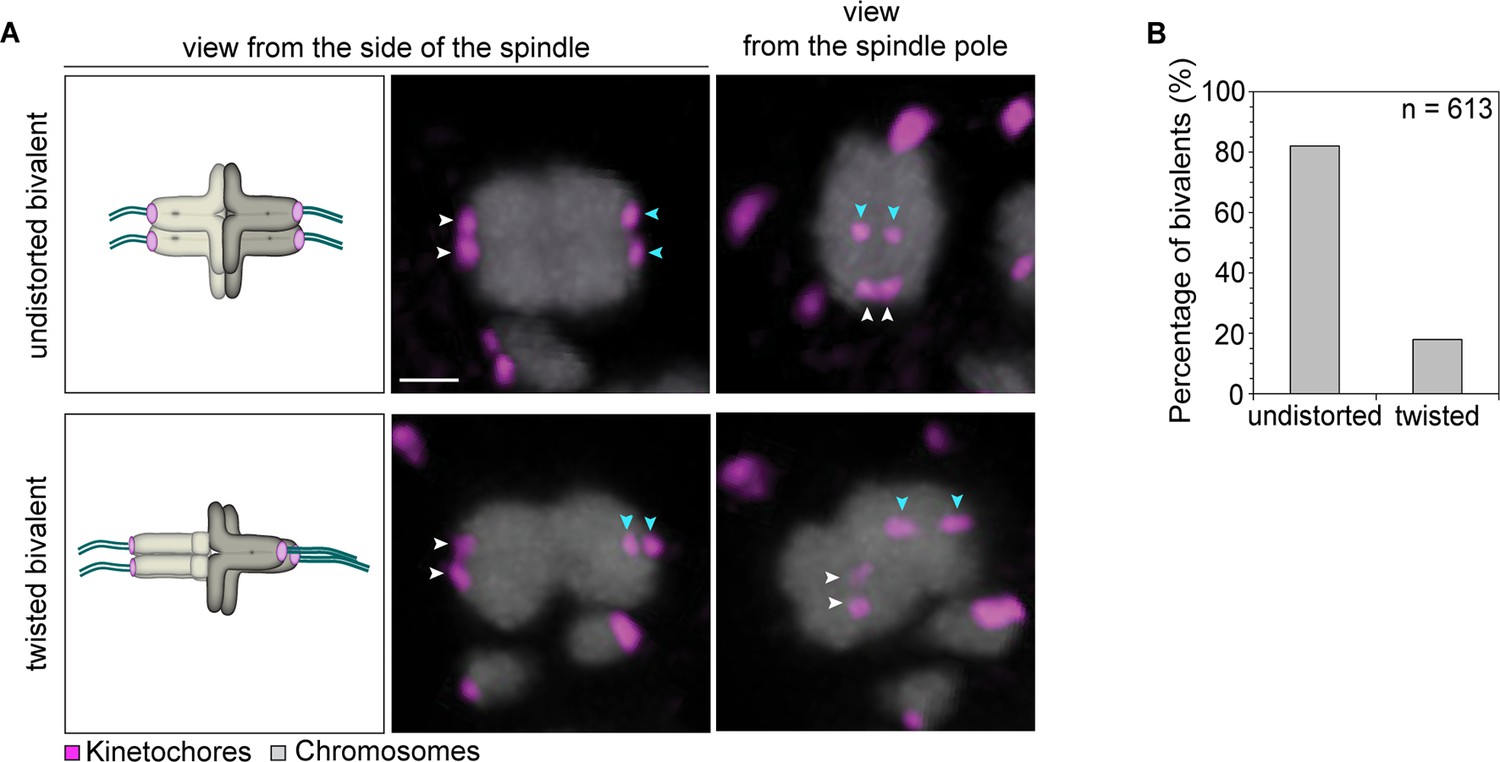
Kinetochore separation allows twisting of bivalents.
(A) Representative three-dimensional images and schematic illustrations of undistorted and twisted bivalent geometries. Arrows of the same colour highlight sister kinetochores. Scale bar represents 1 µm. (B) Geometric categories of bivalents displaying a split sister kinetochore configuration (defined in (1B)). Undistorted and twisted geometries were defined as bivalents with kinetochore pairs that are parallel and perpendicular to each other, respectively.
Figure 5
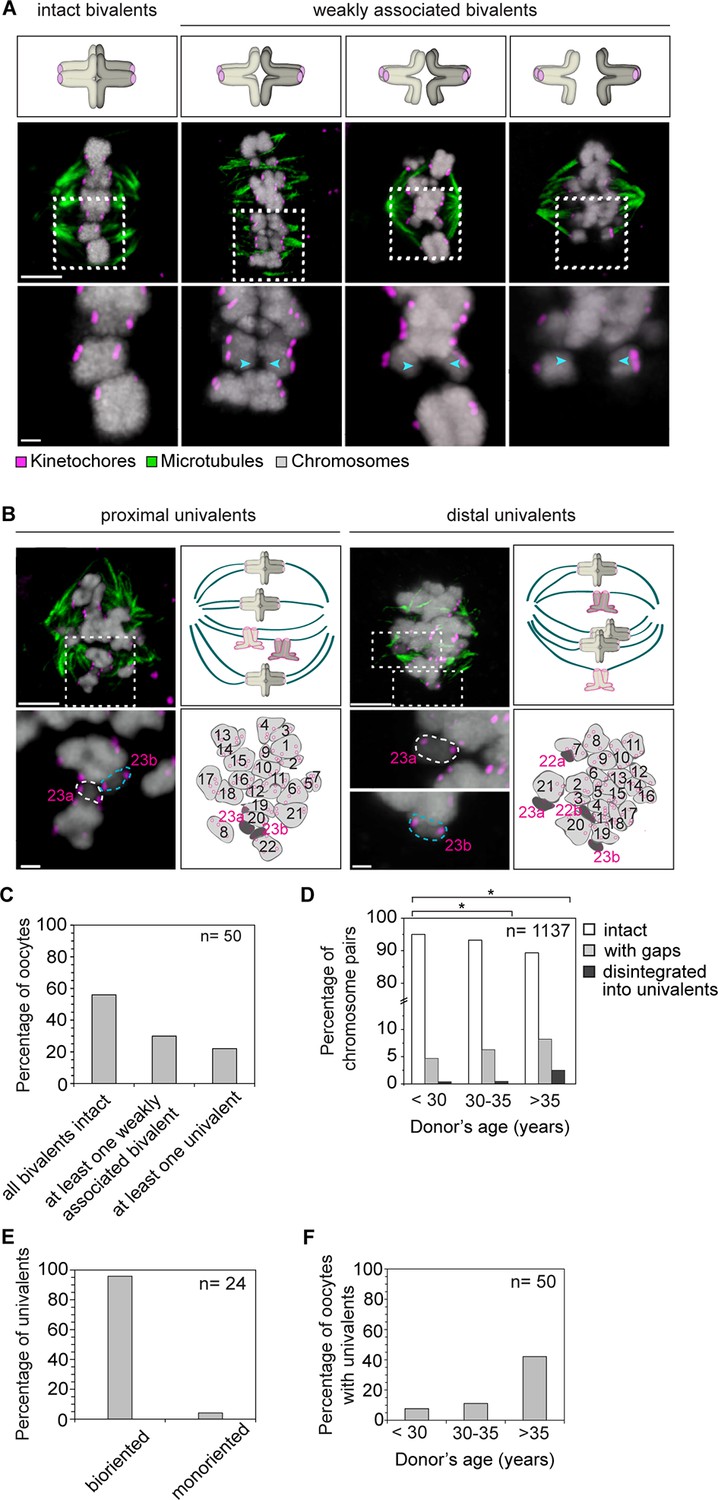
Precocious dissociation of bivalents into univalent contributes to aneuploidy.
(A) Illustrations and representative images of homologs showing gaps between weakly-associated bivalents (indicated by arrowheads). Scale bar represents 5 µm in overviews and 1 µm in insets. (B) Representative immunofluorescence images and illustrations showing complete disintegration of bivalents into two proximally or distally positioned univalents. Lower panel insets and cartoons show univalents (dark grey, numbered in magenta) and bivalents (light grey, numbered in black) that were determined by manual tracing and identification of homologs within the spindle. Scale bar represents 5 µm in overviews and 1µm in insets. (C) Quantification of weakened chromosome arm cohesion and bivalent disintegration in 50 human oocytes. (D) Proportion of intact, weakly-associated (with gaps) or disintegrated bivalents amongst 1,137 chromosomes across different age groups. * p≤0.05 (Fisher’s exact test). Significance analyses were performed for changes relative to <30 years old age group. (E) Proportion of univalents that achieved bi-orientation on the meiosis I spindle. (F) Proportion of human oocytes that contained at least one univalent pair across different age groups.
Figure 6 with 1 supplement
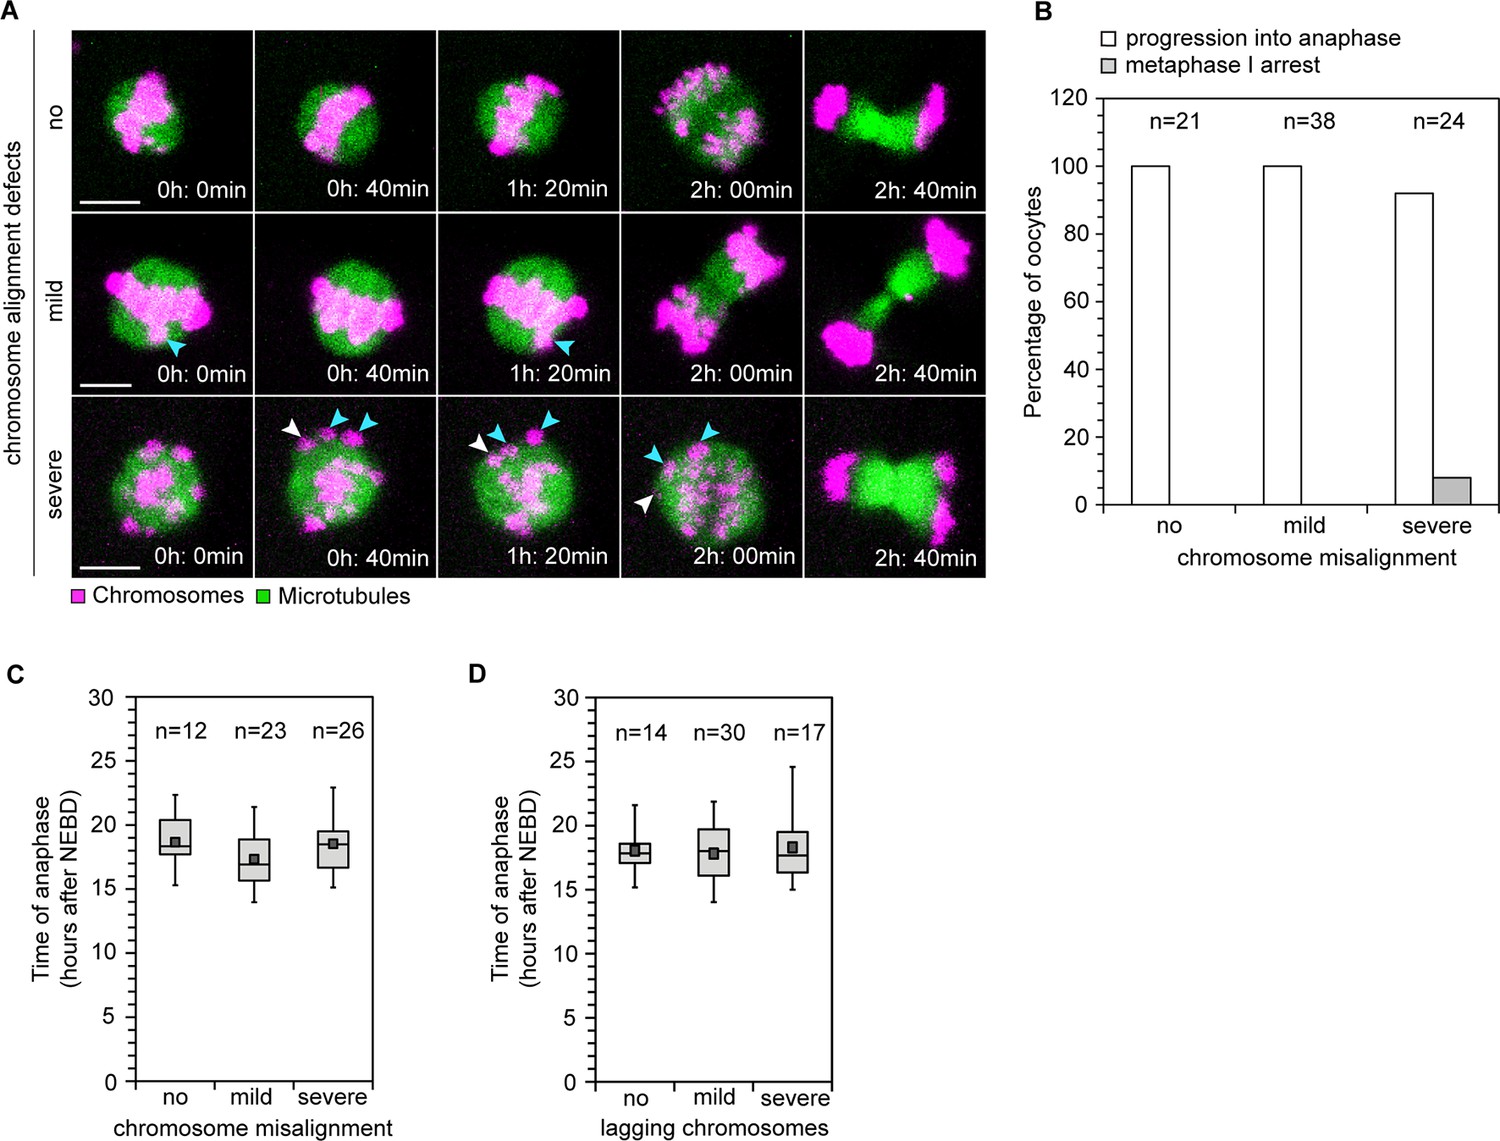
Efficiency and timing of anaphase progression are unaffected by chromosome alignment and segregation defects in human oocytes.
(A) Frames from time lapse movies of live human oocytes progressing through anaphase without alignment defects (row 1) and with misaligned chromosomes (row 2 and 3). Blue arrows indicate misaligned bivalents while white arrows point to bivalents that are located at spindle poles at anaphase onset. Time represented in 00 h: 00 min format. Scale bar represents 10 µm. (B) Efficiency of progression through anaphase relative to the presence and severity of chromosome alignment defects. (C) Timing of anaphase onset relative to severity of chromosome misalignment in live human oocytes. NEBD stands for Nuclear Envelope Breakdown. (D) Timing of anaphase onset relative to incidence of lagging chromosomes in live human oocytes.
Figure 6—figure supplement 1
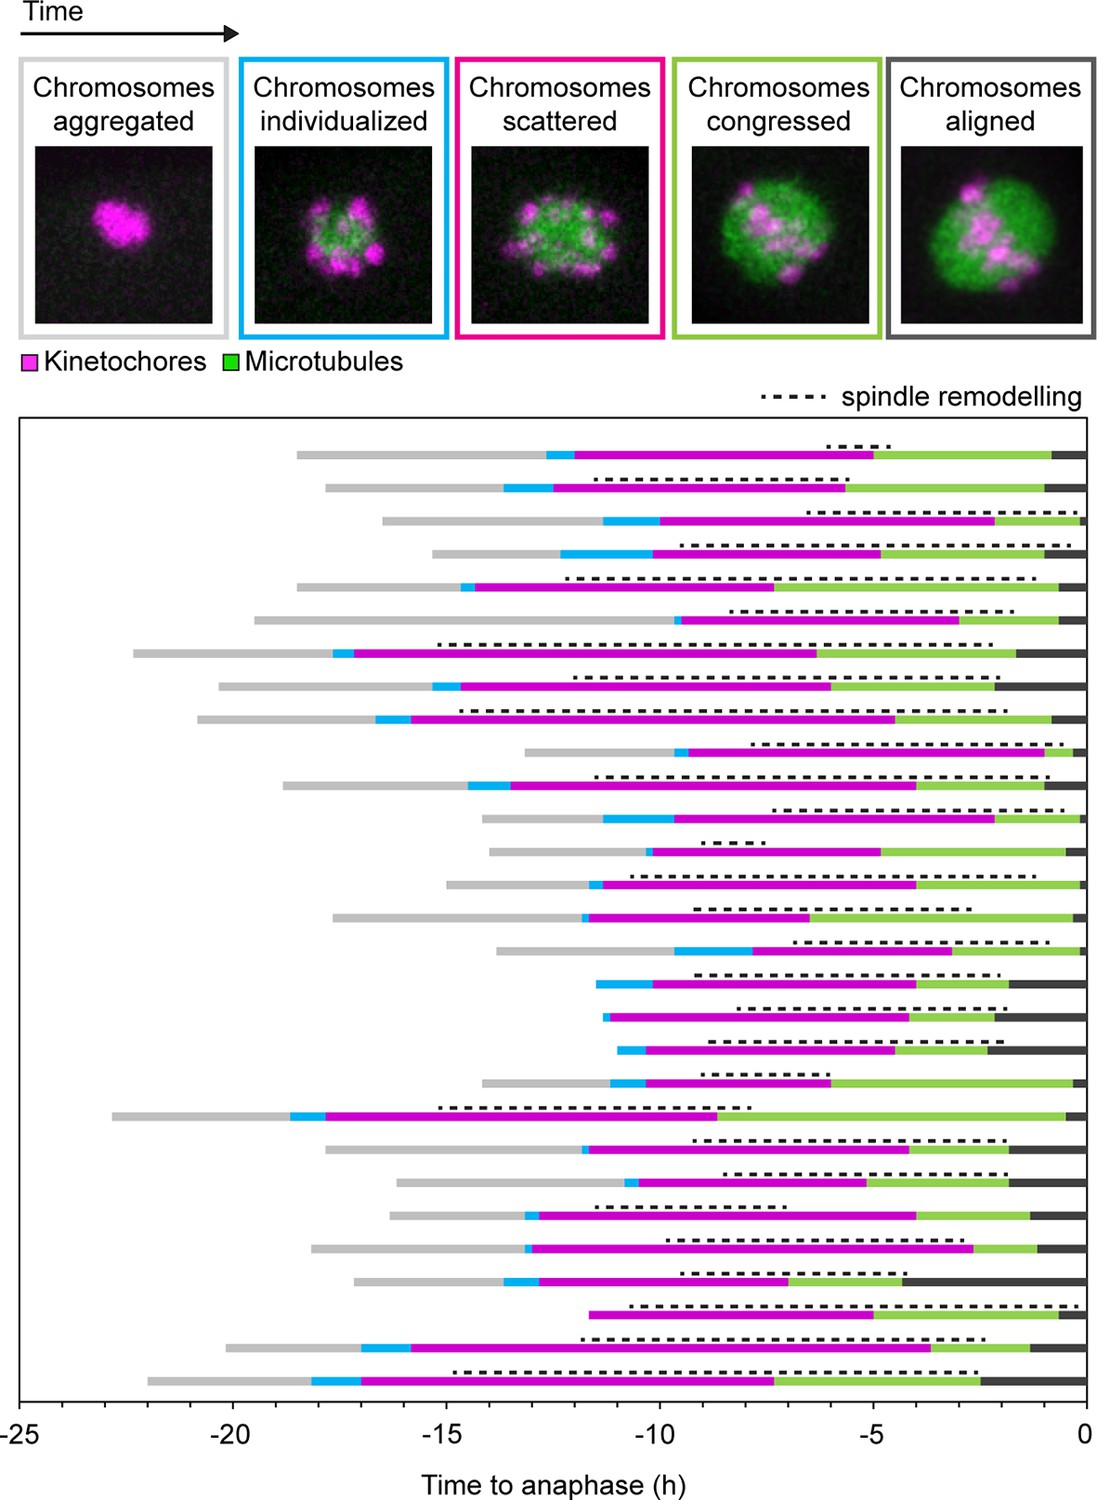
Spindle remodeling in human oocytes persists after chromosome congression and decreases following chromosome alignment.
States of chromosomes during meiotic progression in human oocytes and their relationship to spindle remodeling. Each of the colors in the coded time plots represents the state of chromosomes in a single oocyte progressing through meiosis I. Only oocytes that went through anaphase with no misaligned chromosomes were included in the analysis.
Figure 7

Schematic representation of bivalents with varying degree of rotation and their expected segregation outcomes following anaphase I.
https://doi.org/10.7554/eLife.11389.027Videos
Video 1
A projection through confocal sections of a meiosis I spindle in an oocyte from a young donor (24 years old) stained for microtubules (green), chromosomes (grey) and kinetochores (magenta).
https://doi.org/10.7554/eLife.11389.012
Video 2
A projection through confocal sections of a meiosis I spindle in an oocyte from an older donor (40 years old) stained for microtubules (green), chromosomes (grey) and kinetochores (magenta).
https://doi.org/10.7554/eLife.11389.013
Video 3
A projection through confocal sections of a meiosis II spindle in an oocyte from a young donor (23 years old) stained for microtubules (green), chromosomes (grey) and kinetochores (magenta).
https://doi.org/10.7554/eLife.11389.014
Video 4
A projection through confocal sections of a meiosis II spindle in an oocyte from an older donor (40 years old) stained for microtubules (green), chromosomes (grey) and kinetochores (magenta).
https://doi.org/10.7554/eLife.11389.015
Video 5
A projection through confocal sections of a meiosis I spindle in an oocyte stained for Shugoshin-1 (green), chromosomes (grey), kinetochores (magenta), and in which all bivalents are oriented in axis.
https://doi.org/10.7554/eLife.11389.019
Video 6
A projection through confocal sections of a meiosis I spindle in an oocyte stained for Shugoshin-1 (green), chromosomes (grey), kinetochores (magenta), and in which two bivalents are fully-inverted as indicated by Shugoshin-1 staining (marked with white arrows).
https://doi.org/10.7554/eLife.11389.020
Video 7
Time-lapse movie of a live human oocyte progressing through anaphase I with a misaligned chromosome at the spindle pole (white arrow).
Microtubules and chromosomes are labelled in green and magenta respectively.
Video 8
Time-lapse movie of a live human oocyte progressing through anaphase I with misaligned chromosomes (white and yellow arrows).
Microtubules and chromosomes are labelled in green and magenta respectively.
Download links
A two-part list of links to download the article, or parts of the article, in various formats.
Downloads (link to download the article as PDF)
Open citations (links to open the citations from this article in various online reference manager services)
Cite this article (links to download the citations from this article in formats compatible with various reference manager tools)
Sister kinetochore splitting and precocious disintegration of bivalents could explain the maternal age effect
eLife 4:e11389.
https://doi.org/10.7554/eLife.11389


