Genetic mechanisms control the linear scaling between related cortical primary and higher order sensory areas
- The Salk Institute for Biological Studies, United States
- University of California, San Francsisco, United States
Figures
Figure 1 with 1 supplement
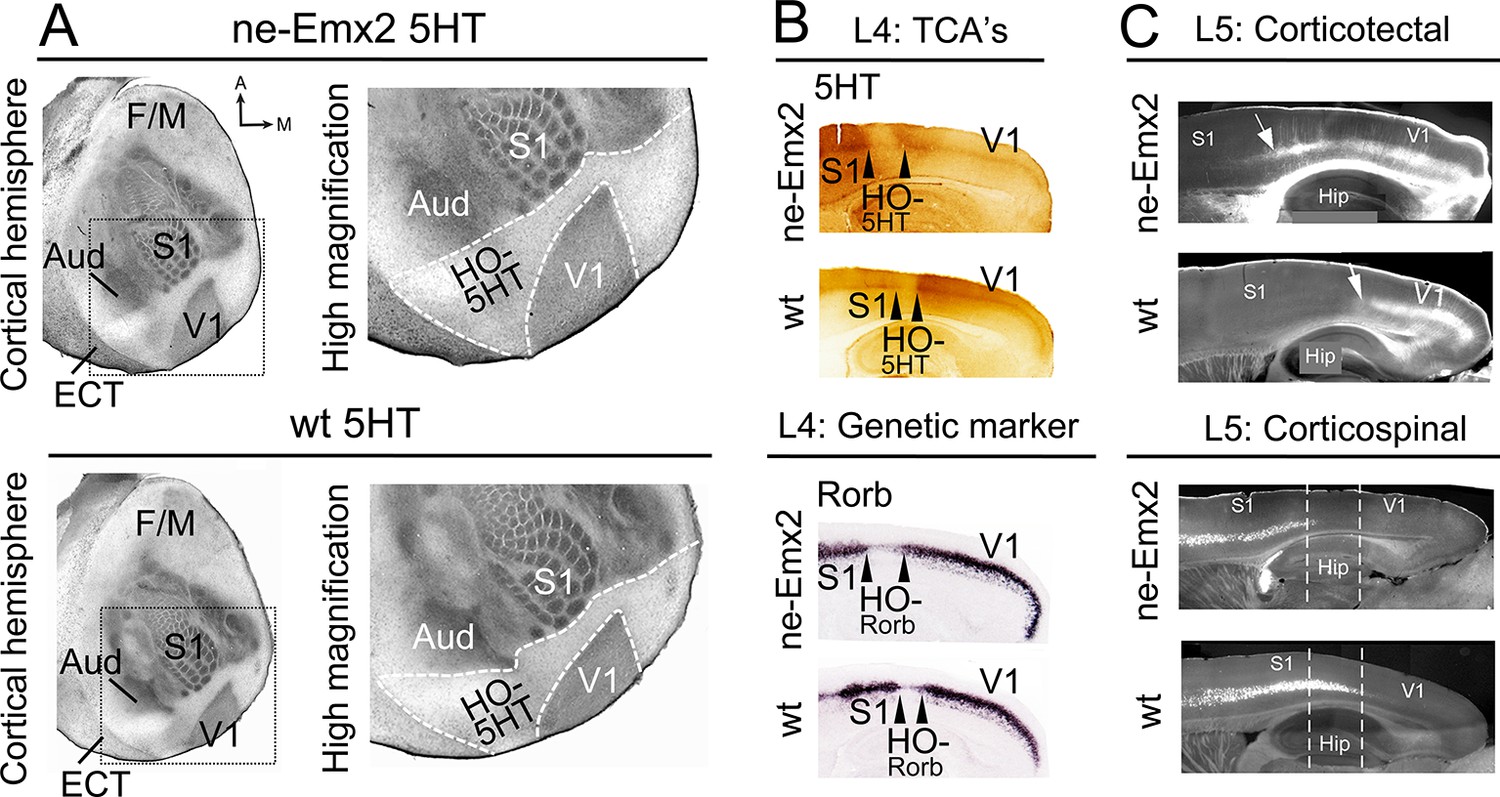
Increased V1 and higher order sensory area sizes in ne-Emx2 cortices
(A) Serotonin (5HT) staining on postnatal day (P) 7 tangential sections of the flattened cortex reveals targeting patterns of TCAs revealing primary sensory area borders and the border of the neocortex to the ECT. 5HT staining is not detectable in the region containing the retosplenial cortex and the higher order sensory areas surrounding V1 (HO-5HT). In Emx2-overexpressing brains (ne-Emx2), V1 and HO-5HT appear larger (compare dotted outlines in higher magnification images), compared to wt brains. (B) Targeting of TCAs in cortical layer 4 (L4) was revealed on P7 sagittal cortex sections by 5HT staining, whereas L4 genetic area borders were revealed by in situ hybridization for Rorb. In ne-Emx2 brains, the V1 border shifts anteriorly. Higher order areas surrounding V1 are characterized by low 5HT/Rorb staining (between arrowheads, HO-5HT and HO-Rorb), which in ne-Emx2 brains appear overall larger (compare area between arrowheads). (C) In L5, an expansion (see arrows) of corticotectal projection neurons (retrogradely labeled by DiI injections into the superior colliculus) is apparent in ne-Emx2 brains, to the expense (see dotted lines) of L5 corticospinal projection neurons (retrogradely labeled by DiI injections into the pyramidal decussation). Main axes: A: anterior; M: medial; F/M: frontal/motor cortex; S1: primary somatosensory cortex; Aud: auditory areas; V1: primary visual cortex, ECT: entorhinal cortex. 5HT, serotonin; L5, cortical layer 5; TCAs, thalamocortical axons; wt, wildtype.
Figure 1—figure supplement 1
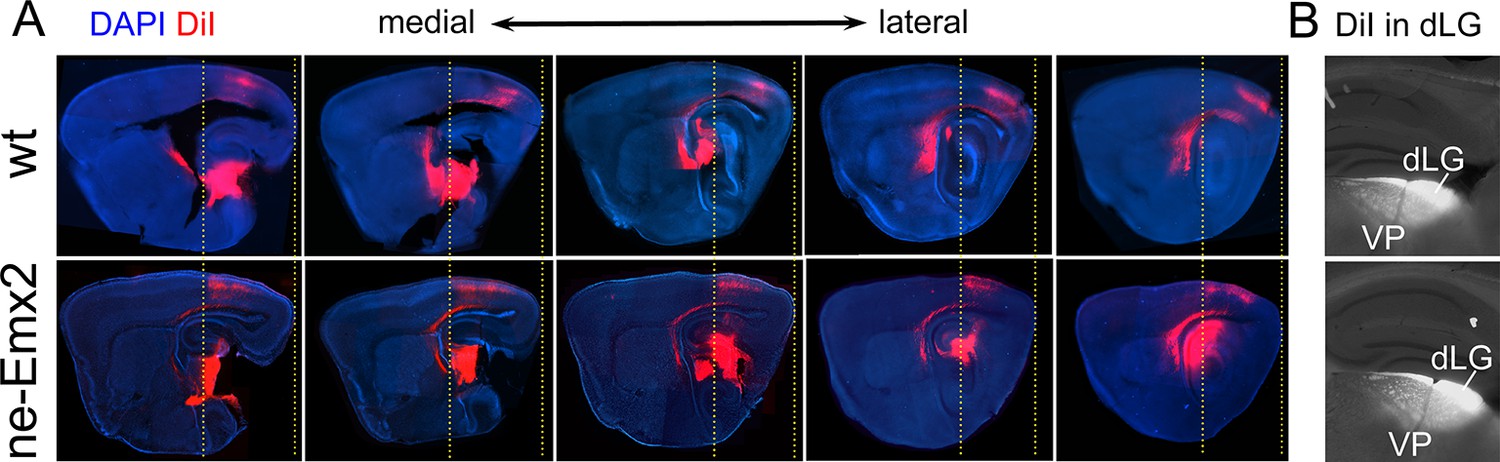
Anterior shifted cortical boundary formed by TCAs from the dLG in ne-Emx2 brains.
(A) In P7 brains, DiI (red dye) crystals were inserted into the thalamic dorsal lateral geniculate nucleus (dLG) to label the projections of TCAsinto the primary visual cortex (V1). In sagittal sections at five different medial to lateral levels, TCAs in Emx2-overexpressing brains (ne-Emx2) extend more anteriorly, compared to wt brains (compare dotted lines). Across genotypes, DiI labeling shows a sharp border to DiI-negative cortical tissues. (B) Images show representative DiI staining close to the injection sites in the dLG revealing robust and comparable dye filling in the dLG in wt and ne-Emx2 brains. dLG, dorsal lateral geniculate nucleus; TCA, thalamocortical axons; wt, wildtype.
Figure 2
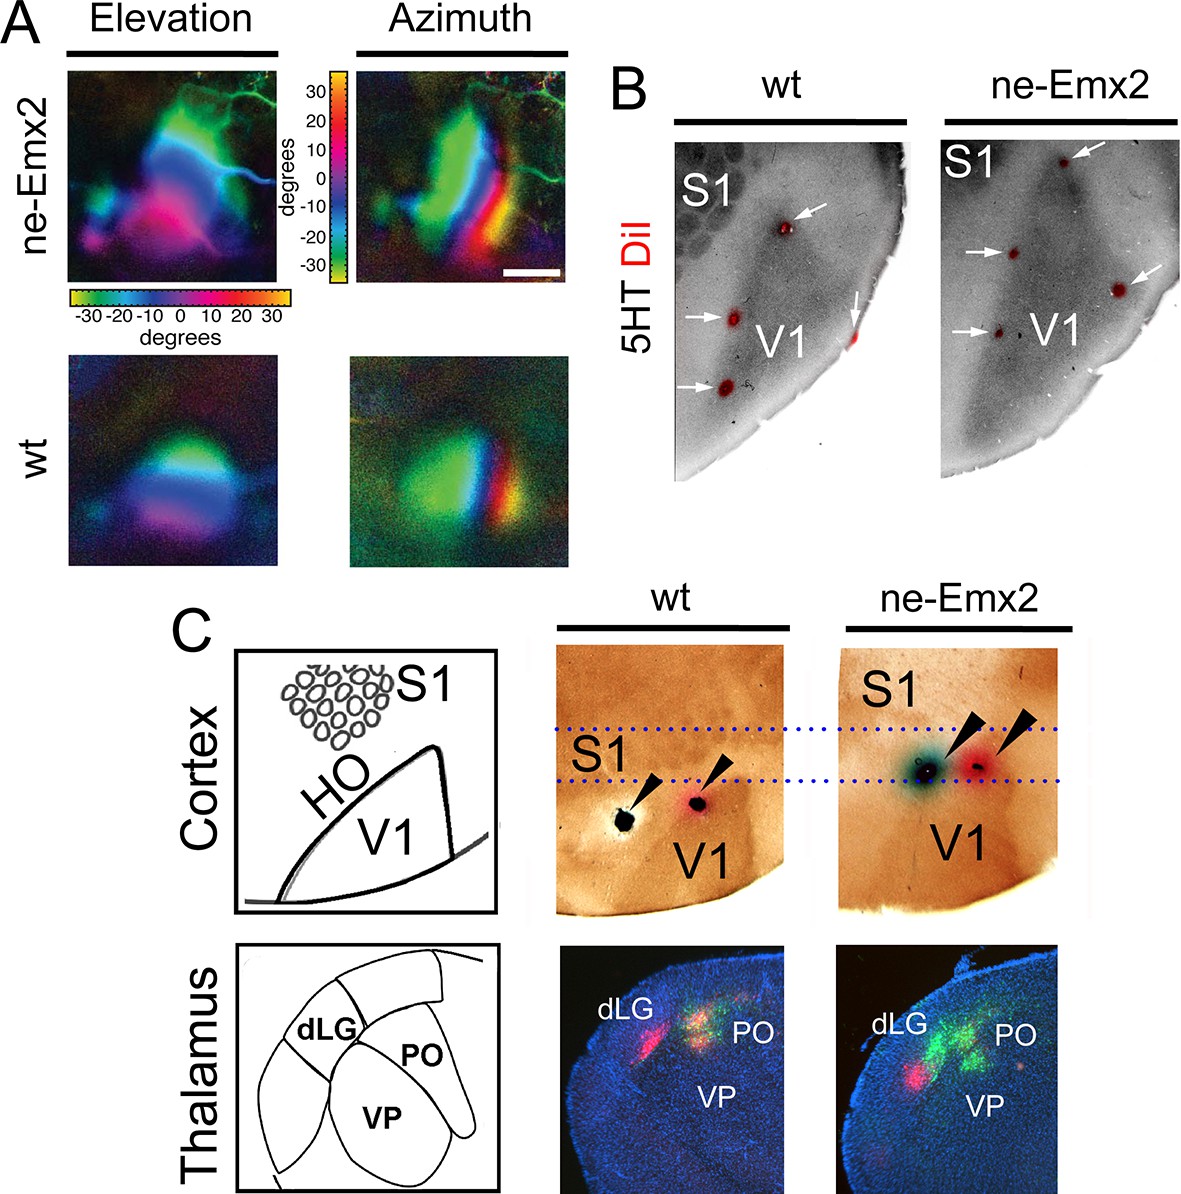
Enlarged functional V1 topographic maps in ne-Emx2 mice.
(A) Fourier intrinsic signal optical imaging reveals topographic visual response maps to light bars that were moved across the visual field of the retina (up and down: elevation maps; left to right: azimuth maps). Visual responses in V1 produced intrinsic signal maps that were indistinguishable in strength and the color-coded axes of azimuth and elevation were organized in the same way in all tested brains (wt: n = 6, ne-Emx2: n = 6). The elevation/azimuth representations were expanded in ne-Emx2 animals, revealing that overall their V1 retinotopic maps were larger. (B) 5HT staining performed on flattened tangential cortex section reveals cortical area borders including V1. On representative images (n = 6 per genotype), the red dots lining the perimeter of the 5HT-stained V1 indicates DiI injection sites that were made after the recordings adjacent to the border of the derived V1 intrinsic response maps, determined by Fourier intrinsic optical imaging. (C) Schematics depict caudal cortical sensory areas and main sensory thalamus divisions. In wt brains (n = 15), cortical dual tracer injections (red tracer (DiI) injected around V1/HO border; green tracer (DiD) into HO; injection site location (arrowheads) was identified by 5HT staining) showed retrogradely labeled red cells in the dLG and the PO, whereas green labeled cells were only present in the PO. Dotted lines show that dual tracer injections in ne-Emx2 brains (n = 17) were administered at more anterior coordinates (red tracer into V1; green tracer around the V1/HO border) compared with wt brains. In ne-Emx2 brains, retrogradely labeled red cells were apparent in the dLG, whereas green cells were present in the dLG and the PO, revealing normal thalamocortical connectivity patterns, but an anterior shifted V1/HO border in ne-Emx2 brains. 5HT, serotonin; dLG, dorsal lateral geniculate nucleus; PO, posterior thalamic nucleus; S1, primary somatosensory cortex; VP, ventroposterior nucleus; V1, primary visual cortex; wt, wildtype.
Figure 3 with 2 supplements
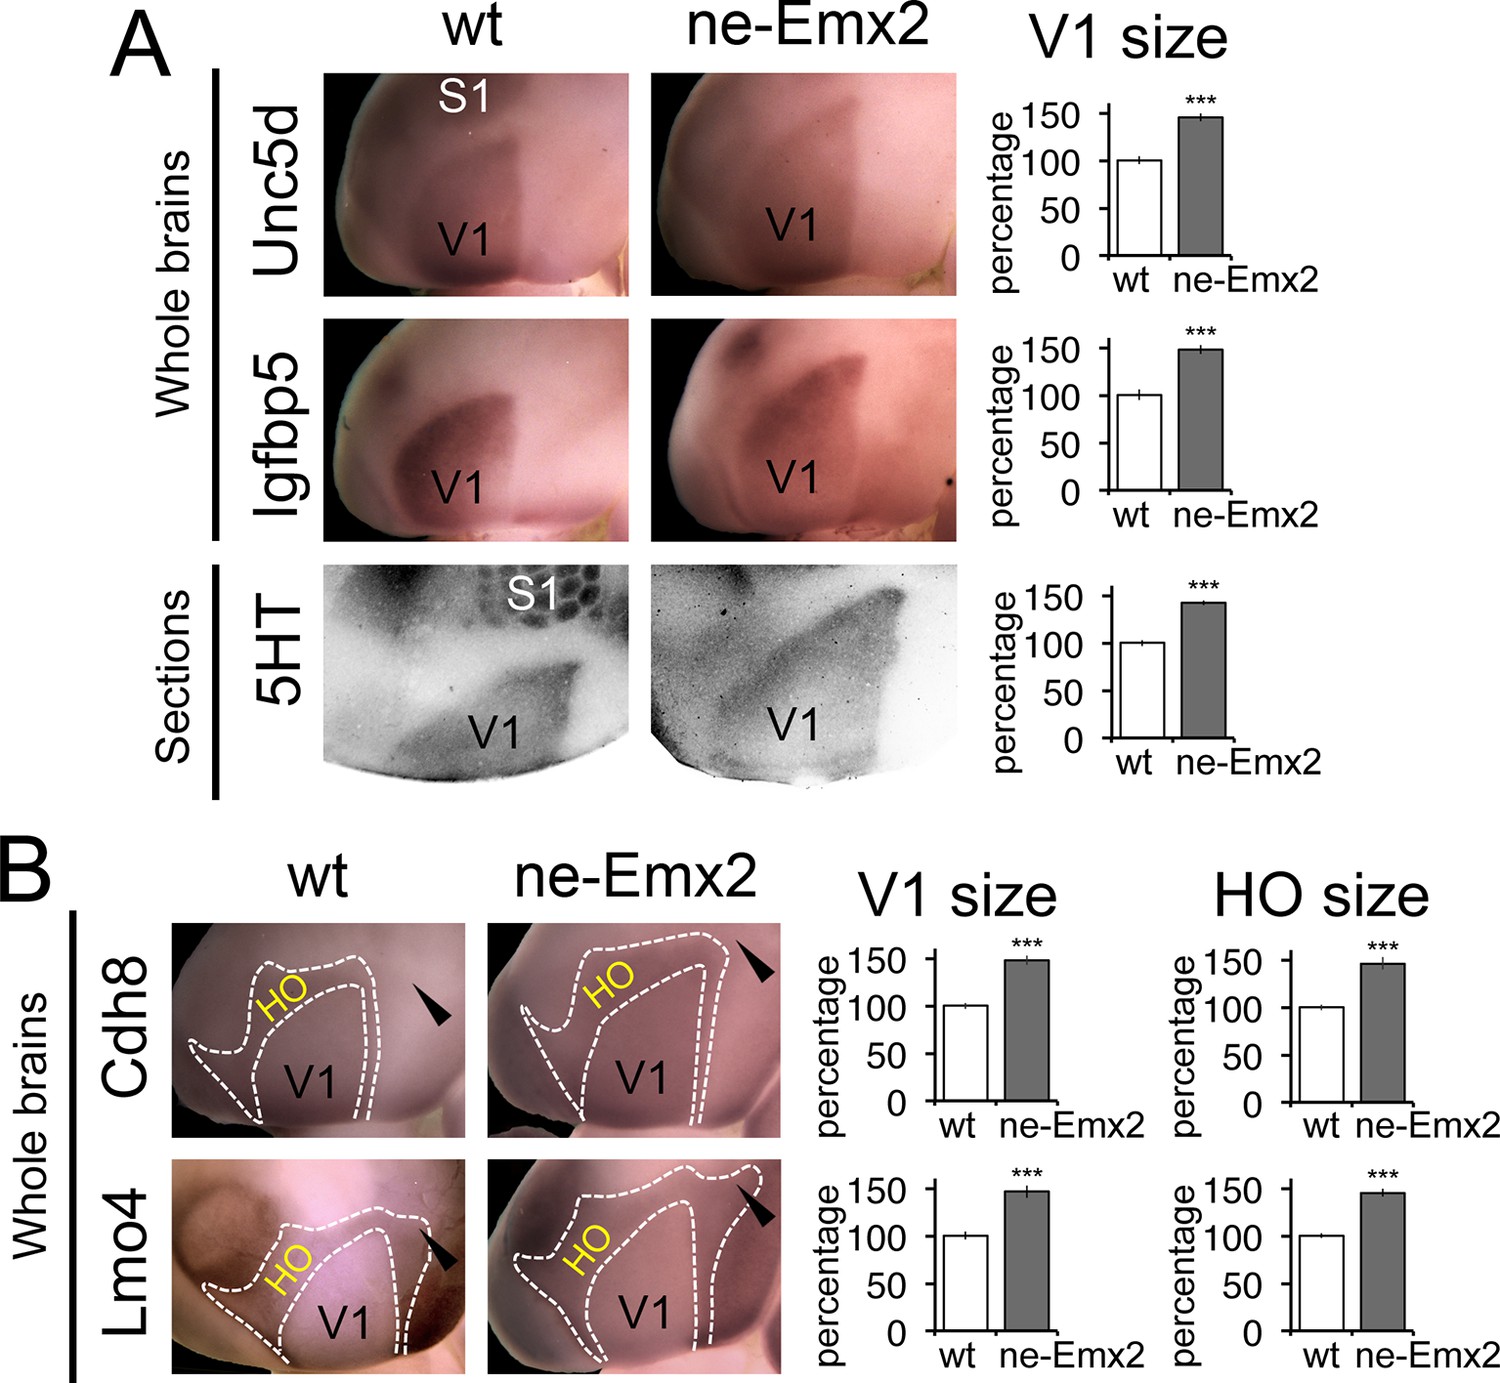
Proportionally increased V1 and HO sizes in ne-Emx2 cortices.
(A) Schematic shows sensory area outlines in the caudal neocortex (12). WMISH with the molecular V1 marker genes Unc5d (wt: n = 5, ne-Emx2: n = 6) and Igfbp5 (wt: n = 11, ne-Emx2: n = 6) at P7 highlights increased V1 size in ne-Emx2 brains using whole un-sectioned brains. Quantification of V1 size using 5HT-stained P7 flattened cortical sections similarly reveals larger V1 sizes in ne-Emx2 brains (n = 11), compared to wt brains (n = 13). (B) WMISH for molecular markers that label both V1 and HO (dotted outlines: Cdh8, Lmo4: high expression in HO, lower in V1; for each probe and genotype n = 6) reveal that V1 as well as HO sizes in ne-Emx2 are larger compared with wt brains. Cdh8 is not expressed around the anteromedial edge of V1 (arrowheads). Quantifications in Figures 3 and 4 show mean values as percent of wt, error bars indicate standard error of the mean; asterisks highlight statistical significance according to unpaired to t-test. 5HT, serotonin; S1, primary somatosensory cortex; WMISH, whole mount in situ hybridization; V1, primary visual cortex; wt, wildtype.
Figure 3—figure supplement 1
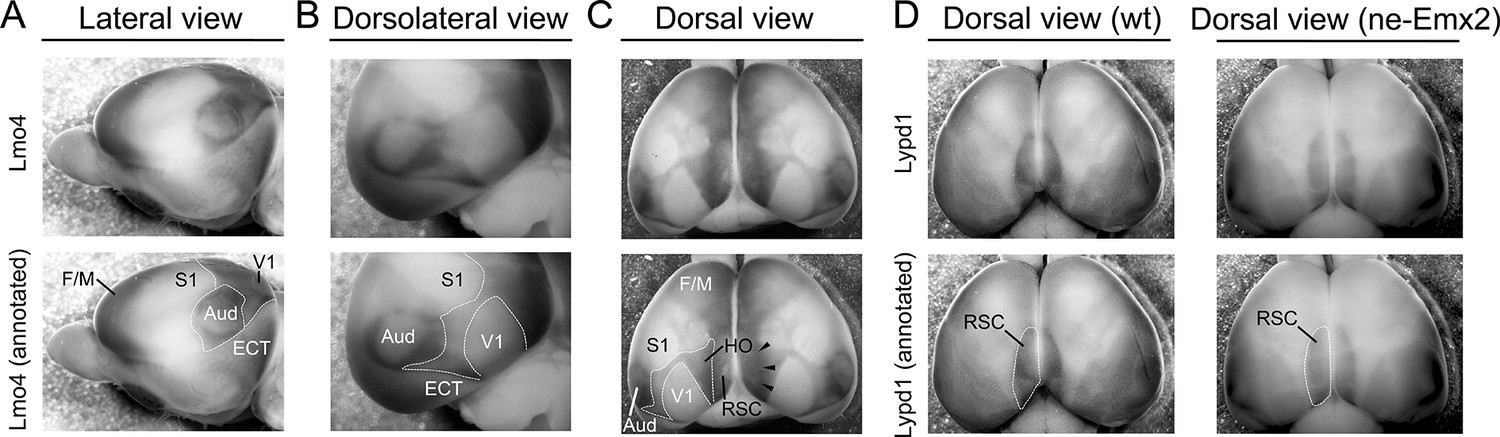
Lmo4 expression delineates primary and higher order cortical area boundaries in whole mount brains.
(A) WMISH for Lmo4 using P7 brains reveals gene expression borders that delineate cortical regions. Their approximated outlines are annotated in the lower panels (A-D: dotted lines). Using images showing a lateral view of the brain, auditory areas (Aud) can be delineated by a ring of strong Lmo4 expression. Similarly, a line of strong Lmo4 expression delineates the border between the neocortex and theECT. The perimeter of the primary visual cortex (V1) cannot be clearly seen in the lateral view. (B) In the dorsolateral view, Lmo4 expression readily reveals the ECT and auditory area outlines. In addition, the V1 dimensions and the caudal border of the primary somatosensory cortex (S1) are clearly identifiable. (C) In the dorsal view, primary cortical area borders are identifiable using Lmo4 staining. In addition, lower Lmo4 expression domains in the caudal cortex appear to outline a cortical region that includes higher order visual areas around V1. In addition, this region (HO) contains adjacent cortical areas like the ventral posterior temporal cortex up to the border of the auditory areas and ECT but seem to exclude the retrosplenial cortex (RSC) medially, which appears to be delineated by a narrow higher expression stripe of Lmo4 (arrowheads). (D) Lypd1 expression is low in F/M cortex, S1 and V1, but very strong around the medial cortical pole, where its expression appears to overall overlap with the RSC. Comparing Lypd1 and Lmo4 expression in the medial cortex suggests that the outlined HO in (C) and in Figures 3–4 do not contain much of the RSC. The Lypd1 gene expression domain around the RSC in ne-Emx2 brains appears enlarged compared with wt brains. Aud, auditory areas; ECT, entorhinal cortex; F/M, frontal/motor; RSC, retrosplenial cortex; S1, primary somatosensory cortex; V1, primary visual cortex; wt, wildtype.
Figure 3—figure supplement 2

Lmo4 and Cdh8 expression marks primary and caudal extrastriate cortical regions.
(A) Primary cortical area borders are apparent by Lmo4 staining on WMISH brains at P7. (A-B: raw images in upper panels, annotated images in lower panels). The low Lmo4 expression domain in the caudal cortex appears to outline a joint HO that contains higher order visual areas around V1 and the ventral posterior temporal cortex up to the borders to the auditory areas and ECT laterally, but seem to exclude the RSC medially. In ne-Emx2 brains the Lmo4-positive HO complex overall appears larger than compared to wt brains. (B) Low Cdh8 expression labels V1, which is surrounded by a domain of higher Cdh8 expression labeling higher order visual areas between V1 and S1 in the medial cortex up to the borders to the auditory areas laterally and the ECT cortex caudally, respectively. In ne-Emx2 brains the Cdh8-positive HO complex overall appears larger compared to wt brains. Aud, auditory areas; ECT, entorhinal cortex; F/M, frontal/motor; RSC, retrosplenial cortex; S1, primary somatosensory cortex; V1, primary visual cortex; WMISH, whole mount in situ hybridization; wt, wildtype.
Figure 4 with 4 supplements
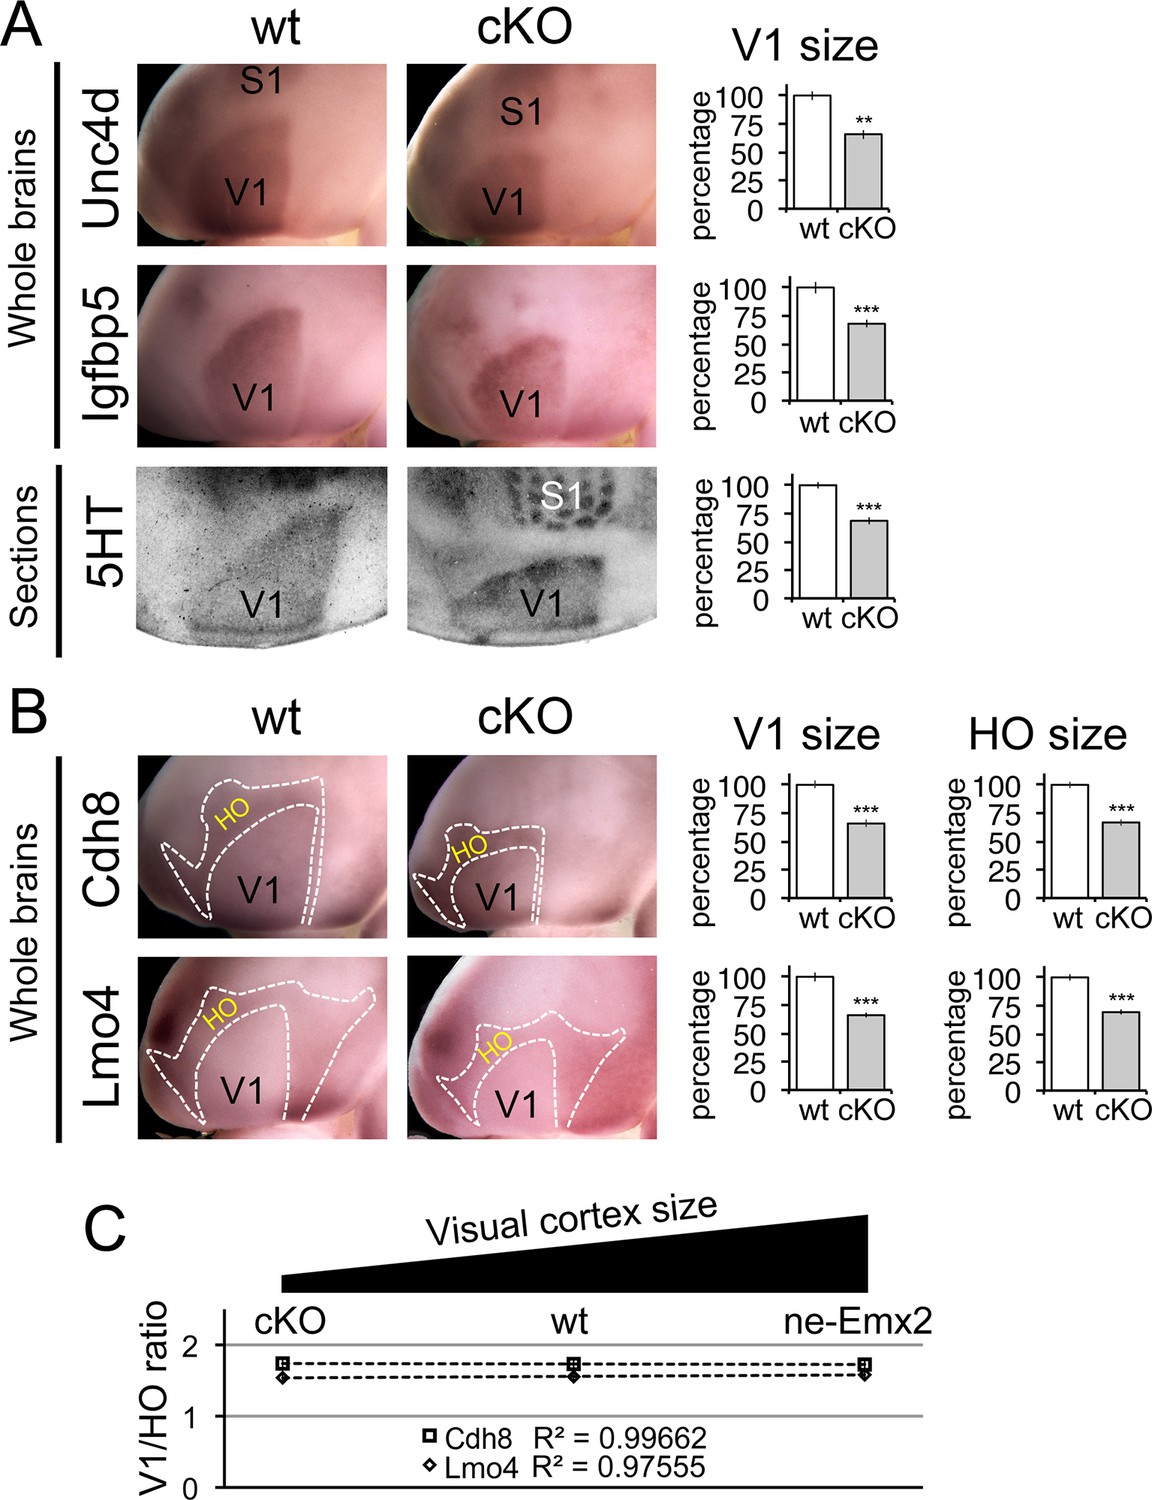
Proportionally decreased V1 and HO sizes in cKO cortices.
WMISH for V1 (A: Unc5d; wt: n = 5, ne-Emx2: n = 6, Igfbp5; wt: n = 11, ne-Emx2: n = 8) or V1 and HO marker genes (B: Cdh8; wt: n = 6, ne-Emx2: n = 6; Lmo4; wt: n = 5, ne-Emx2: n = 5) at P7 conversely reveals decreased sizes (~70% of wt size) of V1 and HO in brains that were derived from Emx1-IRES-Cre-mediated cortex-specific conditional Emx2 mutant brains (cKO), compared with wt brains. Quantification of V1 size using 5HT staining on P7 flattened cortical sections (A: wt: n = 15, cKO: n = 10) reveals similar reductions of V1 size in cKO brains. (C) The ratio between quantified V1 and HO sizes derived from WMISH-stained brains with decreased (cKO), normal (wt), and increased (ne-Emx2) V1 sizes demonstrates linear scaling of HO size in response to bi-directional changes of V1 size. S1, primary somatosensory cortex; V1, primary visual cortex; WMISH, whole mount in situ hybridization; wt, wildtype.
Figure 4—figure supplement 1

Generation of Emx2-floxed mice and confirmation of cortex specific Emx2 deletion.
(A) Targeting strategy of the Emx2 locus: Blue shapes indicate exons of the Emx2 gene. Red and yellow triangles indicate LoxP and FRT sites. RV, EcoRV; H, HindIII indicate restriction enzyme cutting sites. The targeting construct included LoxP sites flanking Emx2 exons 1 and 2 followed by a FRT-site-flanked PGK-Neo cassette. (B) Southern blot hybridization of wt and Emx2 floxed heterozygous (+/–) embryonic stem cell clones with probes A, B, and C (denoted by green arrows in A). Blots of HindIII digested genomic DNA that were hybridized with probe A revealed a 14kb Emx2 wt band and a 10 kb Emx2 floxed band. EcoRV digestion and hybridization with probe B revealed a 5.5kb Emx2 wt band and a 1.7 kb Emx2 floxed band. EcoRV digestion and hybridization with probe C revealed a 8.5kb Emx2 wt band and a 7.5kb Emx2 floxed band. (C) Genomic DNA from wt and Emx2 heterozygous (+/–) embryonic stem cell clones was amplified by PCR using combinations of the primers (F1, R1, F2, R2, genomic location indicated in A) revealing a Emx2 wt PCR product (~300 bp) and a Emx2 floxed PCR product (~400 bp). (D) WMISH at E11 using a Emx2 probe showed that Emx2 expression was intact in the entire embryo in homozygous Emx2 floxed embryos (Emx2fl/fl: considered as wt control). Conversely, WMISH using Emx1-IRES-Cre-mediated conditional Emx2 knock out animals (Emx2fl/fl- Emx1-IRES-Cre+: cKO) reveals specific deletion of Emx2 activity from cortical progenitors in the dTel, while leaving Emx2 expression in the rest of the embryo intact. dTel, dorsal telencephalon; PCR, polymerase chain reaction; WMISH, whole mount in situ hybridization; wt, wildtype.
Figure 4—figure supplement 2
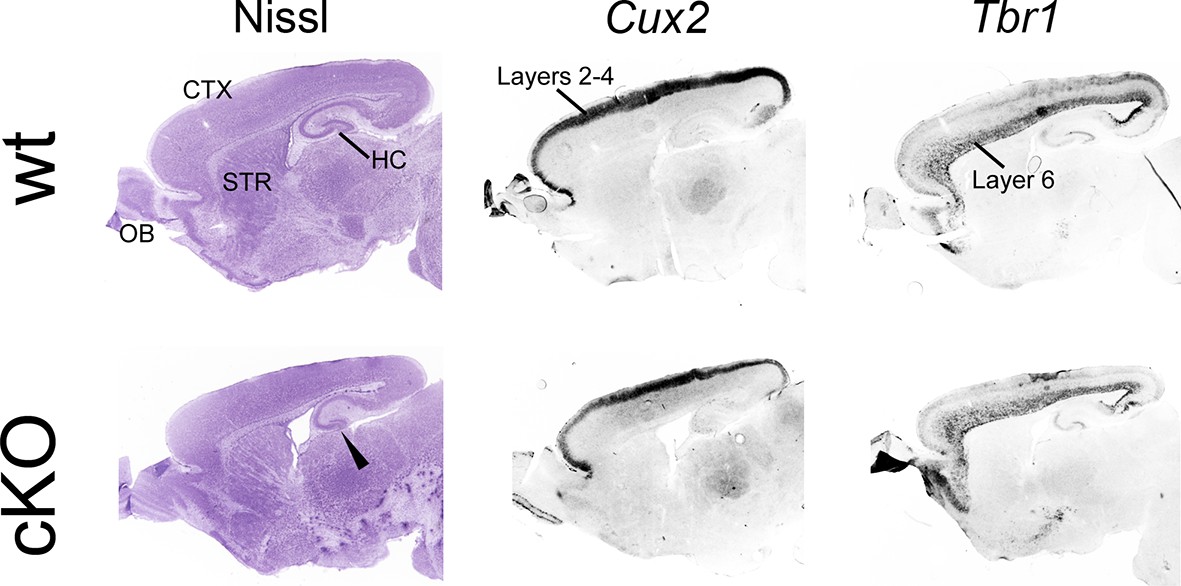
Normal cortical neuroanatomy in cKO brains.
On P7 sagittal sections, Nissl staining was performed to reveal neuroanatomy. Major forebrain structures are annotated in the wt section. In addition, ISH for the layer-specific marker genes Cux2 (layers 2-4) and Tbr1 (layer 6) was carried out. All stains reveal comparable cortical neuroanatomy and comparable cortical layering across genotypes. The only apparent neuroanatomical difference in cKO brains is that the hippocampus appears smaller in cKO brains (arrowhead) compared with wt brain. CTX, cortex; HC, hippocampus; ISH, in situ hybridization; OB, olfactory bulbs; STR, striatum; wt, wildtype.
Figure 4—figure supplement 3

Area patterning changes following cortex-specific deletion of Emx2.
(A) Tangential flattened sections of 5HT-immunostained cortices (wt: n = 15, cKO: n = 10) reveal sensory areas and their borders. Total cortical surface area was reduced by 11.70 ± 5.25% in cKO brains, without being statistically significant (p > 0.05). Further area measurements were normalized to cortical surface area, generating size ratios to facilitate comparisons of area measurements derived from different experiments and mouse lines. Mean ratios of wt brains were defined as 100% and variance calculated using standard error of the mean. Quantified area parameters are depicted in the schematics, below the individual graphs. (B) F/M cortex is larger in cKO brains (F/M area ratio: 131.14 ± 3.22%). S1 size is not affected (PMBSF area ratio: 98.03 ± 4.37%), but overall, indicated by the relative location of PMBSF barrel ‘C3’ (C3 length ratio: 84.44 ± 1.16%), S1 was located more posteriorly in cKO specimens compared with wt ones. (C) The size of V1 (V1 area ratio: 68.50 ± 2.95%; V1 length ratio: 72.07 ± 4.39%) was reduced and its relative position shifted medially (V1 medial shift ratio: 82.44 ± 7.29%) in cKO brains compared with wt brains. 5HT, serotonin; F/M, frontal/motor; PMBSF, posterior medial barrel sub field; wt, wildtype
Figure 4—figure supplement 4
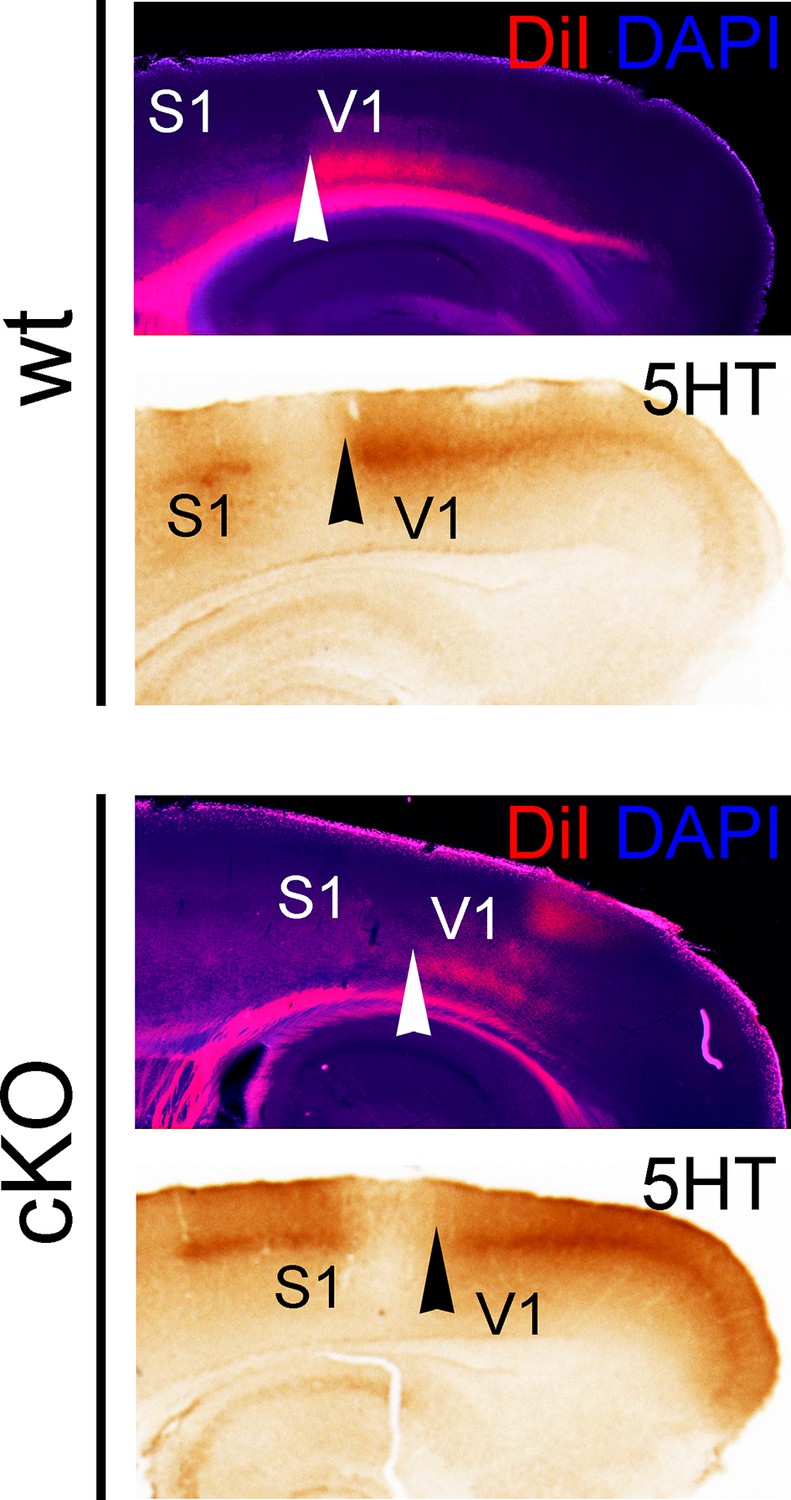
Posteriorly shifted V1 border in cKO cortices.
Adjacent P7 sagittal sections show thalamocortical projections from the dLG to V1, which were either labeled by inserting DiI crystals into the dLG (counterstained with DAPI), or by 5HT immunostaining. Arrowheads denote the anterior border of the V1 area that is innervated by TCAs from the dLG. Both TCA labeling methods reveal that this sharp border is shifted posteriorly in cKO brains compared with wt brains. 5HT, serotonin; DAPI, 4',6-diamidino-2-phenylindole; S1, primary somatosensory cortex; TCAs, thalamocortical axons; V1, primary visual cortex.
Download links
A two-part list of links to download the article, or parts of the article, in various formats.
Downloads (link to download the article as PDF)
Open citations (links to open the citations from this article in various online reference manager services)
Cite this article (links to download the citations from this article in formats compatible with various reference manager tools)
Genetic mechanisms control the linear scaling between related cortical primary and higher order sensory areas
eLife 4:e11416.
https://doi.org/10.7554/eLife.11416


