An epigenetic switch ensures transposon repression upon dynamic loss of DNA methylation in embryonic stem cells
- Institut Curie, France
- Paris Science Lettres Research University
- CNRS, France
- Inserm, France
- Mines Paris Tech, France
Figures
Figure 1 with 1 supplement
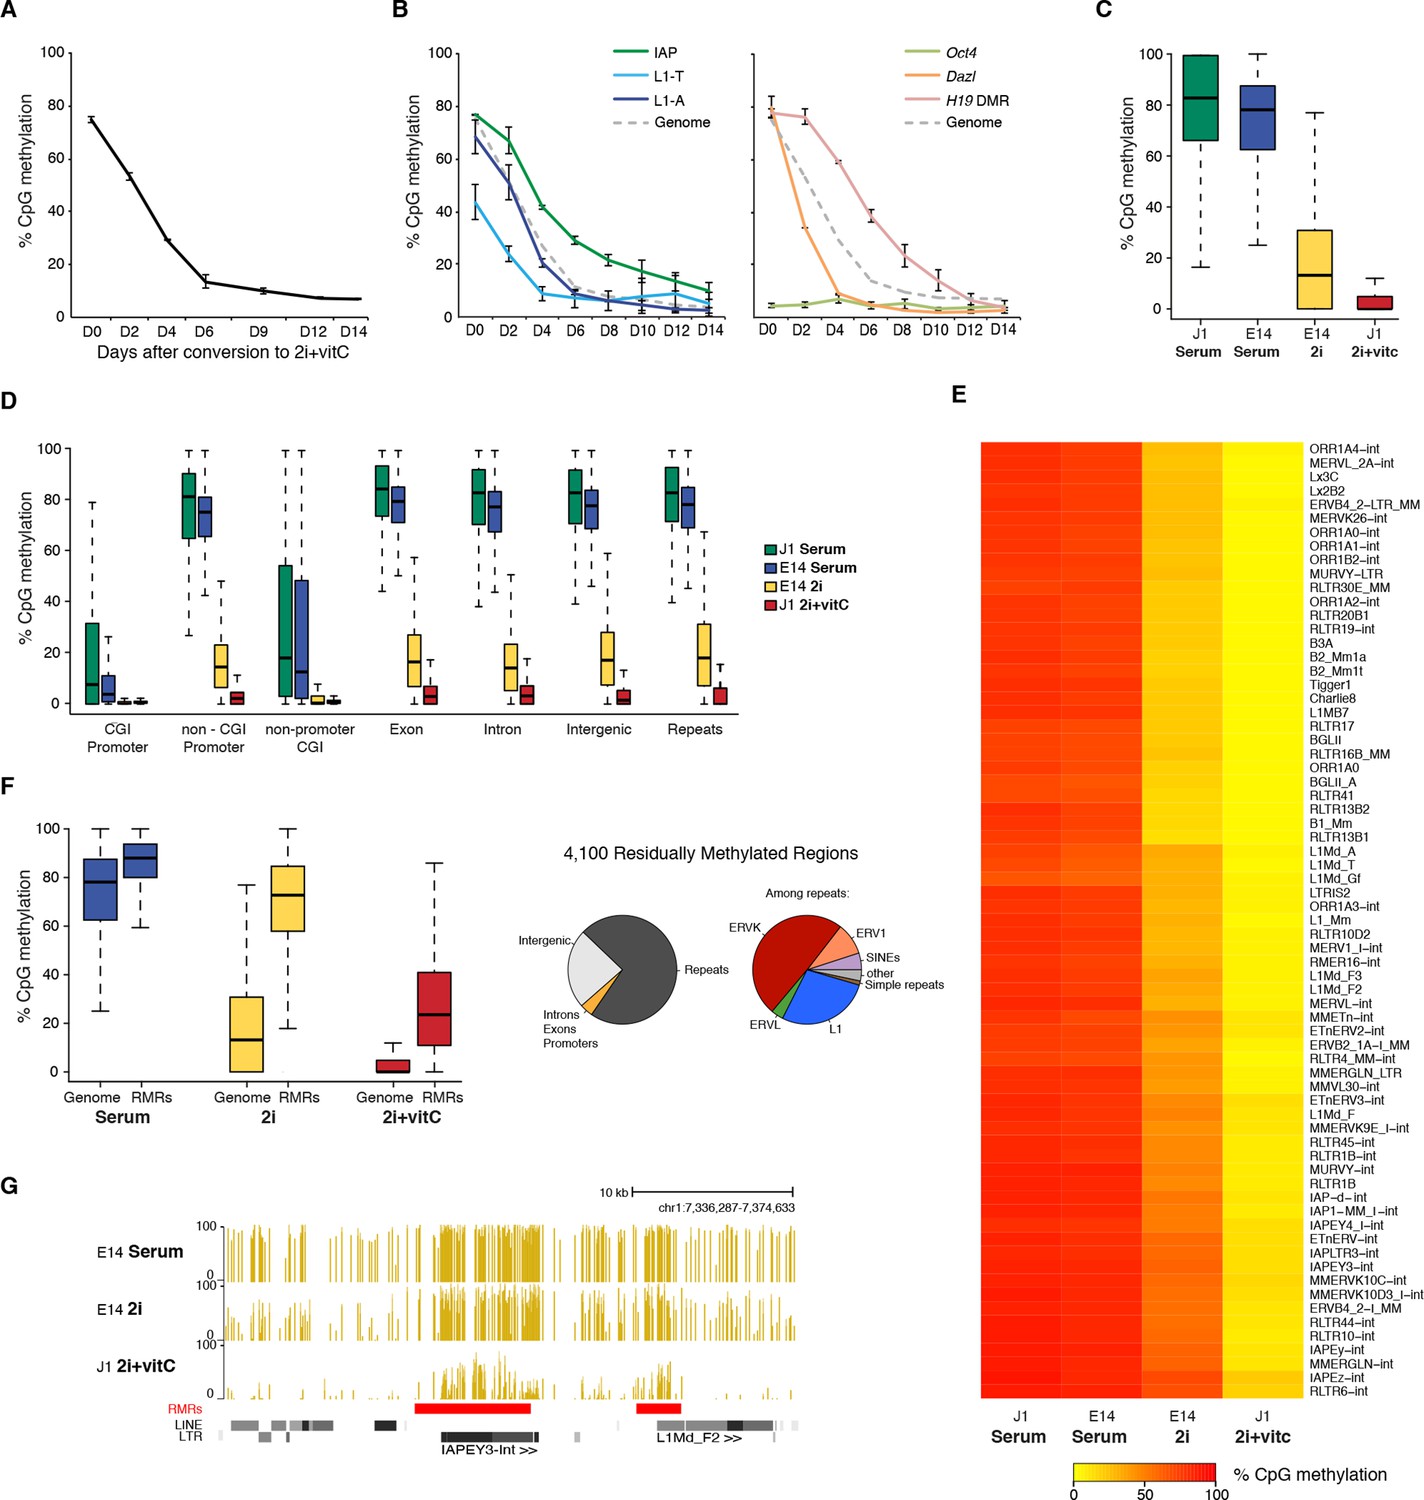
Kinetics and extent of DNA methylation loss in ES cells upon serum to 2i+vitC conversion
(A) Time course of global CpG methylation loss measured by LUMA over 14 days (D0 to D14) of conversion from serum to 2i+vitC. Data represent mean and Standard Error of the Mean (SEM) between two biological replicates. (B) Sequence-specific CpG methylation level measured by bisulfite pyrosequencing. Data represent mean ± SEM between two biological replicates. (C) Tukey boxplot representation of genome-wide CpG methylation content as measured by WGBS in different culture conditions. Datasets of J1 Serum, E14 Serum and E14 2i were obtained from previous studies (Habibi et al., 2013; Seisenberger et al., 2012) (D) CpG methylation distribution over different genomic compartments by WGBS. (E) Heatmap and hierarchical clustering of average CpG methylation over 69 transposon families as measured by WGBS. (F) Left panel: Tukey boxplot representation of CpG methylation content in Residually Methylated Regions (RMRs) (n = 4,100) compared to the whole genome in various culture conditions. Right panel: pie chart distribution of 2i+vitC RMRs in different genomic compartments (left) and among repeats (right). (G) Example of WGBS profile of a genomic region containing two 2i+vitC RMRs mapping to an IAPEY and a L1 elements. Bars represent the methylation percentage of individual CpG sites, between 0 (unmethylated) and 100% (fully methylated). Location of LINE and LTR transposons (RepeatMasker) are displayed below; the RMRs are highlighted in red.
Figure 1—figure supplement 1
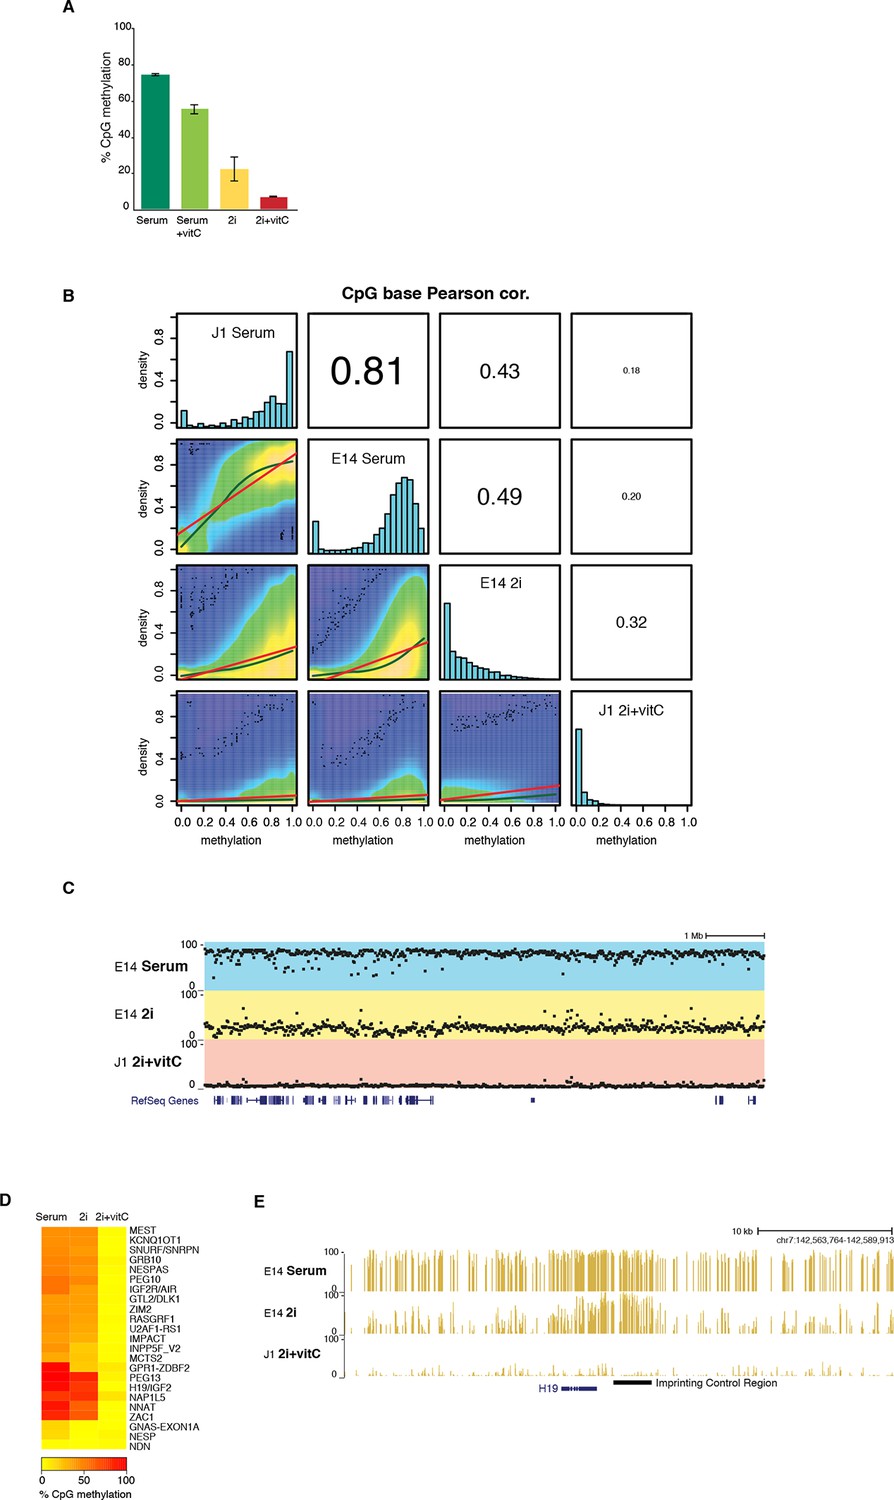
DNA methylation is almost completely erased in 2i+vitC medium.
(A) Global CpG methylation level in J1 ES cells as measured by LUMA. Mean ± SEM between two biological replicates. (B) Smoothed scatter plots of DNA methylation levels at individual CpG between two different conditions as measured by WGBS. Histograms: distribution of CpG methylation levels for all CpG. Pearson correlation between culture conditions. (C) Typical example of methylation profiles in serum, 2i-only and 2i+vitC. Each dot represents the average methylation level over 10–15 kb windows. (D) Average methylation level in Imprinted Control Regions (ICRs) as measured by WGBS. (E) Representative genomic region containing the H19 ICR.
Figure 2 with 4 supplements
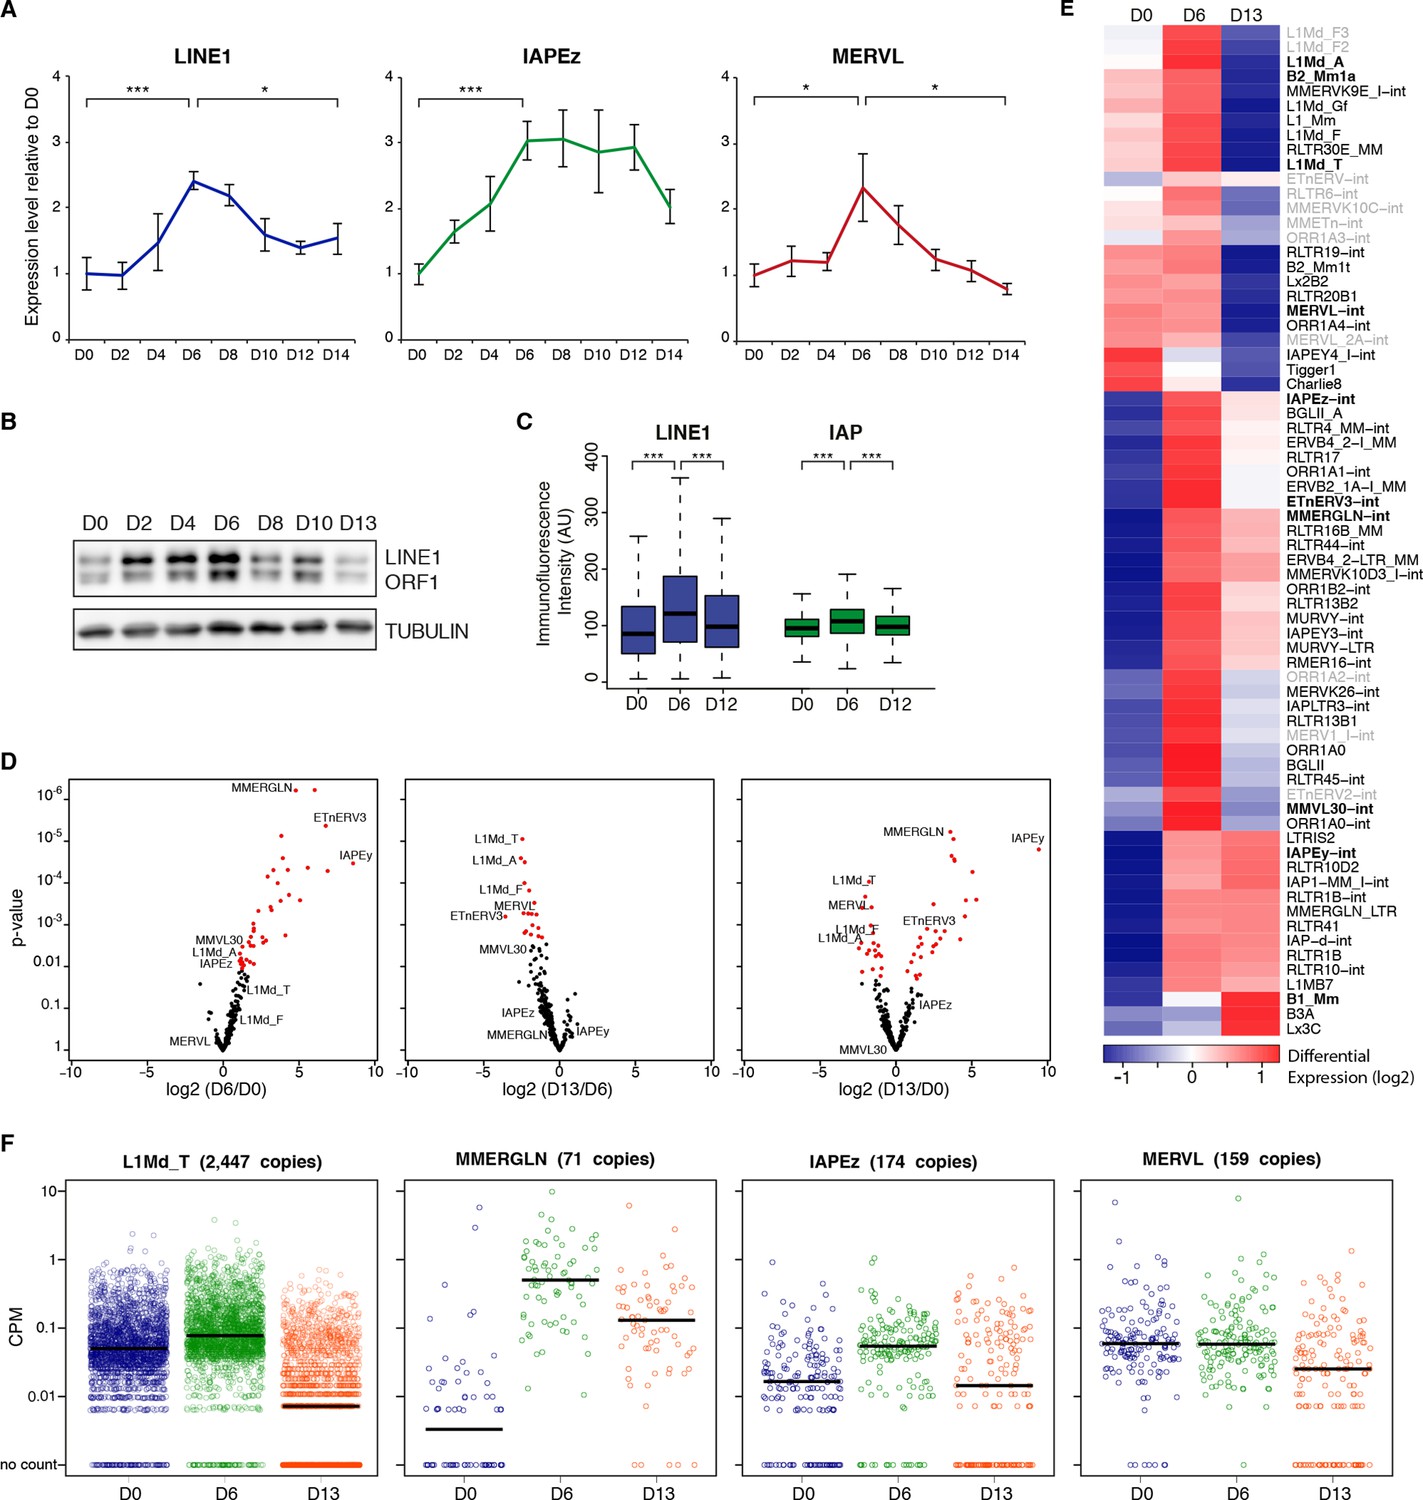
Two phases of transposon regulation upon serum to 2i+vitc conversion.
(A) Dynamic expression of LINE1, IAPEz and MERVL families upon conversion from serum to 2i+vitC as measured by RT-qPCR. Values were normalized to Gapdh and Rplp0 and are expressed as the fold change to D0. Data represent mean ± SEM from five biological replicates. *p<0.05, **p<0.01 and ***p<0.001 (Student’s t-test). (B) Evolution of LINE1-ORF1 protein levels at different time points during medium conversion. (C) Distribution of LINE1-ORF1 and IAP-gag protein levels after ImageJ quantification of immunofluorescence intensity in individual cells. Between 1000 and 5000 cells were analyzed per sample. ***p<0.001 (Wilcoxon rank-sum test) (D) Volcano plot representation of up- and down-regulated transposons as measured by RNA-seq between D0 and D6 (left), D6 and D13 (middle), and D0 and D13 (right). Red dots indicate significantly misregulated repeats between two conditions (fold change >2 and p-value<0.05). RNA-seq mapping allowed multiple hits onto the genome. (E) Heatmap representation and hierarchical clustering of expression changes for 69 transposon families at D0, D6 and D13. Bold names: transposons of specific interest; grey names: transposons that are not significantly up- or down-regulated between any time points. Colors represent on a log2-scale the differential expression between a given time point and the average of the three time points. (F) Expression of individual elements from different transposon families at D0, D6 and D13 in Count per Millions (CPM). Each dot represents a single element. RNA-seq mapping allowed only unique hits in the reference genome; only elements with a minimum of 10 reads in at least one of the sample were conserved. The black bar represents the median of the distribution. Analyzed numbers of distinct transposon copies per family appear into brackets.
Figure 2—figure supplement 1
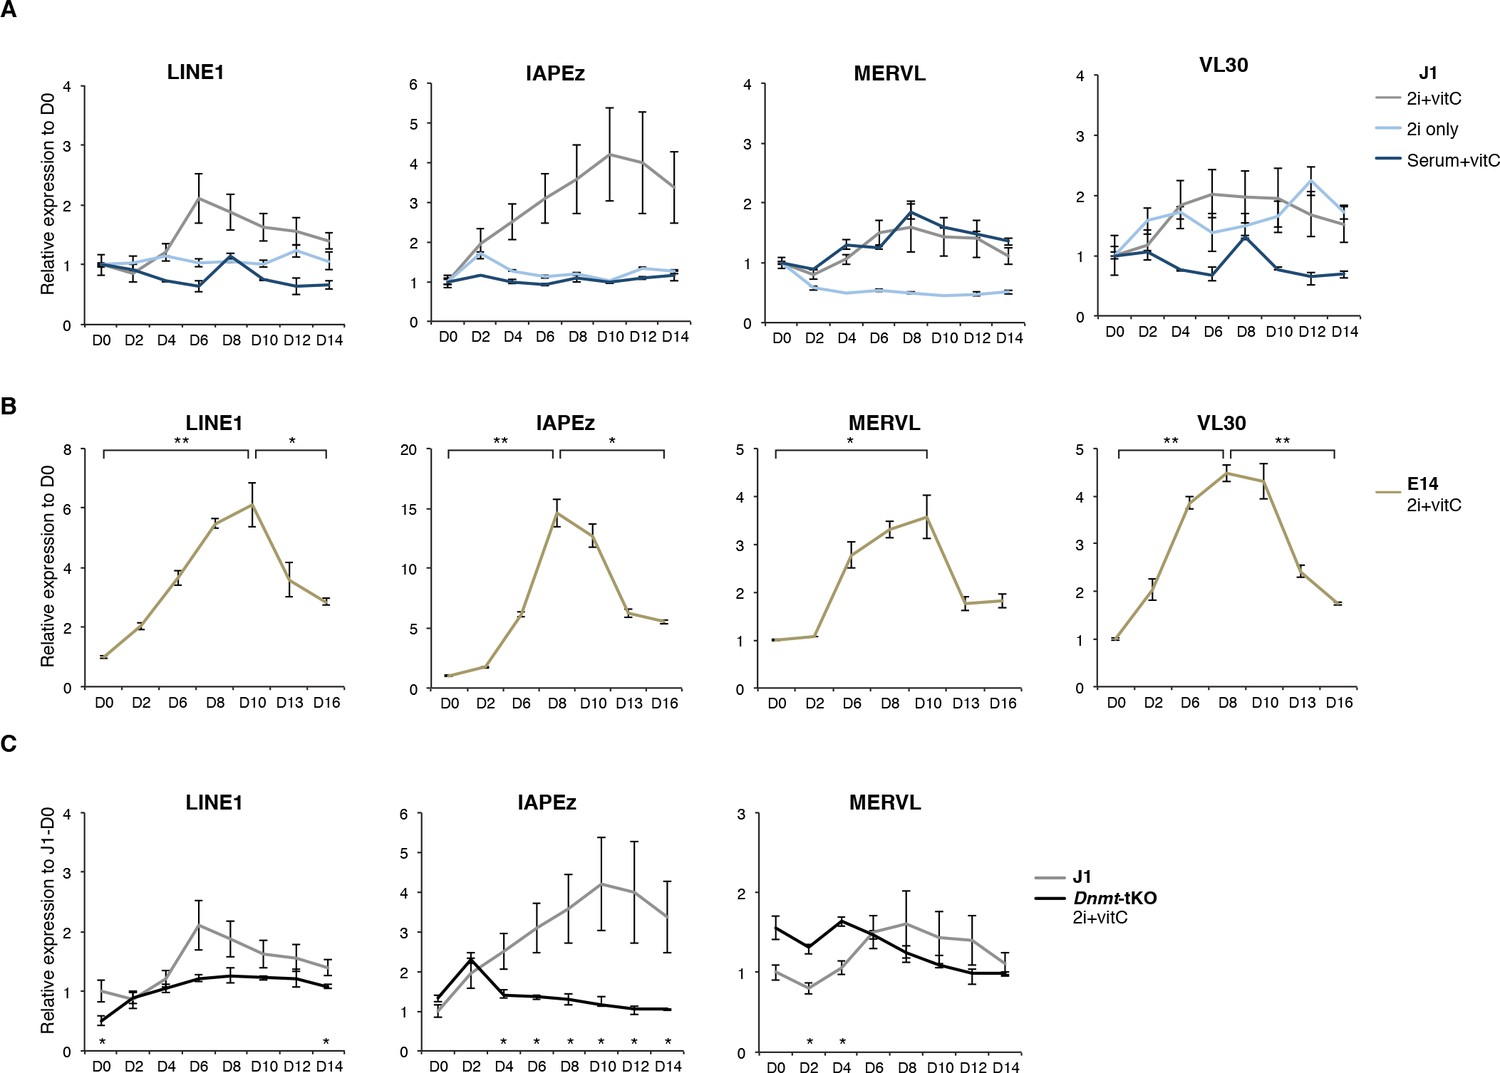
Two phases of transposon regulation correlate with rapid DNA methylation loss.
(A) Expression of different transposons in J1 ES cells as measured by Nanostring during the conversion from serum to 2i+vitC (grey), 2i-only (light blue) and serum+vitC (dark blue). Data are expressed as fold change to D0 and represent mean ± SEM between eight (for 2i+vitC) or two (for 2i- and vitC-only) biological replicates. (B) Expression of transposons in E14 ES cells. Data are expressed as fold change to D0 and represent mean ± SEM between two biological replicates. p<0.05, **p<0.01 and ***p<0.001 (Student t-test). (C) Expression of transposons in Dnmt-tKO and J1 ES cells measured. Data are expressed as fold change to J1 D0 and represent mean ± SEM between three biological replicates (for Dnmt-tKO). *p<0.05, **p<0.01 and ***p<0.001 (unequal variances t-test between WT and Dnmt-tKO at a given day).
Figure 2—figure supplement 2
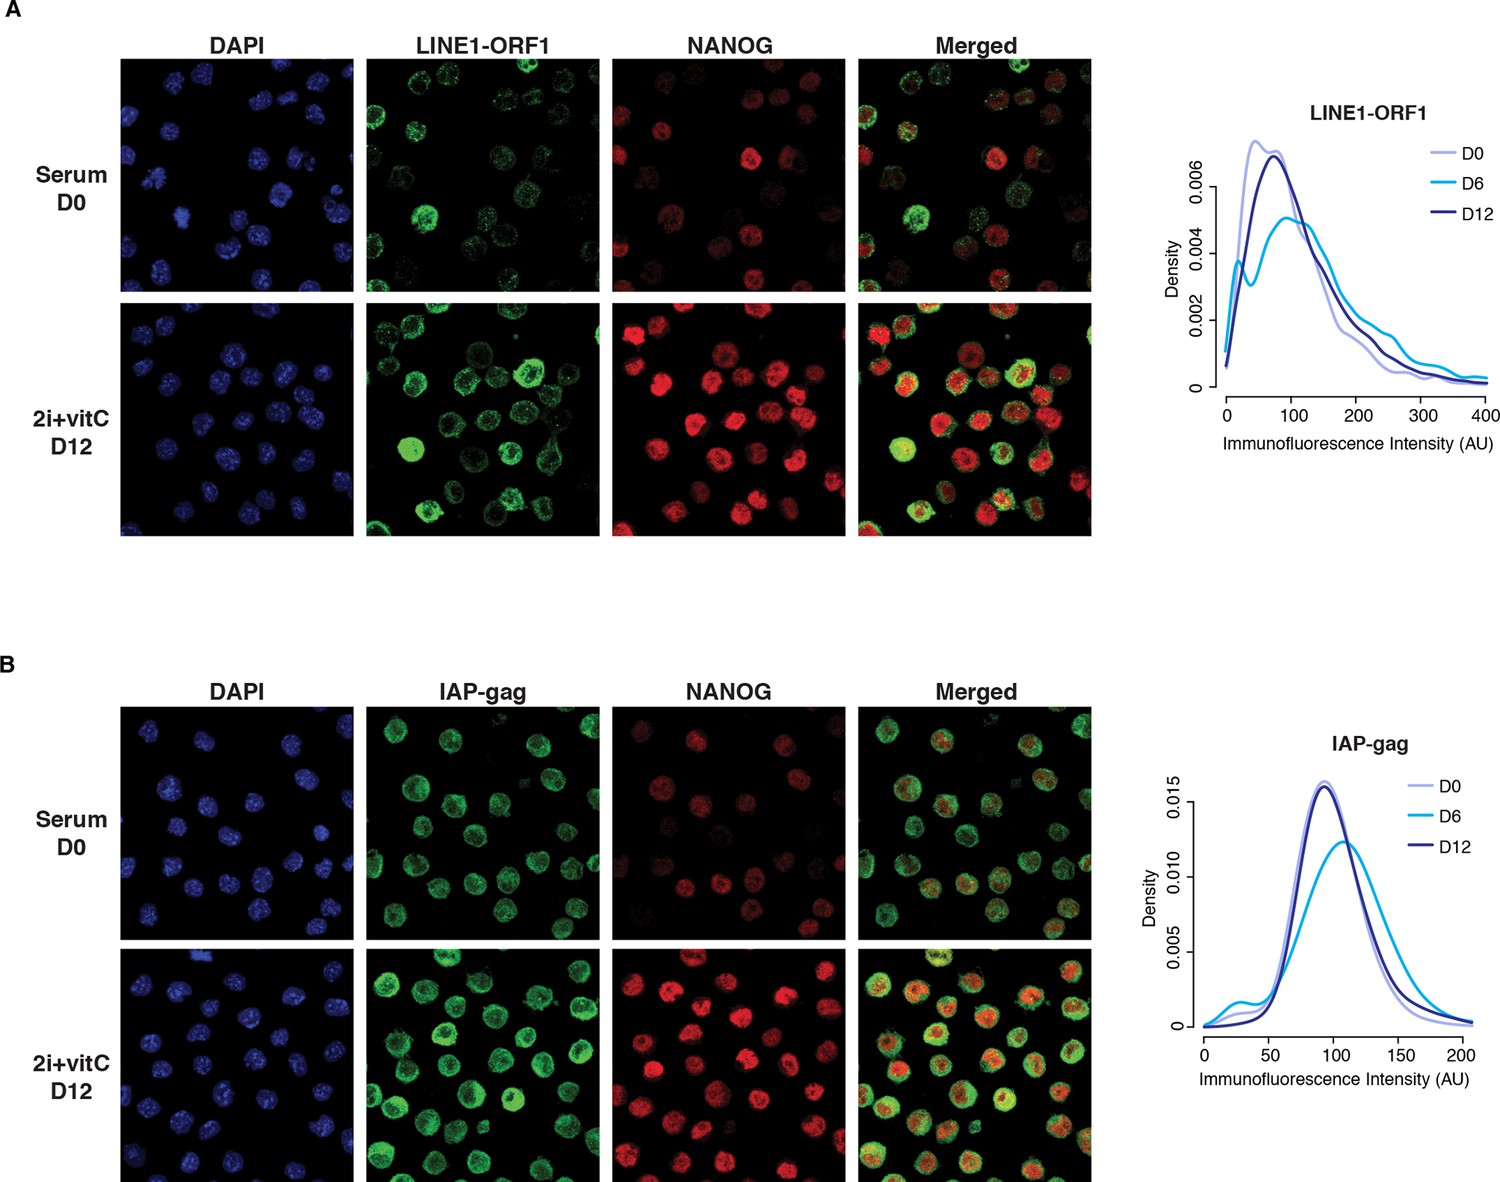
Cellular heterogeneity of transposon expression.
(A) Left panel: Immunofluorescence staining for LINE1-ORF1 and NANOG proteins in serum- and 2i+vitC-grown ES cells. Right: panel: Density of LINE1-ORF1 protein levels after ImageJ quantification of immunofluorescence intensity in individual cells. Between 2000 and 5000 cells were analyzed per time point: cells have globally a higher level of LINE1-ORF1 at D6. (B) Same as (A), with staining for IAP-gag and NANOG proteins.
Figure 2—figure supplement 3
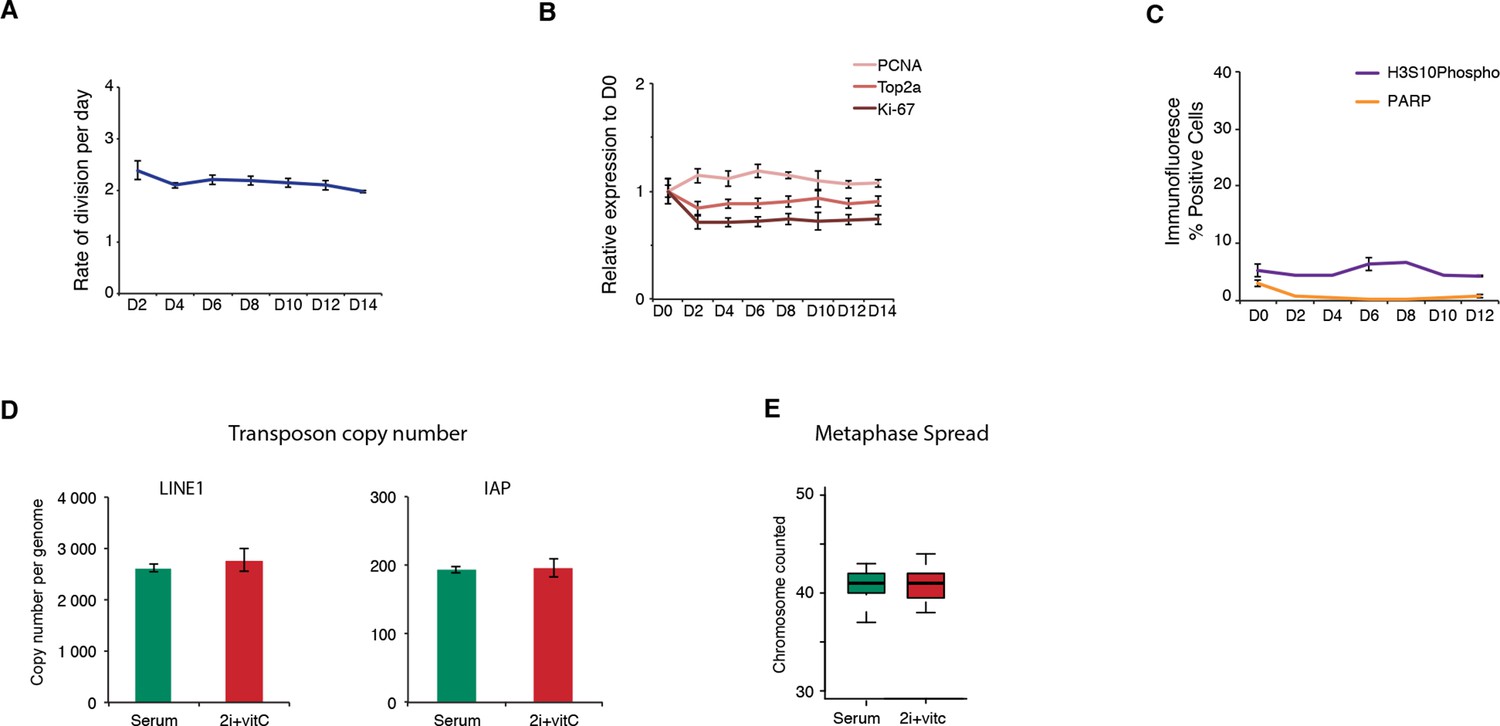
Cell proliferation, cell death, and genome integrity.
(A) Mitotic division rate of J1 ES cells during the conversion from serum to 2i+vitC. Mean ± SEM between three biological replicates. (B) Quantification of proliferation marker expression by Nanostring. Data are expressed as fold change to D0 and represent mean ± SEM between seven biological replicates. (C) Percentage of cells immunostained against the apoptosis marker PARP and the mitotic marker H3S10 phosphorylation. Between 5000 and 10000 cells were counted at each time point. When available, data represent mean ± SEM between two biological replicates. (D) Absolute copy number of L1-ORF2 and IAPΔ1 fragments assayed by qPCR on genomic DNA. Values are expressed as copies per genome, representing the mean ± SEM between two biological replicates. (E) Chromosome numbers counted in 20 metaphase spreads in serum and 2i+vitC medium.
Figure 2—figure supplement 4
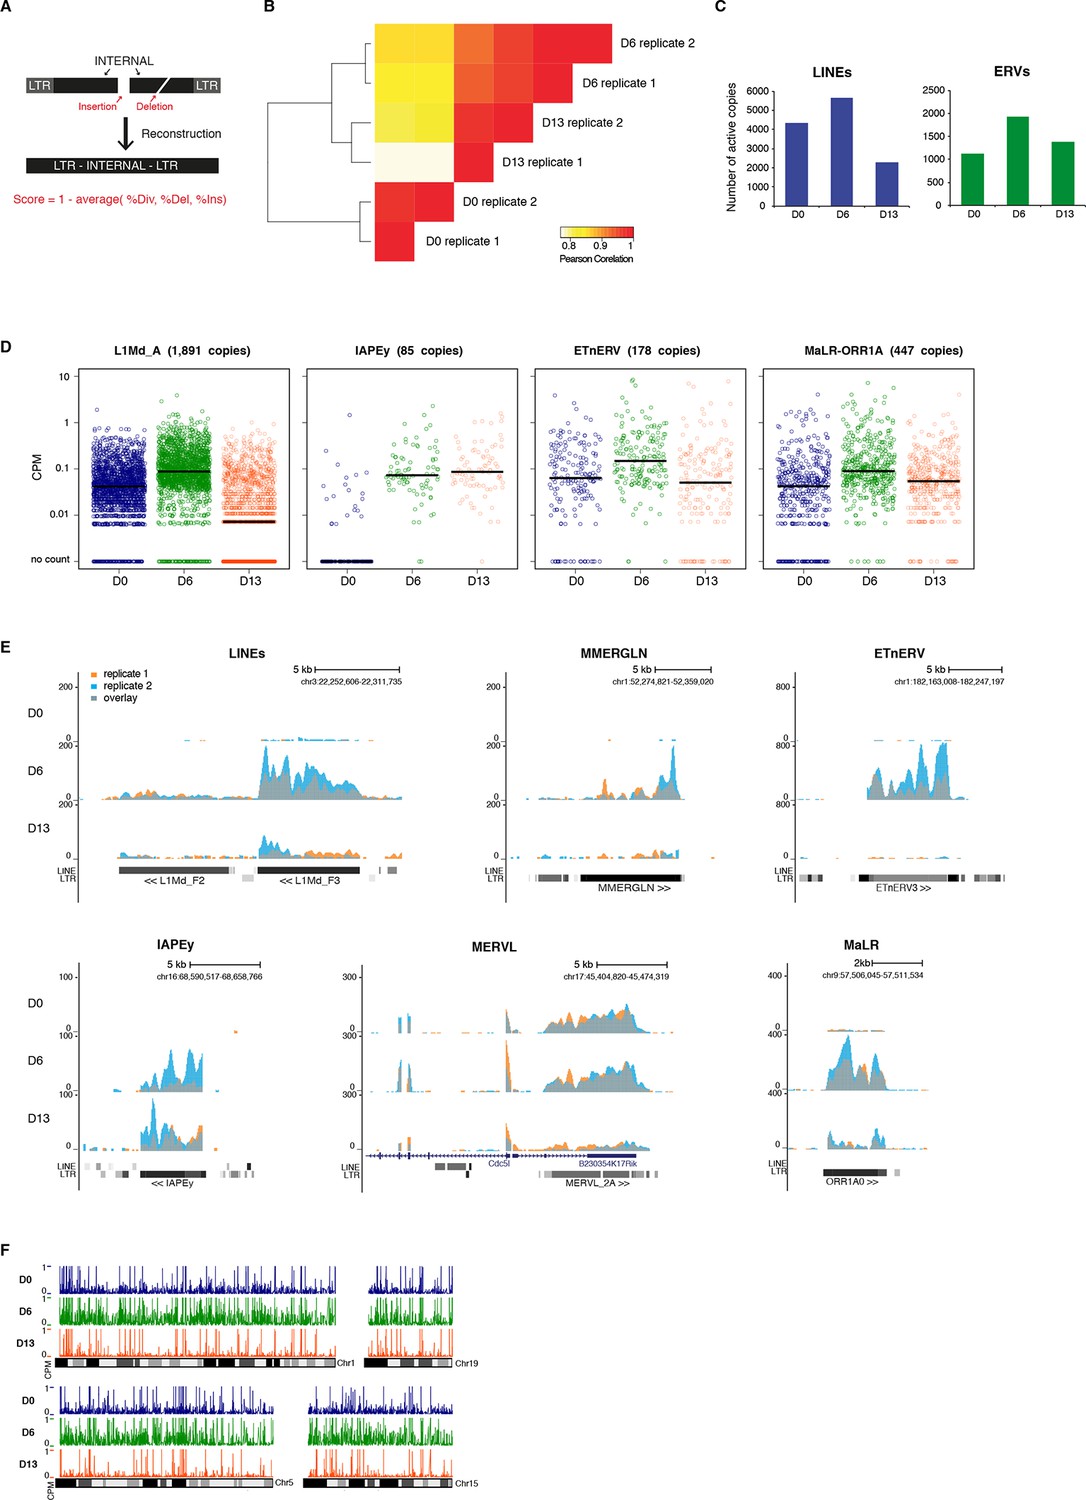
Genome-wide characterization of transposon relaxation.
(A) Reconstruction principles of RepeatMasker annotation. (B) Pearson correlation and hierarchical clustering between RNA-seq experiments. (C) Number of individual LINEs and ERVs with detectable expression at D0, D6 and D13 of 2i+vitC conversion. Elements with a minimum of 10 uniquely mappable reads were considered. (D) Expression of individual elements from different transposon families at D0, D6 and D13 in Count per Millions (CPM). Each dot represents a single element. RNA-seq mapping allowed only unique hits in the reference genome and only elements that had a minimum of 10 reads in at least one of the sample were conserved. The black bar represents the median of the distribution. Analyzed numbers of distinct transposon copies per family appear into brackets. (E) Representative genomic regions comprising LINE1 and ERV repeats. RNA-seq coverage for the two biological replicates is represented in blue and orange, and the overlap in grey. Data represent normalized read density. (F) Expression of individual transposable elements and their localization on chromosomes 1, 5, 15 and 19 at D0, D6 and D13 of conversion. Each bar represents the expression of a single element in Count per Millions (CPM). Elements with a minimum of 10 uniquely mappable reads in at least one sample were considered.
Figure 3 with 1 supplement
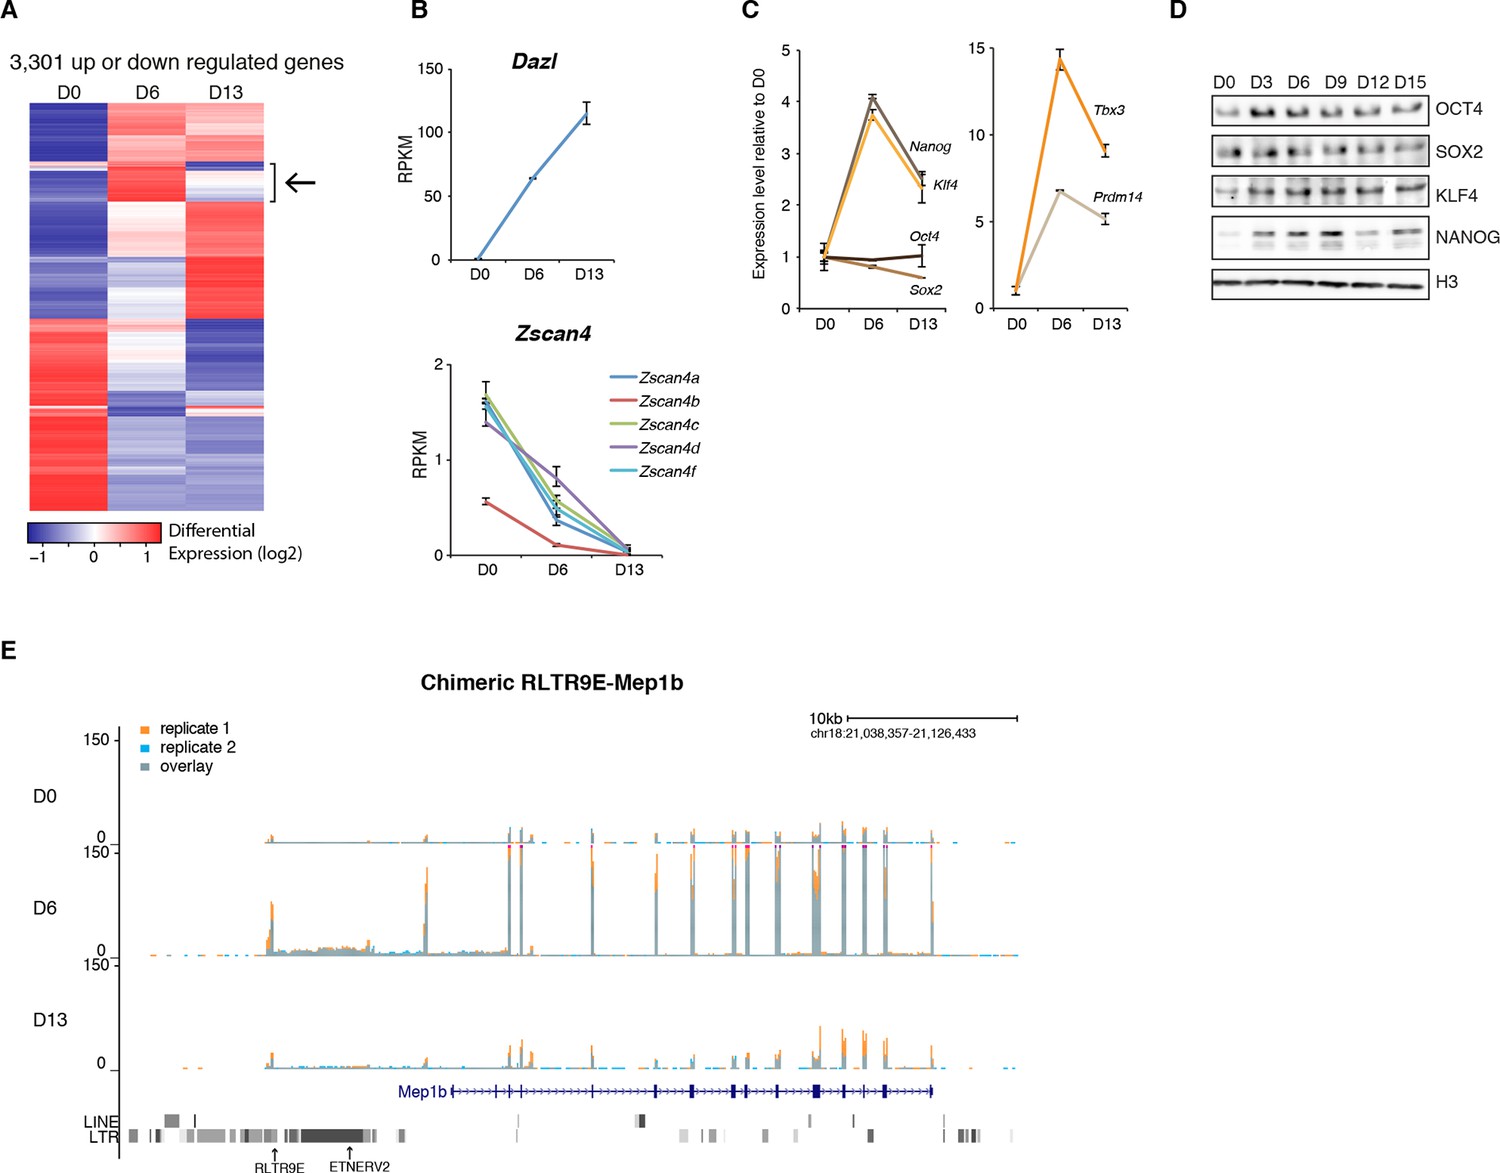
Gene expression analysis upon serum to 2i+vitC conversion.
(A) Heatmap representation of genes (n = 3301) that are significantly misregulated between at least two time points of D0, D6 and D13 during medium conversion. Color codes as in Figure 2E. The arrow highlights a subset of genes whose expression transiently peaks at D6. (B) Monotonic expression patterns of Dazl and Zscan4 family genes as measured by RNA-seq at D0, D6 and D13, expressed in RPKM (read per kb per millions). Mean ± SEM between two biological replicates. (C) Dynamic expression of pluripotency transcription factor genes as measured by RNA-seq. Data is expressed as fold change to D0 and represent mean ± SEM between two biological replicates. (D) Expression of core pluripotency transcription factors by western blot. (E) RNA-seq track showing a chimeric transcript between a RLTR9E transposon element and the Mep1b gene specifically expressed at D6. Data represent normalized read density.
Figure 3—figure supplement 1
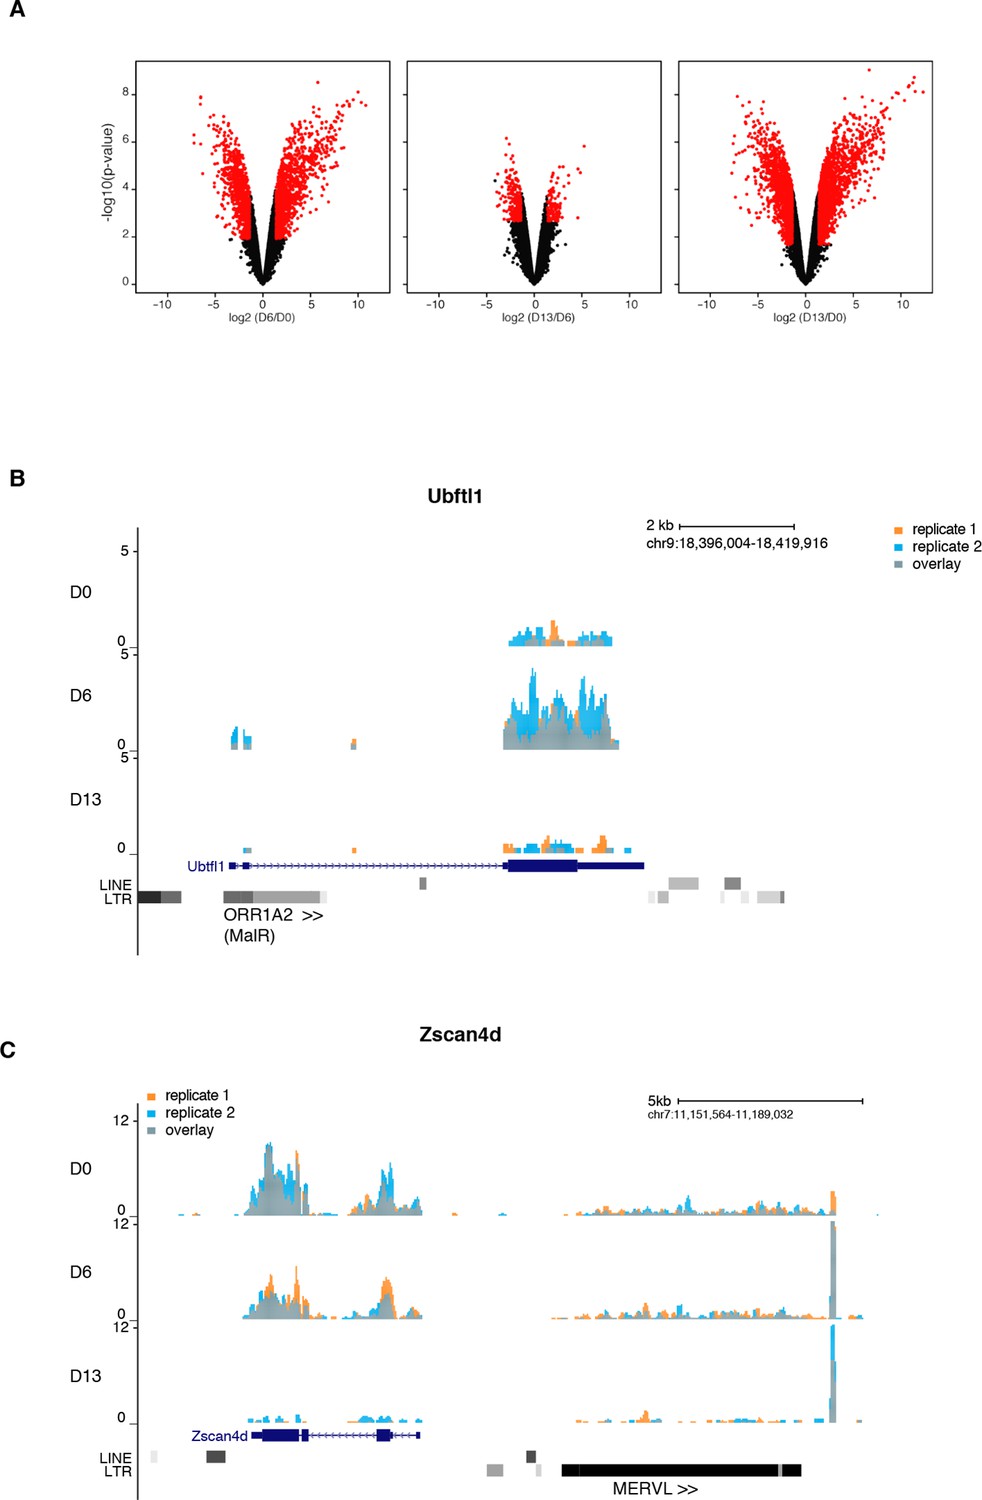
Gene expression analysis upon serum to 2i+vitC conversion.
(A) Volcano plot representation of up- and down-regulated genes as measured by RNA-seq between D0 and D6, D6 and D13, and D0 and D13. Red dots indicate significantly misregulated genes (fold change >4 and p-value <0.01). (B) RNA-seq track showing a chimeric transcript between an ORR1A2 transposon and the 2-cell-specific Ubtfl1 gene, specifically expressed at D6. Data represent normalized read density (C) RNA-seq track showing uncoupled expression between the 2-cell-specific Zscan4d gene and the neighboring full-length MERVL transposon.
Figure 4 with 3 supplements

Repressive chromatin reorganization upon loss of DNA methylation.
(A) Western blot analysis of global levels of repressive histone modifications during the course of serum to 2i+vitC conversion. (B) H3K9me2 enrichment levels at three transposon families as measured by ChIP-qPCR. Quantitative data are expressed as the percentage of ChIP over Input. Data represents mean ± SEM of two biological replicates. (C) Genomic annotation of ChIP-seq peaks. Data represent the number of annotated peaks. H3K9me3 data are representative of two biological replicates, while H3K27me3 data represent only one, as peak calling could not be performed successfully on the second replicate. (D) H3K27me3 enrichment at major satellite repeats as measured by ChIP-qPCR. Data are represented as in 4B. (E) Heatmap and hierarchical clustering of average H3K9me3 and H3K27me3 levels in 69 transposons families at D0, D6 and D15. Colors represent the average read count for an element in a given family, relative to input (average between two biological replicates). Only intact (score>0.8) elements were considered. (F) Representative genomic region depicting evolution of H3K9me3 (green) and H3K27me3 (red) at L1-A (category A), IAPEz (category B) and MERVL (category C) transposons. Data represent normalized read density.
Figure 4—figure supplement 1
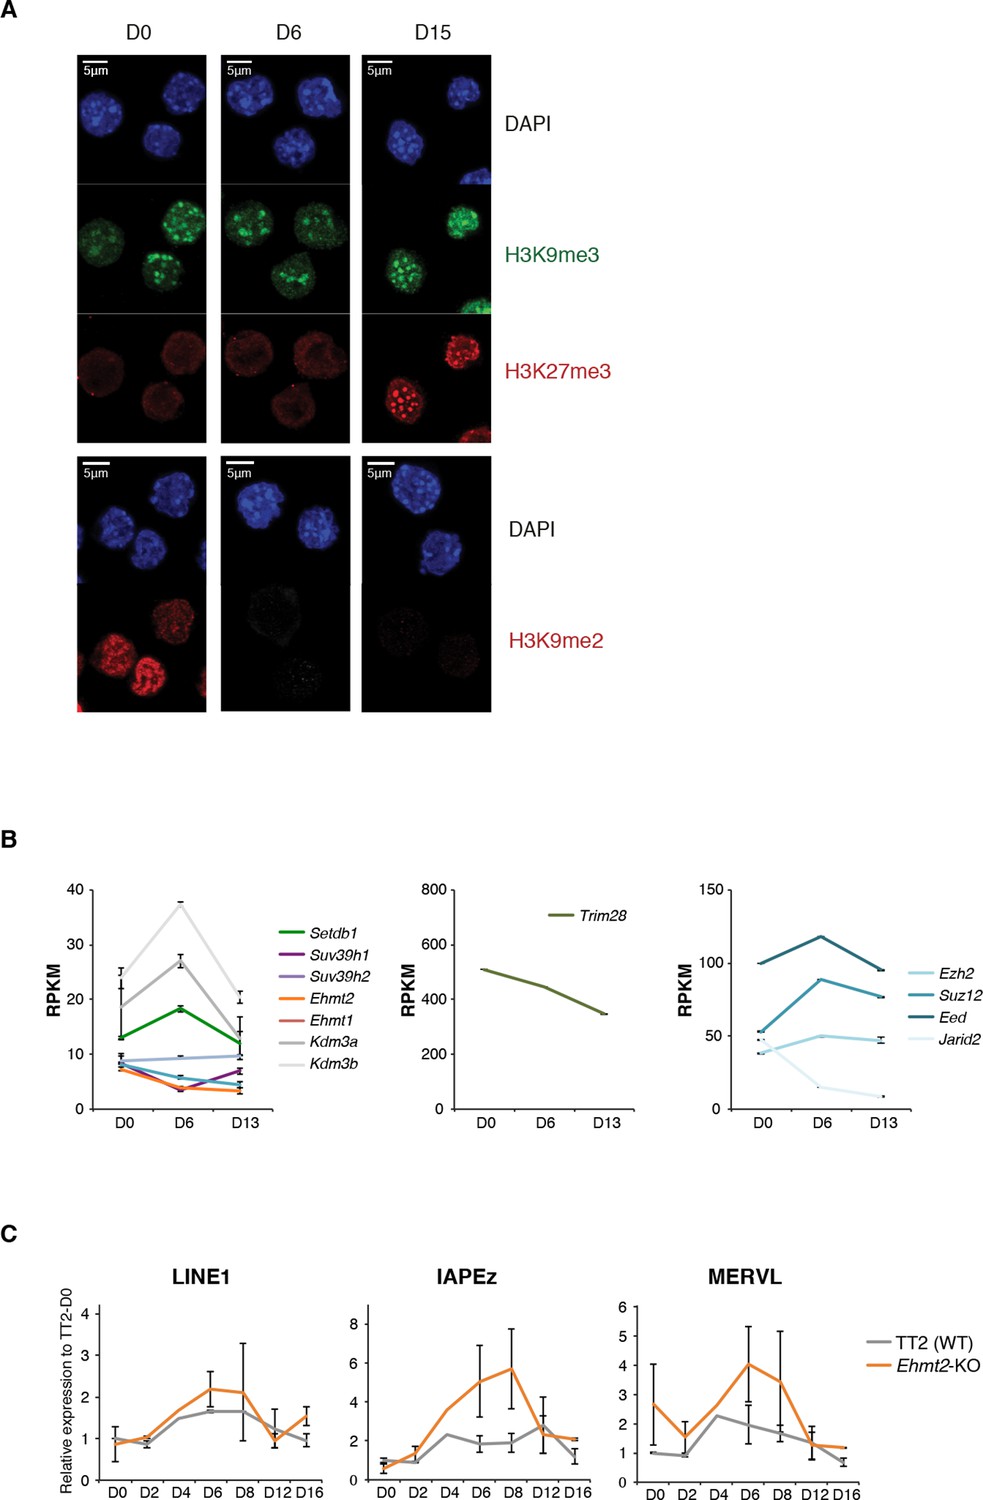
Repressive chromatin reorganization during conversion from serum to 2i+vitC.
(A) Immunofluorescence experiment against H3K9me2, H3K9me3 and H3K27me3 in J1 ES cells during serum to 2i+vitC conversion. (B) RPKM expression values of H3K9 HKMTs, Trim28 and PRC2 members as measured by RNA-seq. Mean ± SEM between two biological replicates. Transposon expression in Ehmt2-KO and TT2 ES cells (WT) as measured by Nanostring. Data are expressed as fold changes to WT D0 and represent mean ± SEM between two biological replicates.
Figure 4—figure supplement 2
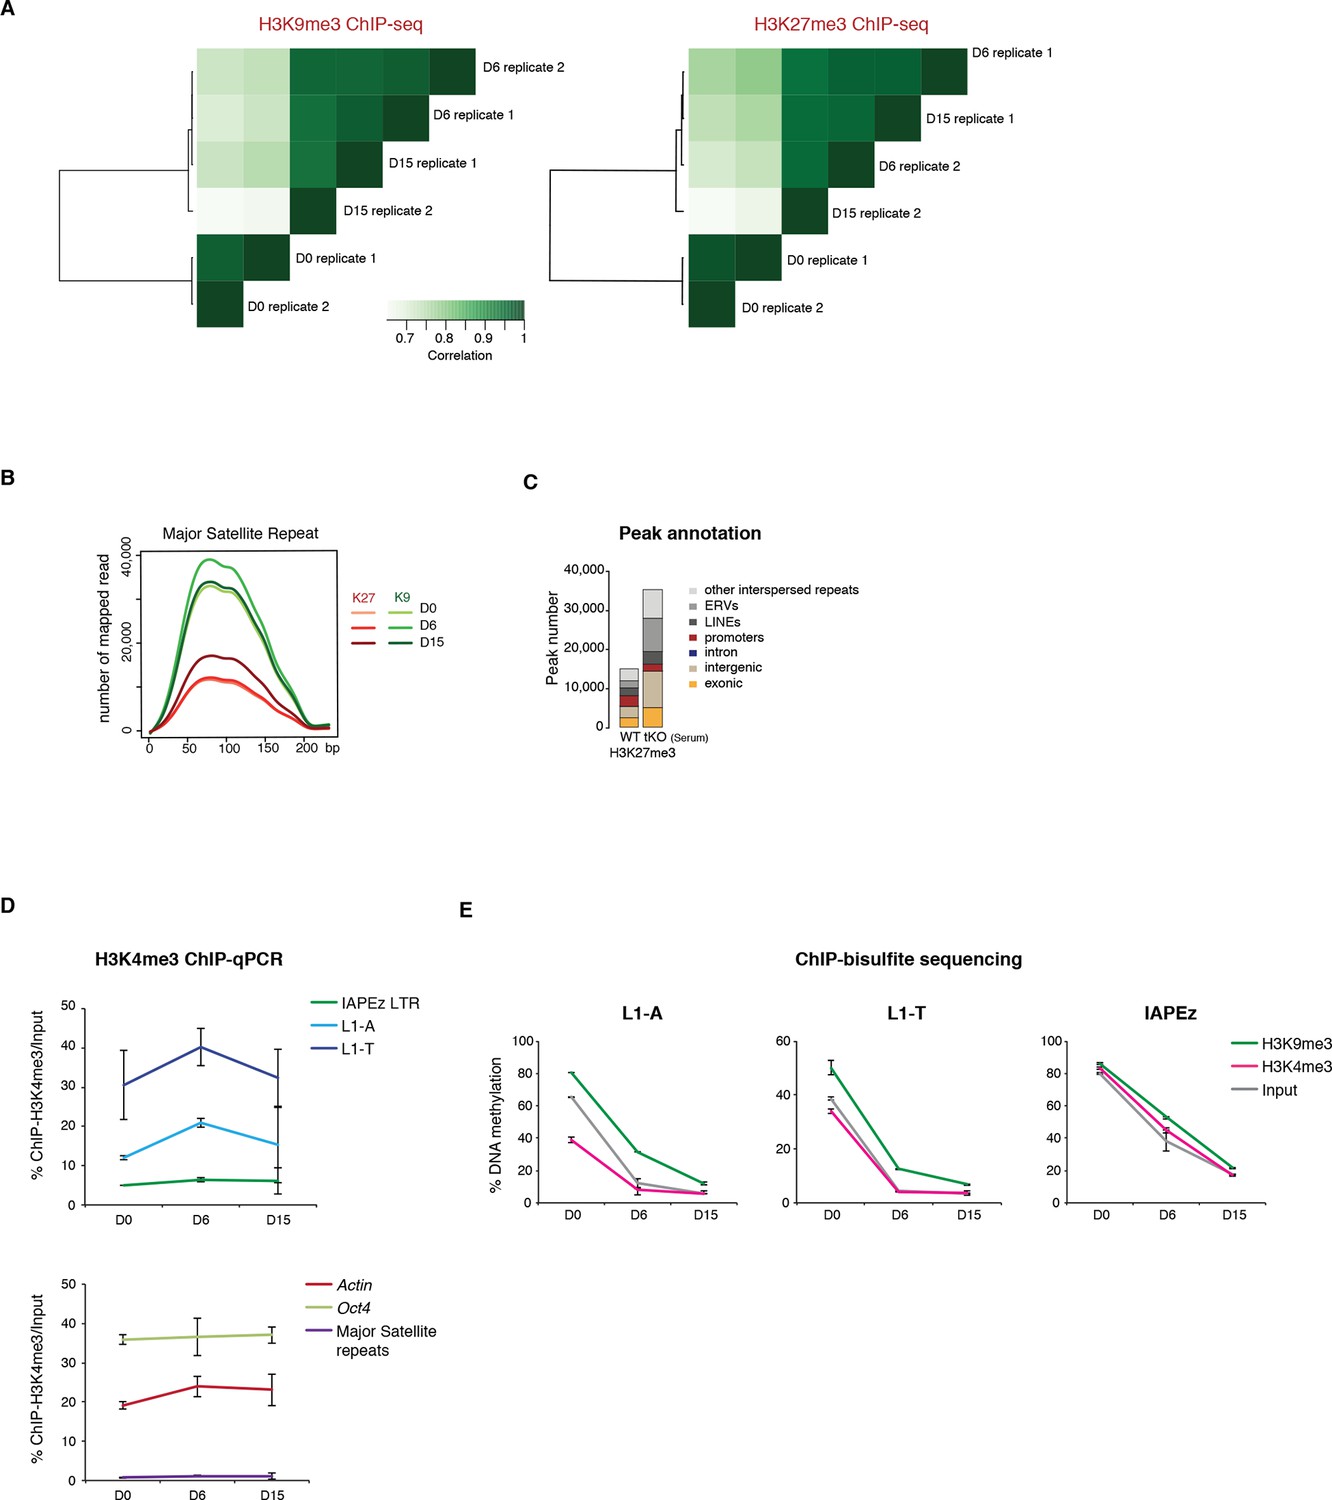
Repressive chromatin reorganization during conversion from serum to 2i+vitC.
(A) Pearson correlation and hierarchical clustering between samples after peak calling in H3K9me3 and H3K27me3 ChIP-seq experiments. (B) Number of H3K9me3 and H3K27me3 ChIP-seq read mapping to major satellite repeat consensus sequence. (C) Genomic annotation of ChIP-seq peaks in ES grown in serum but lacking DNA methylation (Dnmt3-dKO, Dnmt1-KD). On the contrary to Figure 4C, peak calling was performed without taking input data into account. ChIP-seq datasets were taken from. Brinkman et al., 2012. (D) H3K4me3 enrichment levels at three transposon families as measured by ChIP-qPCR. Data are expressed as the percentage of ChIP over Input and represents mean ± SEM of two biological replicates. (E) H3K9me3 and H3K4me3 ChIP followed by bisulfite pyrosequencing. Mean ± SEM between two biological replicates.
Figure 4—figure supplement 3
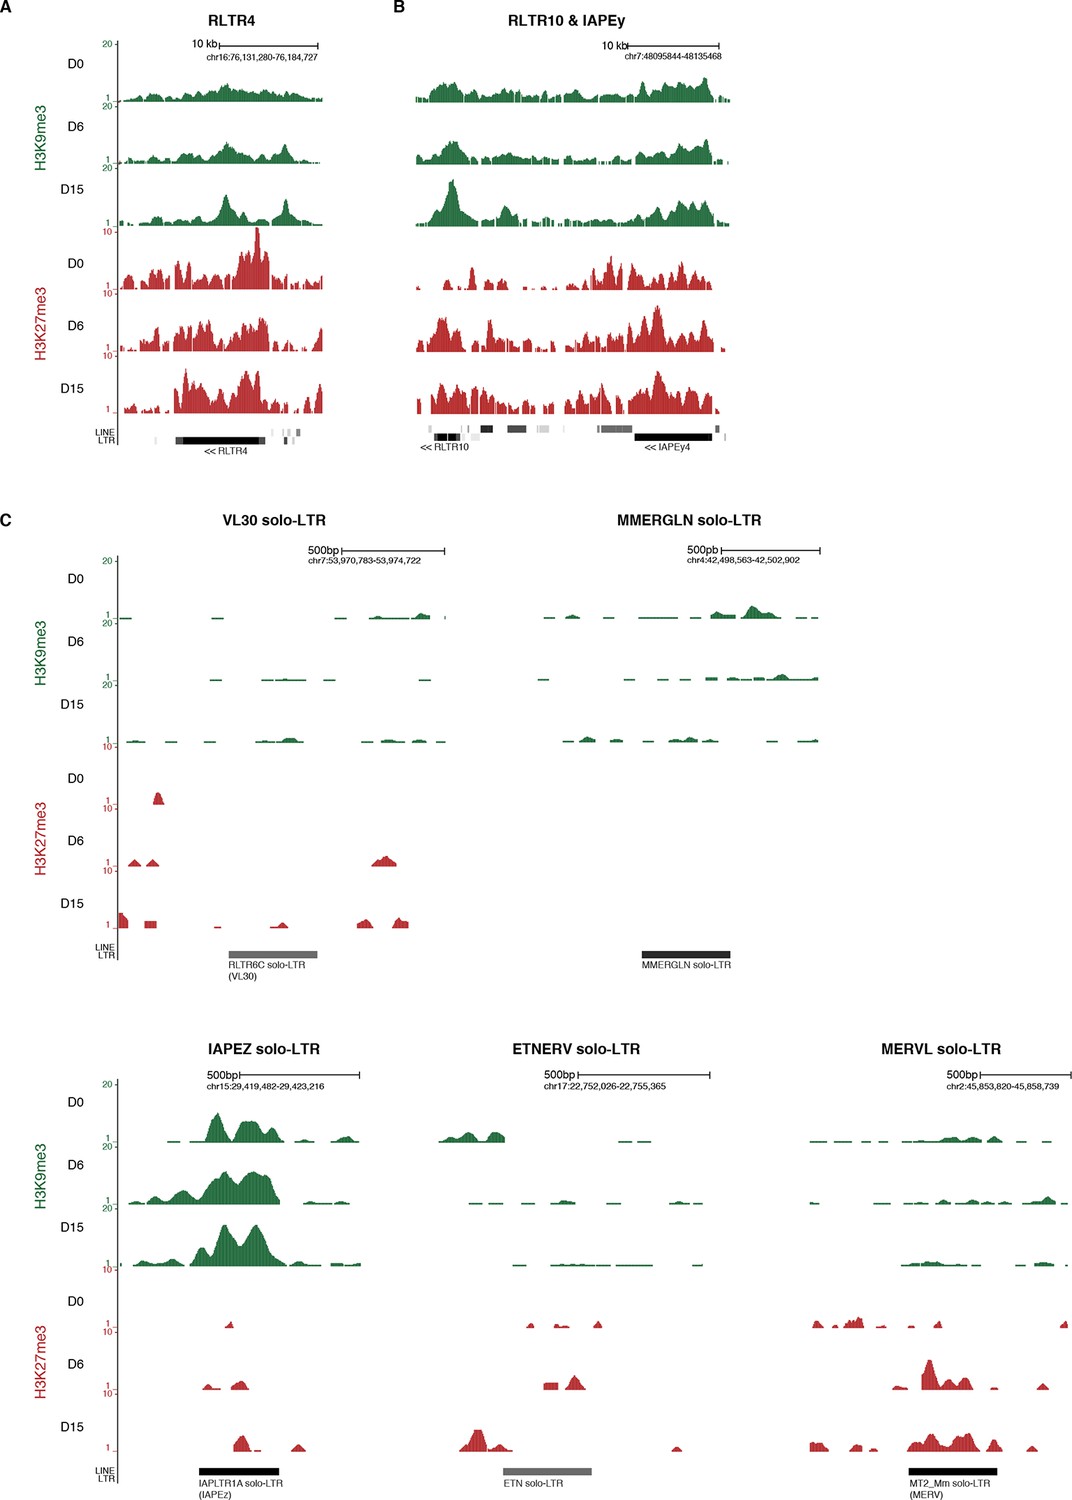
Screenshots of repressive chromatin reorganization at transposons.
(A) Representative genomic region depicting evolution of H3K9me3 and H3K27me3 at RLTR4 repeats. Data represent normalized read density. (B) Representative genomic region depicting evolution of H3K9me3 and H3K27me3 at RLTR10 and IAPEy repeats. (C) Representative genomic region depicting evolution of H3K9me3 and H3K27me3 at various solo-LTRs. Example chosen here show isolated solo-LTRs that are not surrounded by other transposons.
Figure 5 with 2 supplements
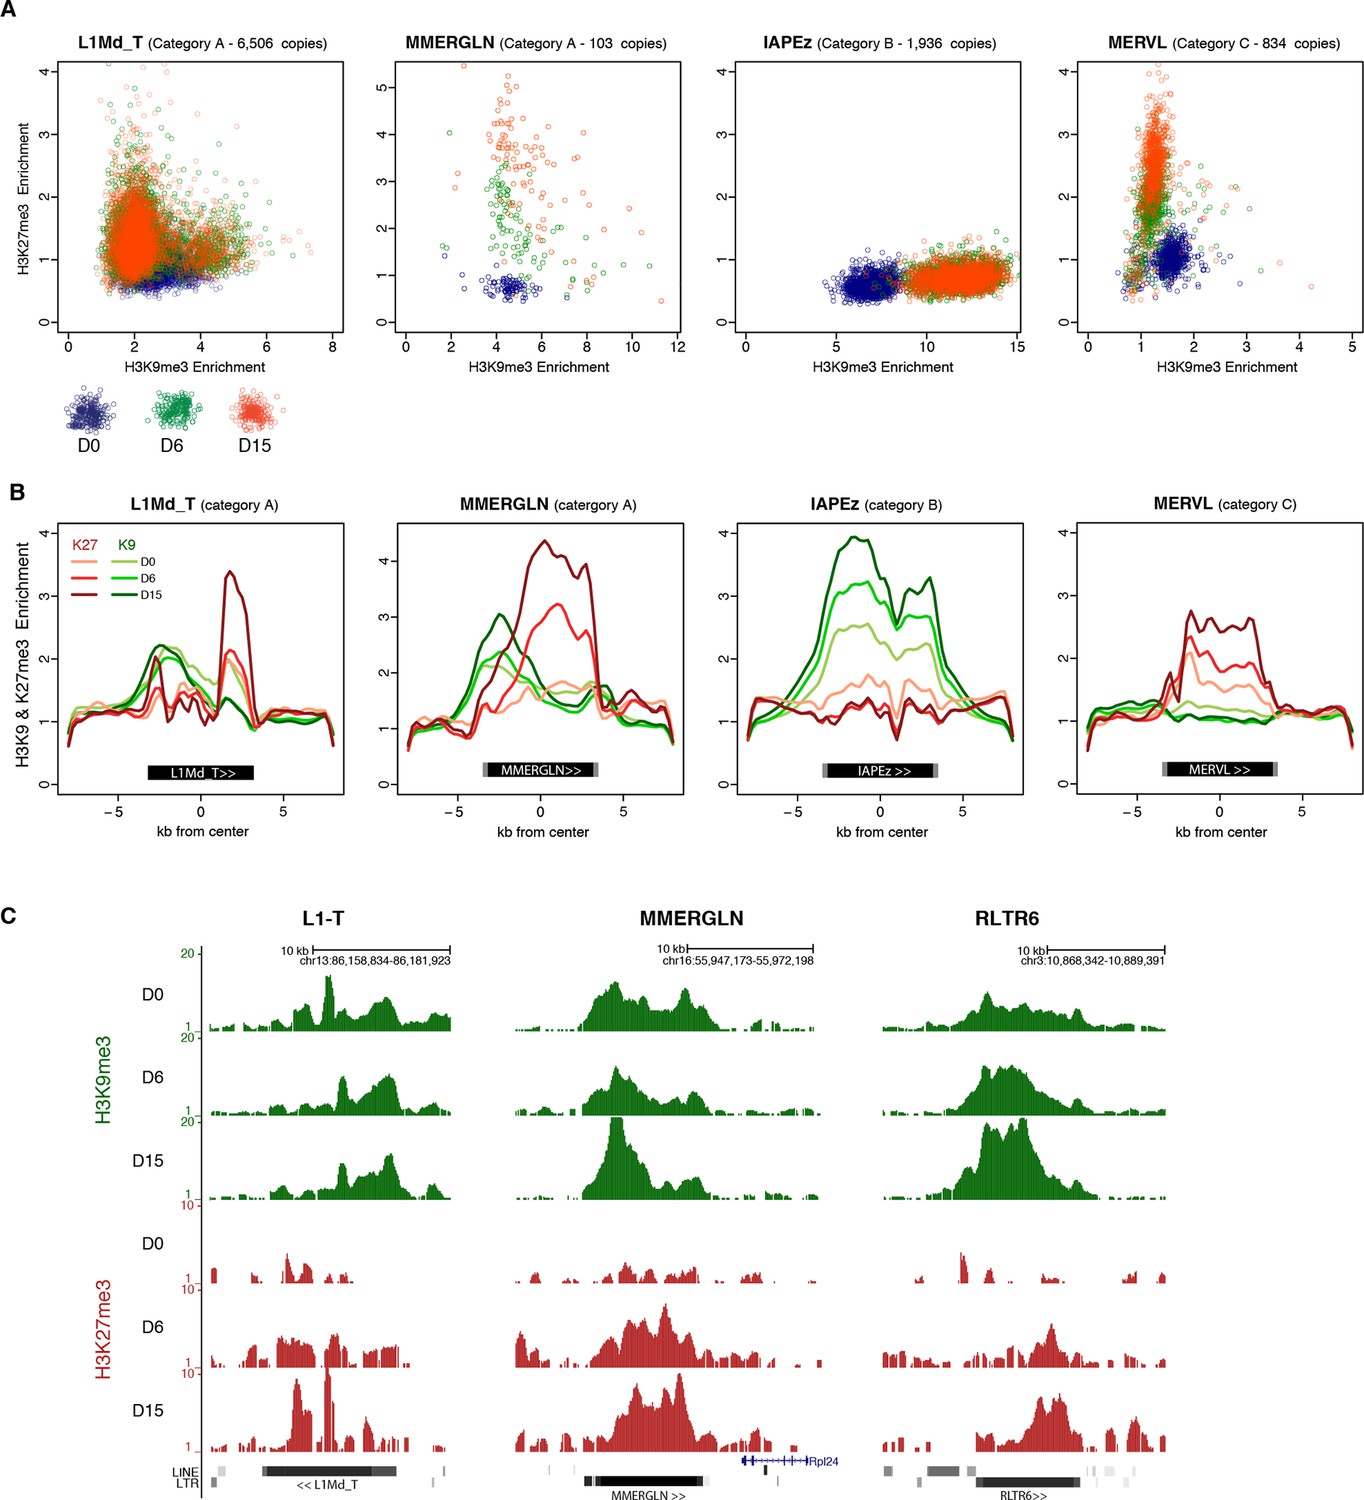
H3K9me3 and H3K27me3 mark the same transposons but do not spatially overlap.
(A) Normalized H3K9me3 and H3K27me3 enrichment over input at individual elements from different transposon families. Each dot represents a single element at D0 (blue), D6 (green) and D15 (red). Only intact (integrity score>0.8) elements were considered. Data represent the average between two biological replicates. Analyzed numbers of distinct transposon copies per family appear into brackets. (B) Composite profile showing H3K9me3 (green) and H3K27me3 (red) coverage along different transposon sequences at D0, D6 and D15 of medium conversion. (C) Representative genomic regions comprising LINE1 and ERV repeats that gain H3K27me3 in their 3’ end during the conversion, while maintaining H3K9me3 in the 5’ end. Data represent normalized read density.
Figure 5—figure supplement 1
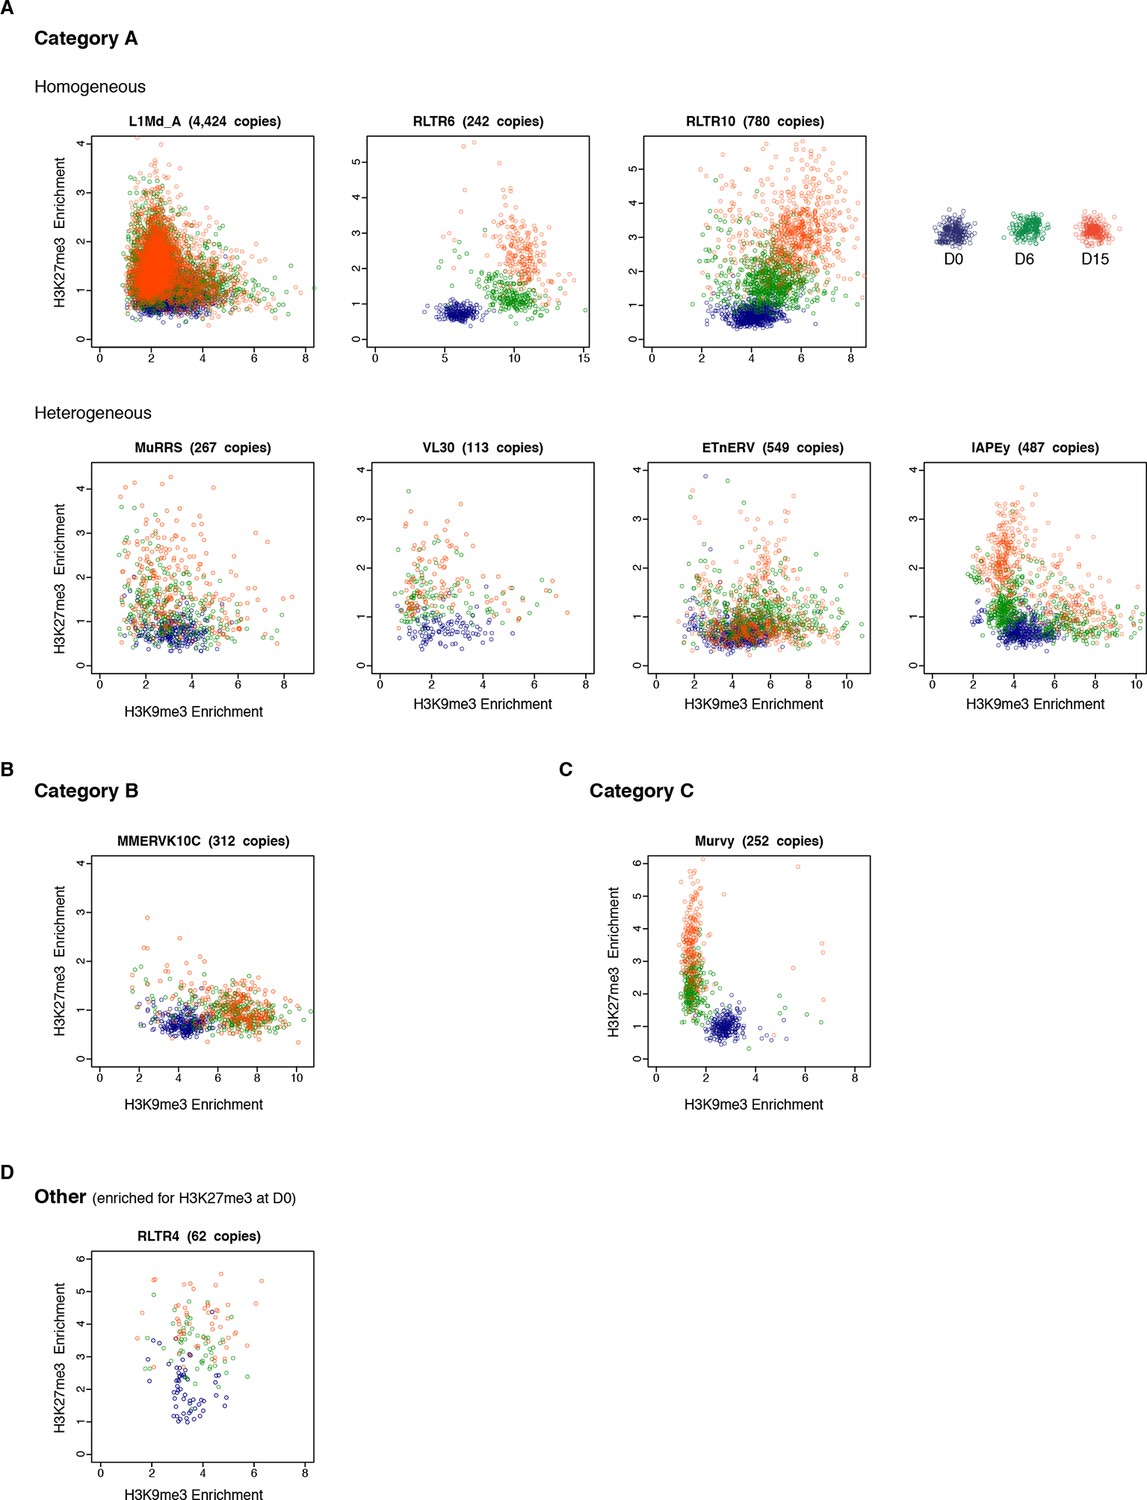
Intra-familial heterogeneity of H3K9me3 and H3K27me3 in transposons.
Normalized H3K9me3 and H3K27me3 enrichment over input at individual elements from different transposon families. Each dot represents a single element at D0 (blue), D6 (green) and D15 (red). Only 'intact' (integrity score>0.8) elements were considered. Data represent the average between two biological replicates. The number of distinct transposon copies considered is indicated next to the name of the family. (A) Member of the A category of transposons that are marked by both H3K9me3 and H3K27me3 in 2i+vitC. (B) B category, with exclusive H3K9me3. (C) C category, with exclusive H3K27me3. (D) RLTR4 is the only transposon marked by H3K27me3 in serum.
Figure 5—figure supplement 2
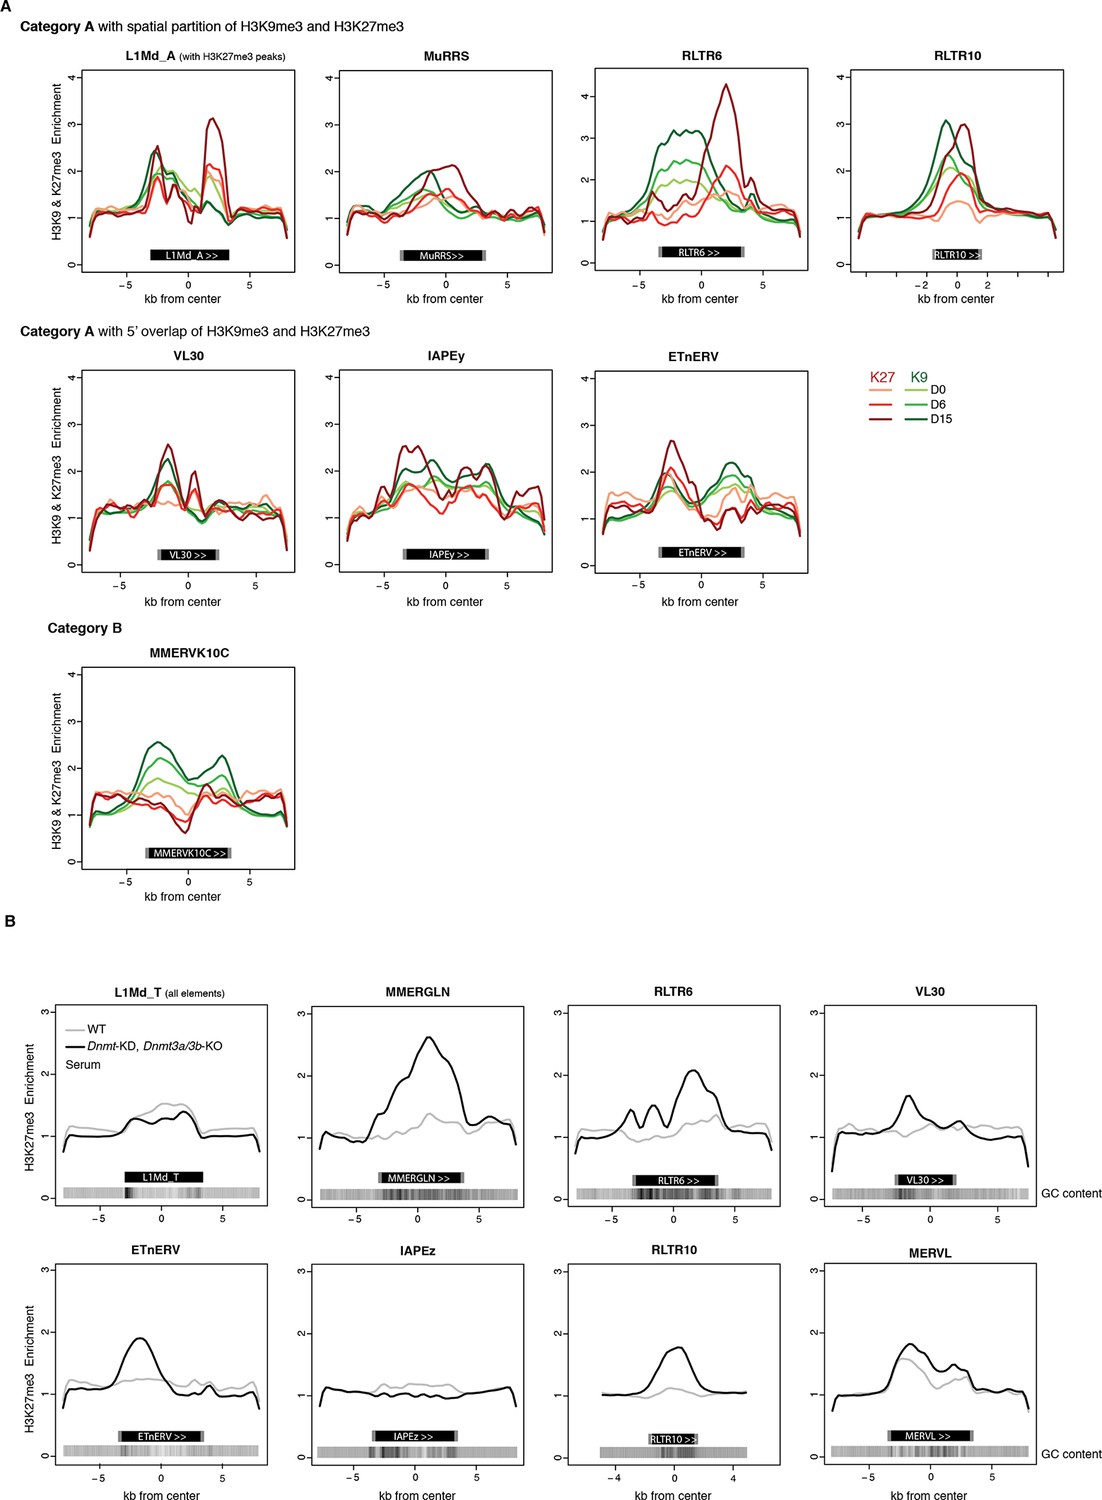
H3K9me3 and H3K27me3 mark transposon sequences but do not spatially overlap.
(A) Composite profile of H3K9me3 and H3K27me3 coverage on and +/- 5kb around different transposon sequences at D0, D6 and D15 of 2i+vitC conversion. Only intact (score >0.8) and full-length elements were analysed. For LINEs specifically, coverage was only represented on elements where an H3K27me3 peak was detected upon peak calling. (B) Composite profile of H3K27me3 coverage on and +/- 5kb around different transposon sequences in WT and Dnmt-tKO (Dnmt3A/3B-dKO; Dnmt1 KD) DNA methylation-deficient ES cells. ChIP-seq datasets were taken from Brinkman et al., 2012.
Figure 6 with 2 supplements

Complex regulation of transposons by SUV39H, TRIM28, SETDB1 and EED upon loss of DNA methylation.
Expression levels in Suv39h-dKO, Trim28+/-, Setdb1+/-, Eed-KO, Suv39h-Eed-tKO and WT J1 ES cells for: (A) LINE1 (category A) (B) IAPEz (category B) (C) MERVL (category C) Expression levels were measured by Nanostring nCounter. Data are expressed as fold changes to WT D0 and represent mean ± SEM between two (Trim28 and Setdb1), three (Suv39h and Suv39h-Eed-tKO), four (Eed-KO) and eight (J1) biological replicates. *p<0.05, **p<0.01 and ***p<0.001 (unequal variances t-test between WT and mutants at a given day).
Figure 6—figure supplement 1
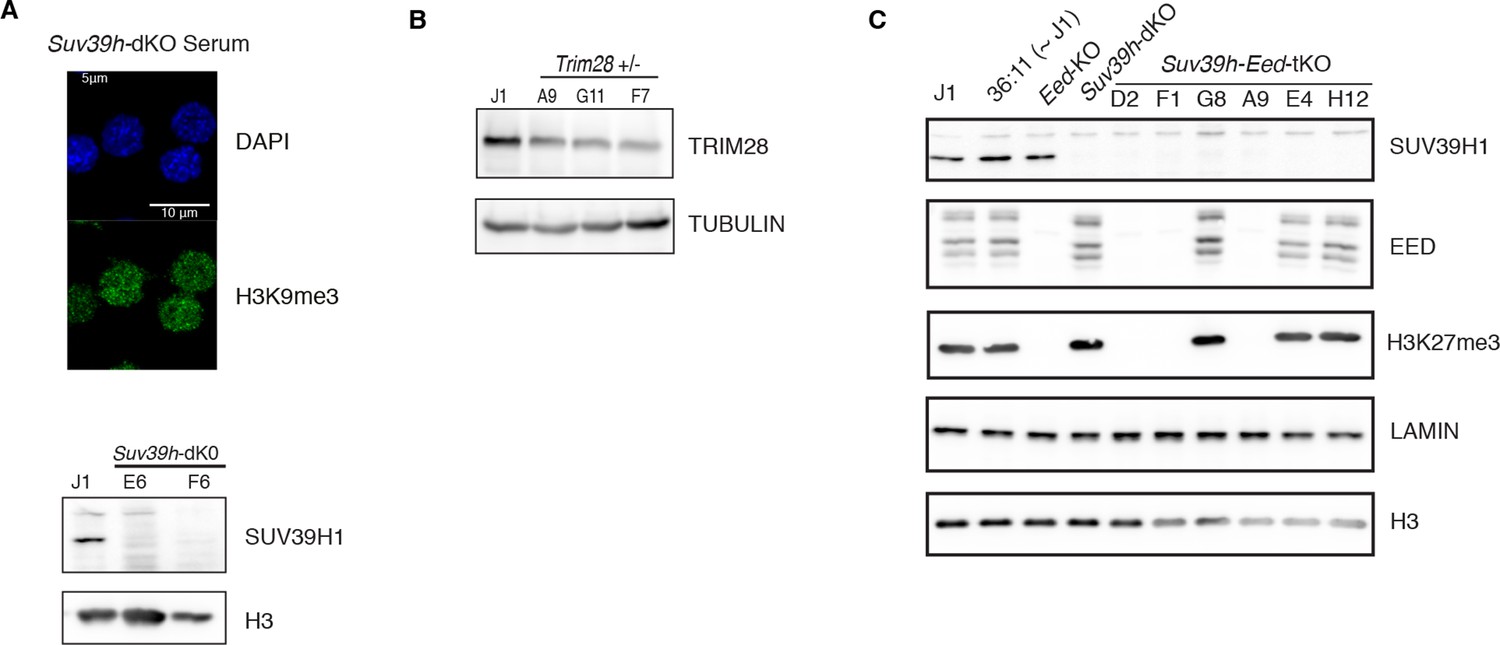
Caracterization of genetic mutants.
(A) Characterization of Suv39h-dKO ES cells: loss of H3K9me3 at pericentric heterochromatin assessed by immunofluorescence (upper panel, compare with Figure 4—figure supplement 1A at D0 for WT) and lack of SUV39H1 protein assessed by western blot (lower panel). (B) Characterization of CRISPR/Cas9- generated Trim28+/- ES cells: western blot showing the level of reduction of TRIM28 protein in three independent clones. Clone F7 was used for subsequent experiments. (C) Characterization of CRISPR/Cas9- generated Suv39h-Eed-tKO ES cells: western blot showing lack of SUV39H1, EED and H3K27me3 in independent clones. Clones D2, F1 and A9 were used as biological replicates in subsequent experiments.
Figure 6—figure supplement 2
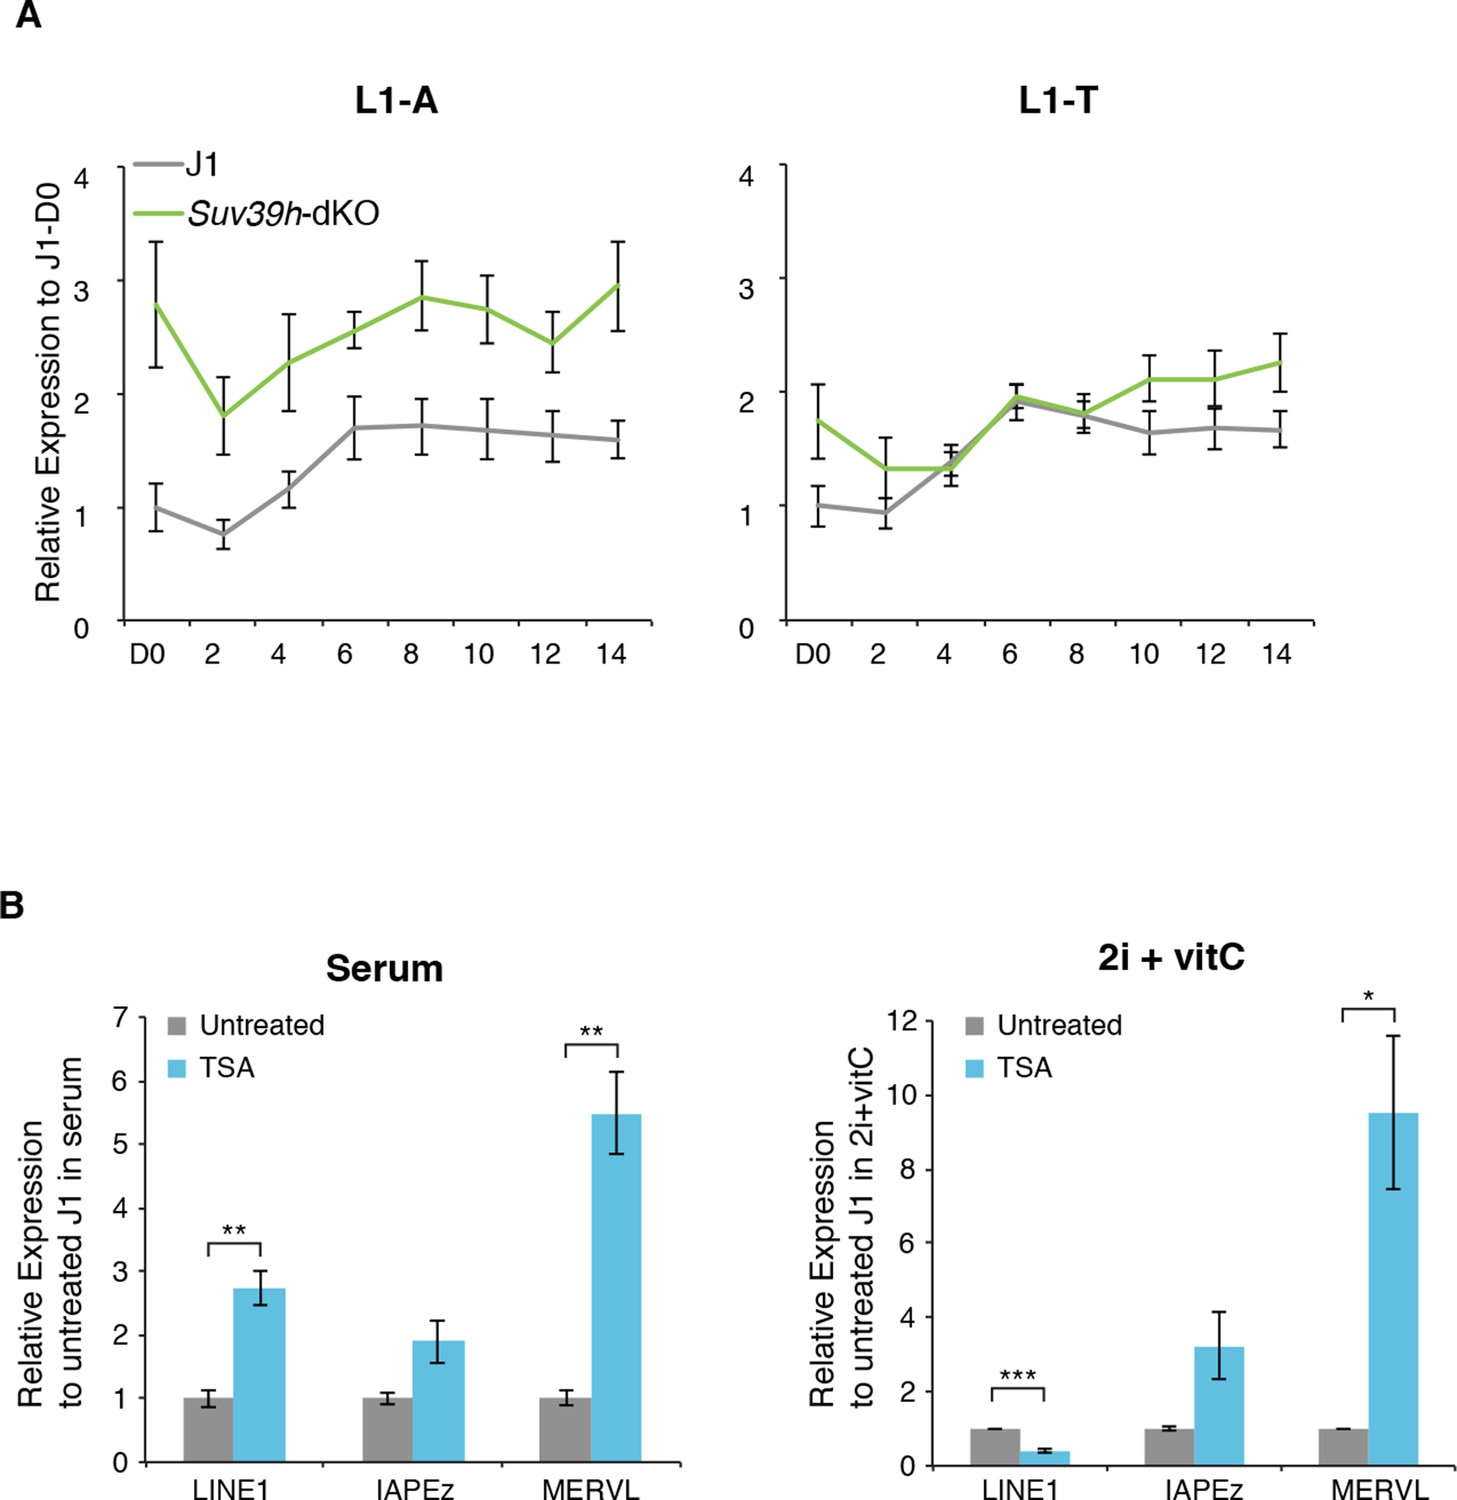
Regulation of transposons by HDACs
(A) Expression levels in Suv39h-dKO for L1-A and L1-T families measured by Nanostring nCounter. Data are expressed as fold changes to WT D0 and represent mean ± SEM between three (Suv39h-KO) and eight (J1) biological replicates. (B) Expression levels in WT ES cells treated with the HDACs inhibitor Trichostatin A (TSA) for 24 hr measured by RT-qPCR. Values were normalized to Gapdh and Rplp0. Data are expressed as the fold change to untreated cells and represent mean ± SEM between two (untreated control) and four biological replicates (treated with 25 or 50 ng/mL of TSA, with undistinguishable effect between the two concentrations). *p<0.05, **p<0.01 and ***p<0.001 (unequal variances t-test).
Figure 7 with 1 supplement
Polycomb regulates transposons in absence of DNA methylation.
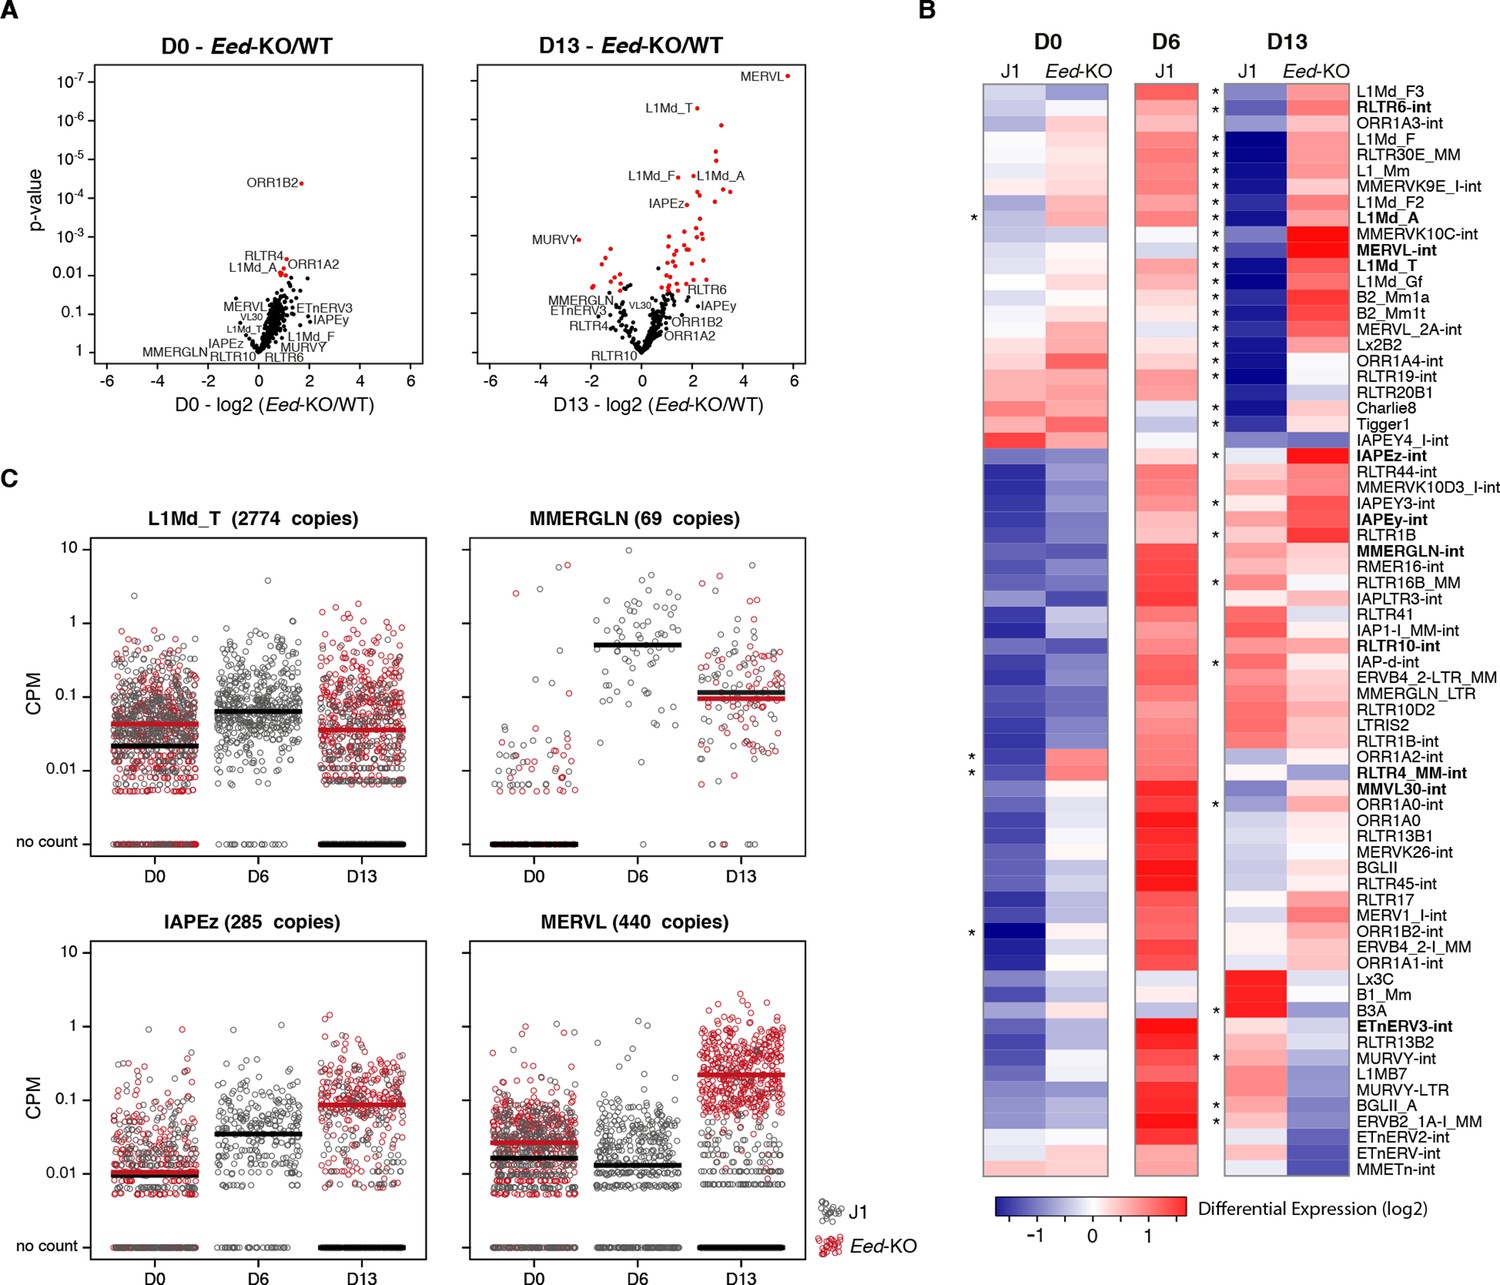
(A) Volcano plot representation of up- and down-regulated transposons as measured by RNA-seq between WT and Eed-KO cells at D0 (left) and D13 of conversion (right). Red dots indicate significantly misregulated repeats between two conditions (fold change >2 and p-value <0.05). (B) Heatmap representation and hierarchical clustering of expression changes for 69 transposon families at D0, D6 and D13, in WT and Eed-KO cells. Colors represent on a log2-scale the differential expression between a given condition and the average of the five conditions. *p<0.05. (C) Expression of individual elements from different transposon families at D0, D6 and D13, in WT and Eed-KO cells, expressed in CPM. The black and red bars represent the median of the distribution, for WT and Eed-KO, respectively.
Figure 7—figure supplement 1
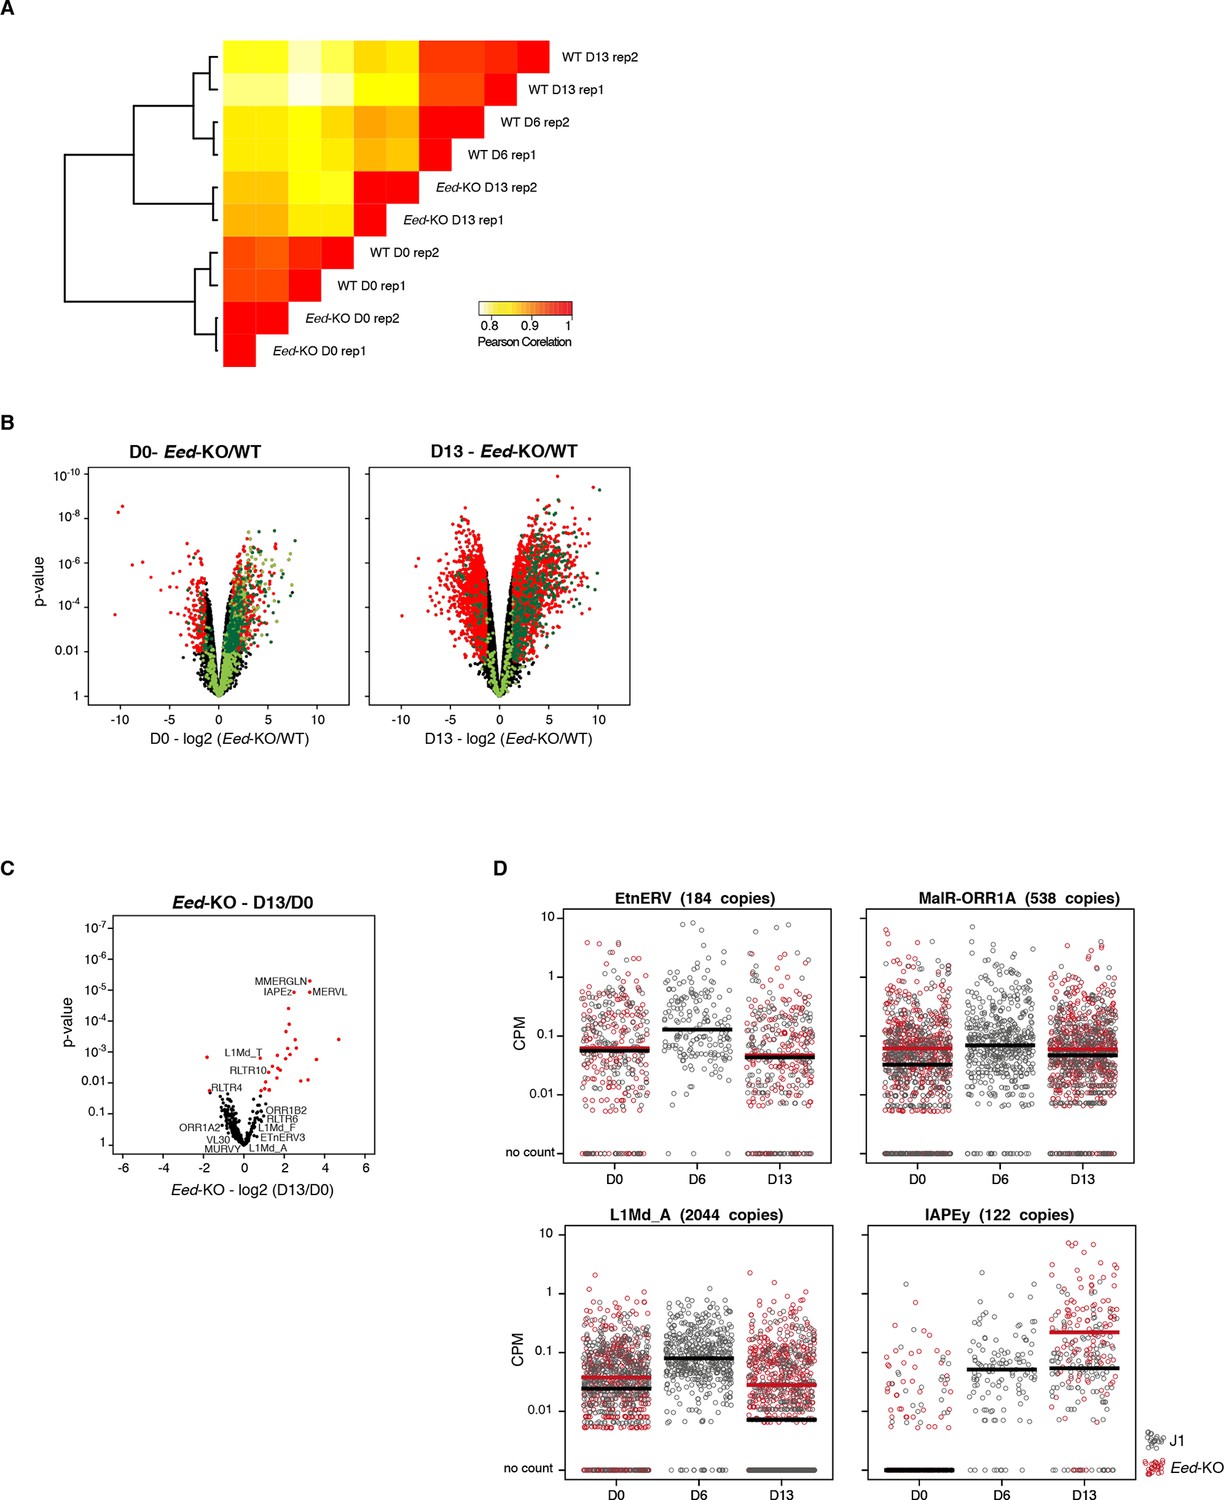
RNA-seq of Eed-KO ES cells
(A) Pearson correlation and hierarchical clustering between RNA-seq experiments. (B) Volcano plot representation of up- and down-regulated genes as measured by RNA-seq between WT and Eed-KO at D0 (left) and D13 (right). Light and dark green dots represent genes with a H3K27me3 peak in promoter regions (2222 and 1870 genes at D0 and D13, respectively). Red and dark green dots indicate significantly misregulated genes (fold change >4 and p-value <0.01). (C) Volcano plot representation of up- and down-regulated transposons as measured by RNA-seq between D0 and D13 in Eed-KO. Red dots indicate significantly misregulated repeats between two conditions (fold change >2 and p-value <0.05). RNA-seq mapping allowed multiple hits onto the genome. (D) Expression of individual elements from different transposon families at D0, D6 and D13, in WT and Eed-KO, in Count per Millions (CPM). Each dot represents a single element. RNA-seq mapping allowed only unique hits in the reference genome; only elements with a minimum of 10 reads in at least one of the sample were conserved. The black and red bars represent the median of the distribution, for WT and Eed-KO, respectively. Analyzed numbers of distinct transposon copies per family appear into brackets.
Figure 8
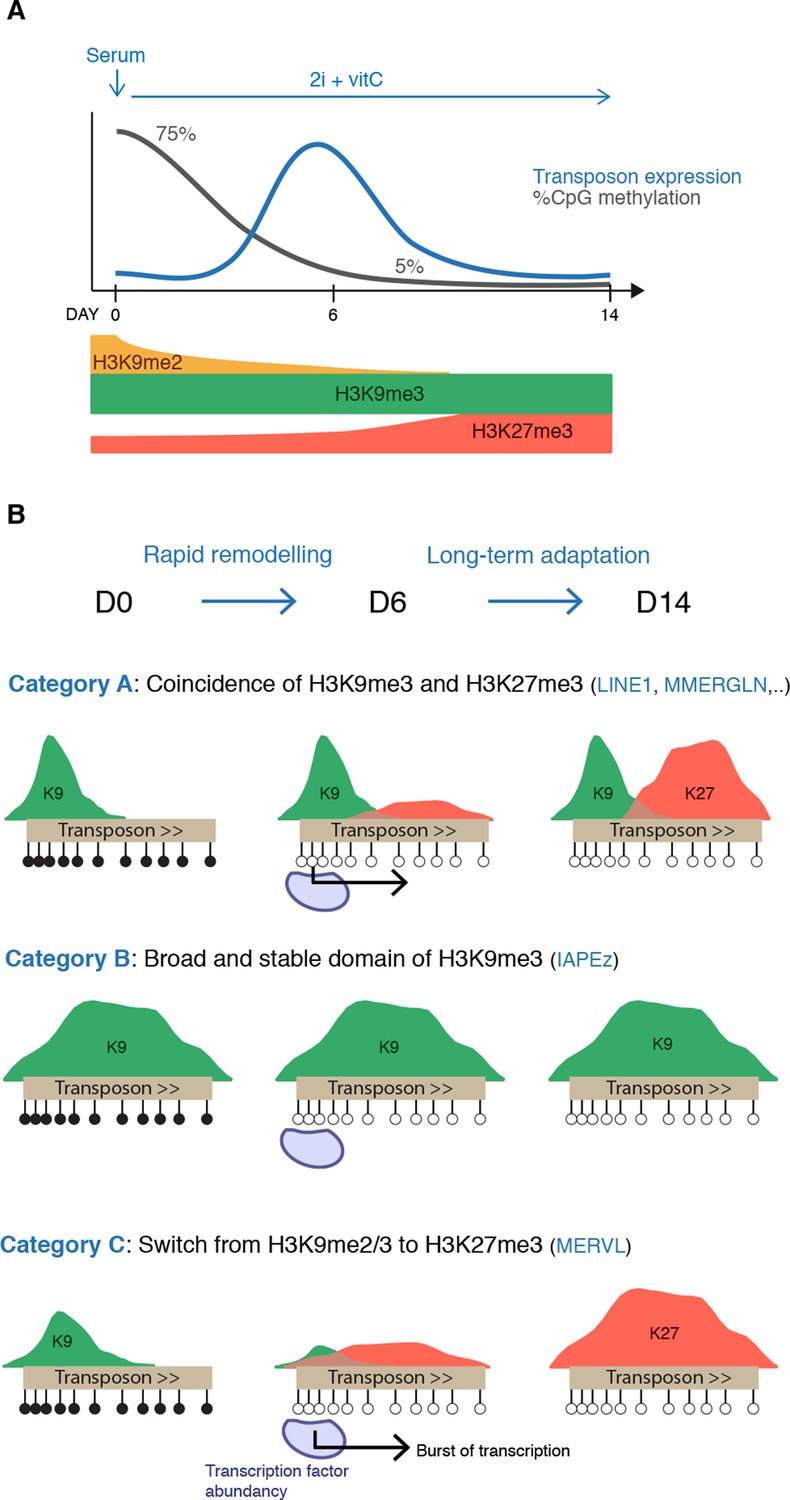
Model for the acquisition of H3K27me3 at transposons during genome-wide demethylation.
(A) Summary of chromatin and transcriptional changes during conversion from serum to 2i+vitC. DNA methylation and H3K9me2 are rapidly erased, H3K9me3 remains stable and H3K27me3 increases. Transposon expression peaks at D6. (B) Model for the acquisition of H3K27me3 at transposons: upon loss of DNA methylation, H3K27me3 appears at GC-rich, H3K9me3 free-regions. Relative enrichments in H3K9me3 and H3K27me3 define three main types of repressive chromatin organization. Category A transposons are marked by H3K9me3 on their 5’ end and gain H3K27me3 on their 3’ region. Category B transposons are fully covered by H3K9me3 and do not gain H3K37me3. Category C transposons lose H3K9me2 and H3K9me3 and acquire H3K27me3 decoration on their full length. At D6 of 2i+vitC conversion, the abundance of pluripotent transcription factors and the loose chromatin environment likely contribute to the burst of transposon expression.
Additional files
-
Supplementary file 1
WGBS, RNA-seq and ChIP-seq statistics
- https://doi.org/10.7554/eLife.11418.025
-
Supplementary file 2
(A) Number and percentage of active transposable elements at D0, D6 and D13 during conversion from serum to 2i+vitC.
Elements were considered as 'active' when they were covered by at least 10 uniquely mapped reads at one of the time point. Percentages represent the proportion of active copies relative to the total number of elements in a given family, as estimated from the reconstructed version of RepeatMasker. For ERVs, solo-LTRs were excluded and numbers represent only elements containing internal sequences. (B) Gene Ontology enrichment analysis for genes specifically up-regulated between D0 and D6. Gene ontology analysis for biological processes and molecular functions was performed for the 156 genes that were significantly up-regulated between D0 and D6 but with no significant differences between D0 and D13. The ten most significant terms are shown. (C) List of chimeric transcripts identified during conversion from serum to 2i+vitC. The 30 genes with the highest number of chimeric reads at D6 are ranked here. Numbers represent the absolute read count at the junction between the transposon (first exon) and the second exon of the gene, and the normalized read count of the whole transcript in RPKM. (D) Primer and sequence list. (E) Antibody list.
- https://doi.org/10.7554/eLife.11418.026
Download links
A two-part list of links to download the article, or parts of the article, in various formats.
Downloads (link to download the article as PDF)
Open citations (links to open the citations from this article in various online reference manager services)
Cite this article (links to download the citations from this article in formats compatible with various reference manager tools)
An epigenetic switch ensures transposon repression upon dynamic loss of DNA methylation in embryonic stem cells
eLife 5:e11418.
https://doi.org/10.7554/eLife.11418


