Molecular mechanism of thermosensory function of human heat shock transcription factor Hsf1
- Zentrum für Molekulare Biologie der Universität Heidelberg, Germany
Figures
Figure 1
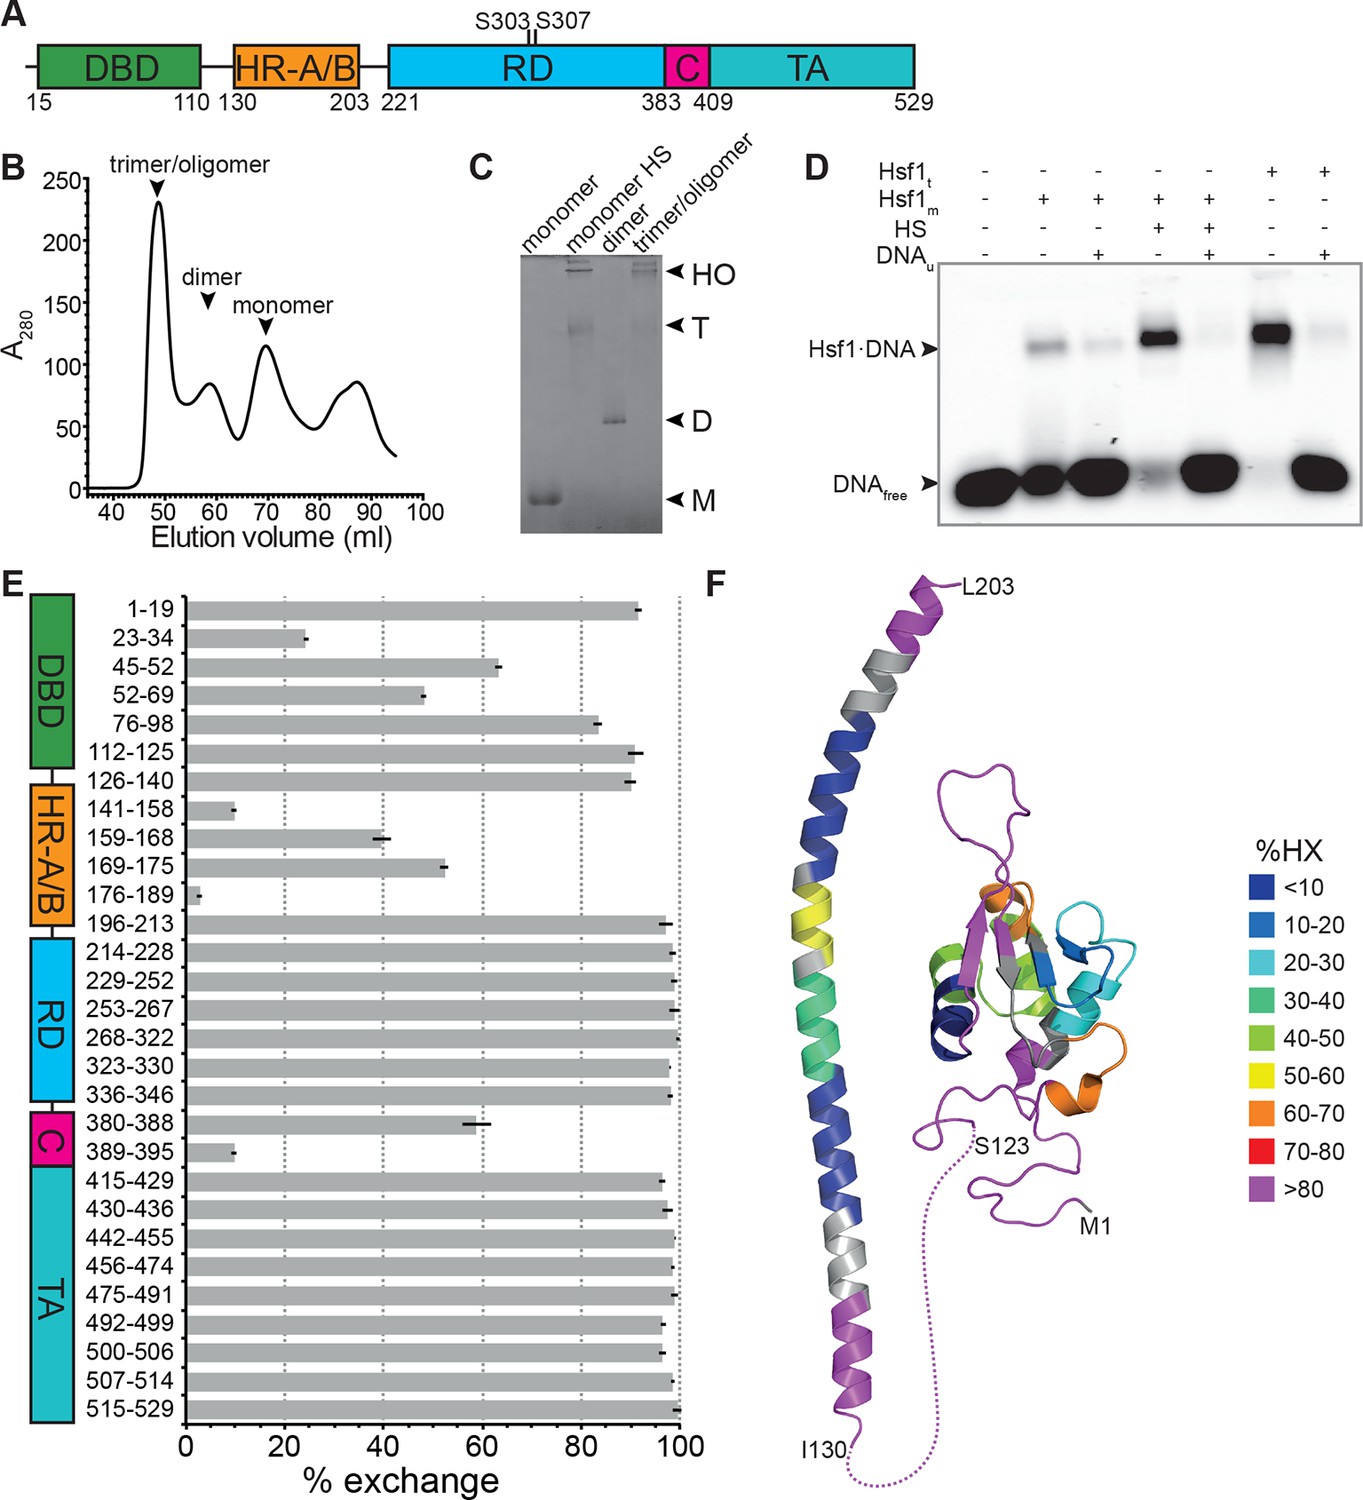
Recombinant purified human Hsf1 is largely monomeric and trimerizes and acquires DNA binding competence upon heat shock.
(A) Domain organization of human Hsf1 [modified from Anckar and Sistonen (2011)]. (B) Size exclusion chromatography separates recombinant human Hsf1 in monomer, dimer and trimer/oligomer as indicated. (C) Blue native gel of the three peak indicated in panel B (monomer and dimer), monomeric Hsf1 after 10 min heat shock at 42°C (monomer HS); and trimeric/oligomeric Hsf1 purified under denaturing conditions and refolded into a DNA binding competent state (M, monomer; D, dimer; T, trimer; HO, higher order oligomers). (D) Electrophoretic mobility shift assay (EMSA). Monomeric Hsf1 (Hsf1m), monomeric Hsf1 treated for 10 min at 42°C (HS), or trimeric Hsf1 (Hsf1t) were incubated with fluorescent labeled HSE-DNA minus or plus unlabeled HSE-DNA and separated on a native agarose gel. Lane 1, HSE-DNA in the absence of protein. (E) Amide hydrogen exchange of monomeric Hsf1 after 30 s at 20°C in D2O buffer. Exchange was correct for back exchange using a fully deuterated Hsf1 preparation. Error bars are the standard error of mean (SEM) of three independent experiments. (F) Cartoon representation of the DNA binding (PDB ID 2LDU) and trimerization domains of human Hsf1 colored according to deuteron incorporation as indicated. Gray, no sequence coverage. The trimerization domain is a homology model of the HR-A/B region (residues 130–203) of human HSF1 on the structure of Chaetomium thermophilum Skn7 [PDB ID 5D5Z, (Neudegger et al., 2016) using I-TASSER (Zhang, 2008; Yang and Zhang, 2015; Yang et al., 2015; Roy et al., 2010)].
Figure 2 with 4 supplements
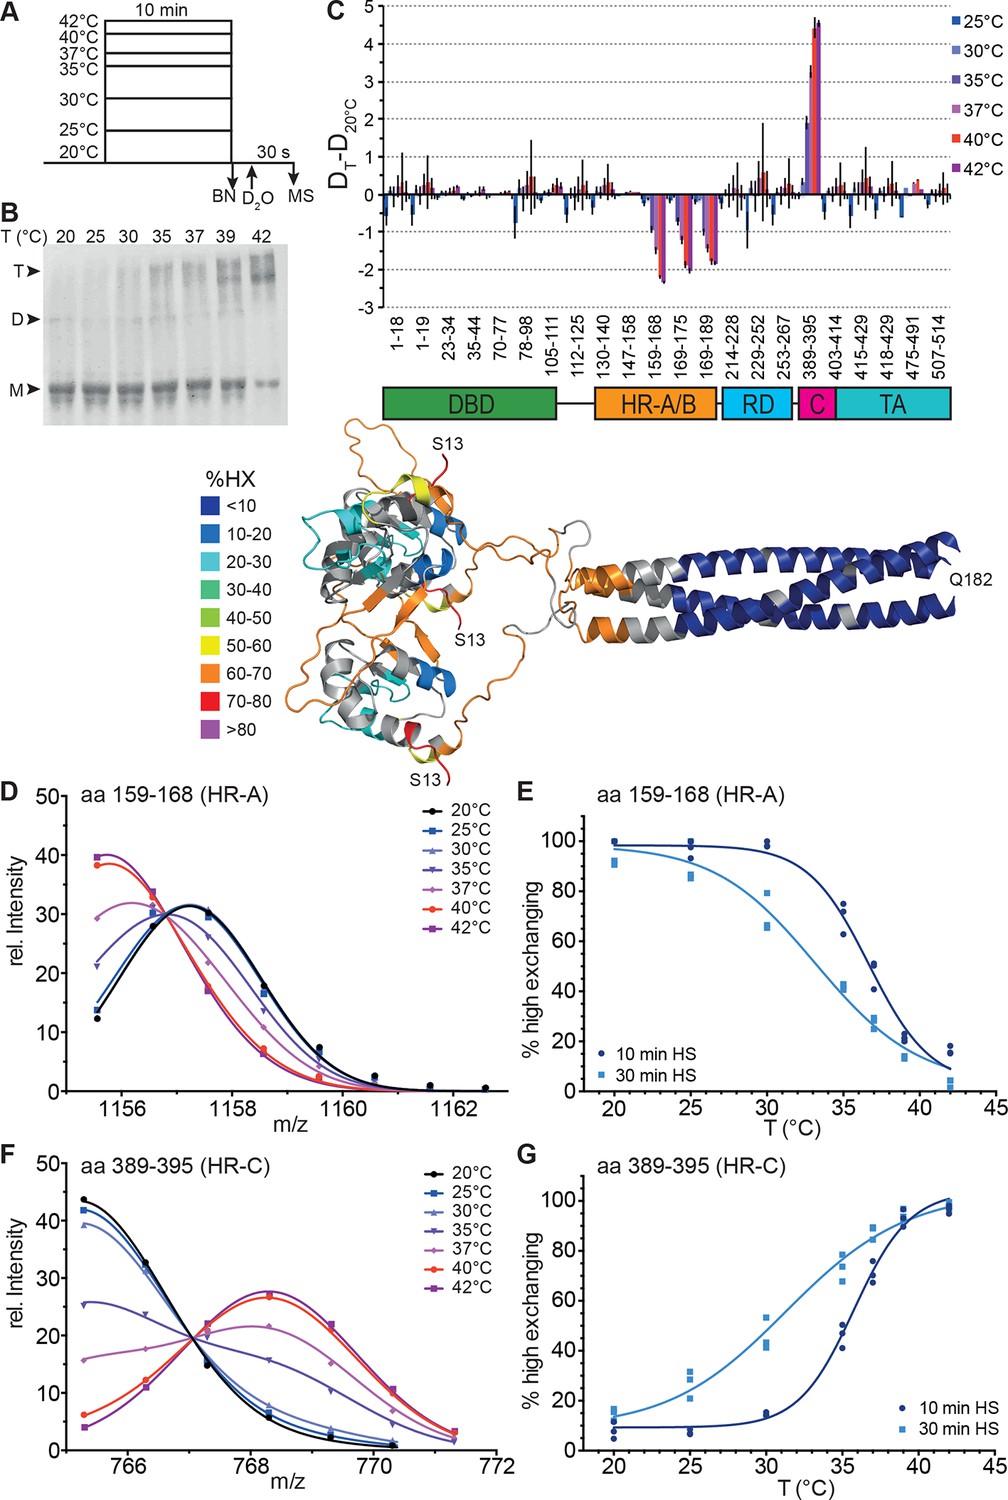
Human Hsf1 is a thermosensor.
(A) Experimental design: monomeric human Hsf1 was pre-incubated at different temperature as indicated for 10 min or 30 min and then either analyzed by blue native polyacrylamide gel electrophoresis (BN) or diluted 20-fold into D2O-buffer at 20°C and incubated for 30 s. The reaction was quenched and the samples analyzed by HPLC-MS. (B) Analysis of quaternary structure of Hsf1 after pre-incubation at different temperatures for 10 min as indicated. Hsf1 was detected by immunoblotting with an Hsf1 specific antiserum. M, monomer; D, dimer; T, trimer. (C) Difference plot of deuteron incorporation into monomeric Hsf1 pre-incubated at the indicated temperature minus deuteron incorporation of Hsf1 pre-incubated at 20°C for peptic peptides as indicated. Error bars are SEM of three independent experiments. Cartoons underneath the X-axis indicate the domains of Hsf1 corresponding to the respective peptic peptides and a homology model of the trimerized human HSF1 (kindly provided by A. Bracher [Neudegger et al., 2016]), colored according to HX as indicated. First and last amino acid of the model are indicated. (D, F) Intensity distributions of the isotope clusters of peptide 1155.581+ corresponding to amino acids 159–168 (D) and 765.301+ corresponding to amino acids 389–395 (F) for different pre-incubation temperatures, as indicated. Curves are fits of the sum of two Gaussian peak functions to the data (see Figure 2—figure supplement 2). Representative plot of three independent experiments. (E, G) Fraction of high-exchanging species calculated, as described in Figure 2—figure supplement 2. Data points for three independent experiments with 10-min (dark blue) and 30-min (light blue) pre-incubation time at elevated temperatures are shown for peptide 159–168 (E) and 389–395 (G). The curve is a fit of a thermal unfolding equilibrium to the data. Data for additional peptides are shown in Figure 2—figure supplement 3.
Figure 2—figure supplement 1
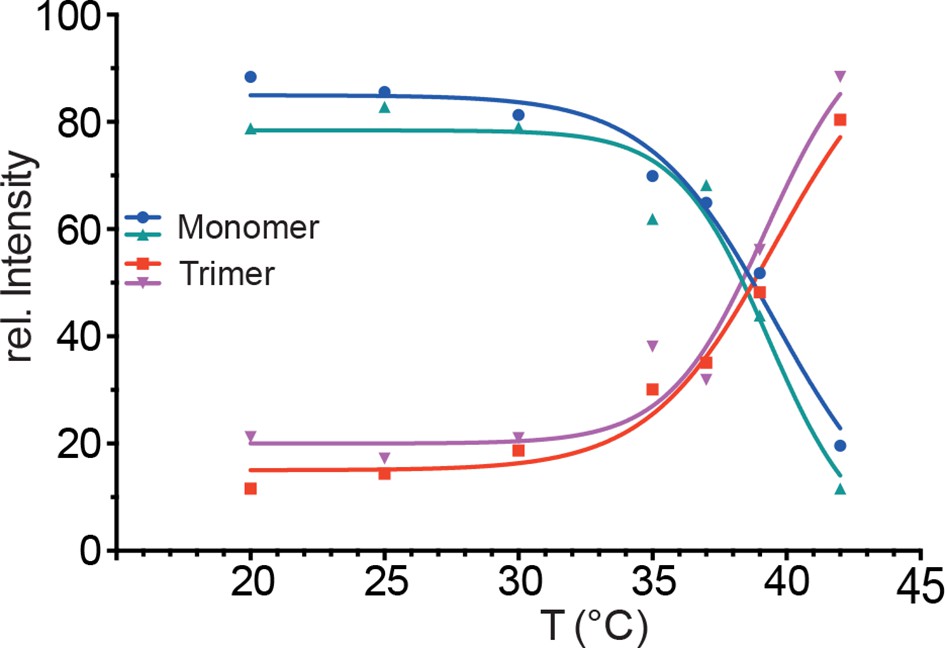
Temperature-induced transition of Hsf1 from the monomeric into the trimeric state as determined by blue native polyacrylamide gel electrophoresis.
Quantification of immune blots with Hsf1-specific antisera of blue native gels of two independent experiments, one of which is shown in Figure 2B. Curves are fits of the thermal unfolding equation to the data, restricting the minimal value to 0 and the maximal value to 100.
Figure 2—figure supplement 2
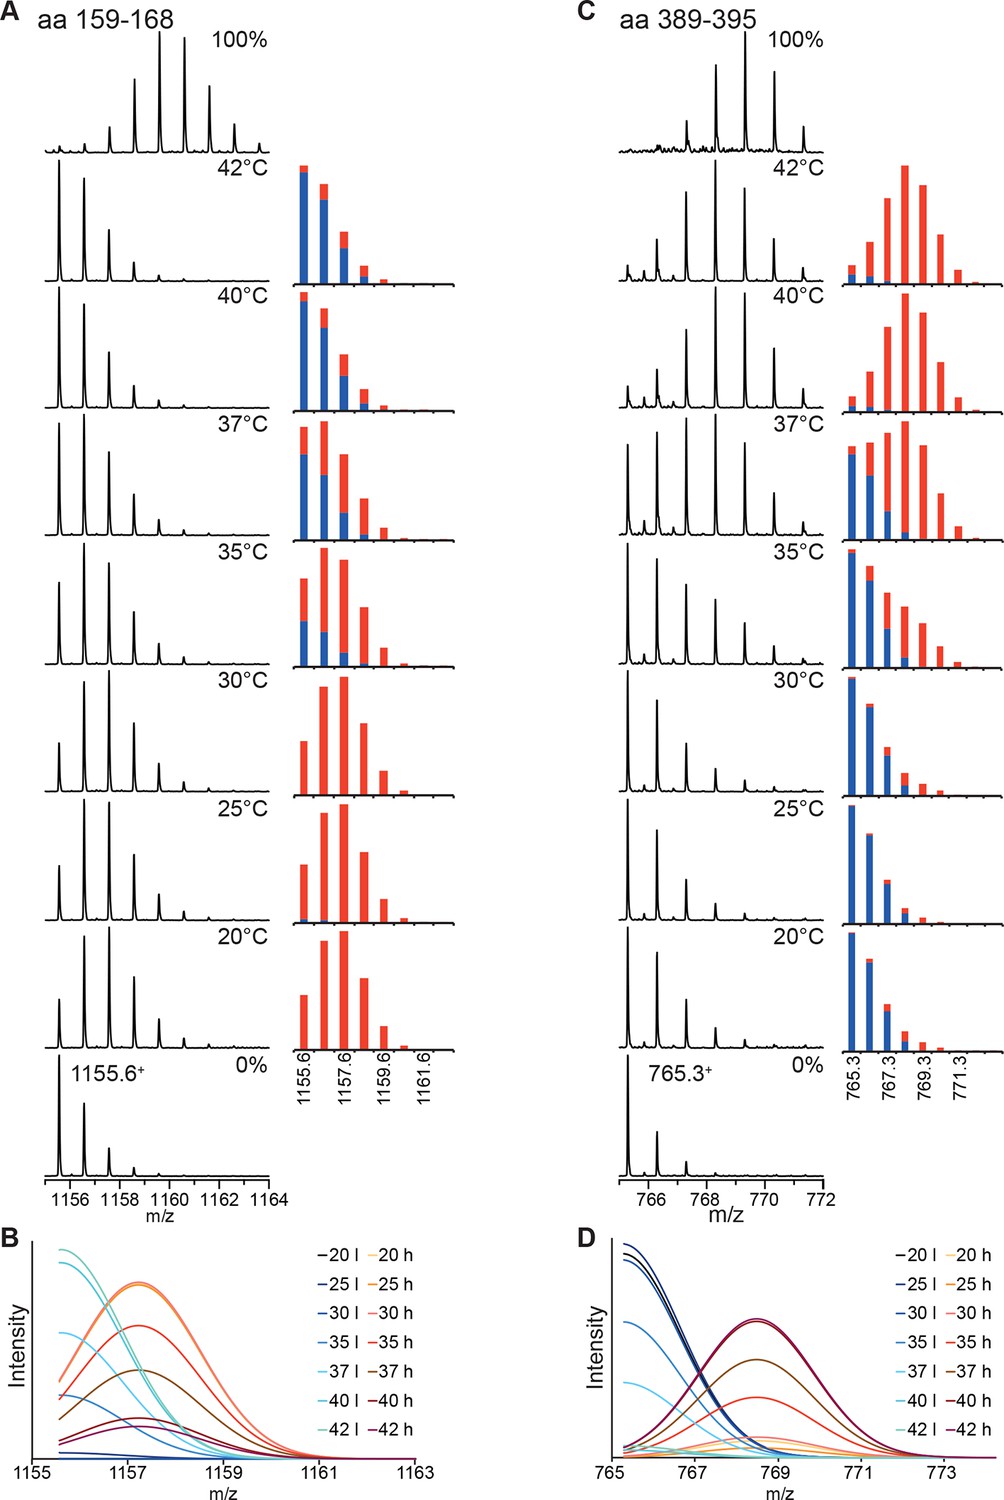
Analysis of the bimodal distributions of the isotope clusters detected by MS.
(A, C) Original spectra of peptic peptide 1155.61+ (amino acids 159–168; A left) and 765.31+ (aa 389–395; C, left) and fractional peak intensities (A, right, C, right) for low (blue) and high (red) exchanges species calculated from the parameters of the fits of the sum of two Gaussian peaks to the data shown in Figure 2. Unexchanged and 100% control are shown at the bottom and top, respectively. (B, D) Individual Gaussian peaks for high (h) and low (l) exchanging species for the indicated temperatures the sum of which results in the fits shown in Figure 2.
Figure 2—figure supplement 3
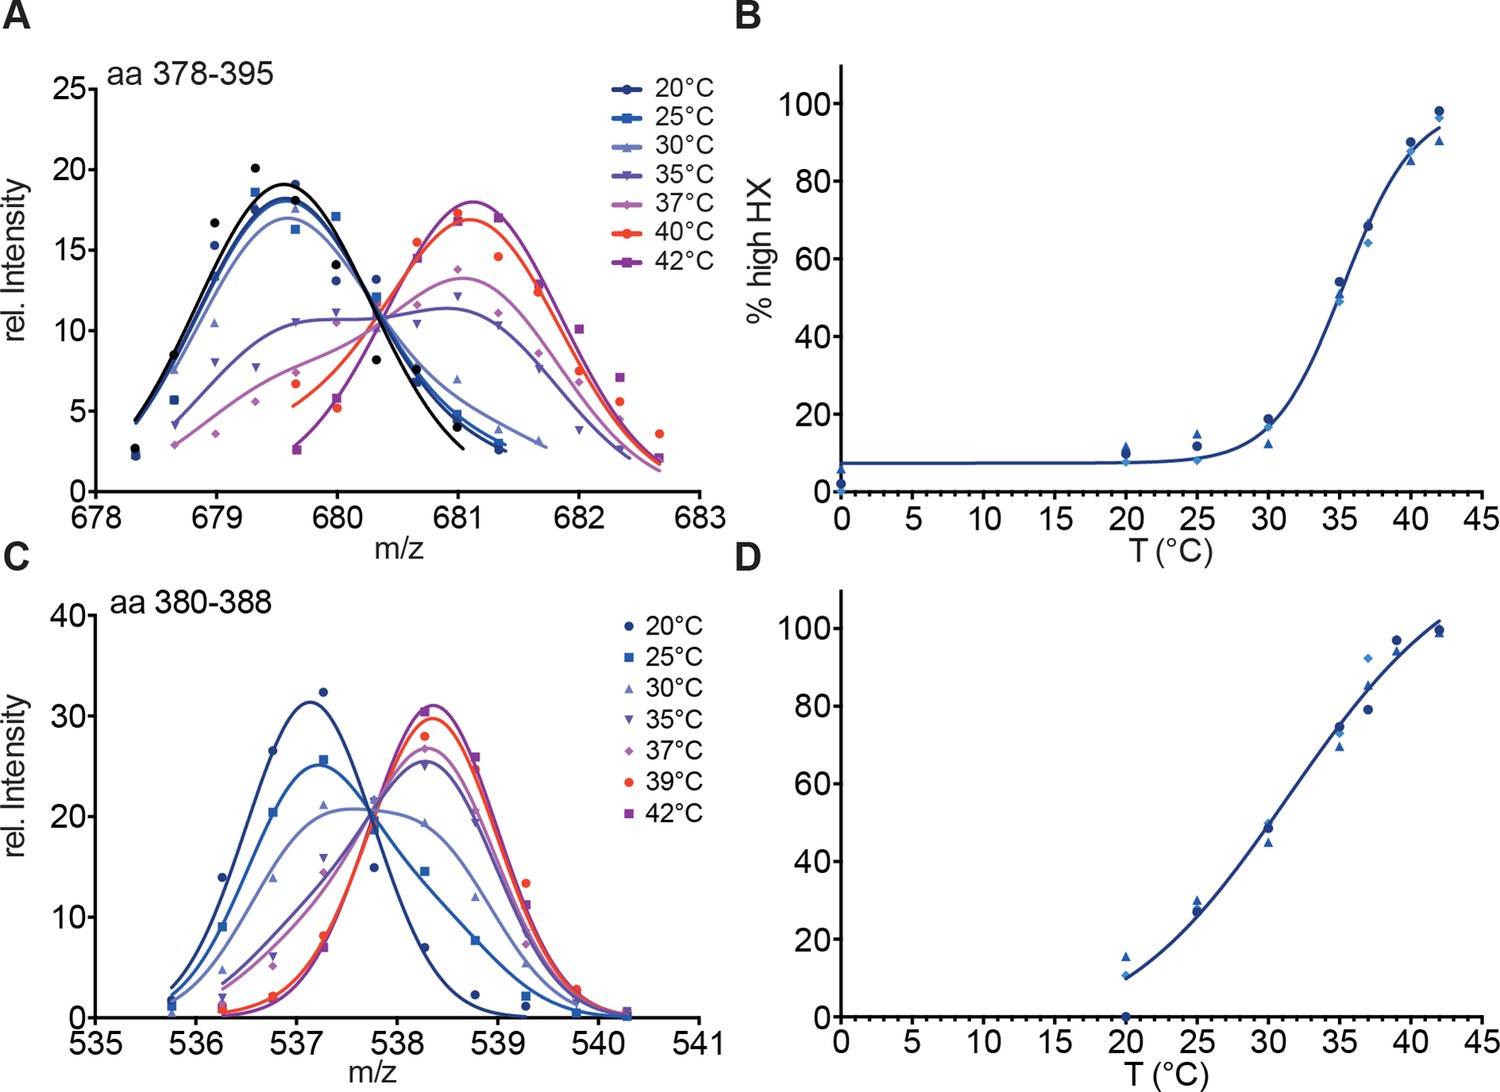
Hsf1 is a thermosensor.
(A) Intensity distributions of the isotope clusters of the peptic peptide 678.33+ corresponding to amino acids 378–395 of Hsf1 pre-incubated for 10 min at different temperatures as indicated. One representative plot of three independent experiments is shown. (B) Fraction of high-exchanging species calculated, as described in Figure 2—figure supplement 2. Data points for three independent experiments are shown in different shades of blue for peptide 378–395. The curve is a fit of a thermal unfolding equilibrium to the data. (C) Incubation for 30 min leads to shallower transition curves. Intensity distributions of the isotope clusters of peptic peptide 535.82+ corresponding to amino acids 380–388 of Hsf1 pre-incubated for 30 min at different temperatures, as indicated. One representative plot of three independent experiments is shown. (D) Fraction of high exchanging species calculated, as described in Figure 2—figure supplement 2. Data points for three independent experiments are shown in different shades of blue for peptide 380–388. The curve is a fit of a thermal unfolding equilibrium to the data.
Figure 2—figure supplement 4
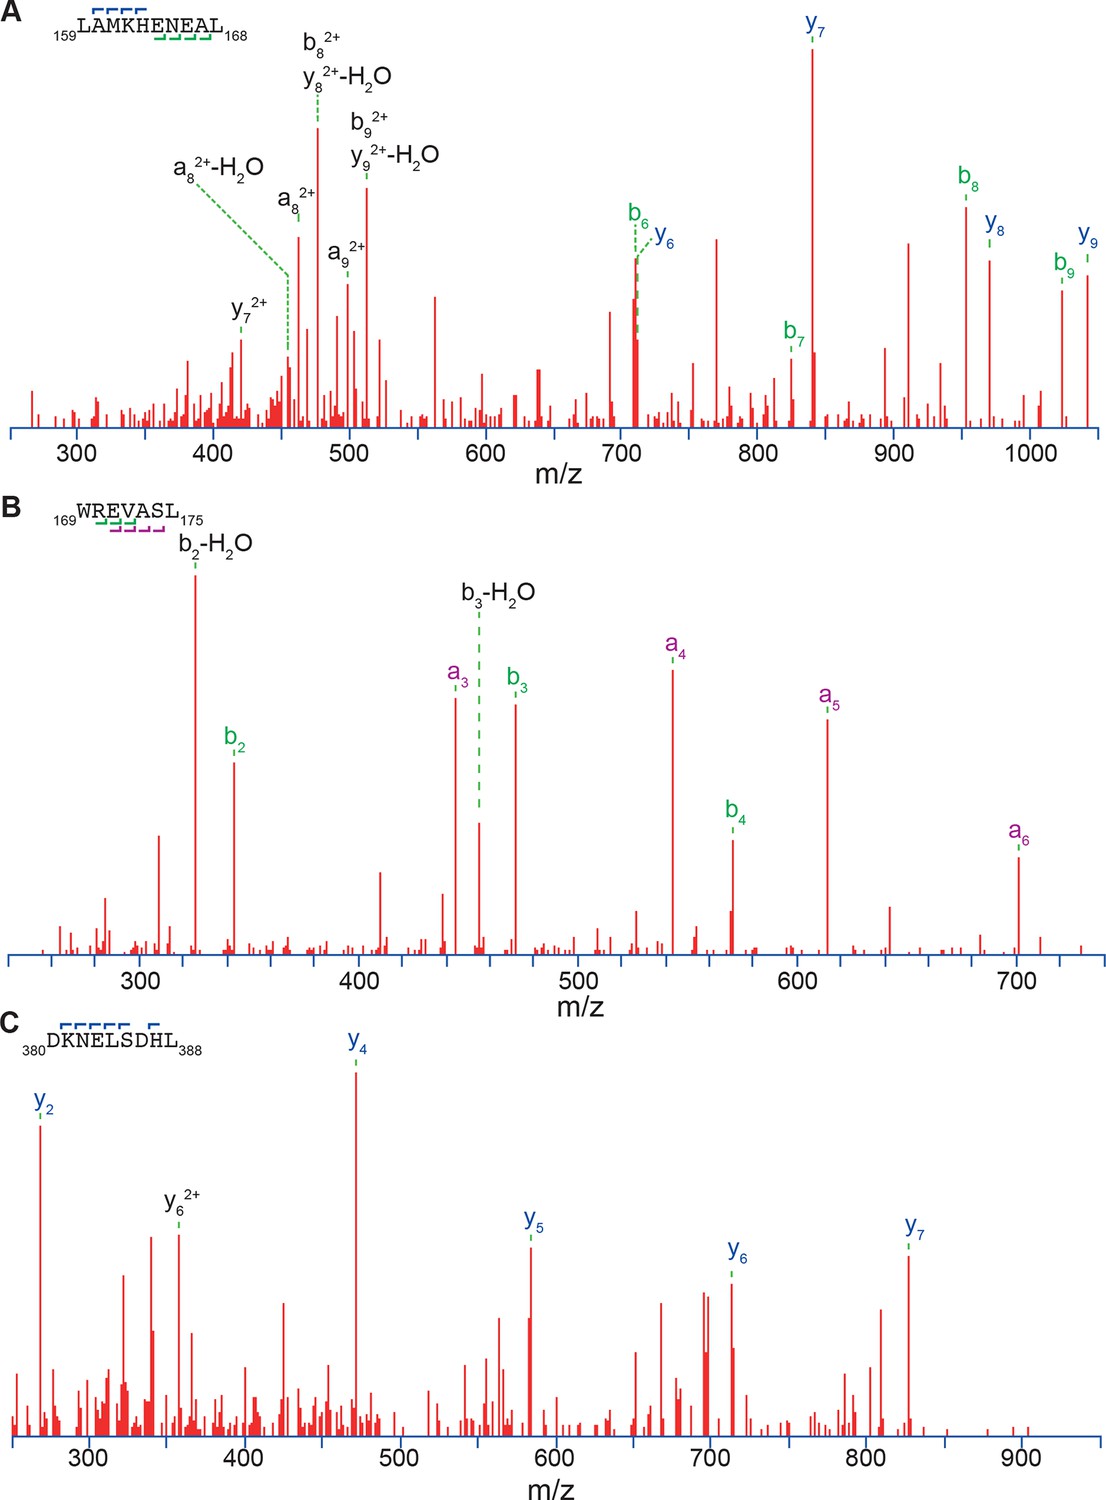
Three exemplary MS/MS spectra of peptic peptides used in the HX-MS analysis of Hsf1.
https://doi.org/10.7554/eLife.11576.008
Figure 3
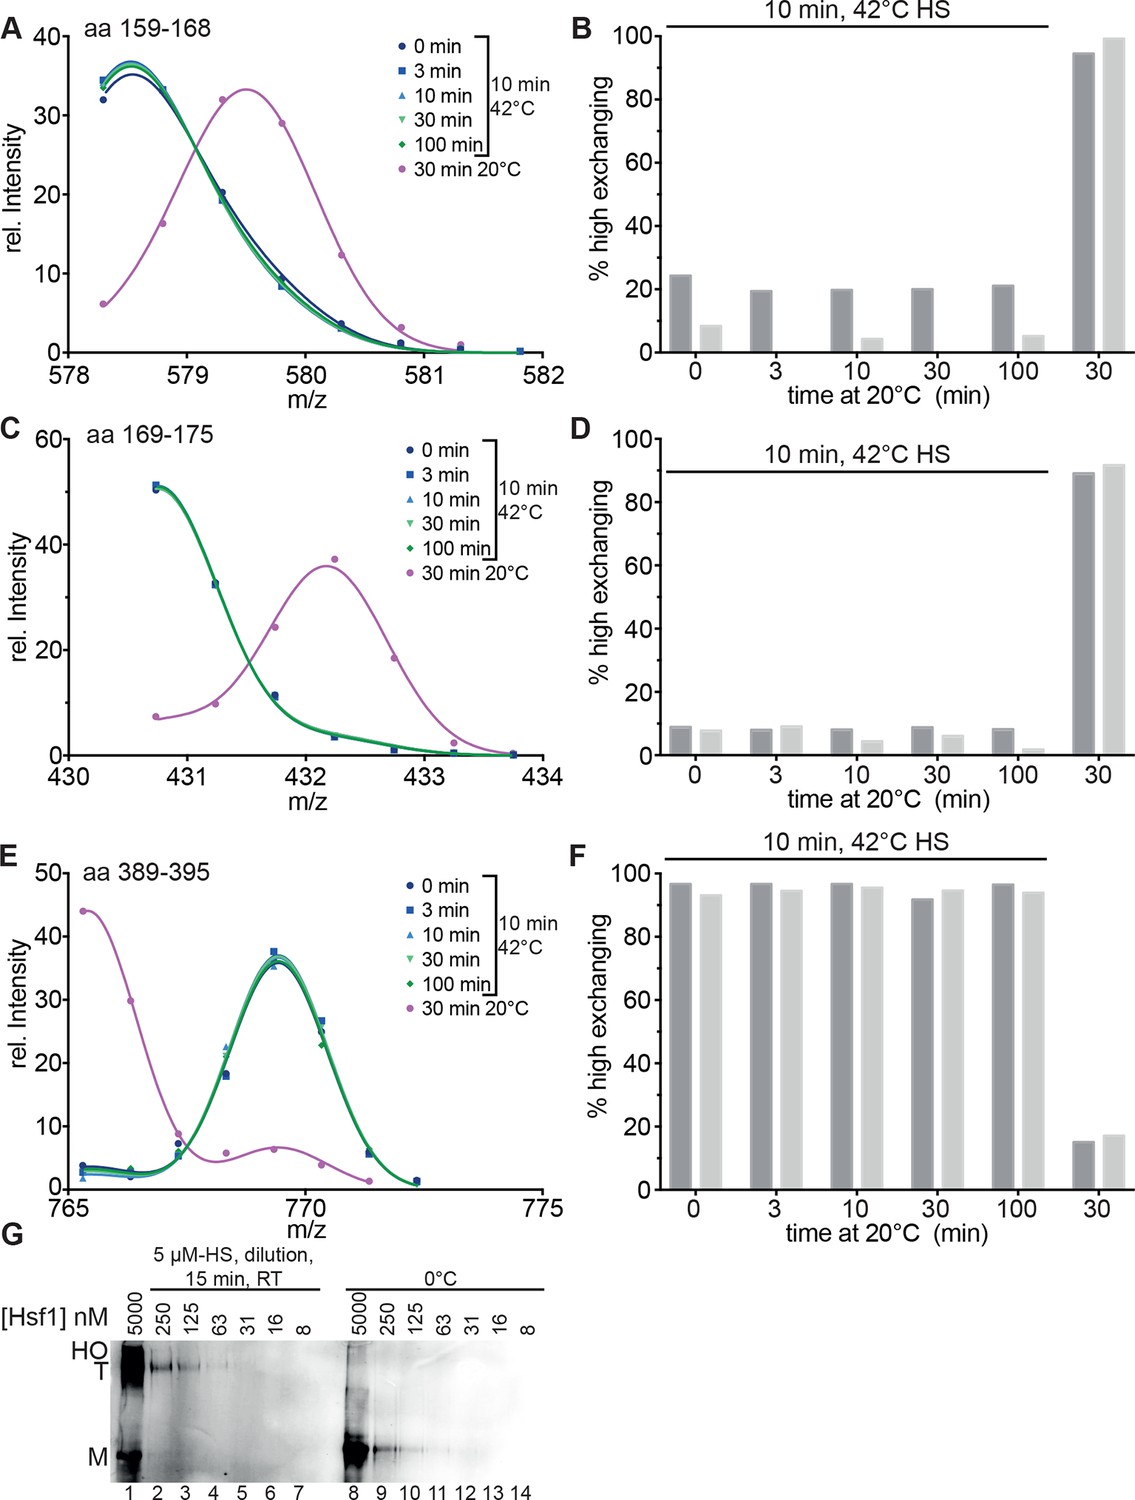
Heat-induced trimerization of Hsf1 is not reversible.
(A–F) Prolonged incubation at 20°C does not revert the heat shock induced changes in Hsf1 conformation. Hsf1 (5 µM) was incubated for 10 min at 42°C and then shifted to 20°C. Aliquots were diluted at different time points (0, 3, 10, 30, 100 min) for 30 s into D2O buffer and subsequently analyzed by LC-MS. As control, Hsf1 was not heat-shocked and incubated for 30 min at 20°C before dilution into D2O. Shown are the intensity-m/z data for the indicated peptides from HR-A region (A, aa 159–168, 578.292+; C, aa 169–175, 430.742+) and region HR-C (E, aa 389–395, 765.311+) with a global fit of an equation for two Gaussian peaks, as in Figure 2. The percentage of high exchanging species was calculated as described in Figure 2—figure supplement 2 (B, D, F). Data for two independent experiments are shown. (G) Dilution of heat-shocked Hsf1 does not lead to trimer dissociation. Hsf1 (5 µM) was heat-shocked at 42°C for 10 min, subsequently diluted as indicated, incubated at room temperature for 15 min, analyzed by blue-native gel electrophoresis, and detected by immune blotting with an human Hsf1 specific antiserum (lanes 1–7). Control samples were kept on ice before dilution and incubation at room temperature (lanes 8–14). M, monomer; T, trimer; HO, higher order oligomers (not detectable anymore upon dilution).
Figure 4
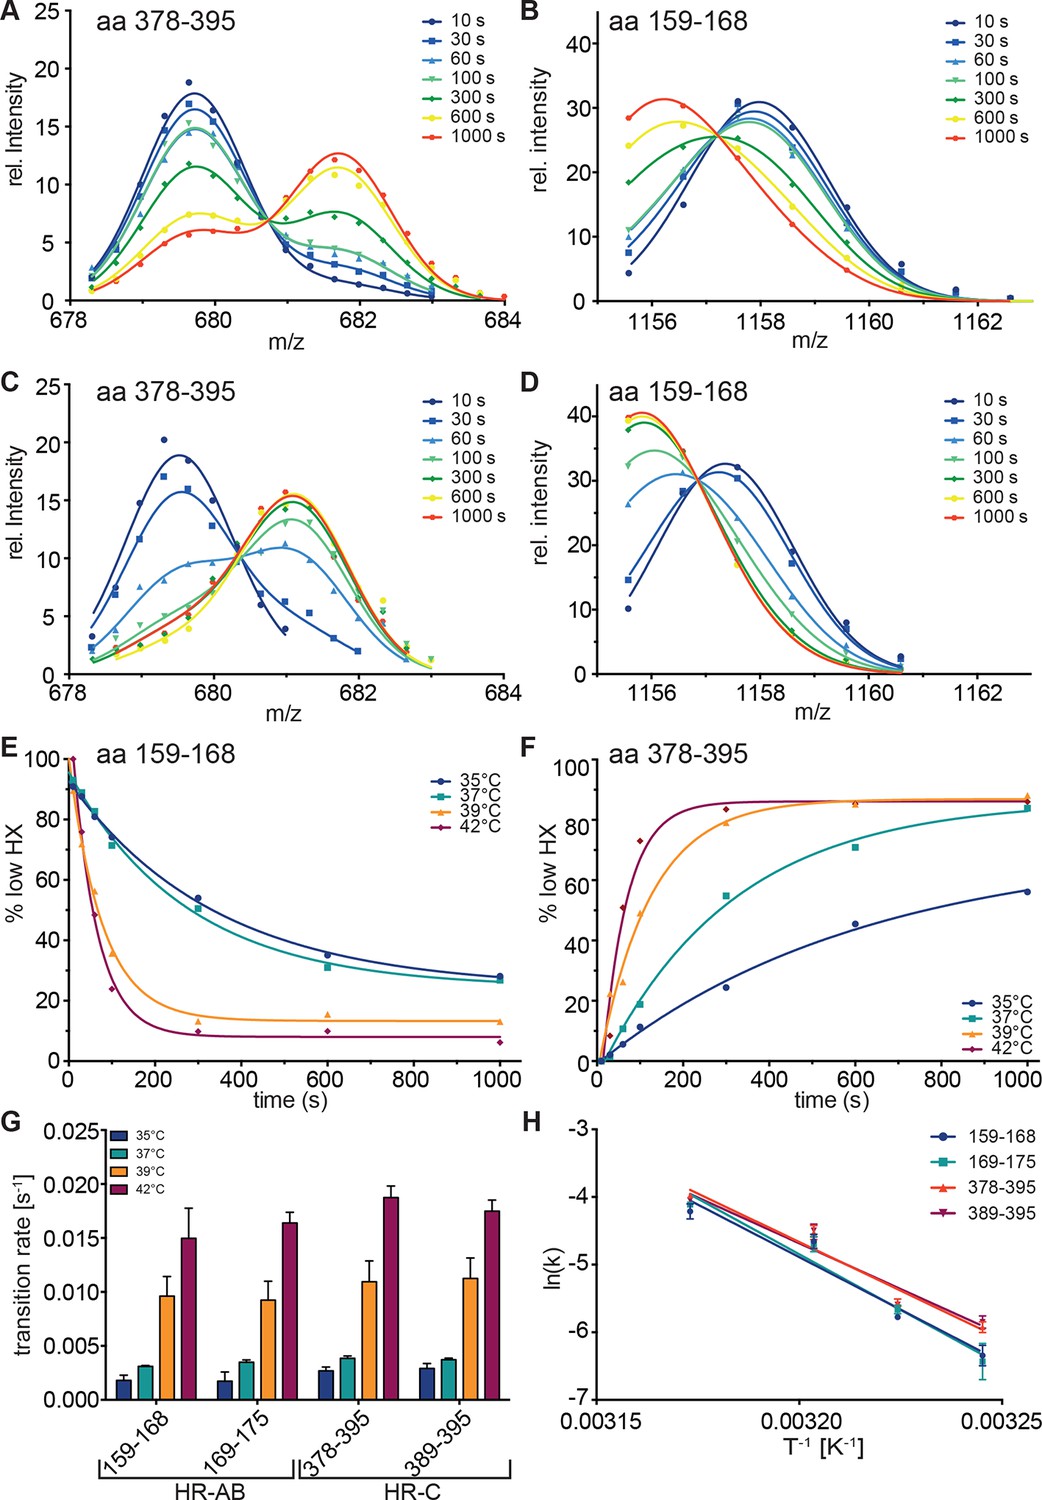
Kinetics of heat-induced conformational transitions in human Hsf1.
(A–D) Intensity distributions of the isotope clusters for peptide 678.323+ (aa 378–395) and 1155.581+ (aa 159–168) of Hsf1 incubated at 35°C (A and B) or 42°C (C and D) for 10 to 1000 s. Curves are fits of the sum of two Gaussian peak functions to the data. (E and F) Change in the fraction of low exchanging species for peptides 378–395 (E) and 159–168 (F) for 35, 37, 39 and 42°C, as indicated. Curves are fits of a single exponential equation to the data. (G) Transition rates determined by fits as in panels E and F for all four peptides (159–168, 169–175, 378–395, 389–395) evaluated. (H) Arrhenius plot of the data shown in G. Linear regression analysis yielded an activation energy of 258 ± 25, 273 ± 26, 239 ± 19, and 225 ± 22 kJ·mol-1 for peptides 159–168, 169–175, 378–395, and 389–395, respectively. Error bars are SEM of three independent experiments.
Figure 5
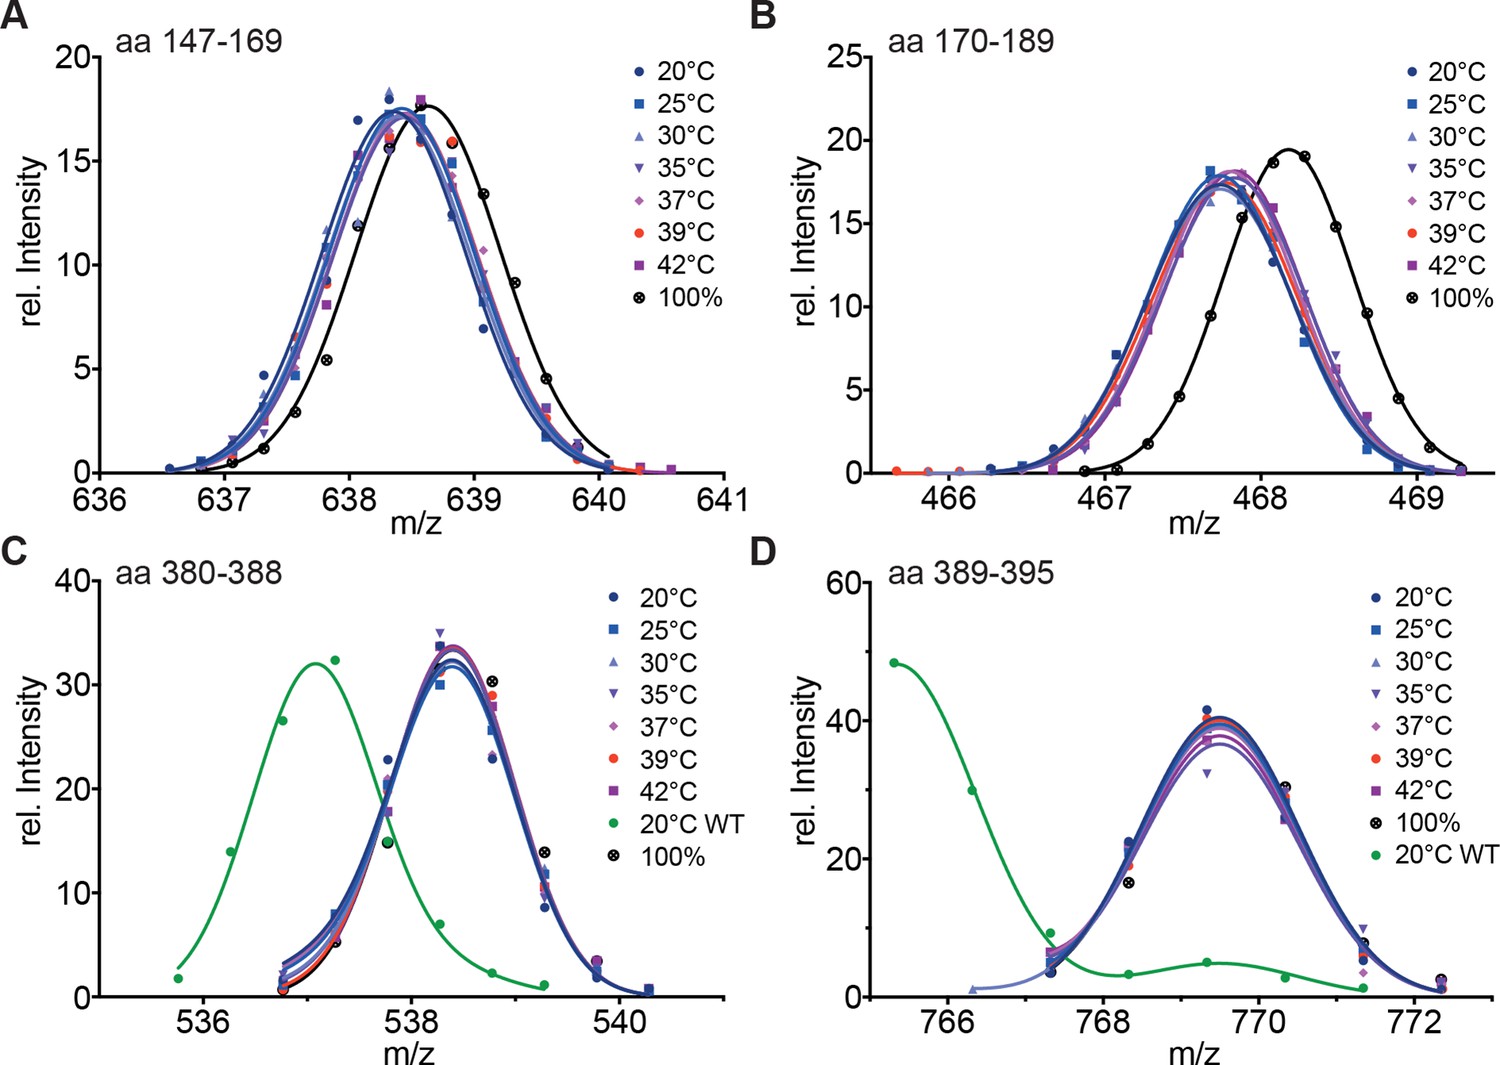
Hydrophobic residues in HR-A are essential for stability of HR-A and HR-C at all temperatures.
(A–D) HX-MS analysis of Hsf1-I130S,V137S,L140S,V144S,M147S,M154S, L158S,M161S,L168S,V172S,L175S (Hsf1-HR-A-S11). Mutant protein was incubated at the different temperatures for 10 min and then analyzed by HX-MS. Shown are peptides from HR-A/B (A, aa 147–169, 634.804+; B, aa 170–189, 465.265+) and HR-C (C, aa 380–388, 535.762+; D, aa 389–395, 765.311+). For all peptides, the 100% deuterated control is shown and for the HR-C peptides a wild-type control, which was incubated for 30 min at 20°C to emphasize the decreased stability of the mutant protein. For the peptides from HR-A, no wild-type control peptides could be shown due to different sequence and cleavage by pepsin. Shown is one of three experiments with identical results.
Figure 6
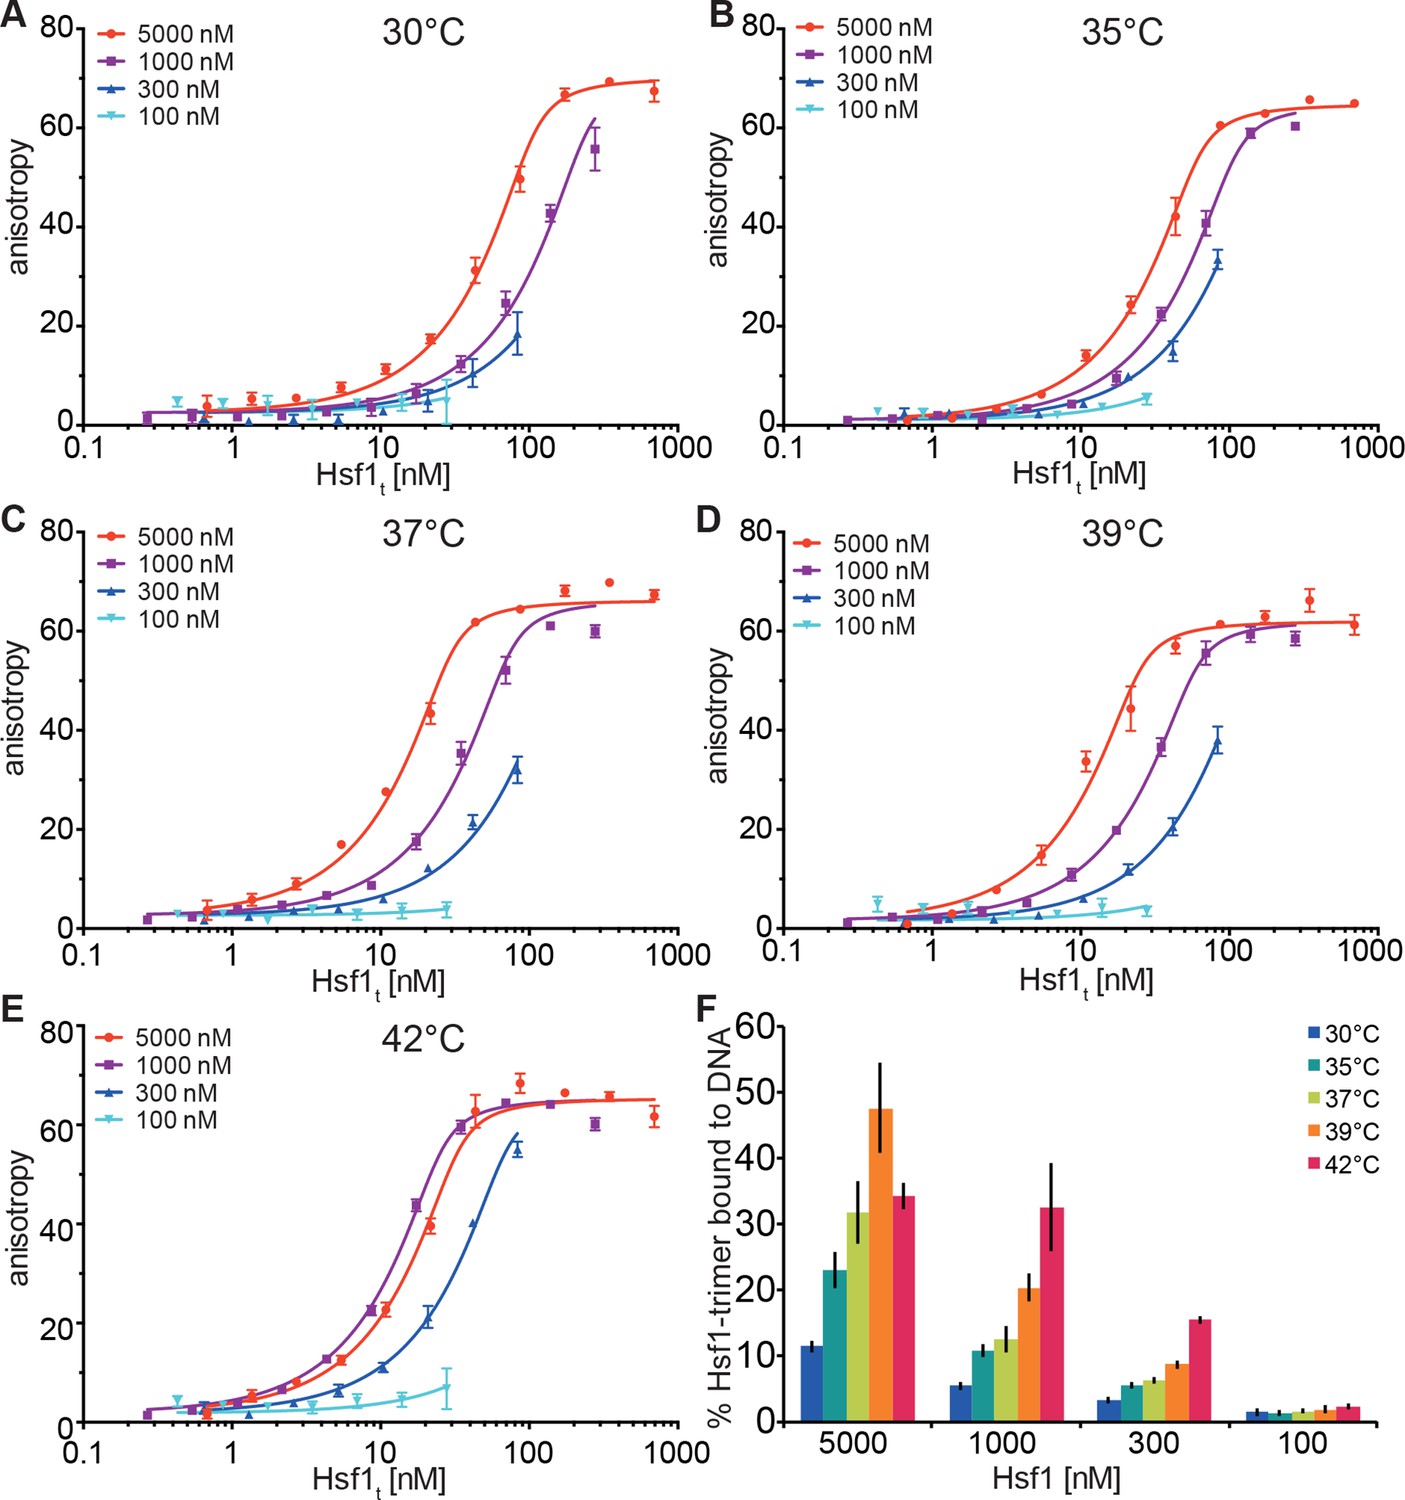
Temperature-induced acquisition of DNA-binding competence of Hsf1 is concentration dependent.
(A–E) DNA-binding competence of monomeric Hsf1 after pre-incubation at the indicated temperature as measured by fluorescence anisotropy of 5’-Alexa 488-labeled HSE-DNA (5’ccccTTCccGAAtaTTCcccc3’). Monomeric Hsf1 was pre-incubated at 30-42°C at different concentrations (100–5000 nM) as indicated, then twofold dilution series were prepared and labeled DNA added. Plotted is fluorescence anisotropy (relative values) versus theoretical concentration of Hsf1 trimer. Curves represent a global fit of the quadratic solution of the binding equilibrium modified for fractional activity of Hsf1 to all data together resulting in a KD of 1.10 ± 0.2 nM for fully active trimeric Hsf1 and a fraction of Hsf1 that formed DNA-binding competent trimers as shown in panel (F). Data of one representative experiment is shown. Error bars represent standard error of the mean of four technical replicates. (F) Fraction of Hsf1 that formed DNA-binding competent trimers at the given Hsf1 concentration and temperature as calculated from data in panels A to E. Mean and standard error of the mean of three independent sets of experiments are shown.
Figure 7
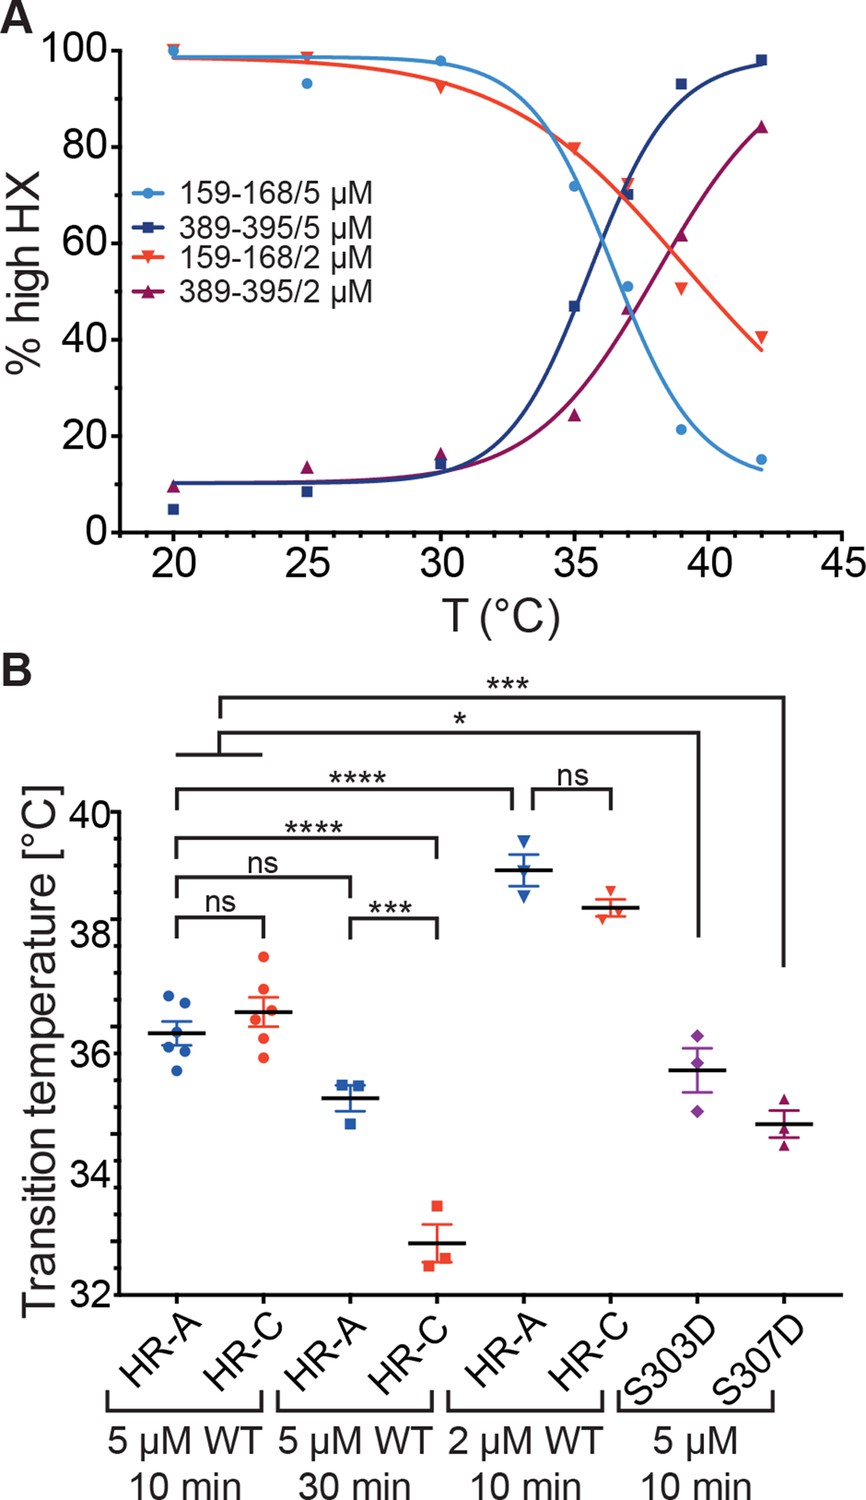
Temperature response curve of Hsf1 is concentration dependent.
(A) Fraction of high exchanging species of peptides 159–168 and 389–395 for 5 and 2 µM Hsf1 pre-incubated at the respective temperatures and analyzed by HX-MS as in Figure 2. Data points and fits of the unfolding equilibrium equation of one representative of three independent experiments are shown. (B) Calculated midpoint temperature for wild-type Hsf1 (2 and 5 µM) and two phosphomimetic Hsf1 variants (5 µM). For 5 µM wild-type Hsf1 (10-min and 30-min-incubations) each data point represents the average of the Tm values for the two peptides observed in the respective region, which were not significantly different from each other (HR-A: aa 159–168 and 169–175; HR-C: 389–395 and 378–395 or 380–388). For 2 µM wild-type and for 5 µM mutant proteins no statistically significant differences were observed between the Tm values for the different peptides (159–168, 169–175, 378–395, 389–395) within an experiment, each data point represents the average of the Tm values of all evaluated peptides for an independent experiment. In addition to the data points of three to six independent experiments, the mean and standard error of mean is shown. *p<0.05; ***p<0.0005; ****p<0.0001; p-values were determined by Tukey’s multiple comparisons test.
Figure 8
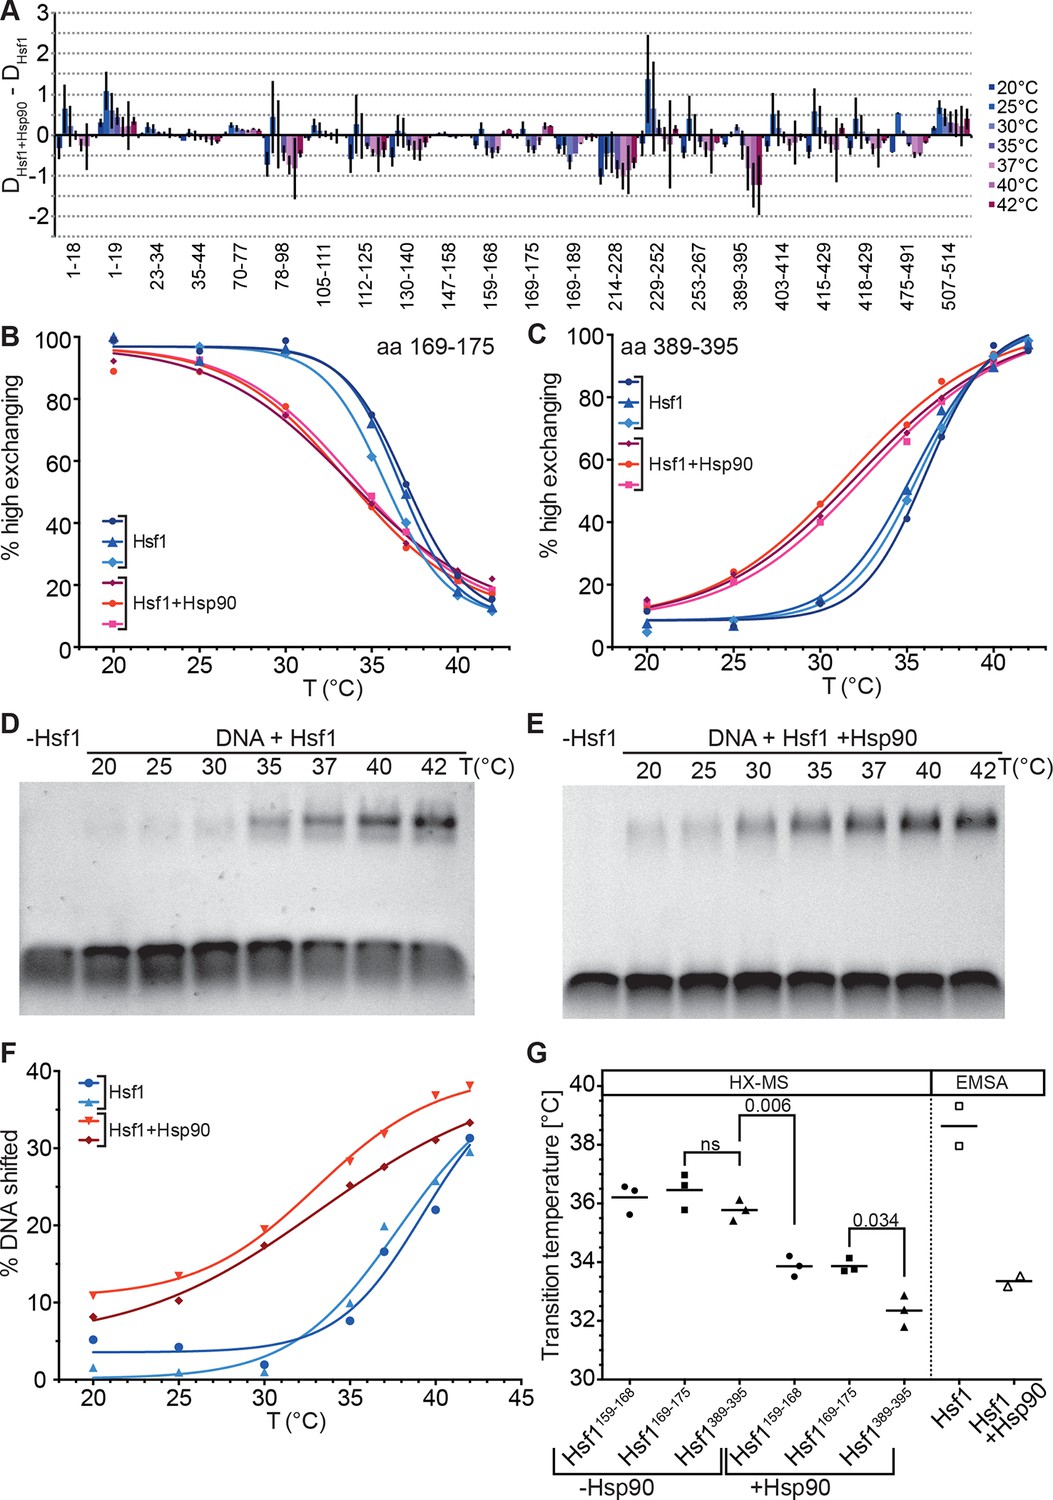
Hsp90 modulates midpoint and steepness of the temperature response curves of human Hsf1.
(A) Difference plot of deuteron incorporation of human Hsf1 in the presence of Hsp90β minus deuteron incorporation into Hsf1 at the indicated temperatures. (B and C) Fraction of high-exchanging species of peptic peptides 169–175 (B) and 389–395 (C) of Hsf1 (5 µM) pre-incubated in the absence (blue) and presence of human Hsp90β (15 µM, red) at the indicated temperature before HX at 20°C for 30 s, quenching with low-pH buffer, peptic digestion, and MS analysis. Data points and fits of the unfolding equilibrium equation for three independent experiments are shown. (D and E Electrophoretic mobility shift assay (EMSA). HSE-DNA binding of monomeric Hsf1 pre-incubated at the indicated temperature in the absence (D) or presence of Hsp90 (E). (F) Quantification of data from panels D and E. Fraction of DNA bound by Hsf1 versus temperature is plotted. Data points and fits of the unfolding equilibrium equation to the data of two independent experiments are shown. (G) Transition midpoints calculated from the fits of panels B, C, and F. Numbers represent p values as determined by Tukey’s multiple comparisons test; ns, not significant.
Figure 9
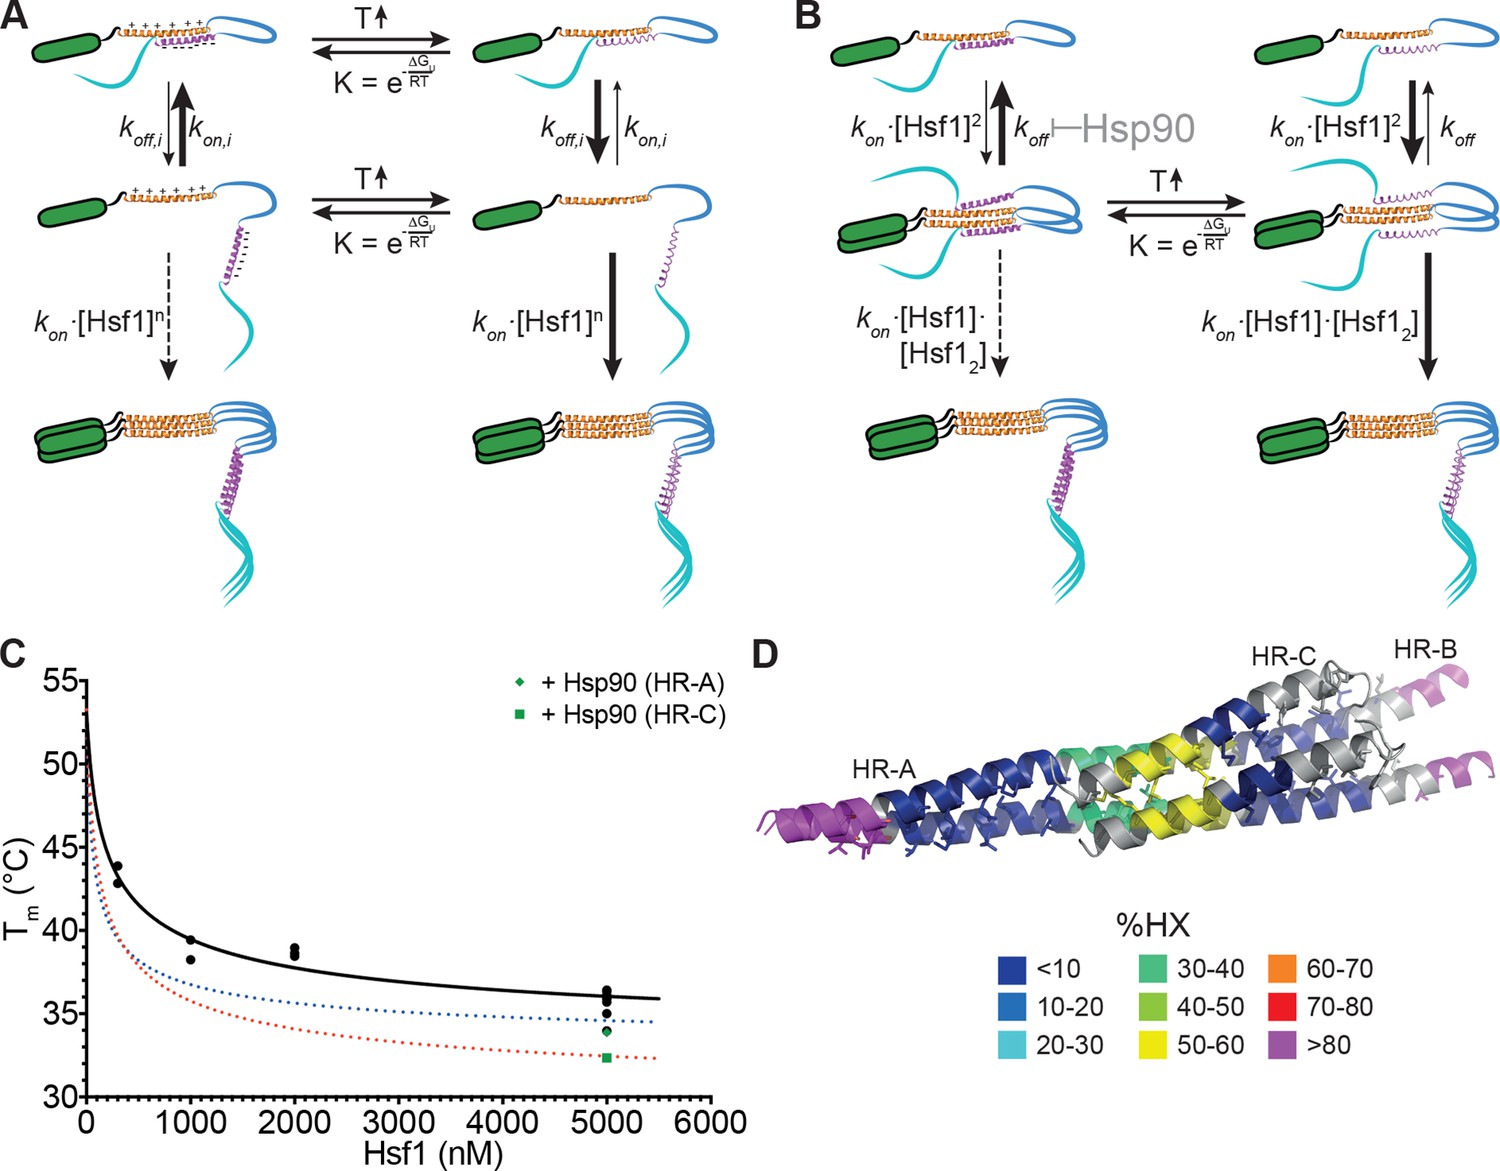
Kinetic models of the thermosensor function of Hsf1.
(A) Monomer activation model, based on the originally proposed mechanism modified with our HX-MS data. In unstressed cells monomeric Hsf1 is in equilibrium between a closed, HR-C docked to HR-A/B, and open conformation, with HR-C dissociated from HR-A/B. Owing to high local concentration and electrostatic attraction the intramolecular association rate kon,i of the HR-C–HR-A/B interaction are very high as compared to the dissociation rate koff,i. Since only uncomplexed HR-A/B can trimerize and Hsf1 trimerization therefore depends on the concentration of the open conformation, at low temperatures, trimerization only occurs at high Hsf1 concentrations. Temperature-induced unfolding of HR-C in the docked or undocked state reduces the intramolecular association rates and/or increases the dissociation rate of the intramolecular HR-C–HR-A/B complex, thereby increasing the concentration of Hsf1 in the open conformation and allowing trimerization at low Hsf1 concentrations. (B) Dimer activation model. At low temperatures, HR-C is constitutively docked onto HR-A/B and monomeric Hsf1 transiently dimerizes through the free part of HR-A/B. Such transient dimerization may partially destabilize the HR-C–HR-A/B interaction. At high Hsf1 concentrations a third Hsf1 monomer could interact with a transient Hsf1 dimer to form a thermodynamically stable Hsf1 trimer with completely released HR-C even at low temperatures. Increasing temperatures lead to unfolding of HR-C in the dimeric Hsf1 species leading to stabilization of the Hsf1 dimer and increased probability of trimerization. Hsp90 might modulate the temperature response by stabilizing the dimeric Hsf1 species. (C) Estimation of the concentration dependence of the transition temperature of Hsf1. Data points are all the Tm values determined for 10 min incubation at elevated temperatures for Hsf1 wild type in the absence (black) or presence (green) of Hsp90 by HX-MS and by anisotropy. Black curve is a fit of the quadratic solution of the law of mass action of the monomer-dimer equilibrium, assuming that the fraction of dimer determines the Tm. This fit results in a Tm,M for the monomer of Hsf1 (extrapolation to 0 nM) of 53°C, the Tm,D for the dimer of 33°C, and a KD of the monomer-dimer equilibrium of 330 nM. Due to the sensitivity of the fit to data points at low Hsf1 concentrations, these are only rough estimates. The blue and red dotted lines are simulations using a lower value for KD (100 nM, blue) or KD (200 nM) and Tm,D (29°C, red) to simulate the effect of Hsp90. (D) Tentative model of the dimeric Hsf1 based on the recent crystal structure of the trimerization domain of C. thermophilum Skn7, which formed tetramers in two different crystal forms (PDB ID 5D5Y and 5D5Z, [Neudegger et al., 2016]). HR-A, HR-B and HR-C were homology modeled on the tetrameric Skn7 using I-TASSER (Roy et al., 2010; Zhang, 2008; Yang and Zhang, 2015; Yang et al., 2015). HR-C was positioned to accommodate interactions with HR-A and HR-B. The homology model is colored according to HX-MS data (Figure 1E). Residues of the heptad repeat involved in the tetramer interface are shown as sticks.
Download links
A two-part list of links to download the article, or parts of the article, in various formats.
Downloads (link to download the article as PDF)
Open citations (links to open the citations from this article in various online reference manager services)
Cite this article (links to download the citations from this article in formats compatible with various reference manager tools)
Molecular mechanism of thermosensory function of human heat shock transcription factor Hsf1
eLife 5:e11576.
https://doi.org/10.7554/eLife.11576


