Evidence for a common evolutionary rate in metazoan transcriptional networks
- University of California, San Diego, United States
Figures
Figure 1 with 2 supplements
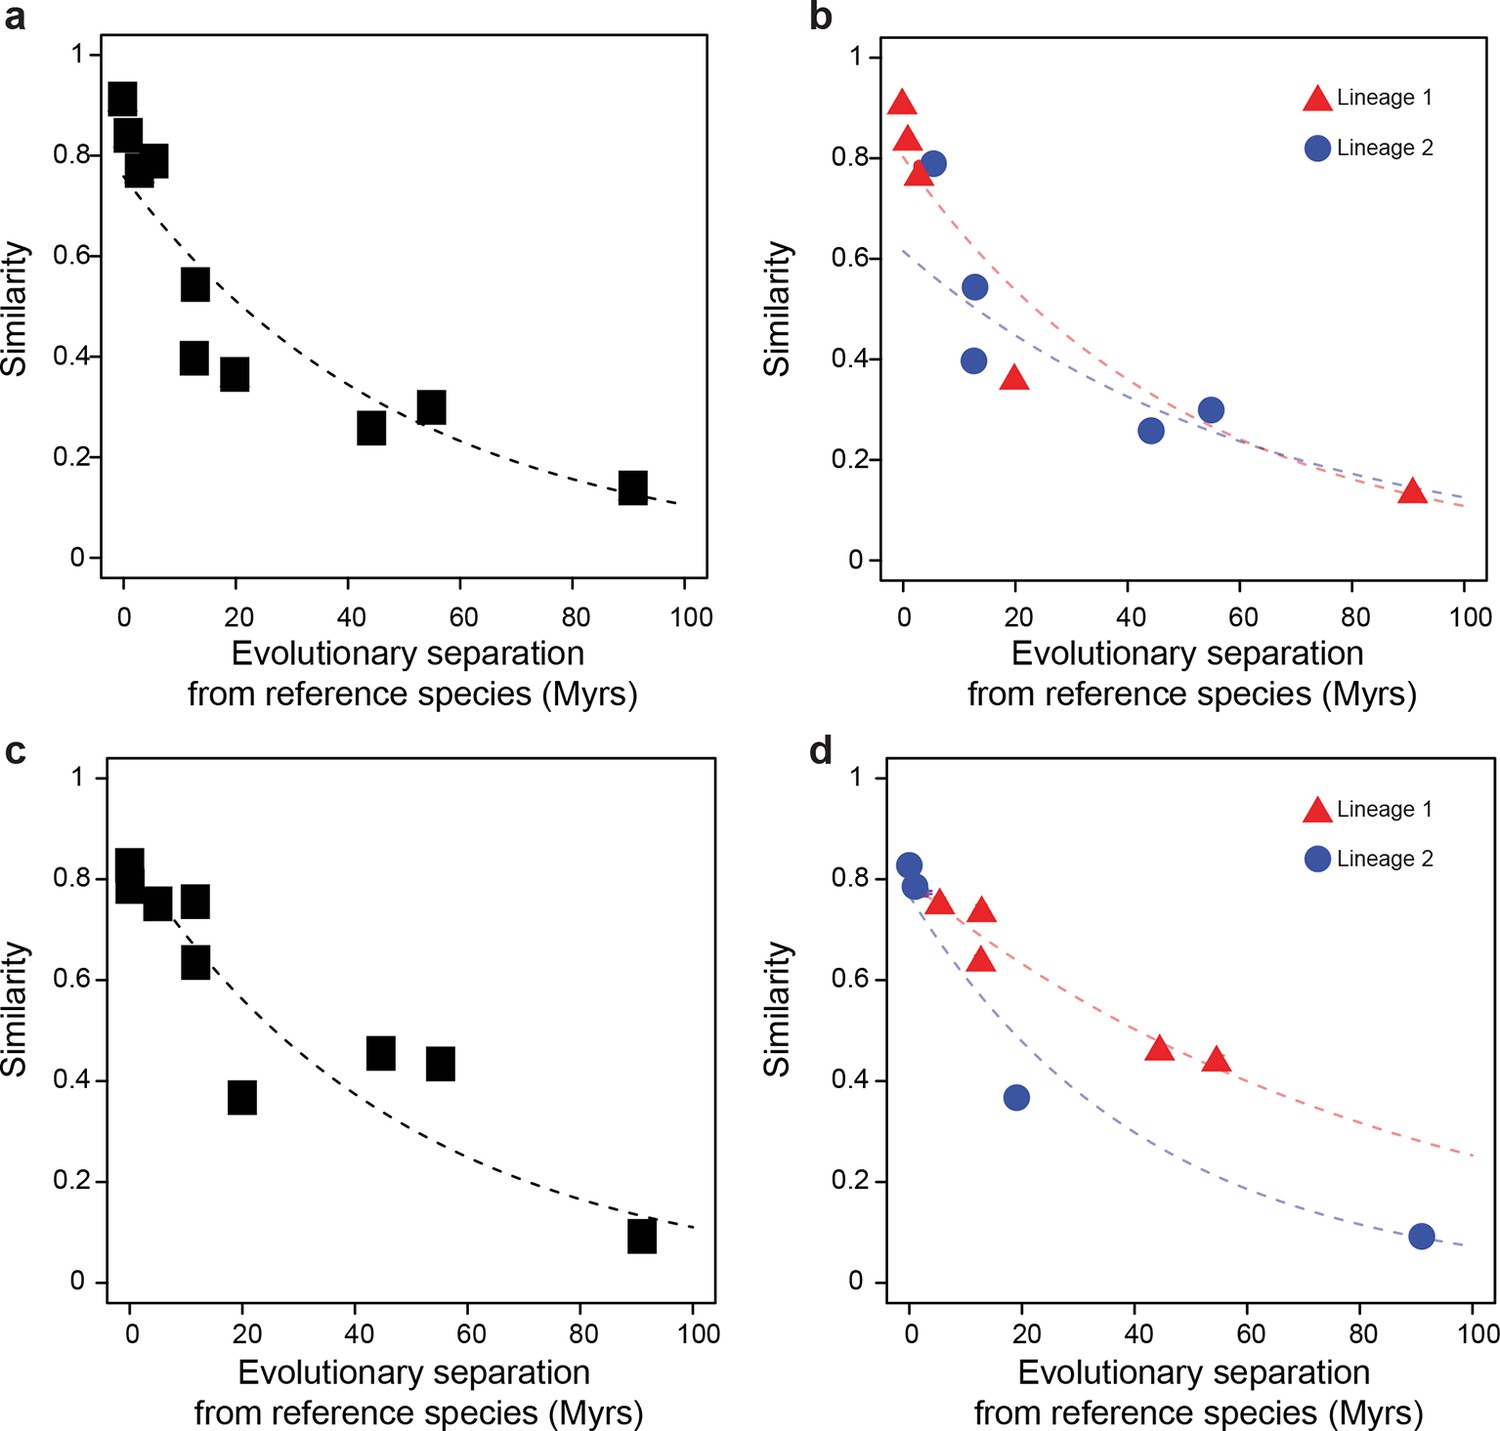
Statistical framework to evaluate differences in evolutionary rates of change.
Throughout this study we frequently evaluated whether the rate of evolutionary divergence of a given layer of transcriptional regulation differs between lineages. Our approach is equivalent to asking: if the lineage labels were hidden, would one be able to tell that the data points correspond to several lineages or would they seem equally likely to belong to a common distribution? (a, b) Depict an example of statistically indistinguishable evolutionary rates. Without lineage labels (a), the similarity data are modeled by an exponential decay as well as with lineage labels (b). Adding lineage labels does not significantly improve the fit. (c, d) Depict an example of statistically different evolutionary rates. Adding lineage labels (d) significantly improves the fit of an exponential decay model over unlabeled data (c).
Figure 1—figure supplement 1
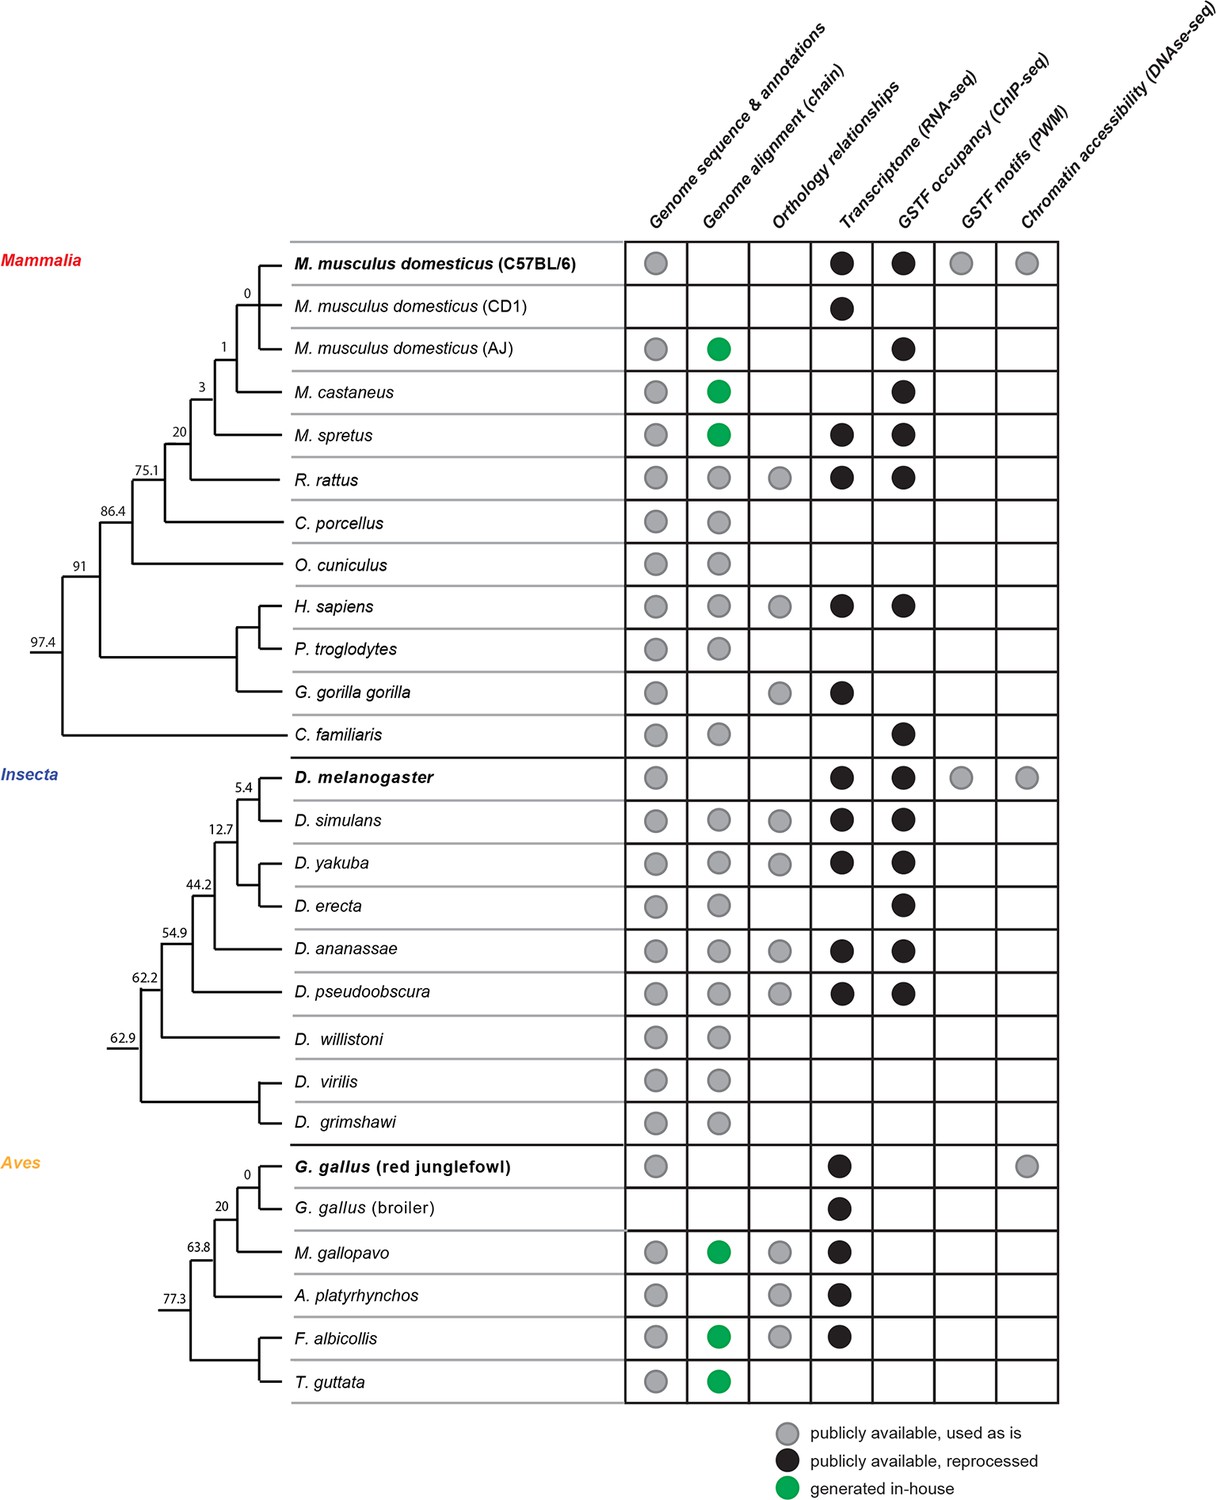
Comparative genomics platform for studying transcriptional network evolution across three metazoan lineages.
The phylogenetic trees indicate the evolutionary relationships between the organisms included in this study. The trees are not drawn to scale. The numbers at each branch split represent the evolutionary distance in Myrs separating the organisms at the end of the lower branch from the reference species, whose names are bolded.
Figure 1—figure supplement 2
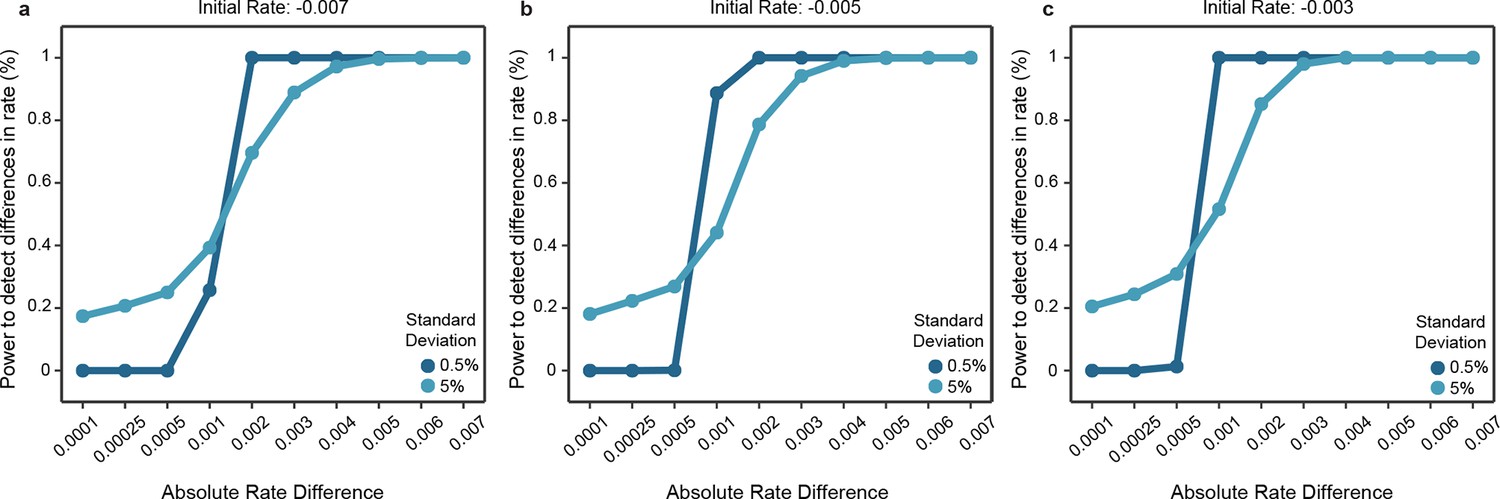
Power of the statistical framework to evaluate differences in evolutionary rates.
(a-c) Depict the sensitivity of our statistical framework to detect differences in 1000 simulations. The initial rates of one clade was fixed to either -0.007 (a), -0.005 (b) or -0.003 (c), and data were simulated by modeling an exponential decay where samples were drawn from a Gaussian distribution with standard deviation fixed to 0.5% or 5%. The second clade’s rate was modeled according to the absolute difference in rates with steps shown in the x axis and sampled similarly as for the first clade. Simulated data were used as input to our statistical framework and the frequency of detecting a significant difference is shown.
Figure 2 with 2 supplements
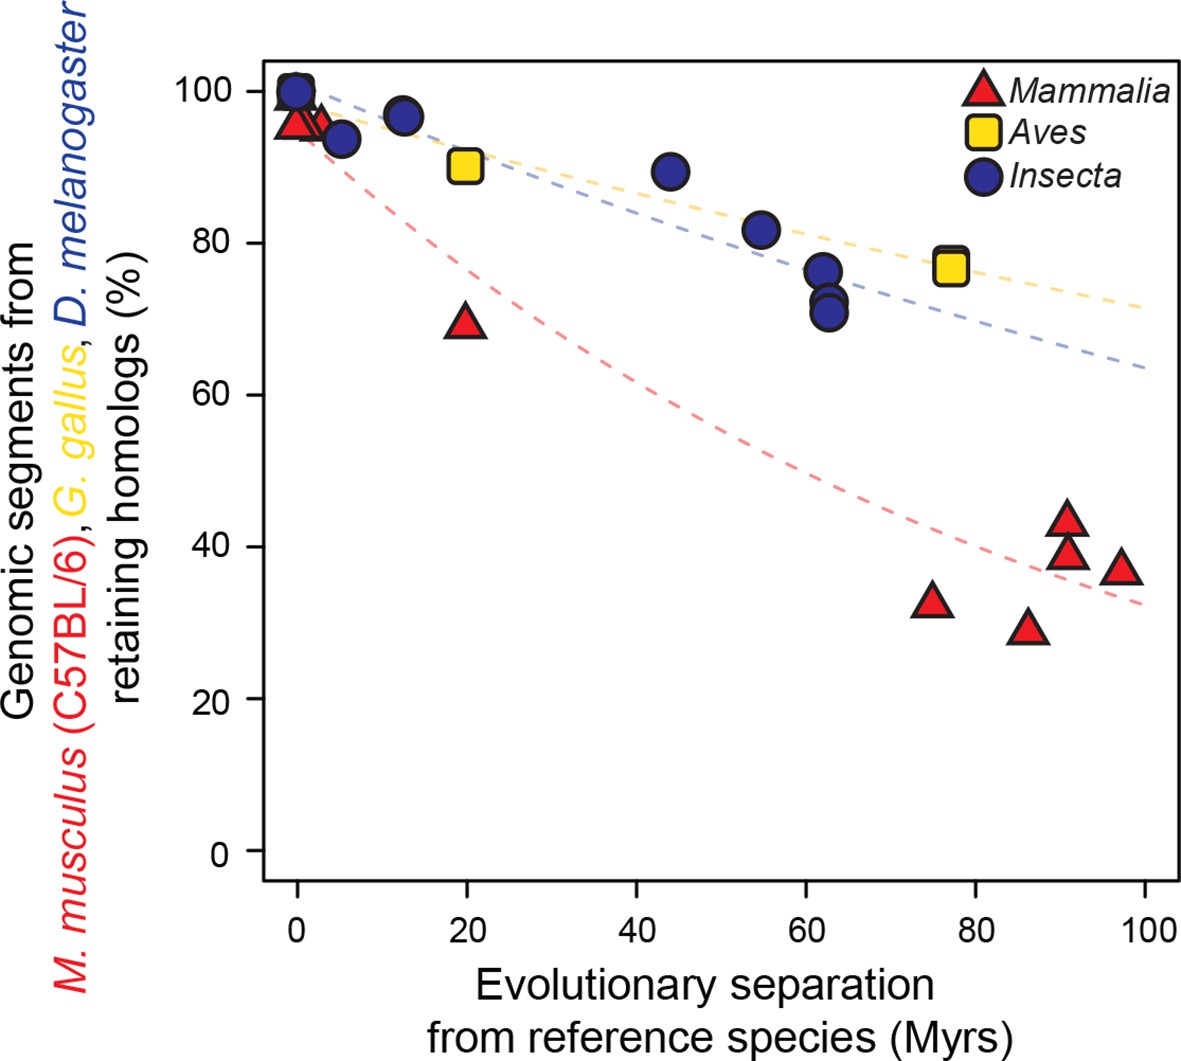
Genomic sequences evolve more rapidly in mammals than in birds and insects.
The evolutionary retention of 5000 randomly sampled 75 bp segments was averaged over 20 trials. Organisms compared to reference species are as follows: M. musculus domesticus (AJ), M. musculus castaneus, M. spretus, rat, guinea pig, rabbit, human, chimpanzee and dog for Mammalia; turkey, zebrafinch and flycatcher for Aves; D. simulans, D. erecta, D. yakuba, D. ananassae, D. pseudoobscura, D. virilis, D. willistoni and D. grimshawi for Insecta. Colored dashed lines: lineage-specific exponential fits, here and in all following displays. The trends were robust to variations in segment length and sequence similarity filters (Figure 2—figure supplement 2).
Figure 2—figure supplement 1
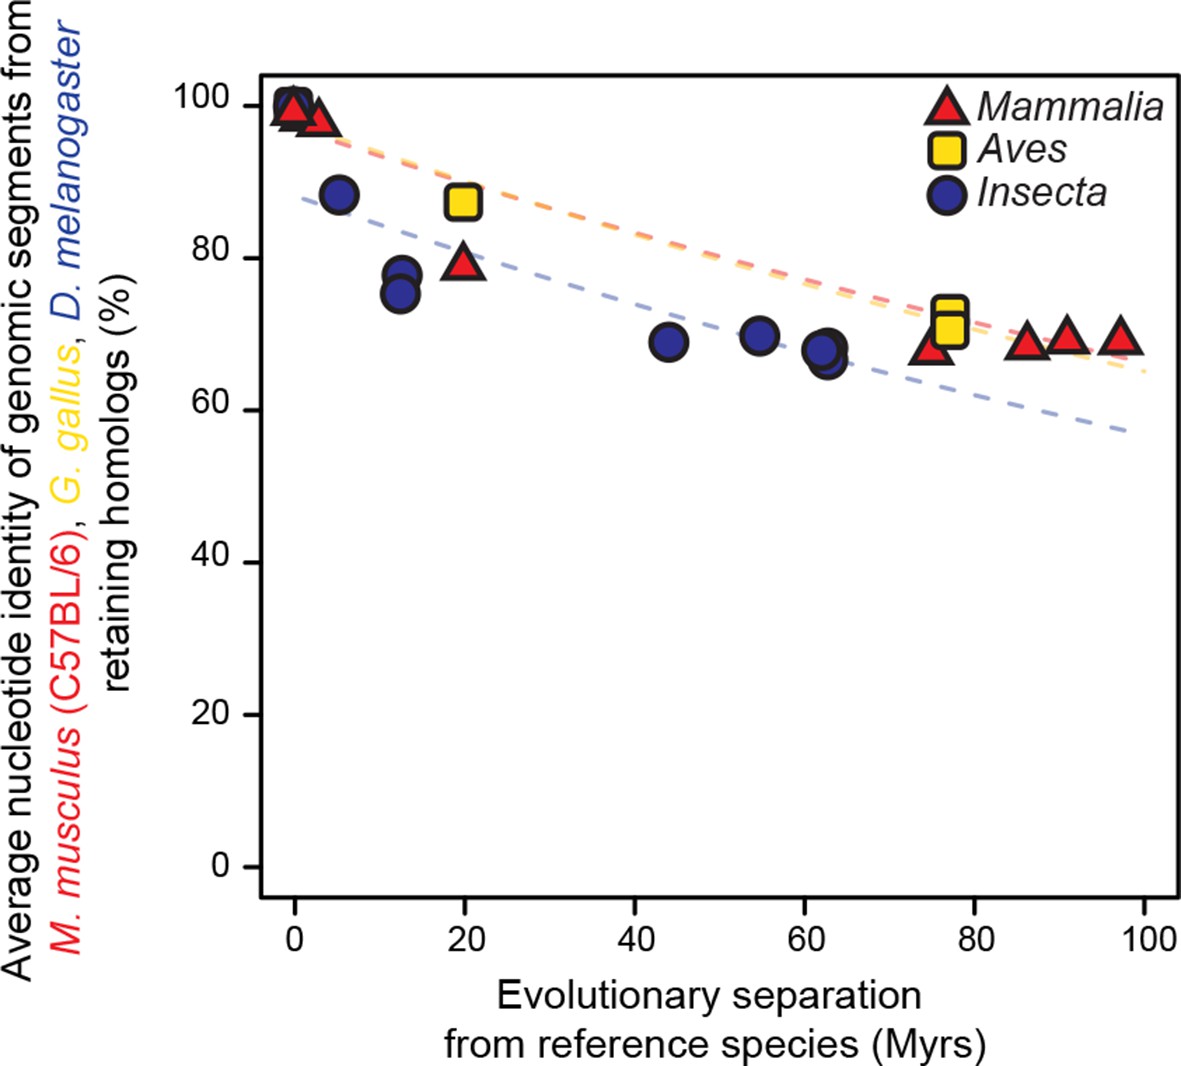
Genomic segments retaining homologs are highly conserved at the nucleotide level.
The genomic segments found to retain homologs in Figure 2 were aligned to their homologous regions. The average nucleotide identity of the corresponding ungapped alignment is shown here. Evolutionary rates are slightly but significantly different among lineages (P < 0.05).
Figure 2—figure supplement 2
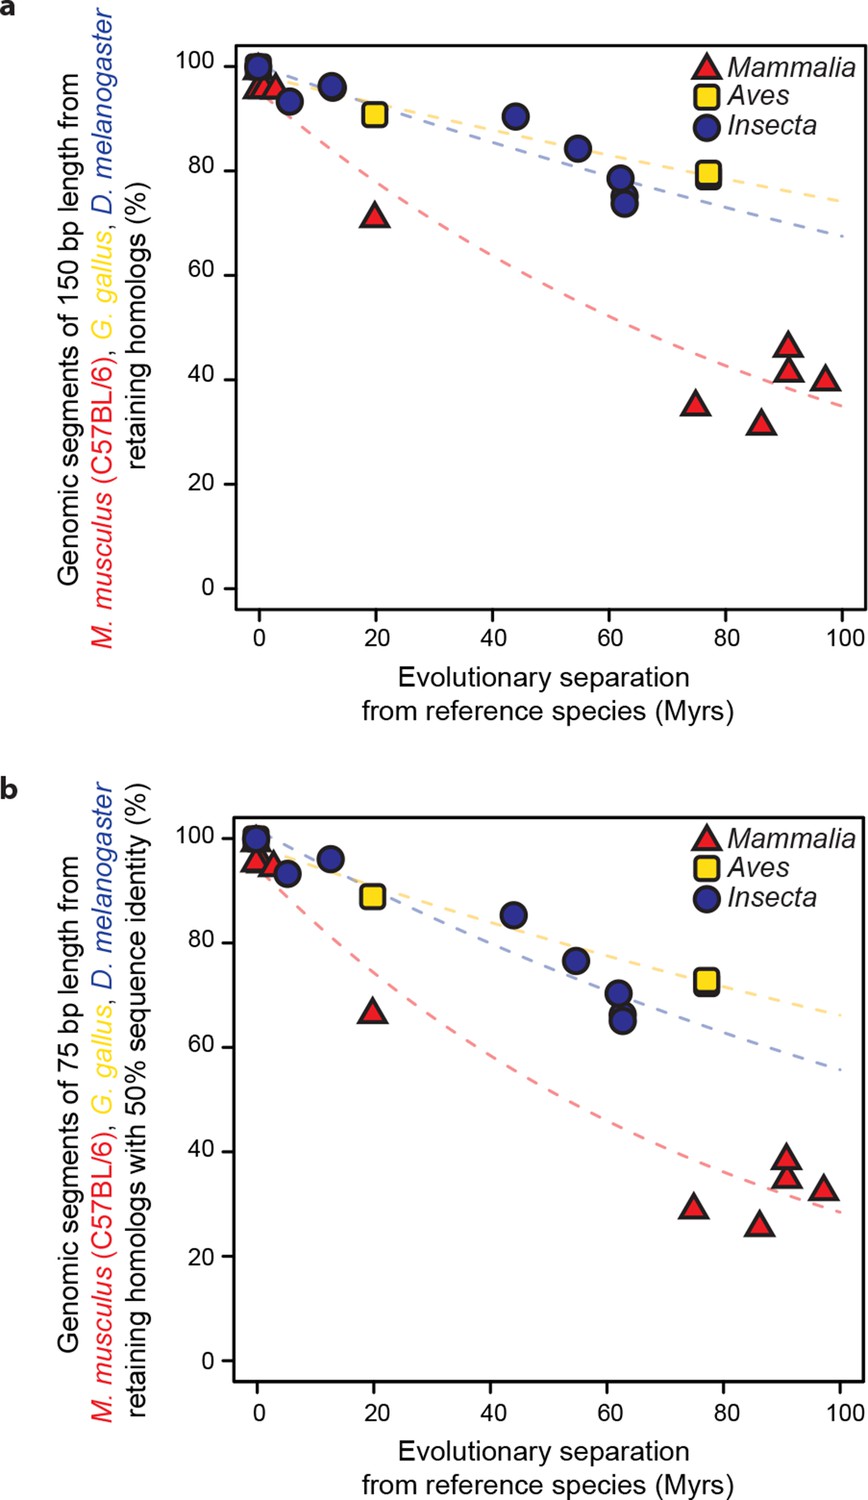
Retention of genomic segments is robust to changes in sampled region size and sequence identity threshold.
(a) Following the same procedure as in Figure 2 but varying the segment length to 150 bp and (b) increasing the LiftOver minMatch parameter to 0.5.
Figure 3 with 1 supplement
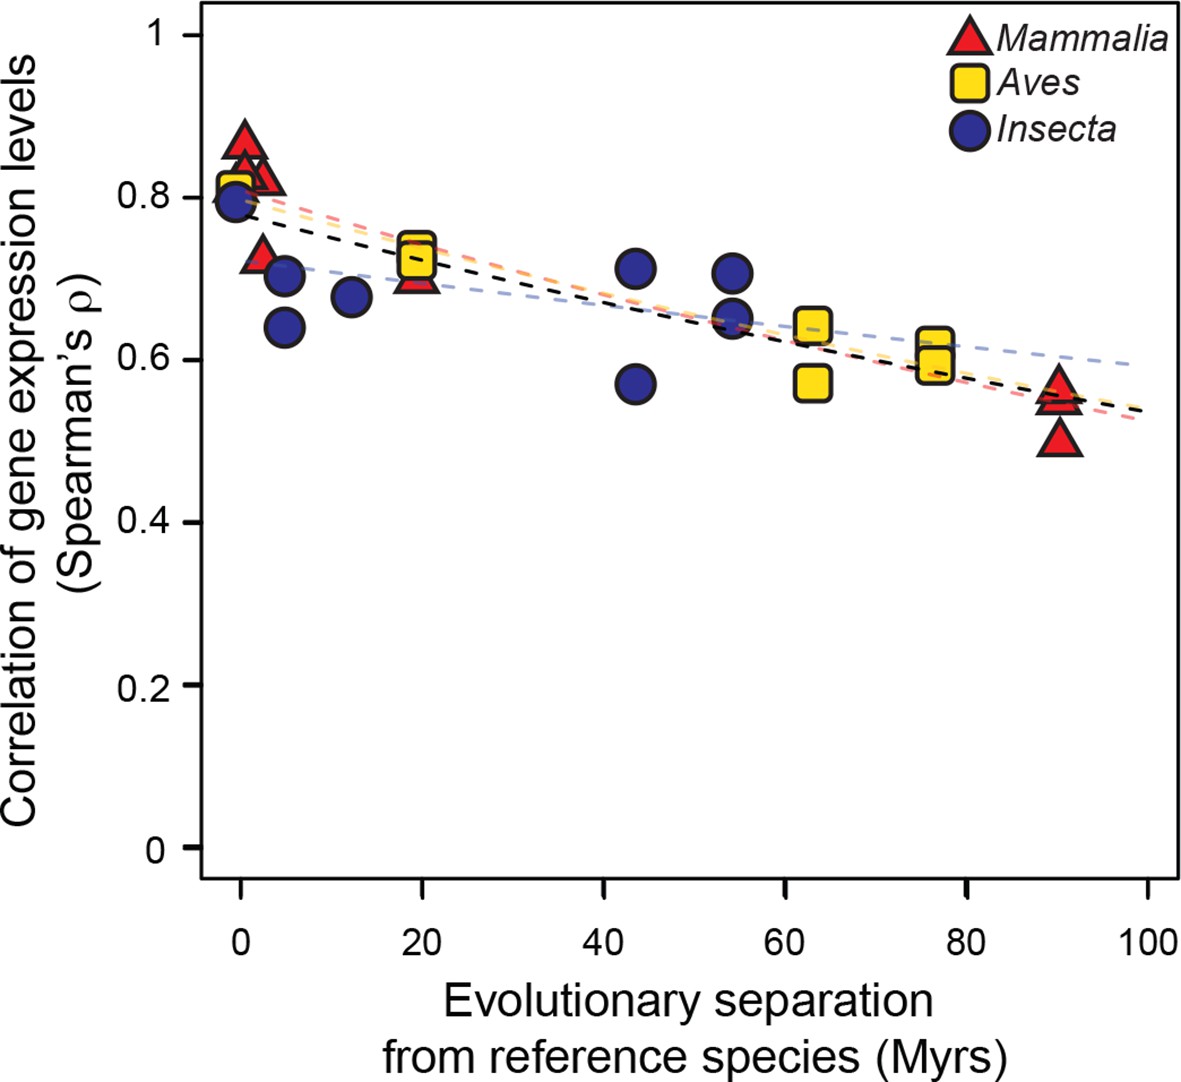
Gene expression levels diverge at a common rate in mammals, birds and insects.
Gene expression levels were derived independently from two RNA-seq experiments for each reference species and then correlated against each other and against gene expression levels derived from individual experiments in other species within the same lineage. Black dashed line: lineage-naïve exponential fit of all the data, without differentiating the lineages, here and in all following displays. Organisms compared to reference species are as follows: M. musculus castaneus, M. spretus, rat, human and gorilla for Mammalia; turkey, duck and flycatcher for Aves; D. simulans, D. yakuba, D. ananassae and D. pseudoobscura for Insecta.
-
Figure 3—source data 1
Accession numbers used in RNA-seq analyses.
- https://doi.org/10.7554/eLife.11615.010
Figure 3—figure supplement 1
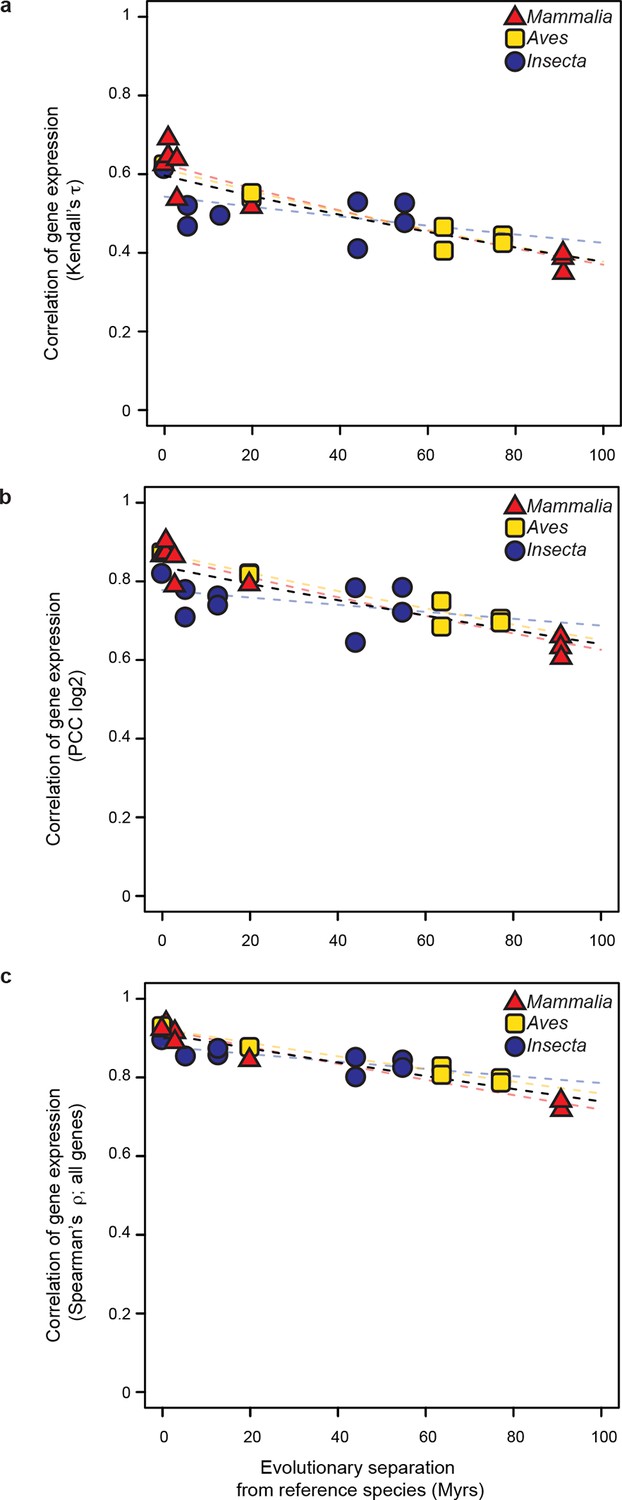
The common evolutionary rate of gene expression levels presented in Figure 3 is robust to changes in correlation metrics or expression threshold.
(a, b) The gene expression levels used in Figure 3 were correlated with alternative correlation metrics, Kendalls τ (a) and Pearson’s r (b). The resulting evolutionary rates remained statistically indistinguishable. (c) The gene expression level of all genes were analyzed rather than excluding the values below 5 TPM as was done in Figure 3. The resulting evolutionary rates remained statistically indistinguishable.
Figure 4 with 1 supplement

GSTF occupancy diverges at a common rate in mammals and insects.
(a) Estimating shared GSTF occupancy across species requires multiple parameter choices. This diagram summarizes the main steps involved in comparing GSTF-occupied segments across species, showing a representative sample of choices at each step (steps represented by purple shapes, specific choices by the first letter bolded). The detailed methods and specific choices illustrated here and implemented in panels b–d are described in Materials and methods. (b, c) An example of different analytical choices leading to different results despite starting from the same underlying data. Organisms compared to reference species are as follows: M. musculus domesticus (AJ), M. musculus castaneus, M. spretus, rat, human and dog for Mammalia; D. simulans, D. erecta, D. yakuba, D. ananassae and D. pseudoobscura for Insecta. (d) Most combinations of choices yield indistinguishable evolutionary rates of GSTF binding patterns across lineages. The comparison of Twist and CEBPA is enlarged to show the color labels corresponding to the statistical interpretation regarding relative evolutionary rates. (e) A genome-wide comparison of GSTF occupancy profiles at single-nucleotide resolution shows indistinguishable evolutionary rates for CEBPA, HNF4A and FOXA1 in mammals, and for Twist and Giant in insects. PCC: Pearson correlation coefficient. (f) CTCF occupancy is highly conserved in mammals. Transparent points and lines are identical as in panel e. Hexagons correspond to cross-species correlations of CTCF occupancy at single-nucleotide resolution.
-
Figure 4—source data 1
Accession numbers used in ChIP-seq analyses.
- https://doi.org/10.7554/eLife.11615.013
-
Figure 4—source data 2
648 segment-based ChIP analyses.
- https://doi.org/10.7554/eLife.11615.014
Figure 4—figure supplement 1
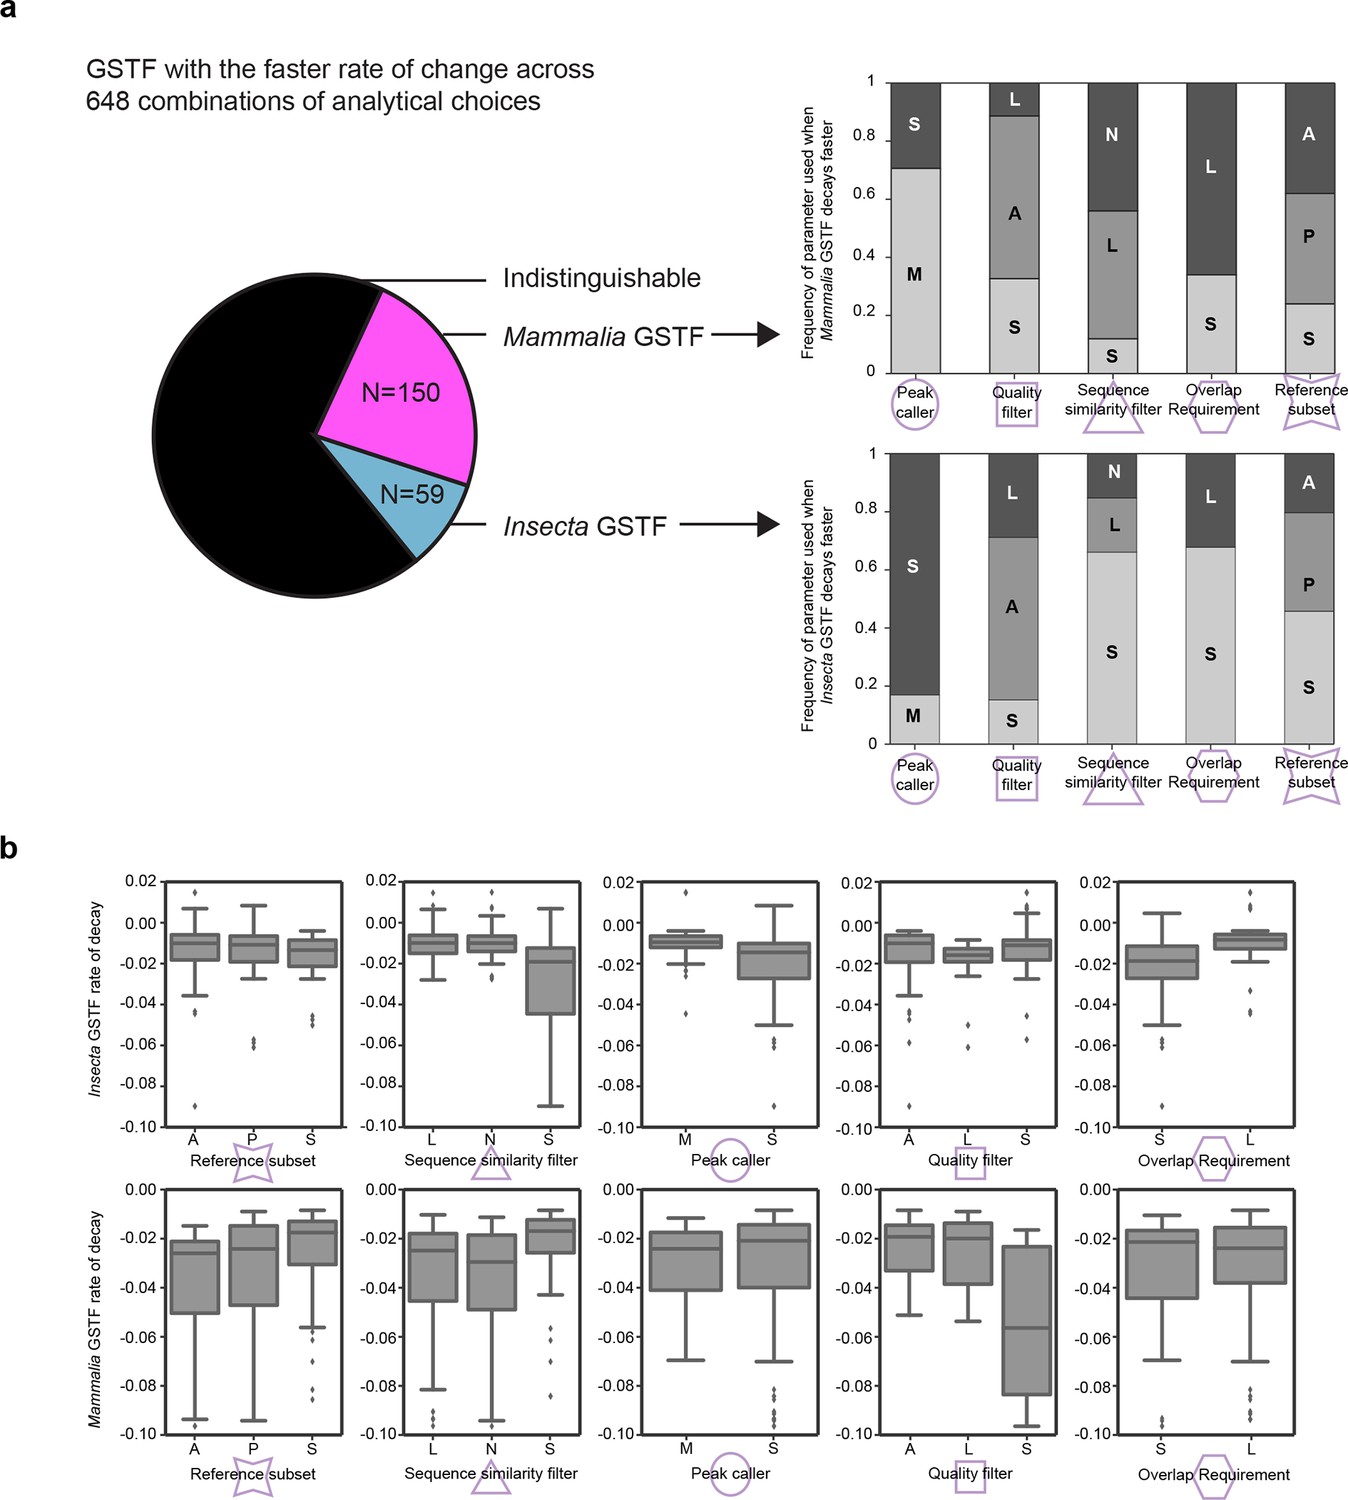
Measured GSTF binding divergence rates are influenced by parameter choices.
(a) The pie chart on the left shows the frequency at which either the mammalian or insect GSTF was found to evolve faster for 648 comparisons using different combinations of analytical choices. The majority of comparions showed indistinguishable rates. The stacked histograms indicate how often a parameter was used when a difference in divergence rate was detected. For instance, 106/150 cases where Mammalia factors decayed significantly faster used MACS2 as a peak caller , whereas 49/59 cases of Insecta GSTF decaying faster used SPP. Interestingly, asymmetric quality filters showed an enrichment for Mammalia GSTFs decaying faster (84/150) as well as for Insecta GSTFs decaying faster (33/59). (b) Boxplots showing general influence of parameter choices on individual decay rates of Insecta (top) and Mammalia (bottom). Only instances when a significant fit was detected are considered. For example, for mammalian GSTFs, stringent quality filters yielded slightly faster decay rates than asymmetric or lenient quality filters. Summary of all parameter choices and the results are shown in Figure 4—source data 2. These parameters are further elaborated in Figure 4 and Methods.
Figure 5 with 2 supplements
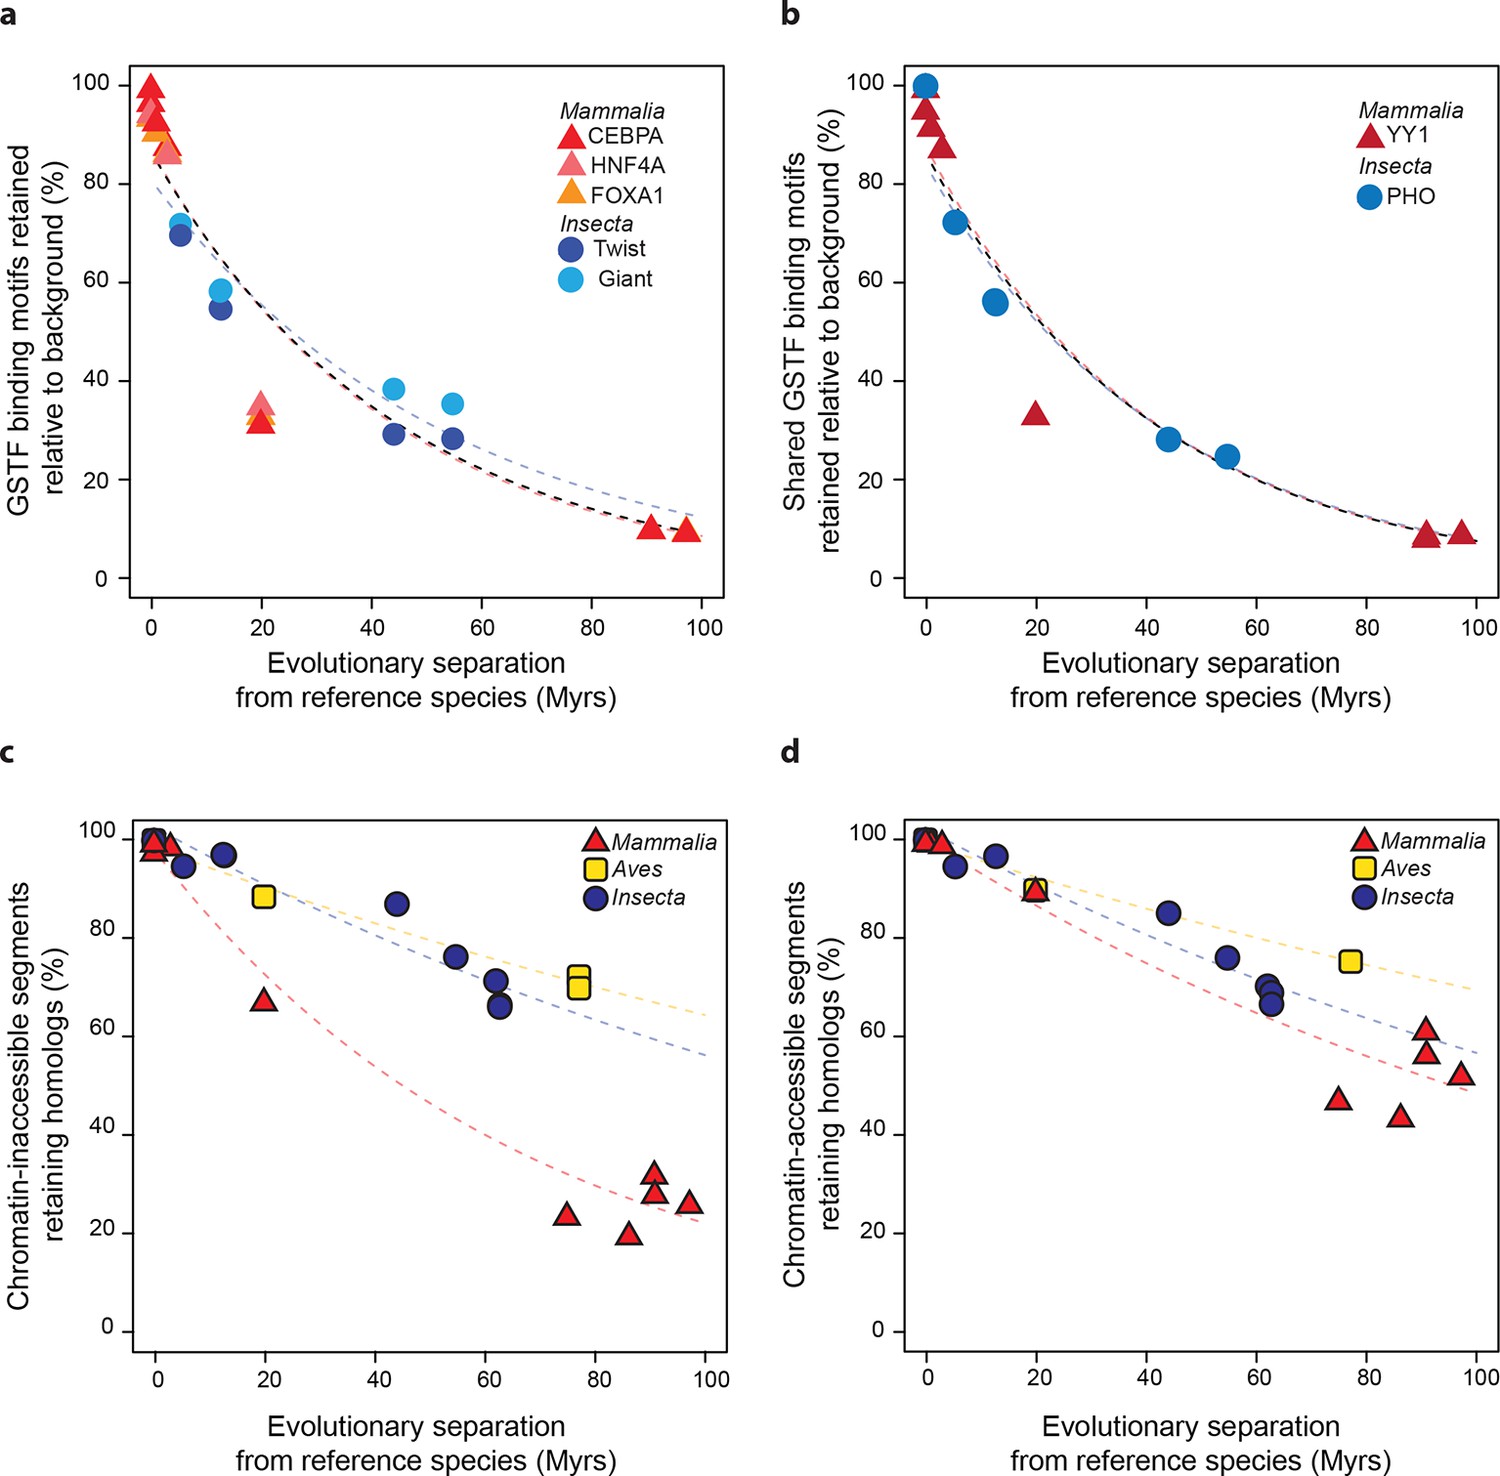
Regulatory sequences diverge at similar rates across lineages.
(a) The motifs for CEBPA, HNF4A and FOXA1 in mammals and for Twist and Giant in insects are retained at a common rate. Organisms compared to reference species are the same as Figure 4. (b) The motifs for GSTFs shared in mammals and insects are retained at common rates. One example is shown here for the motifs corresponding to PHO (FBgn0002521) in D. melanogaster and YY1 (ENSMUSG00000021264) in M. musculus, which are orthologous GSTFs. Eleven other cases of motif evolution for shared GSTFs conserved in mammals and insects are shown in Figure 5—figure supplement 1. Organisms compared to reference species are as in Figure 4. (c, d) Chromatin-accessible sequences are retained at similar rates in mammals, birds and insects. Analyses were performed as in Figure 2, limiting sampling to the inaccessible (c) and accessible (d) portions of the intergenic regions. Organisms compared to reference species are the same as Figure 2. The trends were robust to variations in segment length and sequence similarity filters (Figure 5—figure supplement 2).
Figure 5—figure supplement 1
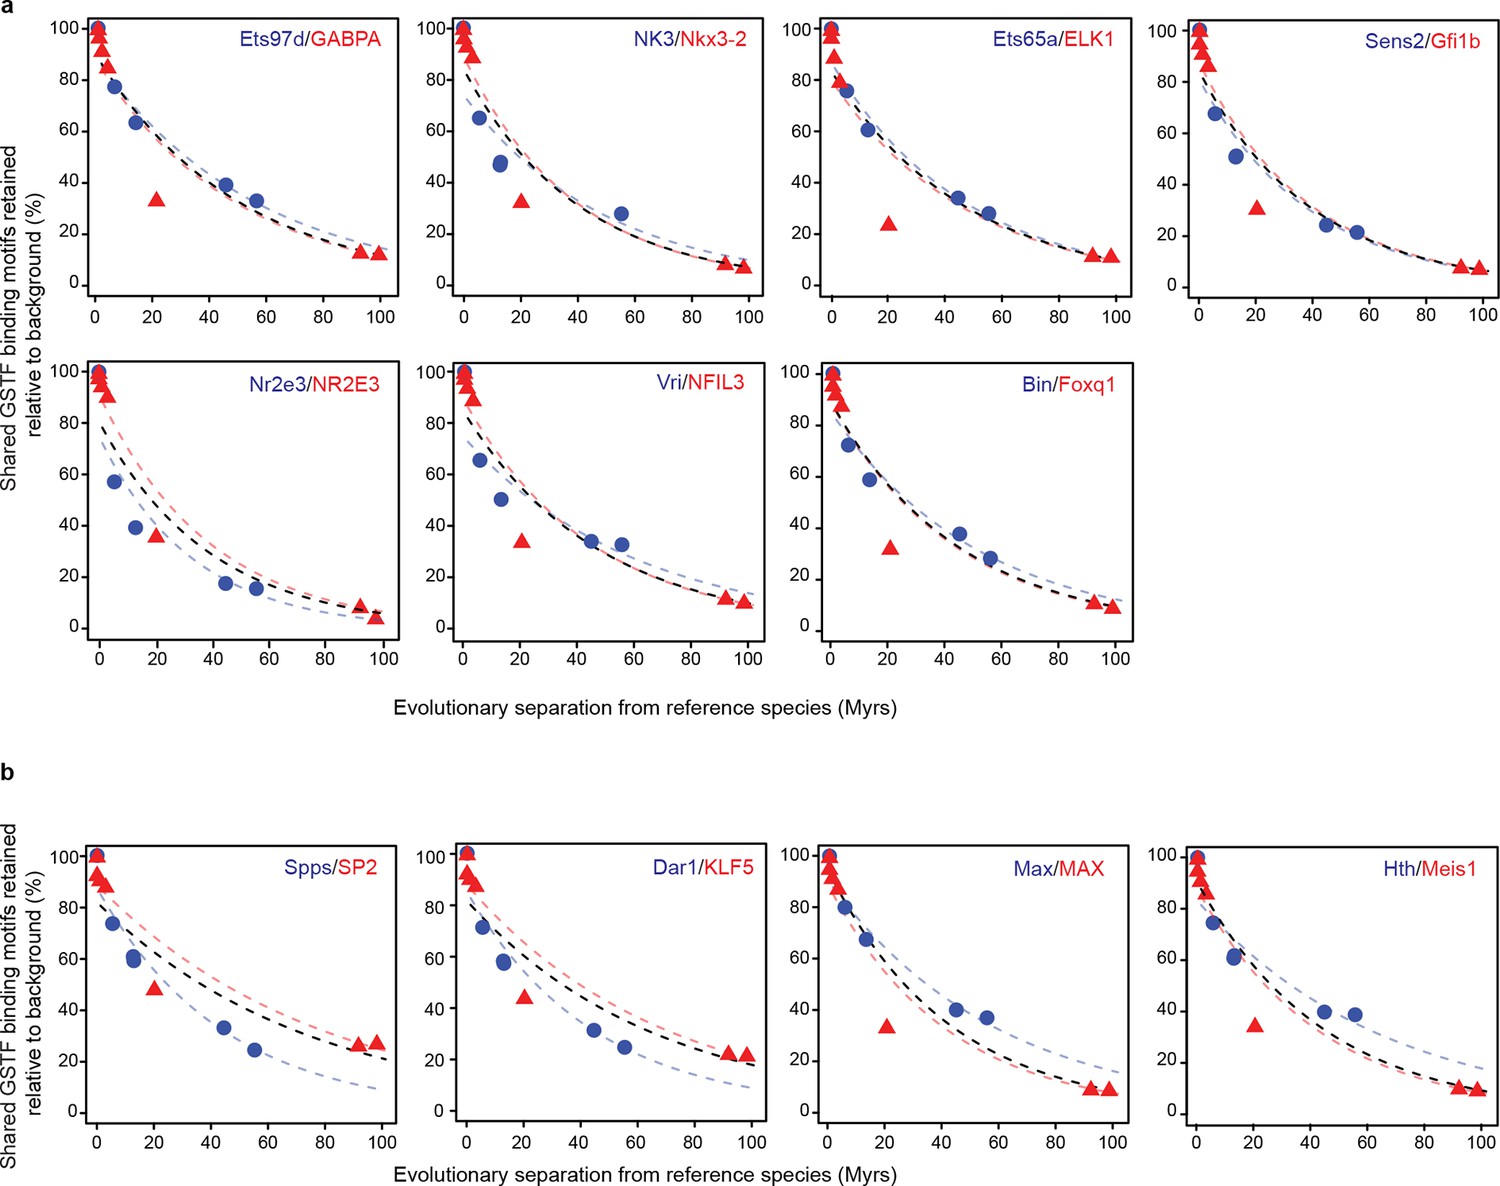
Conservation of cis-regulatory motifs for GSTFs conserved across insects and mammals.
(a) Seven shared GSTFs whose motifs are retained at indistinguishable rates in mammals and insects. The evolution of these motifs behave similarly to that of the example shown in Figure 5. (b) Four conserved GSTFs whose motifs are retained at different rates in mammals and insects.
Figure 5—figure supplement 2
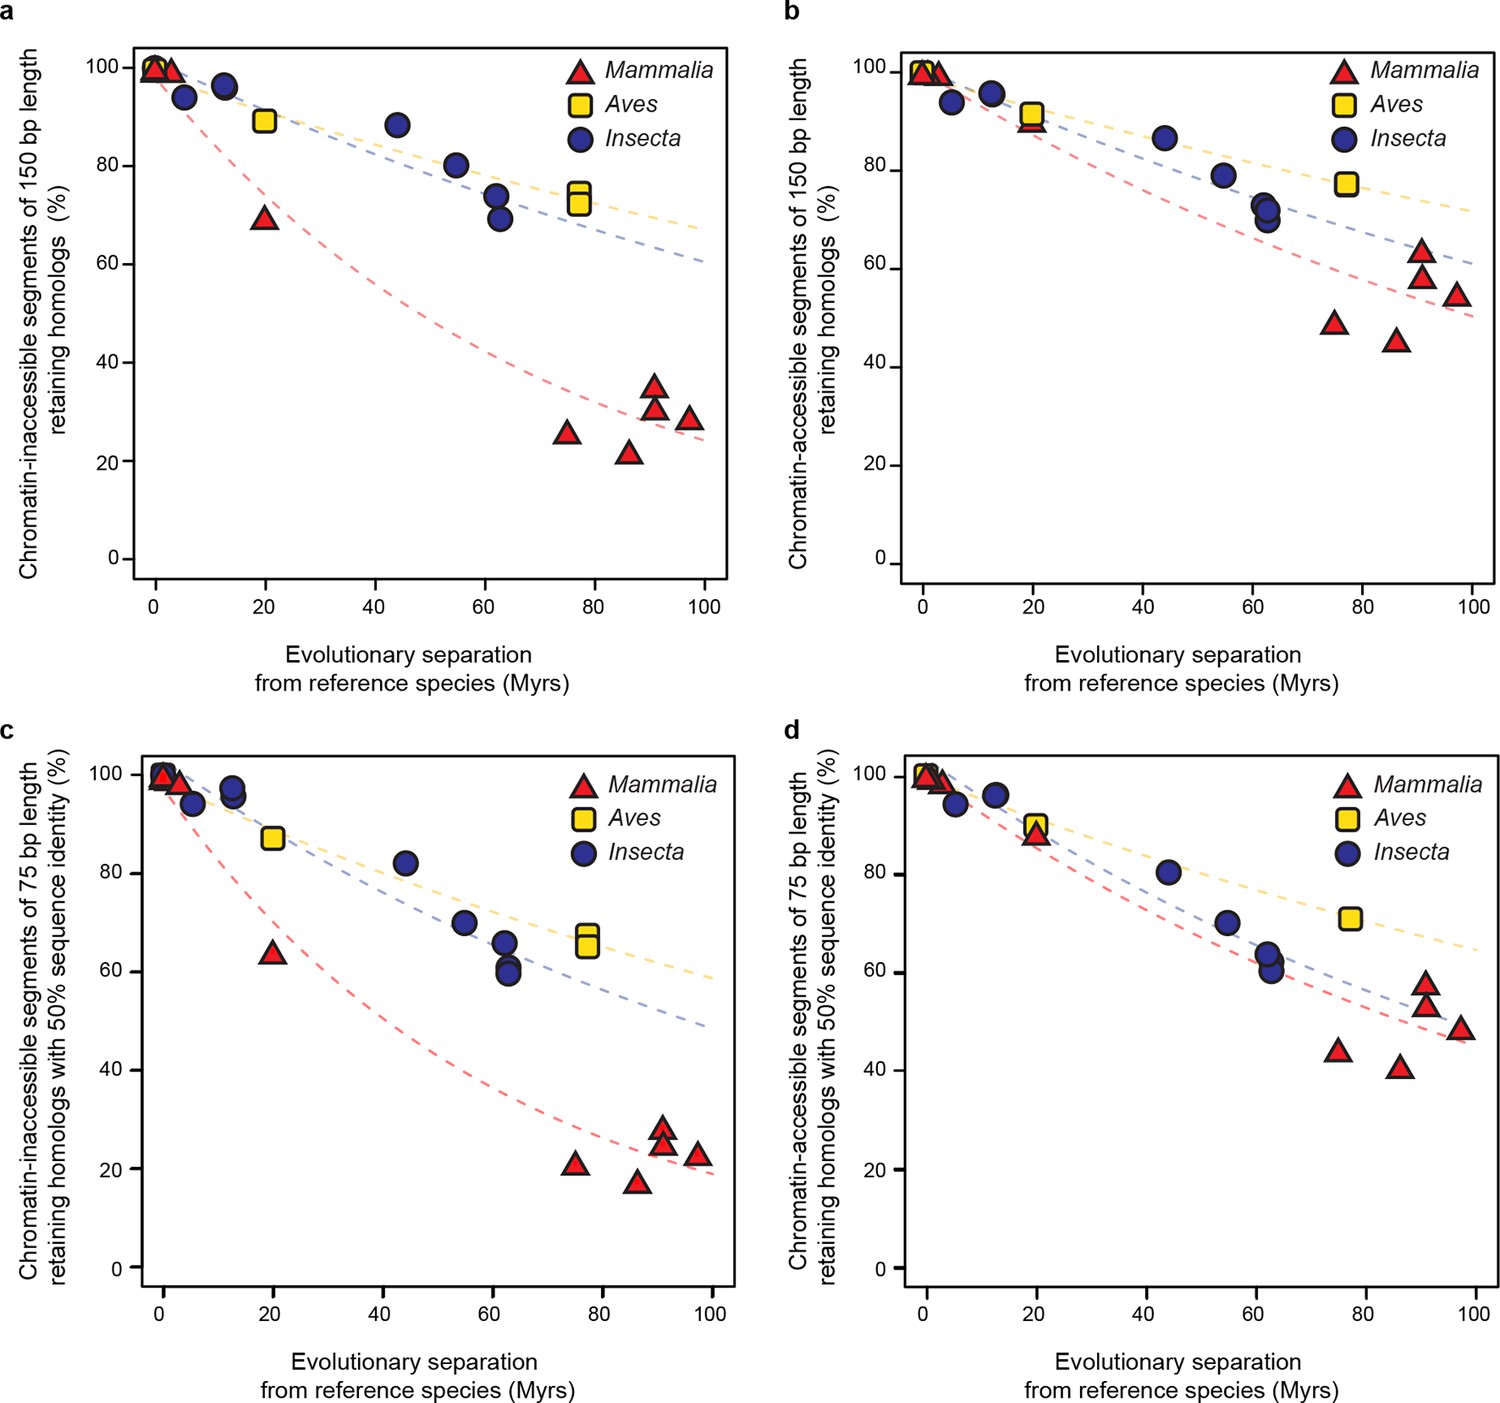
Retention of intergenic genomic segments in accessible and inaccessible chromatin is robust to changes in sampled region size and sequence identity threshold.
(a, b) Repeating the procedure used in Figure 5c and Figure 5d sampling segments of different length (150 bp) and (c, d) increasing the LiftOver minMatch (0.5).
Additional files
-
Supplementary file 1
Published ChIP-seq studies comparing binding locations of GSTFs in closely related metazoans used different technical methodologies to estimate divergence rates.
- https://doi.org/10.7554/eLife.11615.019
-
Supplementary file 2
Parameters used to build chain files among vertebrate genomes.
- https://doi.org/10.7554/eLife.11615.020
Download links
A two-part list of links to download the article, or parts of the article, in various formats.
Downloads (link to download the article as PDF)
Open citations (links to open the citations from this article in various online reference manager services)
Cite this article (links to download the citations from this article in formats compatible with various reference manager tools)
Evidence for a common evolutionary rate in metazoan transcriptional networks
eLife 4:e11615.
https://doi.org/10.7554/eLife.11615


