Developmental programming modulates olfactory behavior in C. elegans via endogenous RNAi pathways
- Syracuse University, United States
- Daegu Gyeongbuk Institute of Science and Technology, Republic of Korea
- Brandeis University, United States
Figures
Figure 1 with 3 supplements
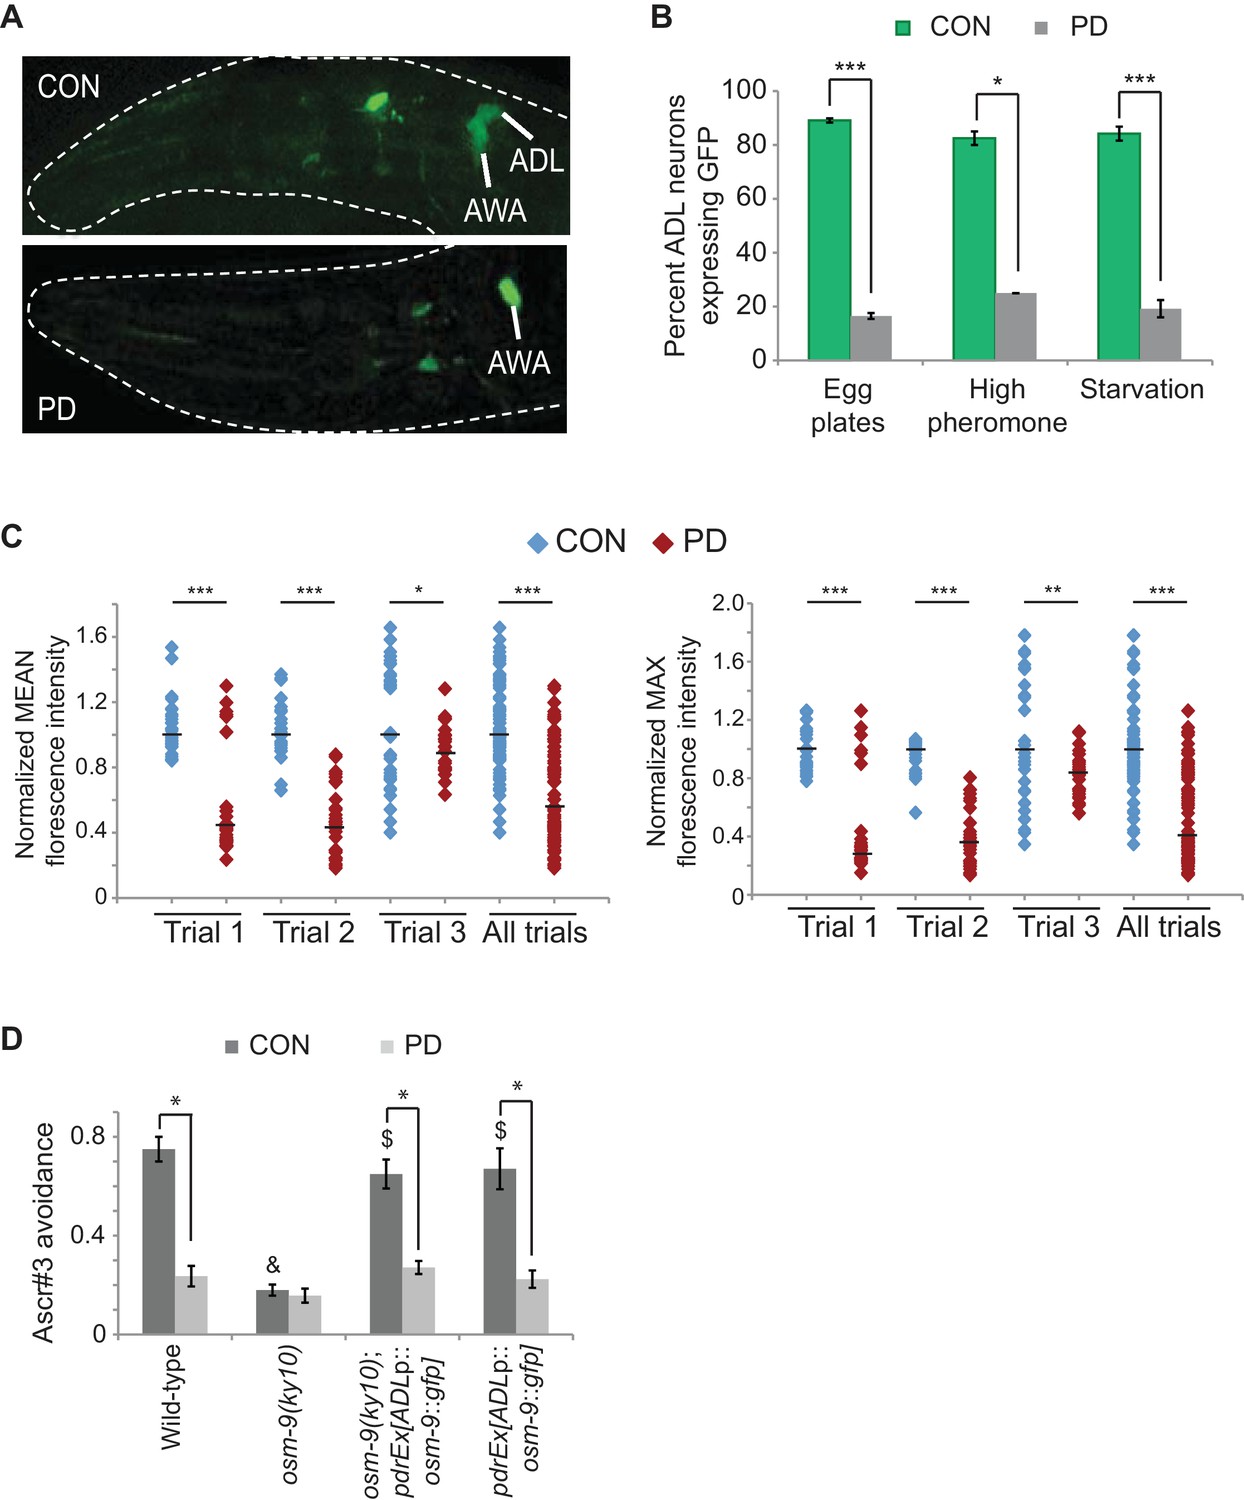
The osm-9 TRPV channel gene is regulated by developmental history.
(A) An osm-9p::gfp transgene is expressed in ADL and AWA neurons in CON adults, but is down-regulated in ADL neurons in PD adults. (B) osm-9p::gfp expression in ADL neurons in CON and PD adults that entered dauer due to crowding (egg plates), exposure to crude pheromone with low population density, or starvation. N ≥ 2 trials; n ≥ 40 animals (Figure 1—source data 1). **p<0.005, ***p<1 x 10⁻⁹, Student’s t-test. GFP in AWA is unaffected (Figure 1—figure supplement 1). (C) Quantification of osm-9 mRNA in ADL neurons of CON and PD using smFISH. The graphs represent individual mean and maximum fluorescence measurements for N = 3 biologically independent trials; n ≥ 87 neurons (Figure 1—source data 2). Medians are indicated. ***p<1 x 10⁻⁹, **p = 0.006 *p = 0.056, Student’s t-test. See Figure 1—figure supplement 2 and Figure 1—figure supplement 3. (D) Ascr#3 avoidance behavior of CON and PD adults normalized to M13 buffer. N ≥ 3 trials; n ≥ 60 animals (Figure 1—source data 3). Data for ADL-expressed osm-9 rescue strains are averages of two extrachromosomal lines. * indicates CON significantly different from PD; & CON or PD significantly different from wild-type; $ CON or PD significantly different from osm-9(ky10); One-way ANOVA with LSD posthoc correction, p<0.05. All error bars represent S.E.M. OSM-9 mediated behaviors modulated by ASH and AWA neurons are unaffected (Figure 1—figure supplement 1 and Figure 3—figure supplement 2).
-
Figure 1—source data 1
Spreadsheet of percentages of animals expressing osm-9p::gfp in ADL neurons of wild-type strains that experienced overcrowding, high pheromone, or starvation conditions.
- https://doi.org/10.7554/eLife.11642.004
-
Figure 1—source data 2
Spreadsheet containing mean and maximum florescence intensities of osm-9 smFISH probes in wild-type ADL neurons.
- https://doi.org/10.7554/eLife.11642.005
-
Figure 1—source data 3
Spreadsheet containing ascr#3 avoidance values for CON and PD in wild-type, osm-9(ky10), and ADL-specific, osm-9 rescue strains.
- https://doi.org/10.7554/eLife.11642.006
Figure 1—figure supplement 1

OSM-9 expression in AWA was unaffected by developmental programming.
(A) osm-9p::gfp expression in AWA neurons of CON and PD adults. N > 3 trials; n > 60 animals. (Figure 1—figure supplement 1—source data 1). (B) Chemotaxis index of CON and PD adults in wild-type and osm-9(ky10) strains in response to diacetyl. Behavioral assays were performed as described previously (Ward, 1973). Chemotaxis Index was calculated as [(# animals at diacetyl) – (# animals at control)] / total # animals. N = 3 trials; n > 300 animals. Error bars represent S.E.M. (Figure 1—figure supplement 1—source data 2).
-
Figure 1—figure supplement 1—source data 1
Spreadsheet containing percentage of animals expressing osm-9p::gfp in AWA neurons.
- https://doi.org/10.7554/eLife.11642.008
-
Figure 1—figure supplement 1—source data 2
Spreadsheet containing chemotaxis indices in response to diacetyl for wild-type and osm-9(ky10) strains.
- https://doi.org/10.7554/eLife.11642.009
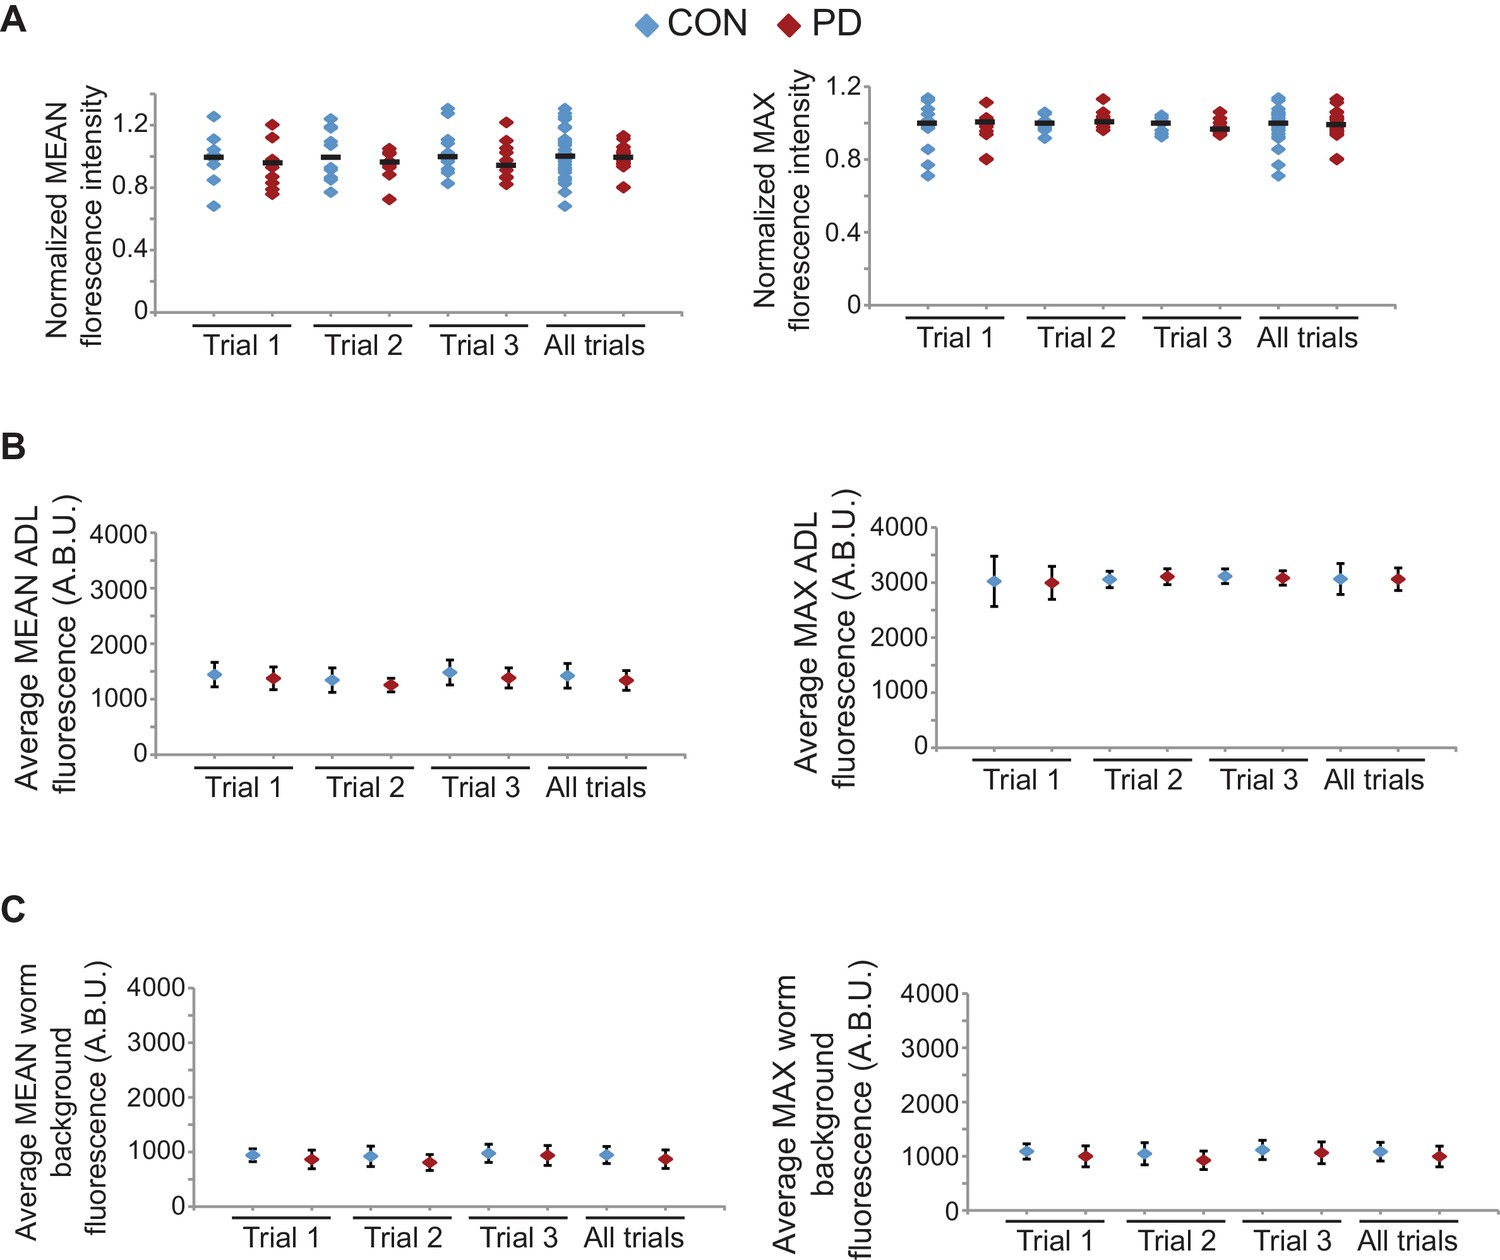
Figure 1—figure supplement 2
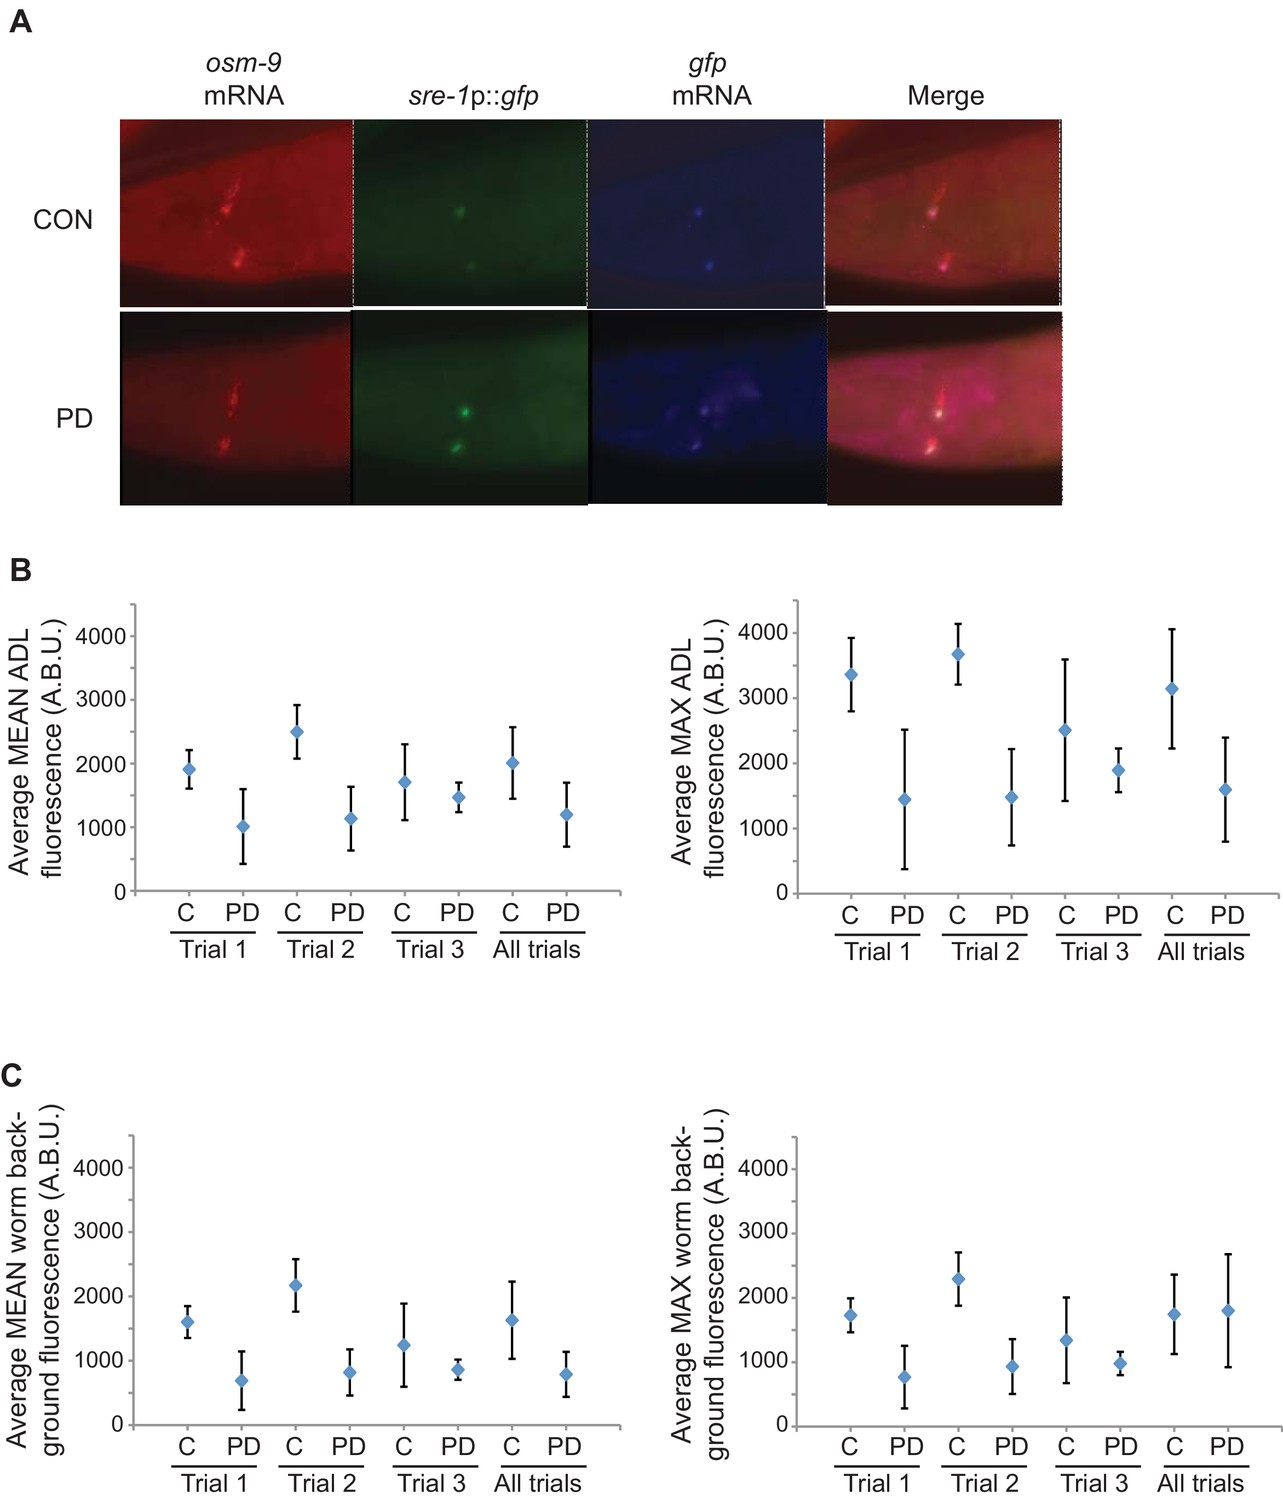
osm-9 mRNA levels are down-regulated in PD ADL neurons.
(A) Representative images analyzed for smFISH experiment. (B) Graphs represent the average mean and maximum florescence levels of CON and PD ADL neurons with osm-9 mRNA smFISH probes in arbitrary brightness units (A.B.U.). (C) Graphs representing the average mean and maximum fluorescence levels of worm backgrounds. n ≥ 87 neurons over 3 biologically independent trials. Error bars are standard deviation (Figure 1—figure supplement 2—source data 1).
-
Figure 1—figure supplement 2—source data 1
Spreadsheet containing mean and maximum florescence intensities for osm-9 smFISH probes in ADL neurons and worm backgrounds.
- https://doi.org/10.7554/eLife.11642.011
Figure 1—figure supplement 3

gfp mRNA levels are unaltered between CON and PD ADL neurons.
(A) Quantification of gfp mRNA in ADL neurons of CON and PD using smFISH. ADL neurons were identified by expression of sre-1p::gfp. The graphs represent individual mean and maximum fluorescence measurements for n ≥ 10 neurons over 3 biologically independent trials. * p = 0.042, Student’s t-test. (B) Graphs represent the average mean and maximum florescence levels of CON and PD ADL neurons with gfp mRNA smFISH probes in arbitrary brightness units (A.B.U.). (C) Graphs representing the average mean and maximum fluorescence levels of worm backgrounds. Error bars are standard deviation (Figure 1—figure supplement 3—source data 1).
-
Figure 1—figure supplement 3—source data 1
Spreadsheet containing normalized and raw mean and maximum florescence intensities for gfp smFISH probes in ADL neurons and worm backgrounds.
- https://doi.org/10.7554/eLife.11642.013
Figure 2
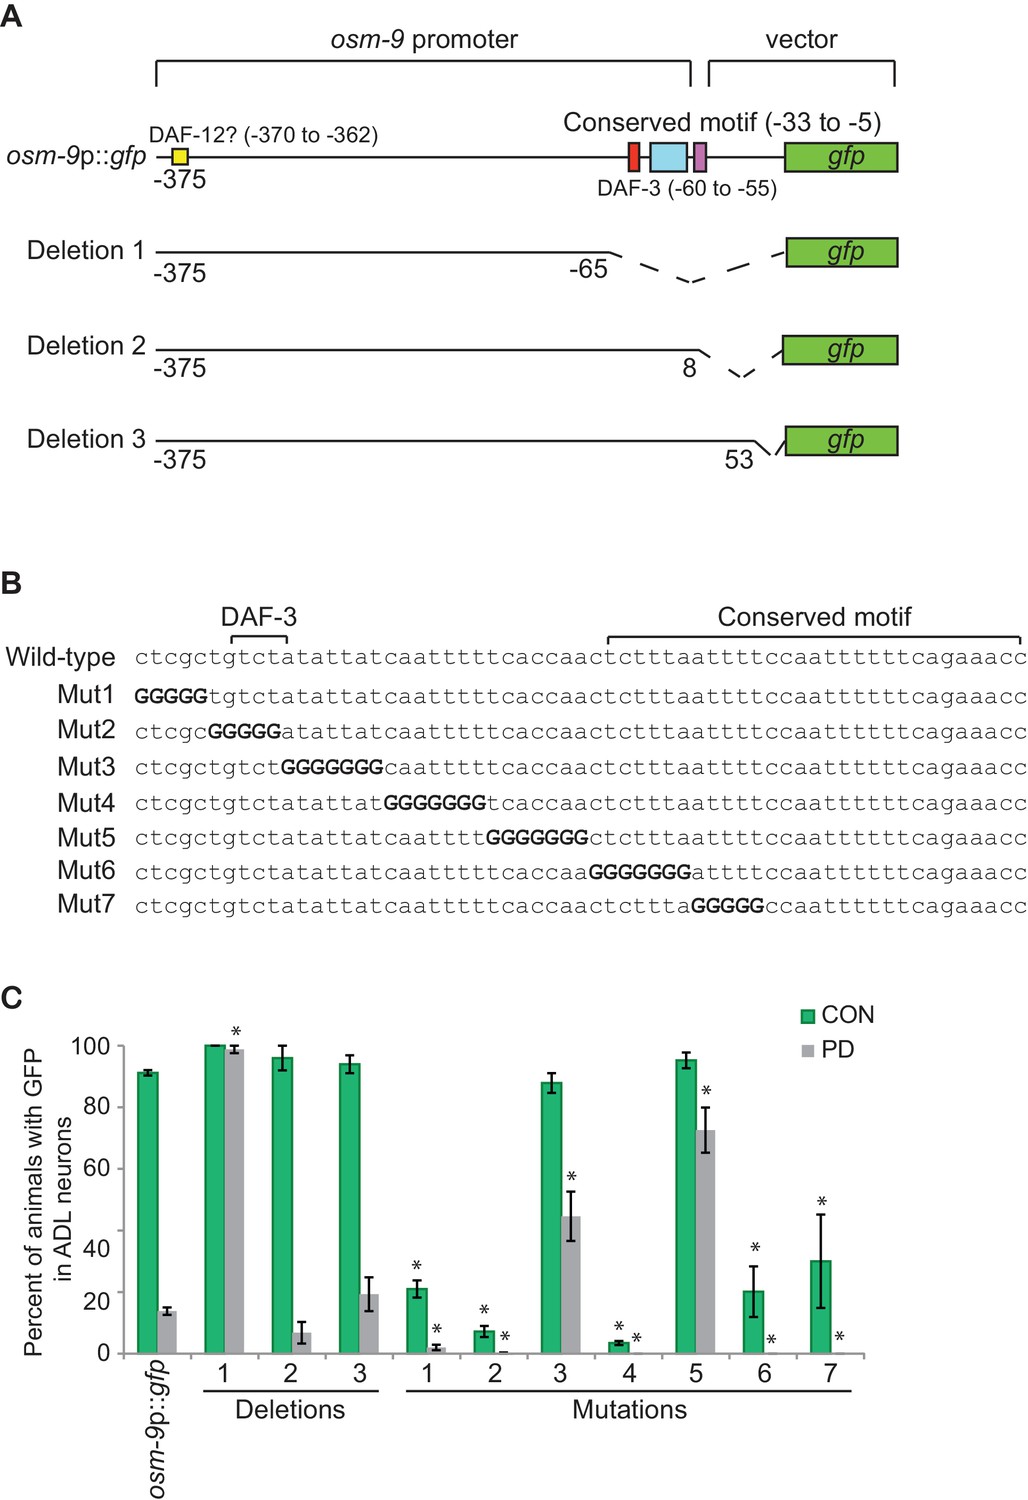
The PD motif is necessary for the differential regulation of osm-9.
(A) Schematic of osm-9 promoter driving gfp expression. Dotted lines indicate deleted sequences. Purple, blue, red, and yellow boxes represent 18 bp osm-9 coding sequence, the conserved motif, DAF-3 binding site, and potential DAF-12 binding site, respectively. (B) The PD motif DNA sequences of wild-type and mutated versions. Bold 'G' indicates where wild-type sequence was mutated to guanine. (C) GFP expression in CON and PD ADL neurons of strains carrying deletion and mutated versions of osm-9p::gfp. Data for each deletion and mutation represents the average of two extrachromosomal lines. * indicates significantly different from wild-type CON or PD; One-way ANOVA with LSD posthoc correction, p<0.05. All error bars represent S.E.M (Figure 2—source data 1).
-
Figure 2—source data 1
Spreadsheet of percentages of animals expressing gfp in ADL neurons in strains carrying deletion and mutation versions of osm-9p::gfp.
The conserved sequence formula for the PD motif is also included.
- https://doi.org/10.7554/eLife.11642.015
Figure 3 with 2 supplements
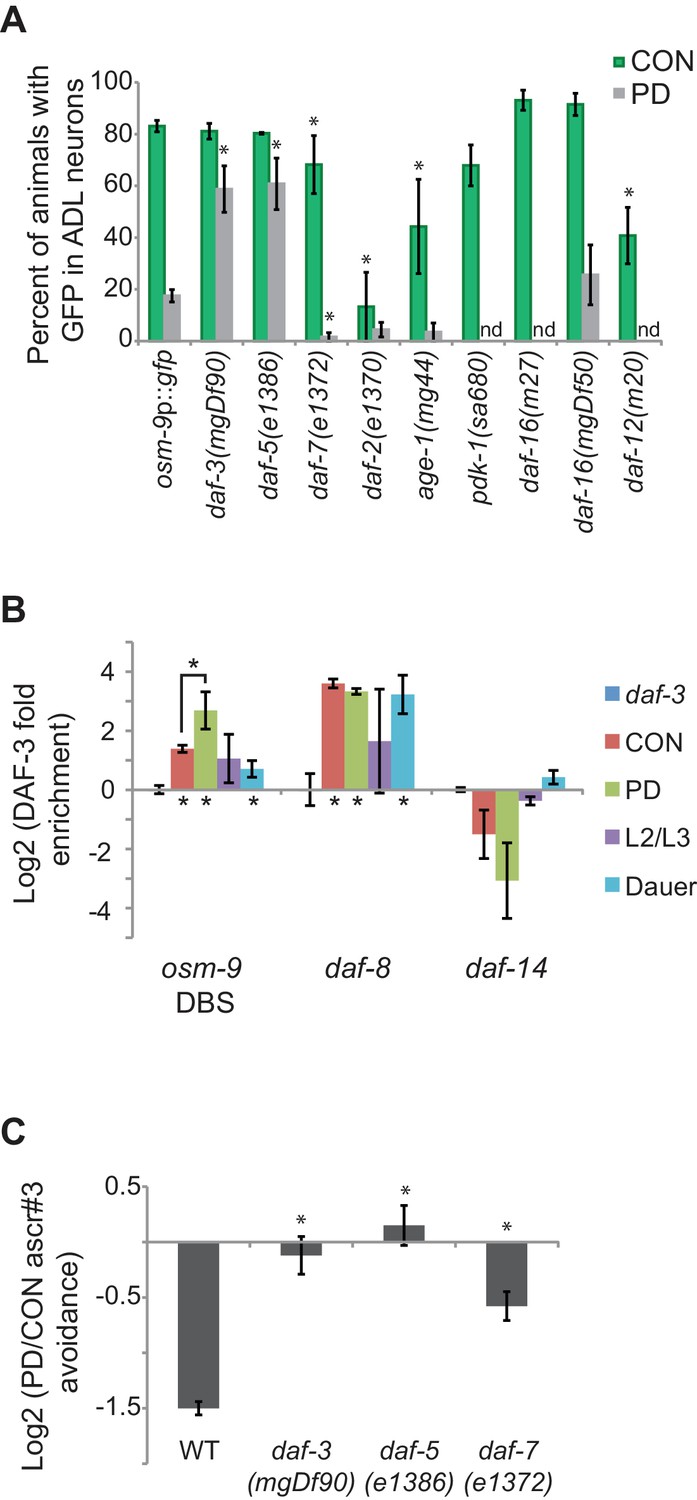
The TGF-β pathway regulates osm-9 expression in response to developmental history.
(A) Percent ADL neurons expressing osm-9p::gfp in CON and PD adults in wild-type and strains carrying mutations in TGF-β and insulin signaling pathways. GFP expression for Mutation 2 in daf-3, daf-5, and daf-3; daf-5 mutants is found in Figure 3—figure supplement 1. N ≥ 3 trials; n ≥ 60 animals (Figure 3—source data 1). * indicates CON or PD significantly different from wild-type; One-way ANOVA with LSD posthoc correction, p<0.05. n.d., not determined. (B) Log2 normalized enrichment of DAF-3 SMAD binding to the osm-9 DAF-3 binding site (DBS) in C. elegans developmental stages. daf-8 and daf-14 are positive and negative controls, respectively. Bar graph represents IP-qPCR data, normalized to DAF-3 binding to actin act-2 promoter (Park et al., 2010). N ≥ 2 biologically independent trials (Figure 3—source data 2). * indicates enriched over background (daf-3 CON) or between CON and PD as indicated, p<0.05, Student’s t-test. (C) Log2 PD/CON ratio of ascr#3 avoidance behavior in wild-type and strains carrying mutations in TGF-β pathway genes. Data for controls is found in Figure 3—figure supplement 2. * indicates significantly different from wild-type; One-way ANOVA with LSD posthoc correction, p<0.05 (Figure 3—source data 3). All error bars represent S.E.M.
-
Figure 3—source data 1
Spreadsheet containing percentages of animals expressing osm-9p::gfp in ADL neurons in strains carrying mutations in TGF-β and insulin signaling genes.
- https://doi.org/10.7554/eLife.11642.017
-
Figure 3—source data 2
Spreadsheet containing DAF-3 enrichment values in wild-type CON, PD, larval L3, and dauer animals.
- https://doi.org/10.7554/eLife.11642.018
-
Figure 3—source data 3
Spreadsheet containing PD/CON ascr#3 avoidance ratios for strains carrying mutations in TGF-β and insulin signaling genes.
- https://doi.org/10.7554/eLife.11642.019
Figure 3—figure supplement 1
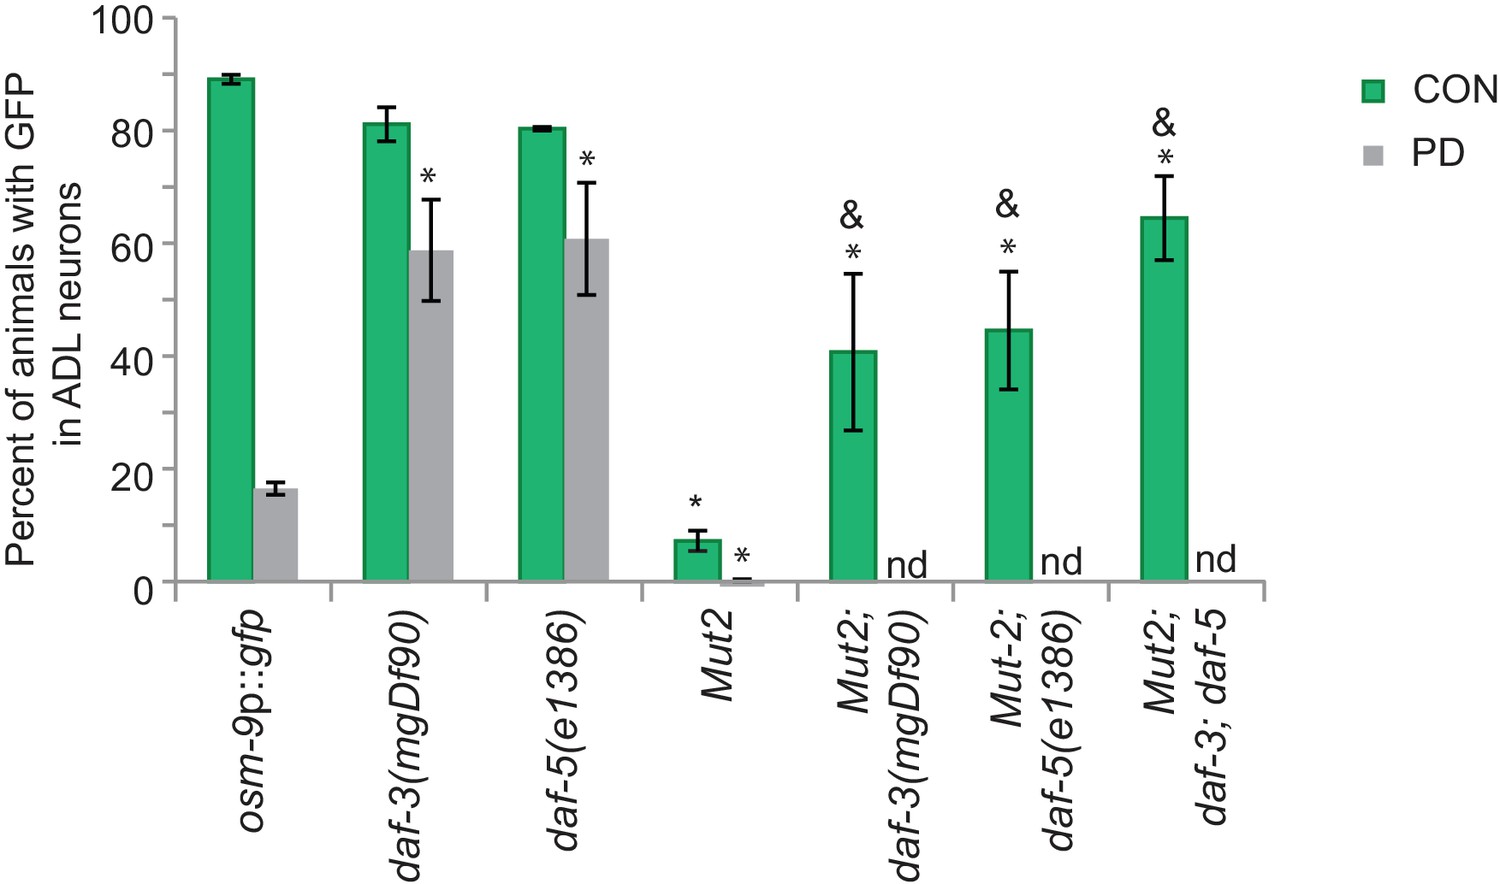
DAF-3 and DAF-5 may also indirectly regulate osm-9 transcription.
Our osm-9p::gfp expression and ascr#3 avoidance behavior results both suggested that DAF-3 SMAD and DAF-5 SNO/SKI are acting as a negative regulators of osm-9 in PD ADL neurons (see Figure 3). However, mutation of part of the potential DAF-3 binding site (Mutation 2) resulted in a decrease in osm-9 expression in CON adults. We observed significantly increased GFP expression in ADL neurons of CON adults carrying the Mutation 2 construct in the daf-3(mgDf90), daf-5(e1386), and daf-3(mgDf90); daf-5(e1386) mutant strains compared to wild-type. We were unable to obtain PD adults in these mutant strains to examine GFP levels. DAF-3 has been shown to negatively regulate the genes daf-7, daf-8, and myosin gene myo-2 by binding to their upstream regulatory sequences (Thatcher et al., 1999; Park et al., 2010). Thus, DAF-3 and DAF-5 may be inhibiting activity of an unknown protein that promotes osm-9 expression when they cannot bind to the PD motif. n ≥ 20 animals over at least 3 biologically independent trials. osm-9p::gfp data in wild-type, daf-3(mgDf90), and daf-5(e1386) and Mutation 2 reproduced from Figures 2C and 3A for reference. Data for strains carrying Mutation 2 are averages of values for two independent extrachromosomal lines. * Significantly different from wild-type, & significantly different from Mutation 2, One-way ANOVA, LSD posthoc correction, p<0.05. Error bars represent S.E.M. (Figure 3—figure supplement 1—source data 1).
-
Figure 3—figure supplement 1—source data 1
Spreadsheet containing the percentage of animals expressing Mut2 version of osm-9p::gfp in daf-3(mgDf90) and daf-5(e1386) strains.
- https://doi.org/10.7554/eLife.11642.021
Figure 3—figure supplement 2
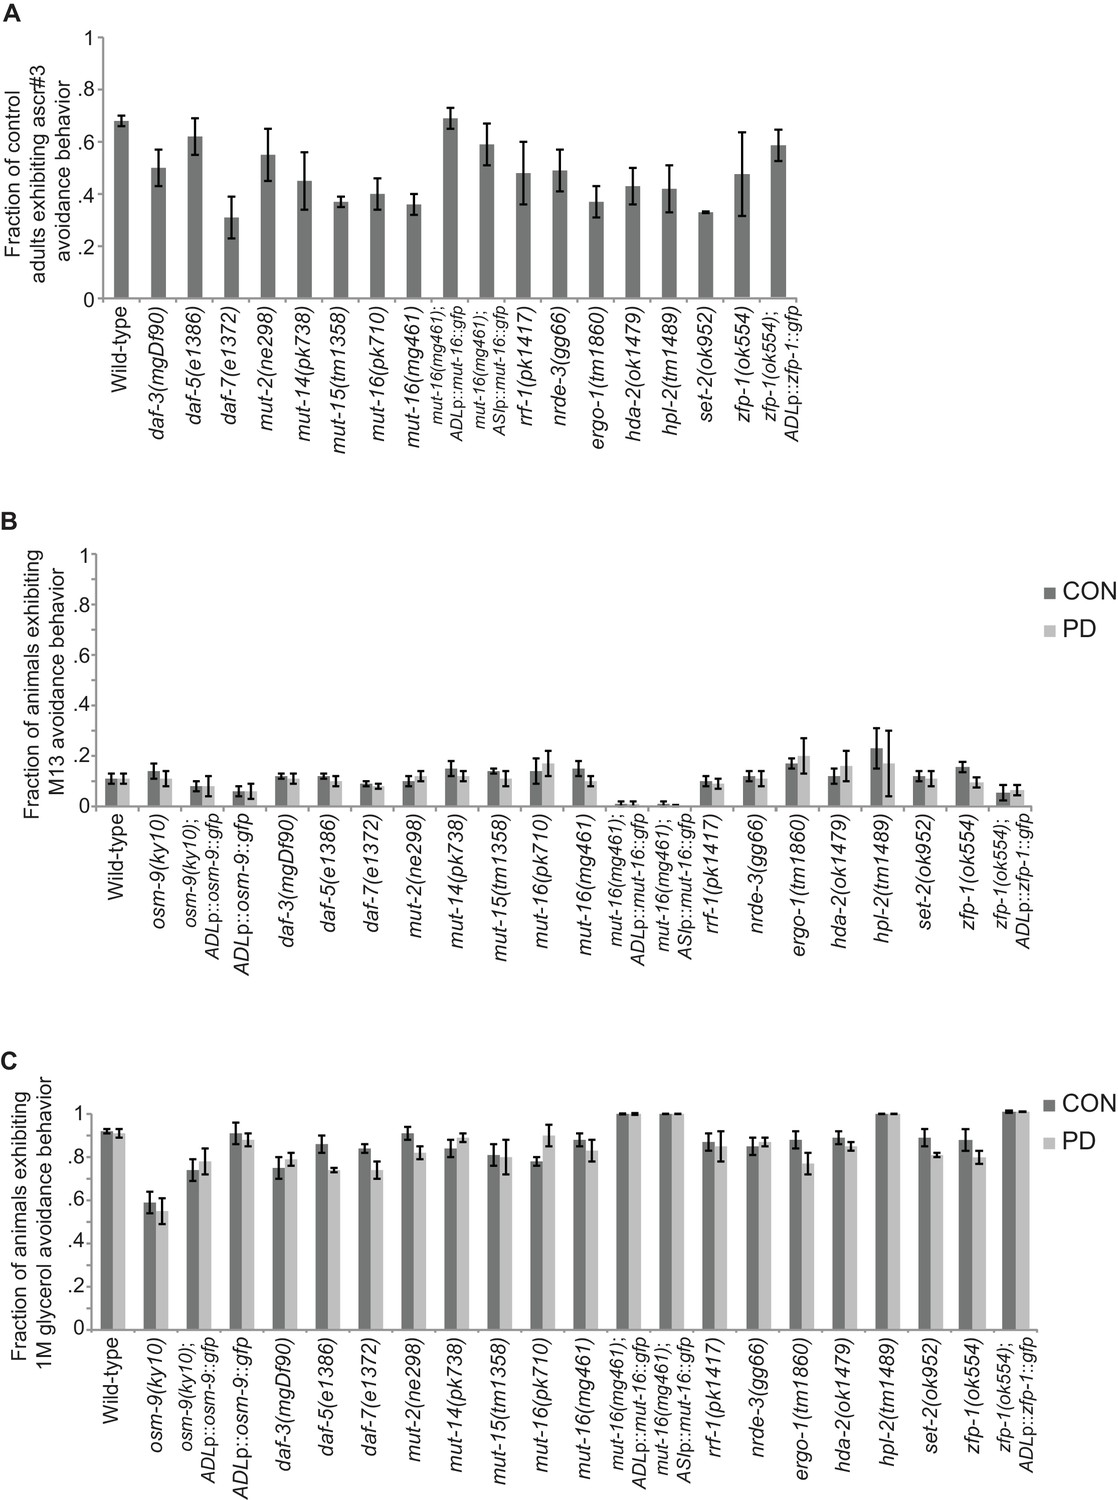
Strains tested for ascr#3 avoidance exhibited expected behaviors for positive and negative controls.
(A) Fraction of CON adults from strains in Figures 3C, 4B, and 5B that exhibit ascr#3 avoidance behavior. (B) Fraction of CON and PD adults from strains in Figures 1D, 3C, 4B, and 5B that exhibit M13 avoidance behavior (negative control). (C) Fraction of CON and PD adults from strains in Figures 1D, 3C, 4B, and 5B that exhibit 1 M glycerol avoidance behavior (positive control). Data for neuron-specific rescue strains is average values for two independent extrachromosomal lines. Error bars represent S.E.M. (Figure 3—figure supplement 2—source data 1).
-
Figure 3—figure supplement 2—source data 1
Spreadsheet containing avoidance responses CON and PD adults to M13 and 1 M glycerol.
Normalized avoidance responses of CON adults to ascr#3 are also included.
- https://doi.org/10.7554/eLife.11642.023
Figure 4 with 4 supplements
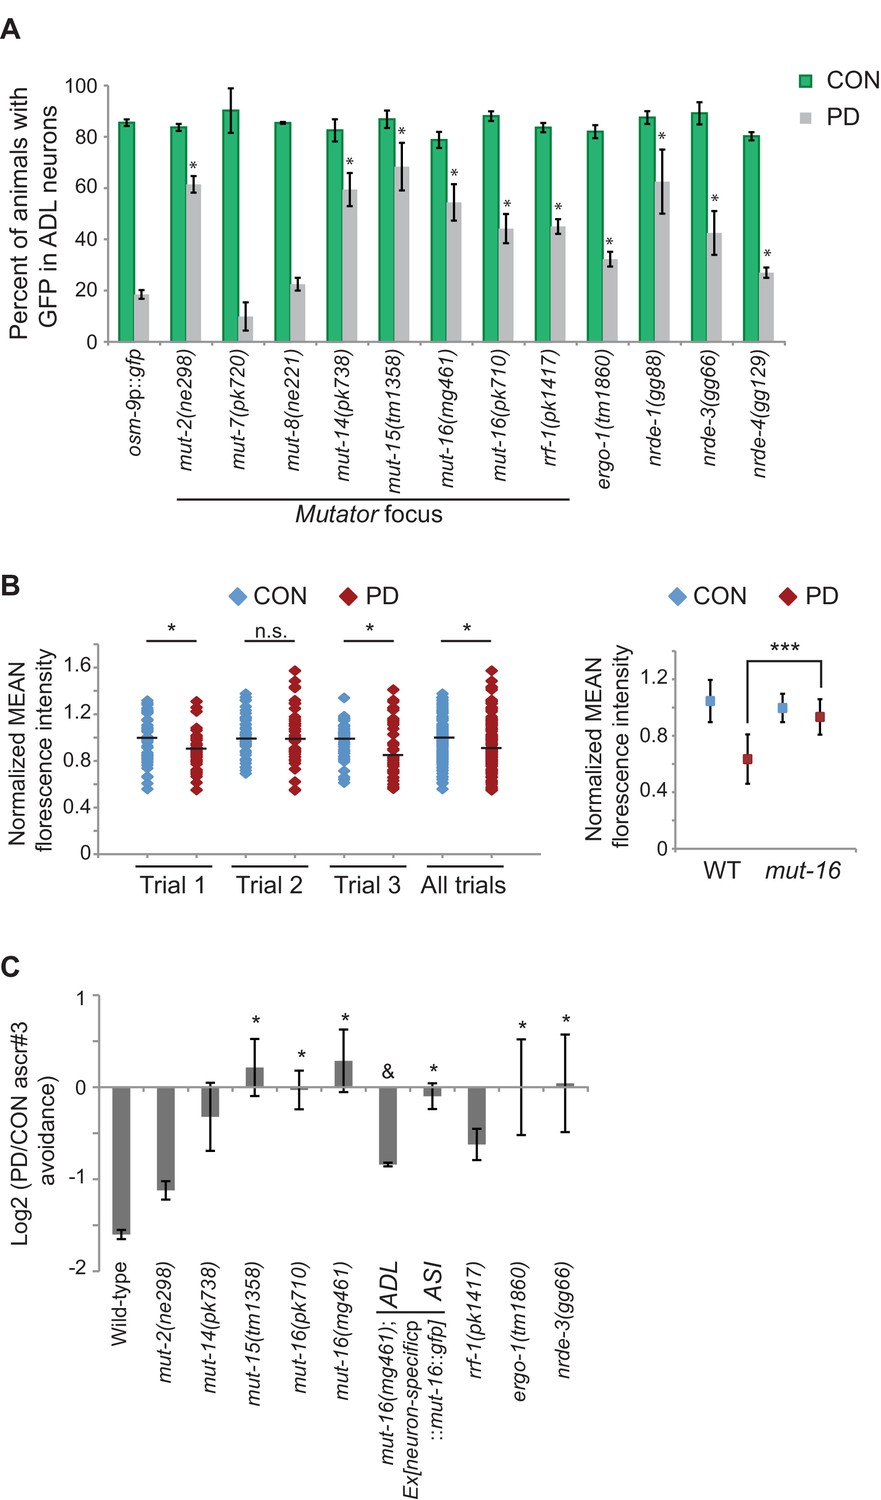
Endogenous RNAi pathways regulate the developmental programming of osm-9 expression and ascr#3 avoidance behavior.
(A) Percentage of ADL neurons expressing osm-9p::gfp in wild-type and strains carrying mutations in endo-RNAi genes. Data for additional mutant strains is found in Figure 4—figure supplement 1. N ≥ 2 trials; n ≥ 40 animals (Figure 4—source data 1). * indicates mutant CON or PD significantly different from wild-type; One-way ANOVA with LSD posthoc correction, p<0.05. (B) Quantification of osm-9 mRNA in ADL neurons of mut-16(mg461) CON and PD using smFISH. The graphs represent individual mean fluorescence measurements for N = 3 biologically independent trials; n ≥ 129 neurons (Figure 4—source data 2). Maximum florescent measurements are found in Figure 4—figure supplement 3. Control gfp mRNA measurements are found in Figure 4—figure supplement 4. Medians are indicated. Comparison of means with S.E.M. of all trials for CON and PD in wild-type and mut-16 is shown. *p<0.05, ***p< 10–14, Student’s t-test. (C) Log2 PD/CON ratio of ascr#3 avoidance behavior in wild-type and strains carrying mutations in endo-RNAi genes. Data for ADL and ASI-specific expression of mut-16 rescue are averages of two extrachromosomal lines. N ≥ 3 trials; n ≥ 60 animals (Figure 4—source data 3). * indicates PD/CON ratio significantly different from wild-type; & indicates PD/CON ratio significantly different from mut-16(mg461); One-way ANOVA, LSD posthoc correction, p<0.05. All error bars represent S.E.M. Data for controls is found in Figure 3—figure supplement 2.
-
Figure 4—source data 1
Spreadsheet containing percentages of animals expressing osm-9p::gfp in ADL neurons in strains carrying mutations in genes with RNAi functions.
- https://doi.org/10.7554/eLife.11642.025
-
Figure 4—source data 2
Spreadsheet containing raw and normalized mean florescence intensities of osm-9 smFISH probes in ADL neurons in mut-16(mg461) strain.
- https://doi.org/10.7554/eLife.11642.026
-
Figure 4—source data 3
Spreadsheet containing PD/CON ascr#3 avoidance ratios for strains carrying mutations in genes with RNAi functions.
- https://doi.org/10.7554/eLife.11642.027
Figure 4—figure supplement 1

The ERGO-1/NRDE-3 endo-siRNA pathway contributes to the developmental programming of osm-9 gene expression.
Percentage of CON and PD adults that exhibited GFP in ADL neurons in additional mutant strains with functions in endo-RNAi and chromatin remodeling is shown. * indicates CON or PD significantly different compared to wildtype; p<0.05; One-way ANOVA with LSD posthoc correction. N ≥ 2 trials; n ≥ 40 animals. Error bars represent S.E.M. (Figure 4—figure supplement 1—source data 1).
-
Figure 4—figure supplement 1—source data 1
Spreadsheet containing percentage of animals expressing osm-9p::gfp in ADL neurons of additional strains carrying mutations in genes with RNAi and chromatin remodeling functions.
- https://doi.org/10.7554/eLife.11642.029
Figure 4—figure supplement 2

osm-9 siRNAs map predominantly to exons.
(A) Schematic of osm-9 gene and regulatory regions. Exons are indicated by gray boxes. A tRNA (B0212.t1) and a non-coding RNA (B0212.7) are located in intron 12 of the osm-9 locus (shown in purple). SiRNAs were sequenced from CON, PD, L3, and dauer whole animals in previous work (Hall et al., 2013); those sequences mapping to the osm-9 locus are indicated (Figure 4—figure supplement 2—source data 1). The black arrow indicates the siRNA mapping to the PD motif. (B) Characterization of siRNA length and location mapping to the osm-9 locus for each developmental stage.
-
Figure 4—figure supplement 2—source data 1
Spreadsheet containing siRNA sequences mapping to the osm-9 locus for CON, PD, larval L3, and dauer small RNA libraries.
- https://doi.org/10.7554/eLife.11642.031
Figure 4—figure supplement 3
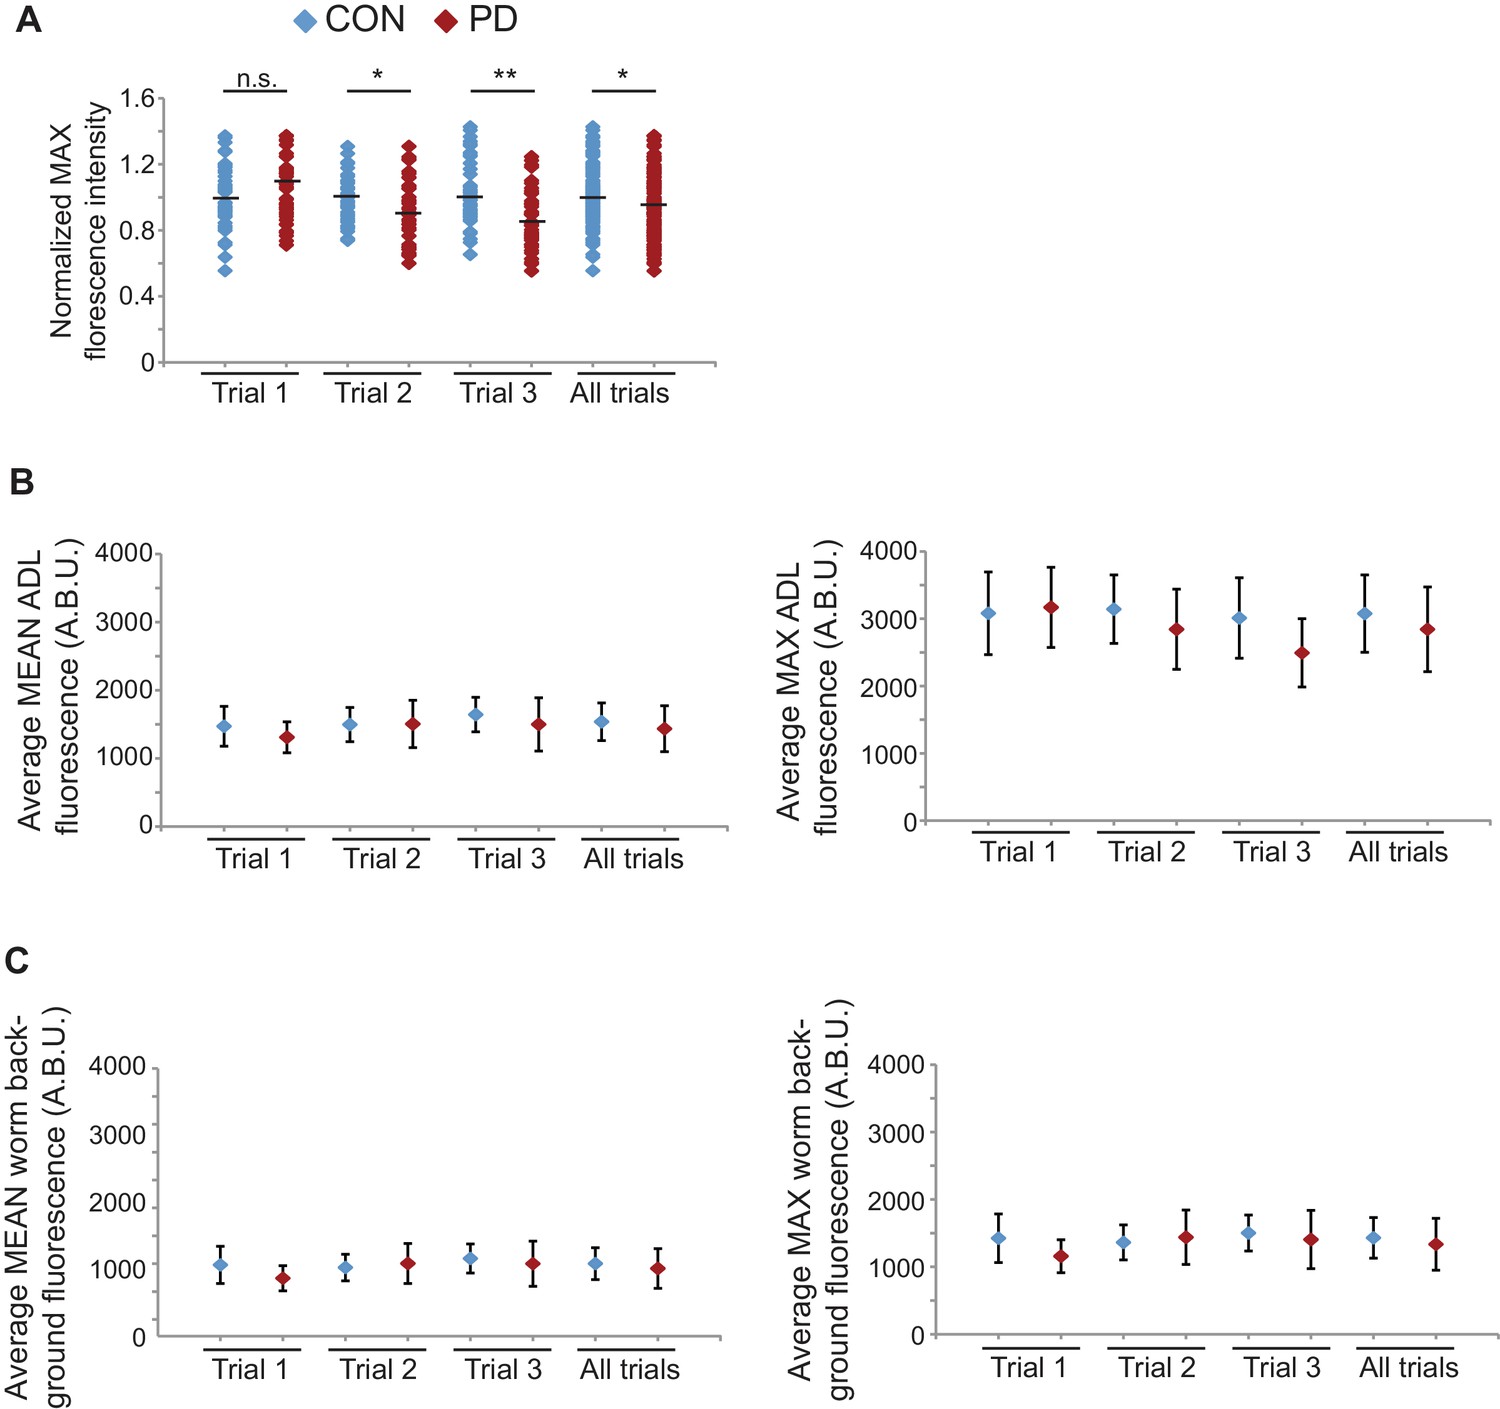
osm-9 mRNA levels quantified in mut-16(mg461) ADL neurons using smFISH.
(A) Normalized maximum florescence levels in mut-16(mg461) CON and PD ADL neurons. Medians are indicated. * indicates p<0.05, ** p<10–4, n.s. not significant, Student’s t-test. (B) Graphs represent the average mean and maximum florescence levels of CON and PD ADL mut-16(mg461) neurons with osm-9 mRNA smFISH probes in arbitrary brightness units (A.B.U.). (C) Graphs represent the average mean and maximum florescence background levels of CON and PD ADL mut-16(mg461) neurons. N = 3 biologically independent trials; n ≥ 129 neurons. Error bars are standard deviation (Figure 4—figure supplement 3—source data 1).
-
Figure 4—figure supplement 3—source data 1
Spreadsheet containing mean and maximum florescence intensities for osm-9 smFISH probes in ADL neurons and worm backgrounds in mut-16(mg461) strain.
- https://doi.org/10.7554/eLife.11642.033
Figure 4—figure supplement 4
gfp mRNA levels are unaltered between CON and PD ADL neurons in mut-16(mg461) strain.
(A) Quantification of gfp mRNA in ADL neurons of mut-16(mg461) CON and PD using smFISH. ADL neurons were identified by expression of sre-1p::gfp. The graphs represent individual mean and maximum fluorescence measurements for n = 10 neurons for 3 biologically independent trials. None of the comparisons between CON and PD within a trial are significantly different. (B) Graphs represent the average mean and maximum florescence levels of CON and PD ADL neurons in mut-16(mg461) with gfp mRNA smFISH probes in arbitrary brightness units (A.B.U.). (C) Graphs representing the average mean and maximum fluorescence levels of worm backgrounds. Error bars are standard deviation (Figure 4—figure supplement 4—source data 1).
-
Figure 4—figure supplement 4—source data 1
Spreadsheet containing mean and maximum florescence intensities for gfp smFISH probes in ADL neurons and worm backgrounds in mut-16(mg461) strain.
- https://doi.org/10.7554/eLife.11642.035
Figure 5
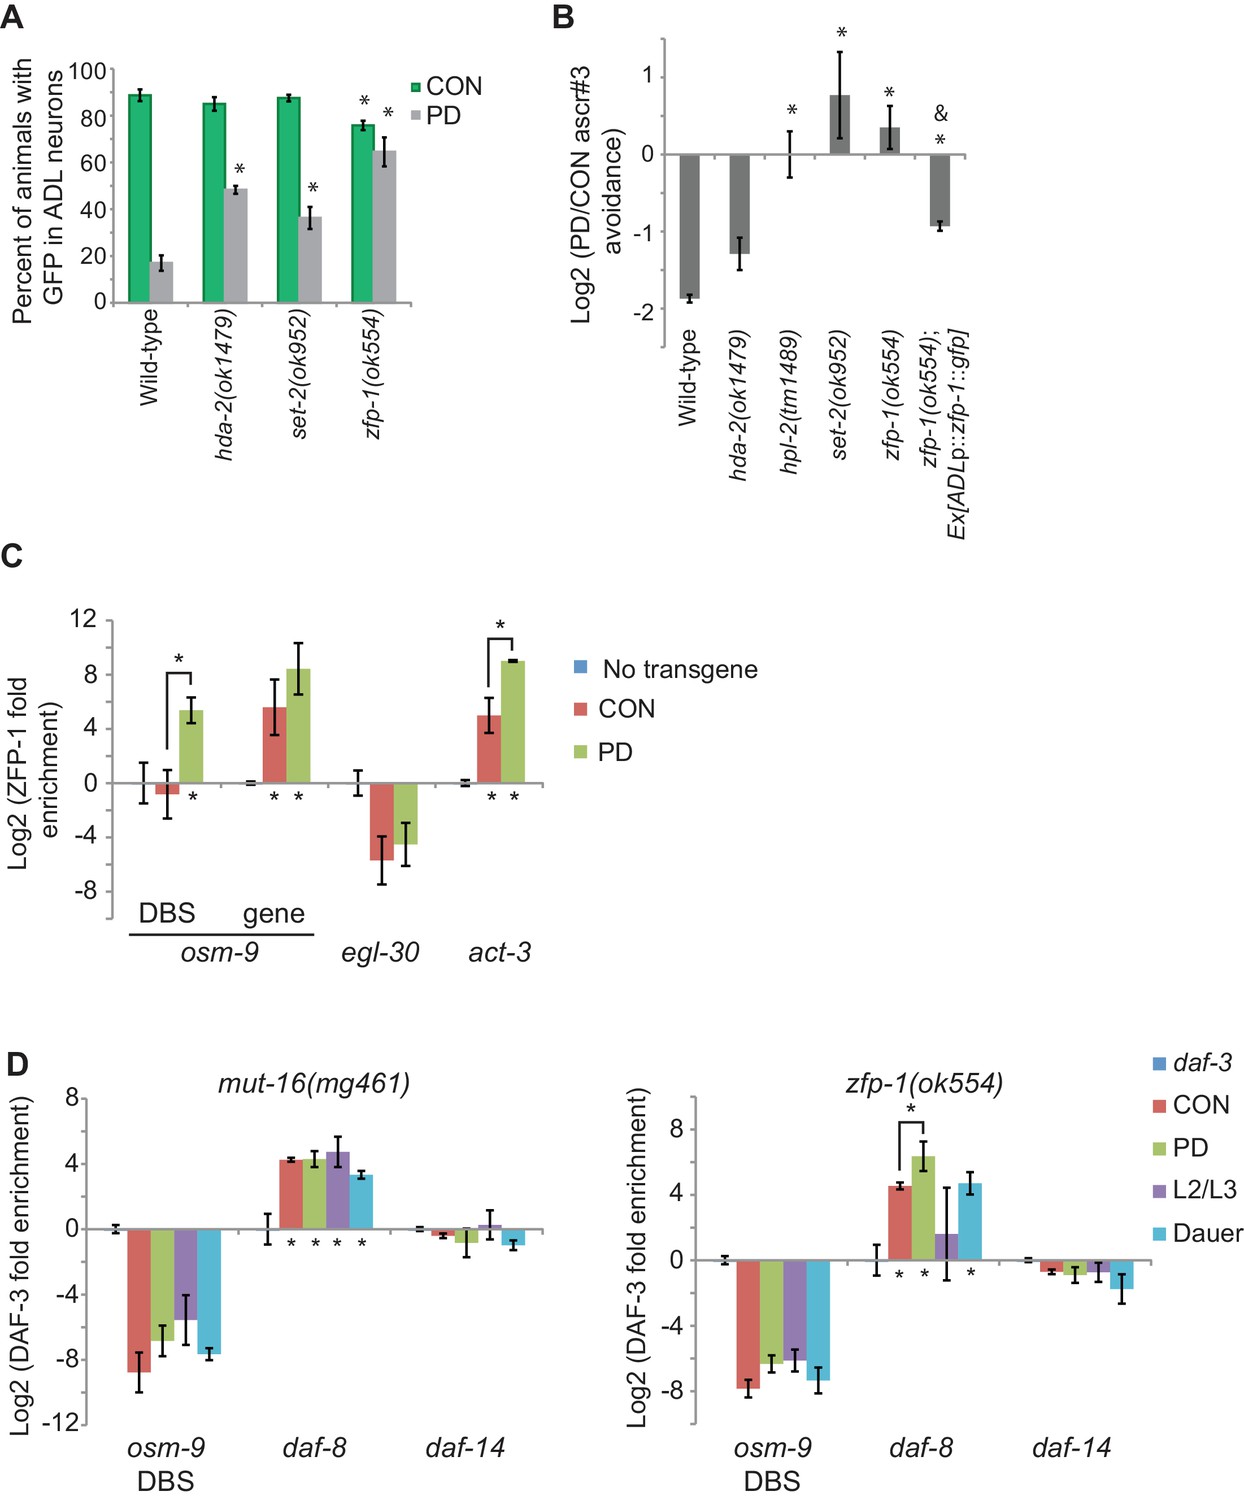
Chromatin remodeling pathways are required for developmental programming of osm-9 and ascr#3 avoidance behavior.
(A) Percentage of ADL neurons expressing osm-9p::gfp in wild-type and strains carrying mutations in genes with known chromatin remodeling functions. Data for zfp-1(ok554) represents average GFP expression of an osm-9p::gfp extrachromosomal array in two independent lines. N ≥ 3 trials; n ≥ 60 animals (Figure 5—source data 1). * indicates CON or PD significantly different from wild-type; One-way ANOVA with LSD posthoc correction, p<0.05. (B) Log2 PD/CON ratio of ascr#3 avoidance behavior in wild-type and chromatin remodeling mutant strains. Data for ascr#3 avoidance behavior of ADL-specific zfp-1 rescue strains is an average of two extrachromosomal lines. N ≥ 3 trials; n ≥ 60 animals (Figure 5—source data 2). * indicates PD/CON ratio significantly different from wild-type; Student’s t-test, p<0.05. & indicates PD/CON ratio significantly different from zfp-1(ok554); Student’s t-test, p<0.01. Data for controls is found in Figure 3—figure supplement 2. (C) Log2 enrichment of ZFP-1 at the osm-9 DAF-3 binding site (DBS) and gene body in ADL neurons of CON and PD adults. Promoter regions for egl-30 and act-3 are positive controls (Cecere et al., 2013). Data was normalized to ZFP-1 binding to gst-4 (negative control). N ≥ 2 biologically independent trials (Figure 5—source data 3). * indicates enrichment significantly greater than background or between PD and CON, Student’s t-test, p<0.05. (D) Log2 normalized enrichment of DAF-3 SMAD at the osm-9 DAF-3 binding site (DBS) in mut-16(mg461) and zfp-1(ok554) strains. daf-8 and daf-14 are positive and negative controls, respectively. Bar graph represents IP-qPCR data, normalized to DAF-3 binding to actin act-2 promoter (Park et al., 2010), and adjusted to show enrichment of DAF-3 above background levels in daf-3 (mgDf90) strain. N = 3 biologically independent trials (Figure 5—source data 4). * indicates enrichment significantly greater than background or between PD and CON, Student’s t-test, p<0.05. All error bars represent S.E.M.
-
Figure 5—source data 1
Spreadsheet containing percentages of animals expressing osm-9p::gfp in ADL neurons in strains carrying mutations in genes with chromatin remodeling functions.
- https://doi.org/10.7554/eLife.11642.037
-
Figure 5—source data 2
Spreadsheet containing PD/CON ascr#3 avoidance ratios for strains carrying mutations in genes with chromatin remodeling functions.
- https://doi.org/10.7554/eLife.11642.038
-
Figure 5—source data 3
Spreadsheet containing ZFP-1 enrichment values in ADL neurons of wild-type CON and PD adults.
- https://doi.org/10.7554/eLife.11642.039
-
Figure 5—source data 4
DAF-3 immunoprecipitation data for the osm-9, daf-8, and daf-14 loci in mut-16(mg461) and zfp-1(ok554) strains.
- https://doi.org/10.7554/eLife.11642.040
Figure 6
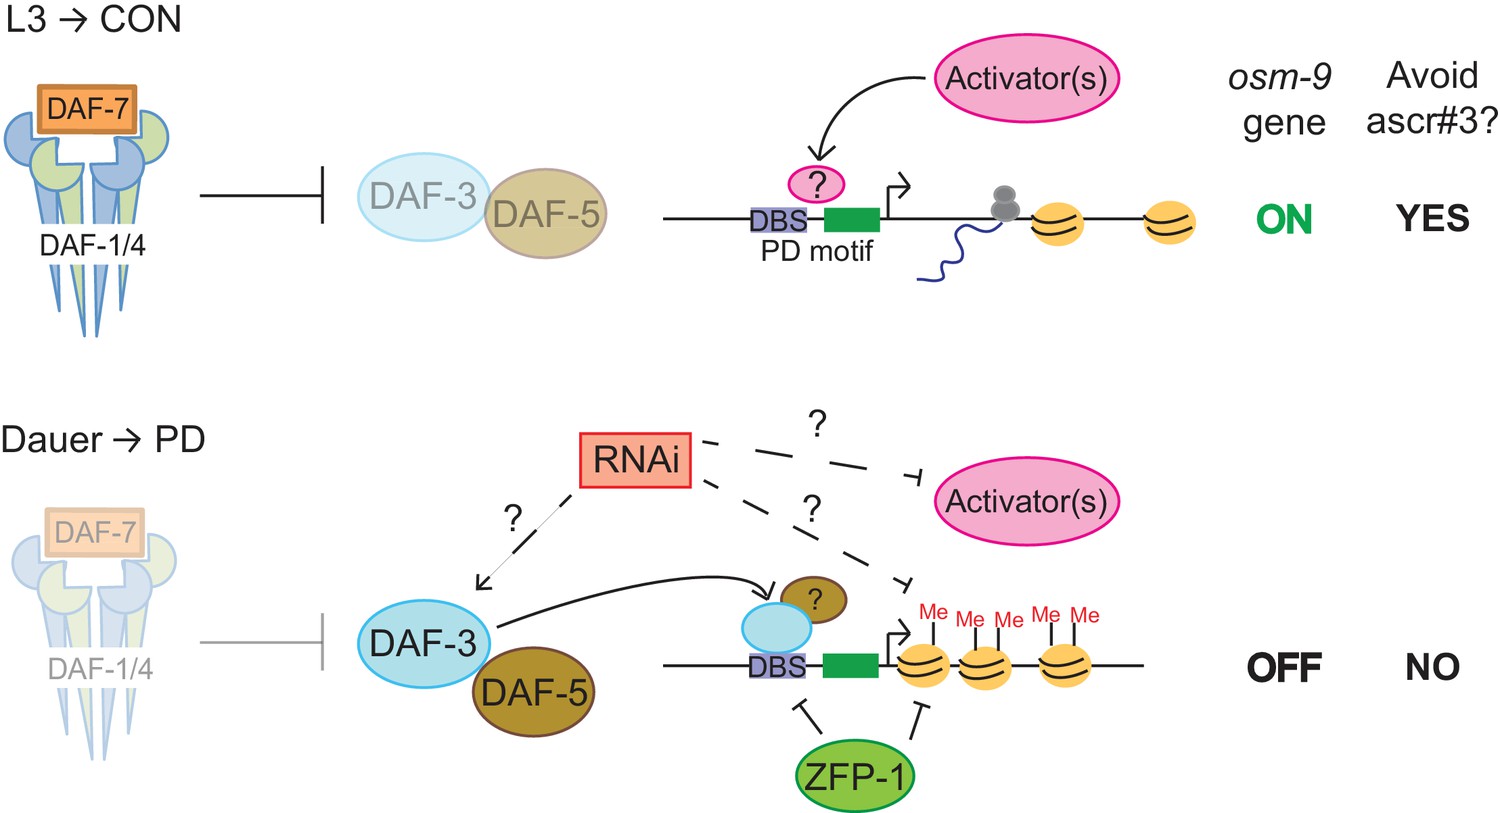
DAF-3, ZFP-1, and RNAi machinery act cooperatively to down-regulate osm-9 in postdauer ADL neurons.
Model for developmental programming of osm-9 gene expression as a result of developmental history. See Discussion for details.
Additional files
-
Supplementary file 1
List of C. elegans strains used in this study.
- https://doi.org/10.7554/eLife.11642.042
-
Supplementary file 2
Excel file containing primer sequences used in this study.
- https://doi.org/10.7554/eLife.11642.043
Download links
A two-part list of links to download the article, or parts of the article, in various formats.
Downloads (link to download the article as PDF)
Open citations (links to open the citations from this article in various online reference manager services)
Cite this article (links to download the citations from this article in formats compatible with various reference manager tools)
Developmental programming modulates olfactory behavior in C. elegans via endogenous RNAi pathways
eLife 5:e11642.
https://doi.org/10.7554/eLife.11642


