Allosteric modulation in monomers and oligomers of a G protein-coupled receptor
- University of Toronto, Canada
- Hershey Medical Center, United States
Figures
Figure 1 with 2 supplements
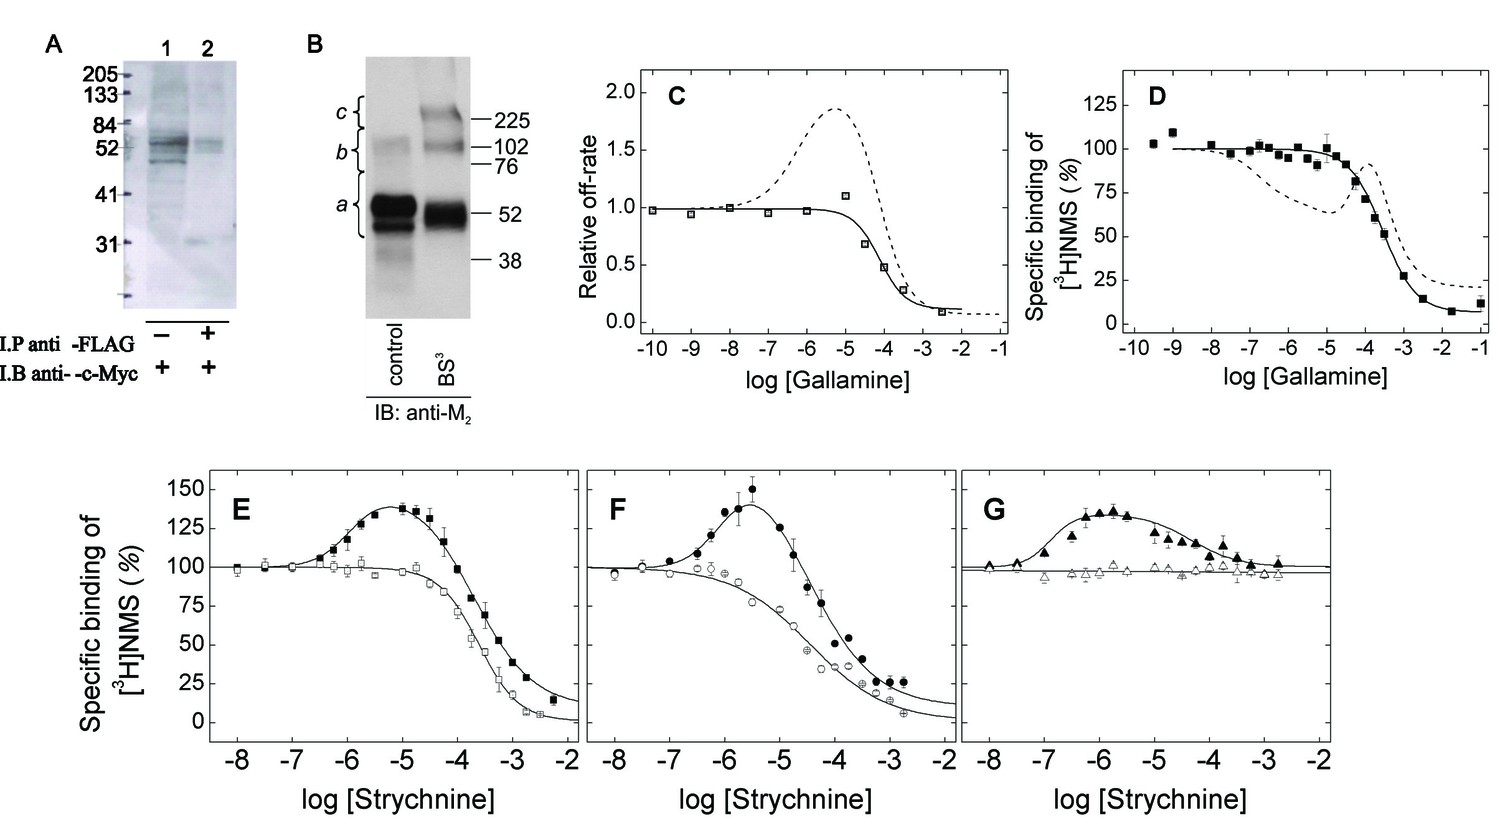
Oligomeric and monomeric preparations of the M2 muscarinic receptor.
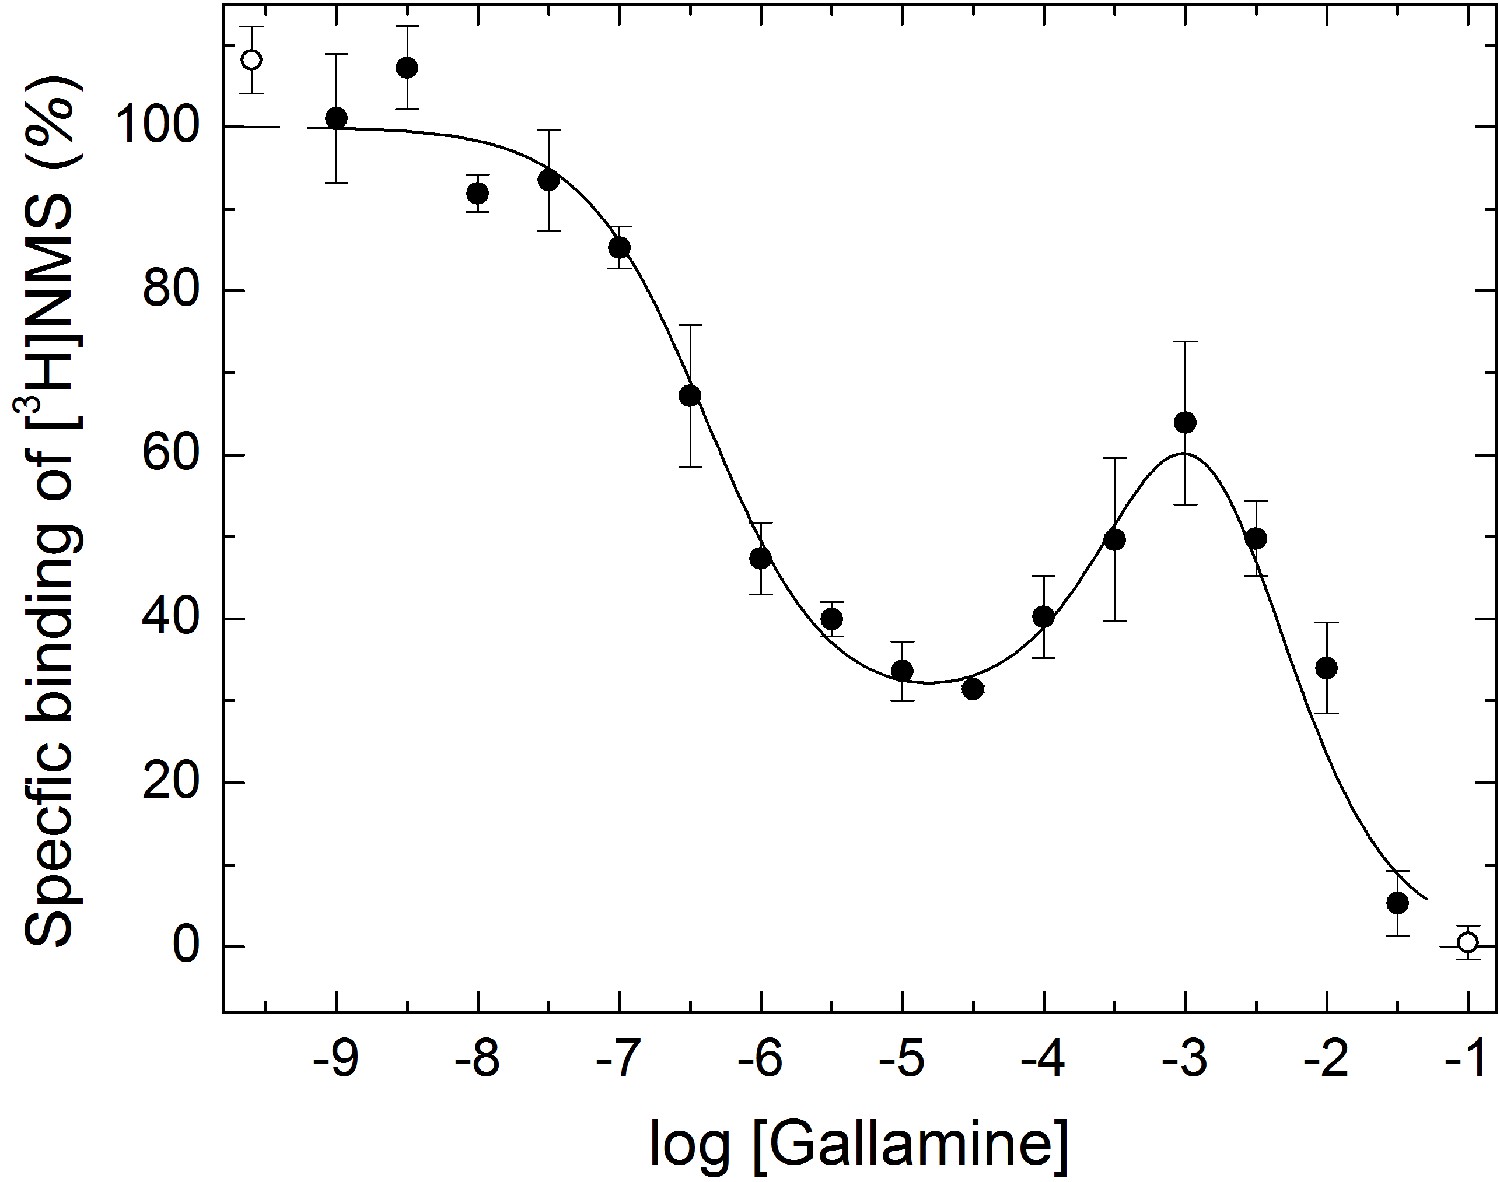
(A) Gels were loaded with samples of FLAG- and c-Myc-tagged receptor extracted from co-infected Sf9 cells (lane 1, 20–30 fmol of receptor per lane) or from the precipitate obtained upon treatment of the extract with an immobilized anti-FLAG antibody (lane 2, 15–35 fmol of receptor per lane). The amount of receptor was determined from the binding of [3H]QNB at the saturating concentration of 10 nM. Following electrophoresis and transfer, the membranes were blotted with anti-c-Myc antibody. (B) Gels were loaded with parallel samples of purified M2 receptor taken before (lane 1) and after cross-linking with BS3 (lane 2). The same amount of receptor was applied to each well (15–25 fmol). The intensities of the immunopositive bands were measured by densitometry, and the area under each densitometric trace was determined in three segments as indicated by the braces (a, 40–75 kDa; b, 75–170 kDa; c, 170–360 kDa) (Figure 1—source data 1, N = 3). The monomeric receptor migrated as a doublet (~44 kDa and 53 kDa). (C) The rate constant for the dissociation of [3H]QNB from purified monomers was measured at graded concentrations of gallamine (kobsd) and normalized to that in the absence of gallamine (k0) to obtain the relative rate constant (kobsd/k0) plotted on the y-axis. The data were analyzed in terms of Equation 2 to obtain the fitted curve shown in the figure (solid line) and the parametric values listed in Figure 1—source data 1. (D) [3H]NMS (10 nM) was mixed with gallamine at the concentrations shown on the x-axis, and binding was measured after incubation of the reaction mixture for 21 hr at 30°C. The solid line represents the best fit of Equation 2 (n = 1), and the fitted parametric values are listed in Figure 1—source data 1. The dashed lines in panels C and D are the fitted curves from similar experiments on preparations in which the M2 receptor is largely or wholly oligomeric (C, Sf9 membranes; D, Sf9 extracts) (Shivnaraine et al., 2012). (E–G) The binding of [3H]NMS (10 nM) to M2 receptors extracted from porcine sarcolemmal membranes (closed symbols) and purified as monomers from Sf9 cells (open symbols) was measured at graded concentrations of strychnine following the simultaneous addition of both ligands (E), the sequential addition of strychnine and [3H]NMS (F), and the sequential addition of [3H]NMS and strychnine (G). The binding profiles obtained following simultaneous addition were identical after incubation of the samples for 3 hr and 21 hr, and the data obtained after 21 hr are shown in the figure. Pretreatment with one ligand was followed after 2 hr by the addition of the other and further incubation for 3 hr. The temperature of incubation was 30°C throughout. The solid lines in each panel depict the best fits of Equation 2 to the data from three experiments taken in concert, and the parametric values are listed in Figure 1—source data 1.
-
Figure 1—source data 1
Panel B–Monomeric status of the purified M2 receptor after chemical cross-linking.
Panel C–Parametric values for the effect of gallamine on the rate of dissociation of [3H]QNB. Panel D–Parametric values for the effect of gallamine on the binding of [3H]NMS at equilibrium. Panels E–G–Parametric values for the effect of strychnine on the binding of [3H]NMS to oligomers and monomers.
- https://doi.org/10.7554/eLife.11685.004
-
Figure 1—source data 2
Figure 1–figure supplement 1–Parametric values for the effect of strychnine on the binding of [3H]NMS and [3H]QNB to membrane-bound M2 receptor.
- https://doi.org/10.7554/eLife.11685.005
-
Figure 1—source data 3
Figure 1-figure supplement 2–Rate constants for the simulated binding of strychnine and [3H]NMS according to Figure 6.
- https://doi.org/10.7554/eLife.11685.006
Figure 1—figure supplement 1
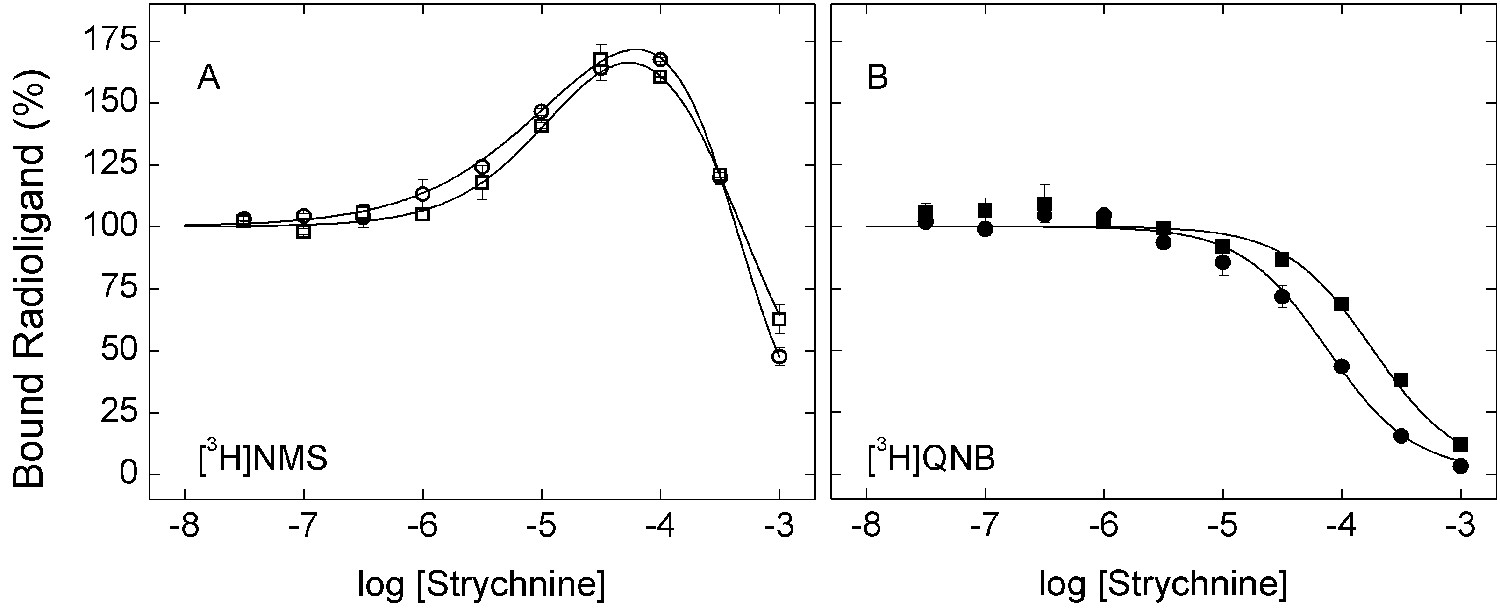
Effect of strychnine on the binding of [3H]NMS and [3H]QNB to membrane-bound M2receptor.
The binding of [3H]NMS (A) or [3H]QNB (B) to M2 receptor in membranes from CHO cells was measured at the concentrations of strychnine shown on the x-axes. Strychnine and the radioligand were added simultaneously to the receptor, and the reaction mixture was incubated for 3 hr (○, •) and 12 hr (□, ▪) at 30°C. The concentrations of [3H]NMS and [3H]QNB were 0.131 ± 0.003 nM and 0.022 ± 0.005 nM, respectively, and the corresponding affinities (KD) were 0.46 ± 0.03 nM and 0.039 ± 0.008 nM. Data from three (3 hr) or two (12 hr) experiments were analyzed simultaneously according to Equation 2, taken with two terms for [3H]NMS (n = 2) and one term for [3H]QNB (n = 1). The lines depict the best fits of the model, and the parametric values are listed in Figure 1—source data 2.
Figure 1—figure supplement 2

Simulated effect of strychnine on the binding of [3H]NMS according to Figure 6.
Total specific binding of the orthosteric ligand (RL + ARL) at graded concentrations of strychnine was simulated according to Figure 6 (Equations 13–17) with the parametric values listed in Figure 1-source data 3. The concentration of NMS was taken as equal to the dissociation constant (i.e., 10 nM). The level of binding was computed for different times after the simultaneous addition of both ligands (A), after the addition of NMS to a system pre-equilibrated with strychnine (B), and after the addition of strychnine to a system pre-equilibrated with NMS (C). The times of incubation were as follows: 5 min (a), 20 min (b), and sufficient time for the attainment of equilibrium (c).
Figure 2 with 3 supplements
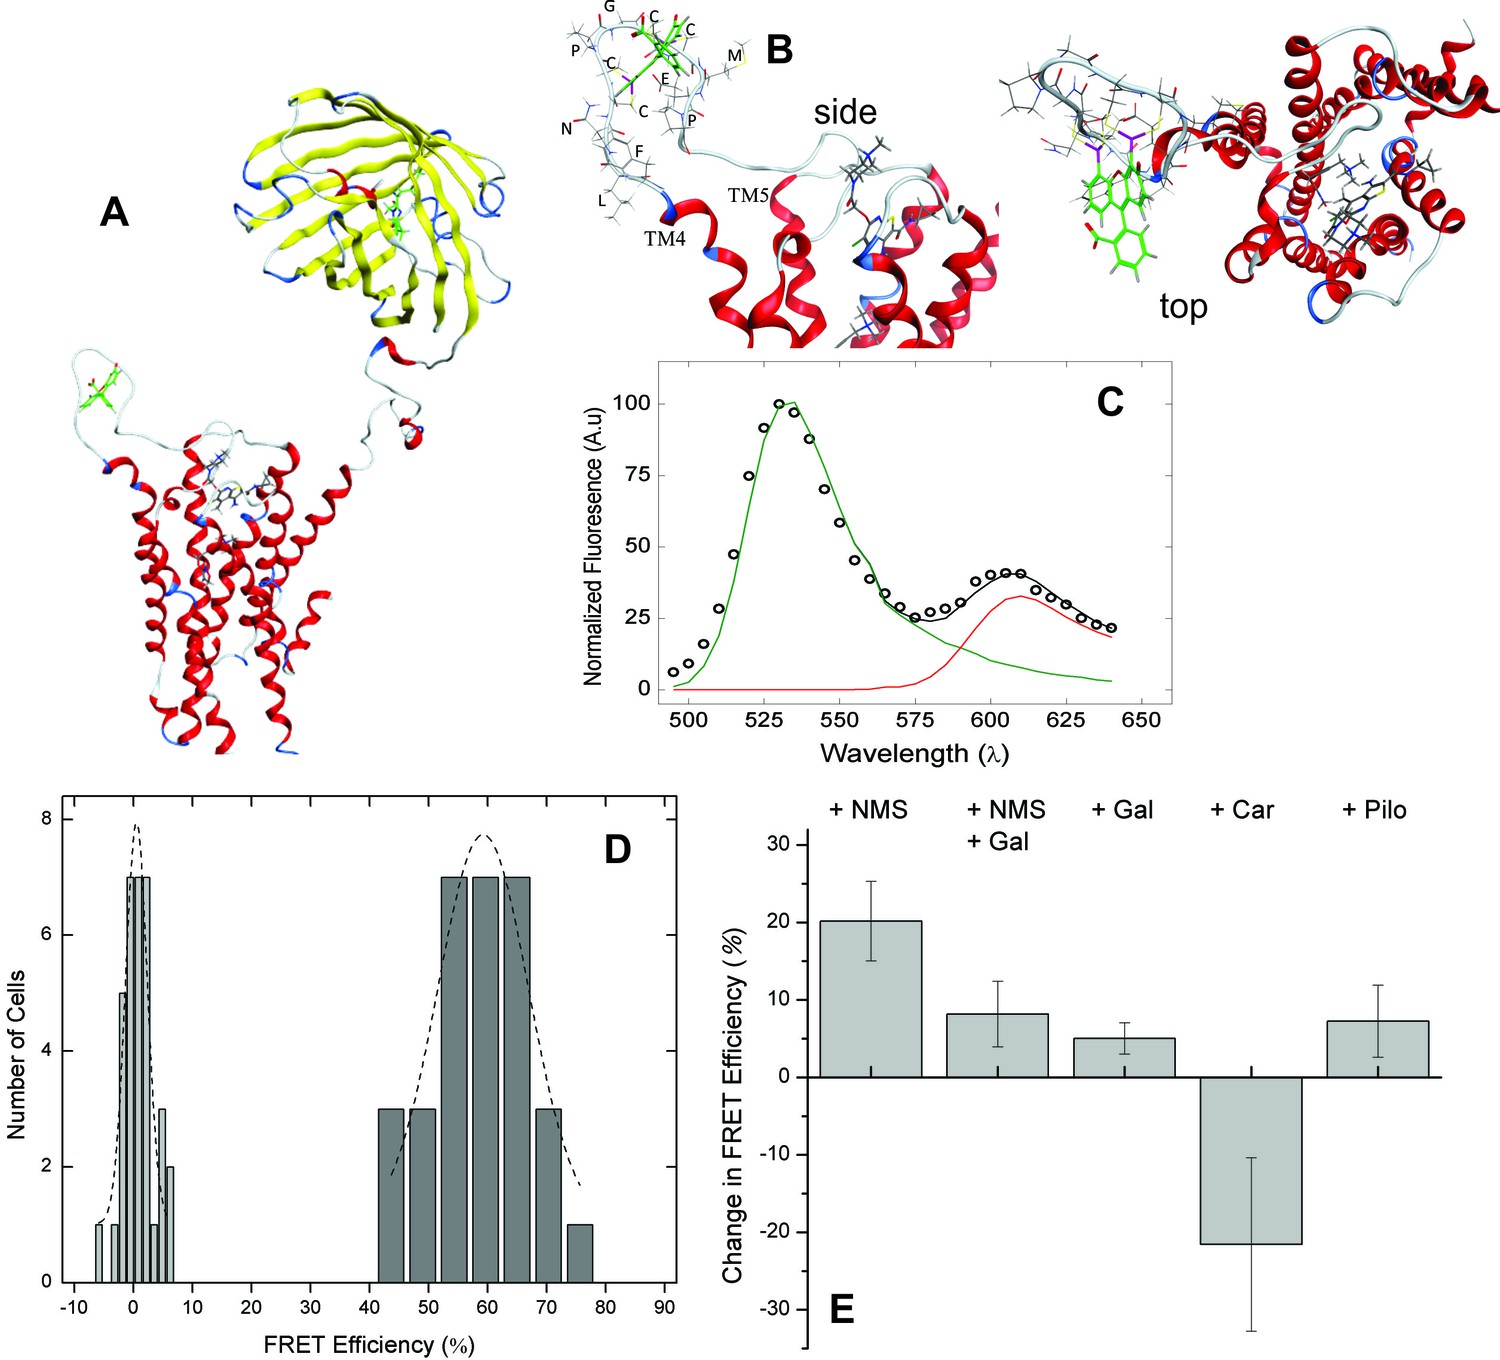
FRET-based detection of conformational change at the allosteric site.
(A) A computed molecular model of the M2 receptor (red) fused at the N-terminus to mCherry (yellow) and labeled with FlAsH (green) at a tetracysteine motif inserted in ECL2 between Val166 and Gly167. (B) Expanded views of ECL2 with the insert FCM and FlAsH. (C) M2 receptor bearing mCherry and the FlAsH-reactive insert (mCh-M2-FCM) was expressed in CHO cells and treated with FlAsH. Images were collected upon excitation at 498 nm and 0.37 µW. The emission spectrum from a single cell is shown in the figure (C). The spectrum was unmixed (Equation 10) to obtain the contributions of donor (kD, green) and acceptor (kA, red) to the fitted sum (black). (D) CHO cells expressing mCh-M2-FCM or the mCherry-tagged wild-type M2 receptor (mCh-M2) were treated with FlAsH and excited at 498 nm. The FRET efficiencies (Eapp) calculated for individual cells are shown as histograms, and the dashed lines depict the best fits of the Gaussian distribution (dark grey bars, mCh-M2-FCM, 31 cells, μ = 59.2 ± 1.2, σ = 7.7 ± 3.0; light grey bars, mCh-M2, 34 cells, μ = 0.50 ± 0.35, σ = 1.8 ± 0.5. (E) mCh-M2-FCM was expressed in CHO cells and reacted with FlAsH, and the value of Eapp was measured before and after addition of the inverse agonist NMS (1 µM, N = 26), the allosteric modulator gallamine (Gal, 10 mM, N = 42), NMS (1 µM) plus gallamine (10 mM, N = 18), the agonist carbachol (Car, 1 mM, N = 19), and the partial agonist pilocarpine (Pilo, 1 mM, N = 19). The ligand-dependent changes in Eapp are plotted in the figure (i.e., ∆Eapp ± S.D.), and the values are listed and compared in Figure 2—source data 1. The mean value of Eapp for cells in the absence of ligand was 60 ± 8% (N = 26).
-
Figure 2—source data 1
Panel A–Time-resolved fluorescence and fluorescence anistoropy of eGFP and eGFP-tagged M2 receptors.
Panel E–Levels of significance for ligand-dependent changes in the FRET efficiency of FlAsH-reacted mCh-M2-FCM.
- https://doi.org/10.7554/eLife.11685.010
Figure 2—figure supplement 1
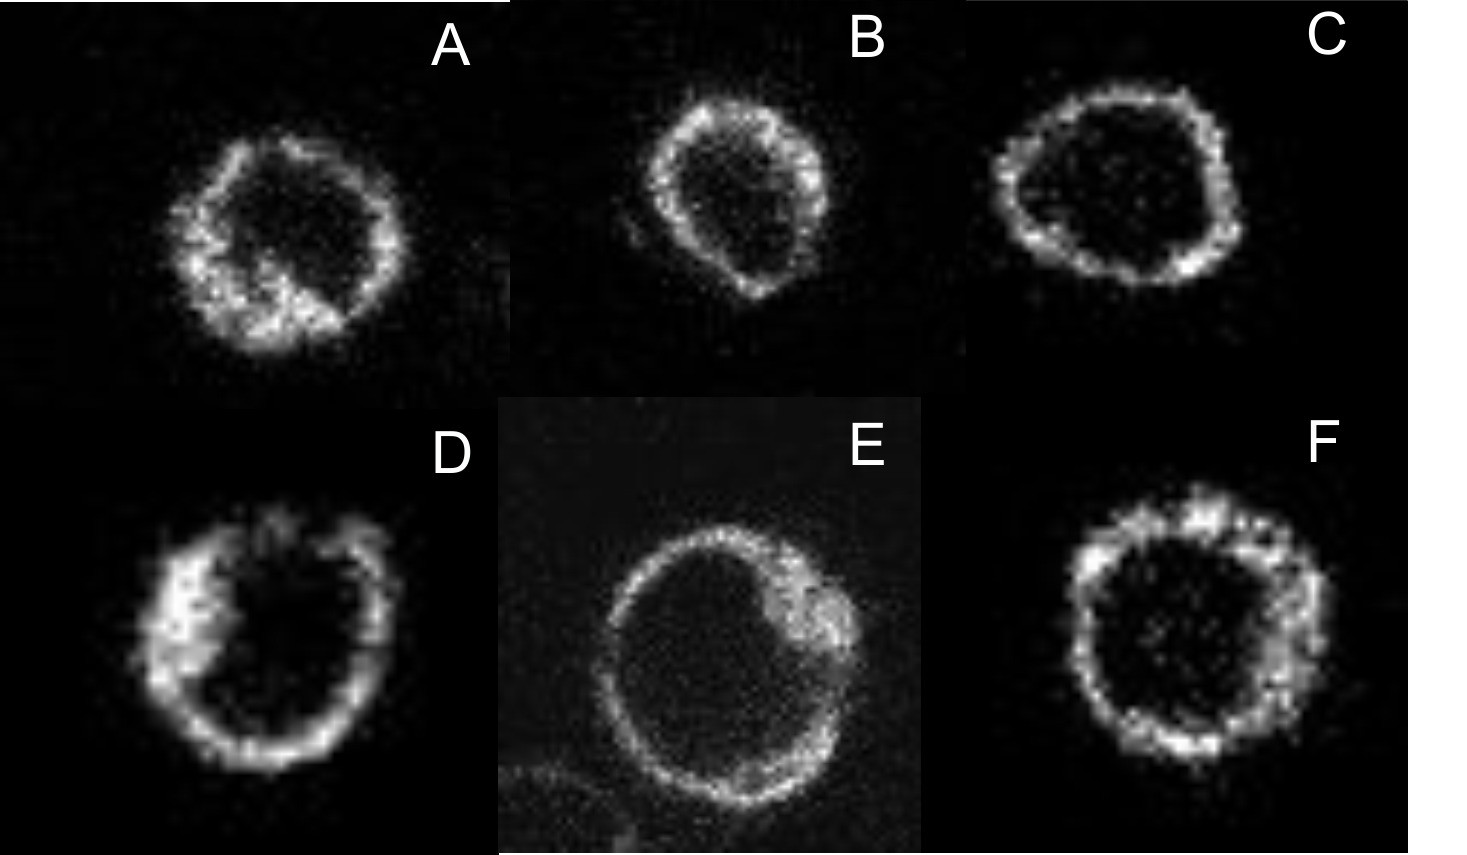
Expression and localization of fluorophore-tagged M2 receptors.
CHO cells were transfected with plasmids coding for mCh-M2-FCM (A), mCh-M2(D103A)-FCM (B), M2-FCM (C), eGFP-M2 (D), mCh-M2 (E), and eGFP-M2-mCh (F). Images were recorded on a confocal microscope, as described in Materials and methods, and those shown in the figure were obtained at the middle of the cell in the Z-plane. Cells were labelled with FlAsH and excited at 488 nm to obtain the images in A–C. eGFP was excited at 488 nm to obtain the image in D, and mCh was excited at 561 nm to obtain the images in E and F.
Figure 2—figure supplement 2
Modulatory effect of gallamine on the binding of [3H]NMS to mCh-M2-FCM.
Membranes were prepared from CHO cells expressing M2 receptor bearing mCherry at the N-terminus and the FlAsH-reactive sequence FCM in the second extracellular loop. The binding of [3H]NMS was measured at the concentrations of gallamine (M) shown on the x-axis. Both ligands were added simultaneously, and the reaction mixture was incubated for 16 hr at 25ºC. The line depicts the best fit of Equation 2 to all of the data taken in concert. The values of log Kj were common to all of the data, and the fitted estimates are as follows: log K1 = −6.39 ± 0.10, log K2 = −3.15 ± 0.63, log K3 = −2.60 ± 0.59. The values of nH(j) were indistinguishable from 1, either individually or collectively (p≥0.13), and were fixed accordingly. The mean concentration of [3H]NMS was 3.08 ± 0.05 nM. Points at the left- and right-hand ends of the abscissa (F) depict binding in the absence of unlabeled ligand and in the presence of 3 μM atropine.
Figure 2—figure supplement 3

FRET between eGFP fused at the N-terminus and mCherry inserted after Val166.
CHO cells expressing the eGFP- and mCherry-tagged M2 receptor were excited at 473 nm at a power of 0.37 µW. The emission spectrum was recorded from the region of the plasma membrane and analyzed to obtain the apparent FRET efficiency. (A) The distribution of FRET efficiencies from 33 cells. The dotted line depicts the best fit of a Gaussian distribution (μ = 9.51, σ = 0.11). (B) The mean FRET efficiency (± S.D.) measured in the absence of ligand, in the presence of NMS (1 µM) (9.1 ± 1.6, 20 cells), or in the presence NMS (1 µM) plus gallamine (1 mM) (9.7 ± 1.0, 18 cells)
Figure 3 with 1 supplement
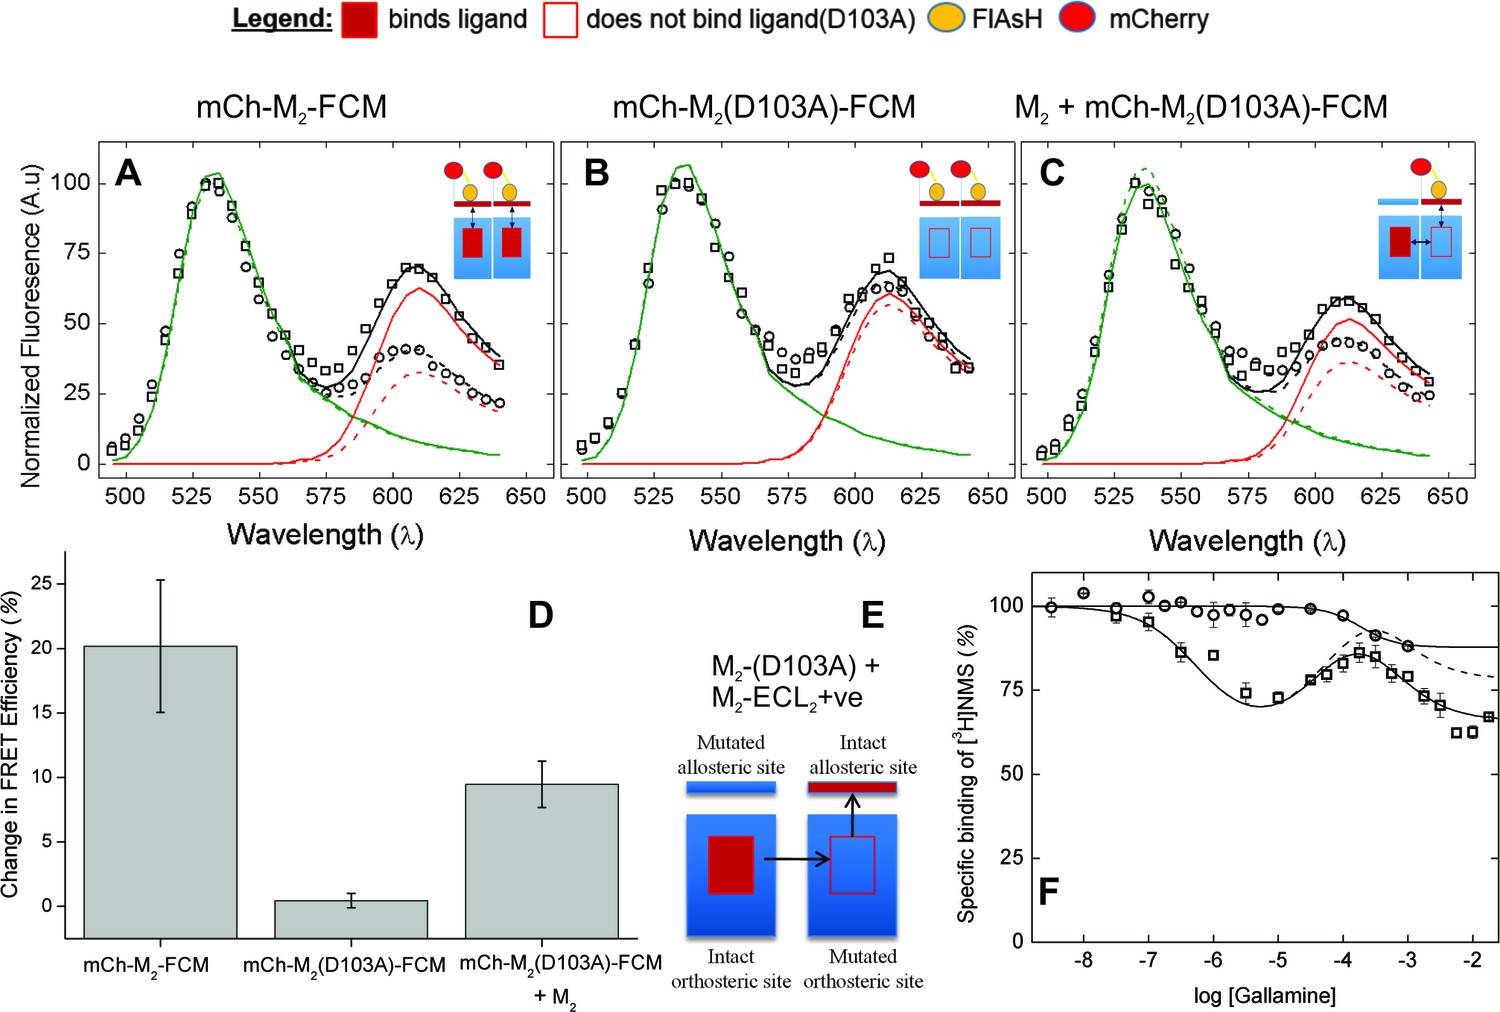
The nature of high-affinity allosteric interactions.
The sensor (mCh-M2-FCM) (A), a mutant thereof that does not bind NMS [mCh-M2(D103A)-FCM] (B), and the mutant plus the wild-type M2 receptor (C) were expressed or co-expressed in CHO cells and reacted with FlAsH. The cultures were irradiated before (– – ◯ – –) and after (— □ —) the addition of NMS (1 μM), and the emission spectra from individual cells were unmixed to determine the contribution of each component (kD and kA, Equation 10) and the corresponding FRET efficiency (Eapp, Equation 12). (D) Ligand-dependent changes in the FRET efficiency (ΔEapp) were averaged over 18–42 cells transfected as described for panels A–C, and the means (± S.D.) are plotted in the figure. The values are listed and compared in Figure 3—source data 1. The value for mCh-M2-FCM is replotted from Figure 2F. (E) A depiction of intermolecular cooperativity within a hetero-oligomer of the M2 receptor in which binding is precluded at the orthosteric site of one mutant (M2-D103A) and the allosteric site of another (M2-ECL2+ve). (F) CHO cells expressing M2-ECL2+ve alone (○) or together with M2-D103A (□) were solubilized in digitonin–cholate, and hetero-oligomers were purified as described in the text. Aliquots of each sample were added to solutions of [3H]NMS (10 nM) and gallamine at the concentrations shown on the x-axis, and binding was measured after incubation of the mixture for 21 hr at 30°C. The solid lines represent the best fits of Equation 2 to the combined data from 3 experiments, and the parametric values are as follows: ○, n = 1, log K = −3.46 ± 0.16; □, n = 3, log K1 = 6.25 ± 0.16, log K2 = 4.29 ± 0.37, log K3 = 3.31 ± 0.29. All values of nH(j) were indistinguishable 1 and fixed accordingly (p≥0.06). The broken line is the difference between the fitted curves for M2-ECL2+ve and the copurified heteromer. [3H]NMS bound to detergent-solubilized M2-ECL2+ve with an affinity of 5.5 nM (Equation 3, log K = −8.26 ± 0.10, nH = 1, N = 3).
-
Figure 3—source data 1
Panel D–Levels of significance for ligand-dependent changes in the FRET efficiency of FlAsH-reacted mCh-M2-FCM and mCh-M2(D103A)-FCM
- https://doi.org/10.7554/eLife.11685.015
Figure 3—figure supplement 1

Coexpression of the M2 receptor and a non-binding sensor.
(A) CHO cells were cotransfected with the plasmids coding for eGFP-M2 and mCh-M2(D103A)-FCM. The cells were treated with FlAsh, and those expressing both receptors were identified by the presence of both eGFP and mCherry. (B, C) The emission was recorded in absence of ligand (B) and in the presence of NMS (1 μM) (C), and the spectra were unmixed according to Equation 11 to obtain the contribution of each fluorophore. The circles are the measured spectrum, and the solid lines are the best fits of Equation 11. The dashed lines depict the constituent spectra as follows: eGFP, blue; FlAsH, green; mCherry, red. The FRET efficiency between FlAsH and mCherry was computed from the unmixed contributions according to Equation 12.
Figure 4 with 1 supplement
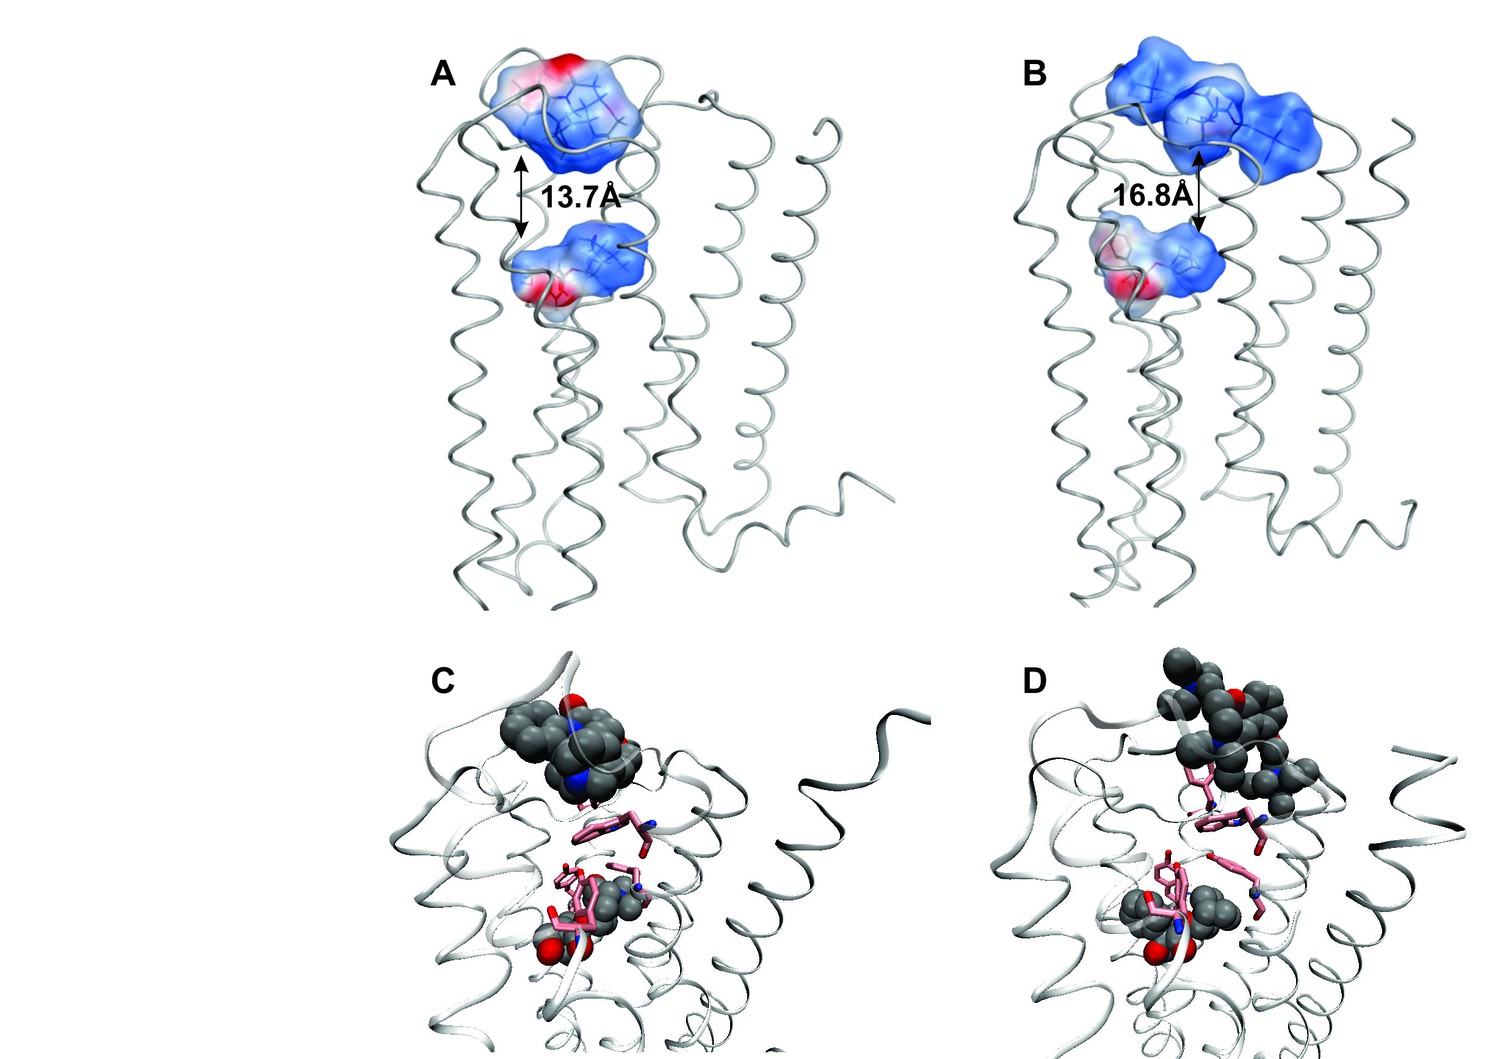
Intramolecular interactions between orthosteric and allosteric ligands.
Models of the liganded receptor were simulated by molecular dynamics as described in Materials and Methods. The region of the ligand-binding sites is shown in the figure, with NMS and strychnine (A, C) or with QNB and gallamine (B, D) at the ortho- and allosteric sites, respectively. (A, B) The electrostatic potential of each ligand is displayed on a molecular surface within 4.5 Å of the constituent atoms (positive potential, blue; negative potential, red). The values and corresponding arrows are the distances between the centers of the cationic ammonium groups of the orthosteric and allosteric ligands. The closest such group is shown in the case of gallamine. (C, D) The bound ligands are shown together with residues involved in receptor-ligand interactions.
Figure 4—figure supplement 1
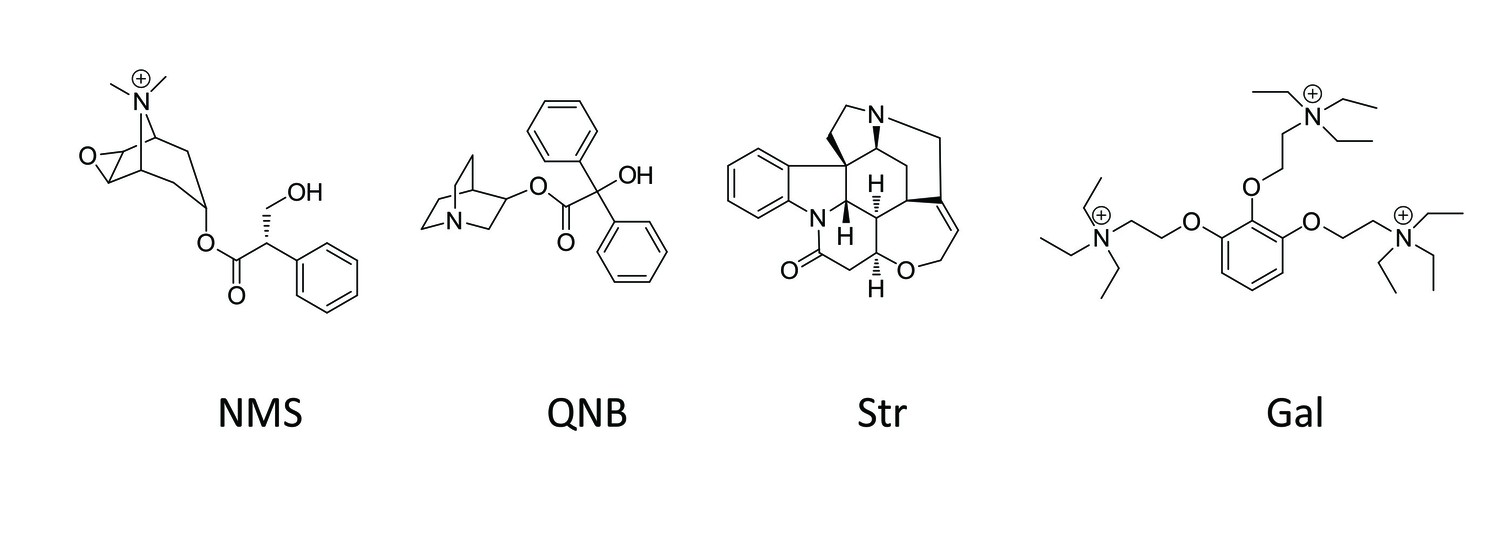
Chemical structures of allosteric and orthosteric ligands to the M2 muscarinic receptor.
The ligands shown are: NMS, N-methylscopolamine; QNB, quinuclidinylbenzilate; Str, strychnine; and Gal, gallamine. Different liganded states of the receptor are identified as X_R_Y, where X and Y are the allosteric and orthosteric ligands, respectively. Occupancy is represented as O for a vacant site or as Str, Gal, NMS, or QNB for a ligand-occupied site.
Figure 5 with 3 supplements
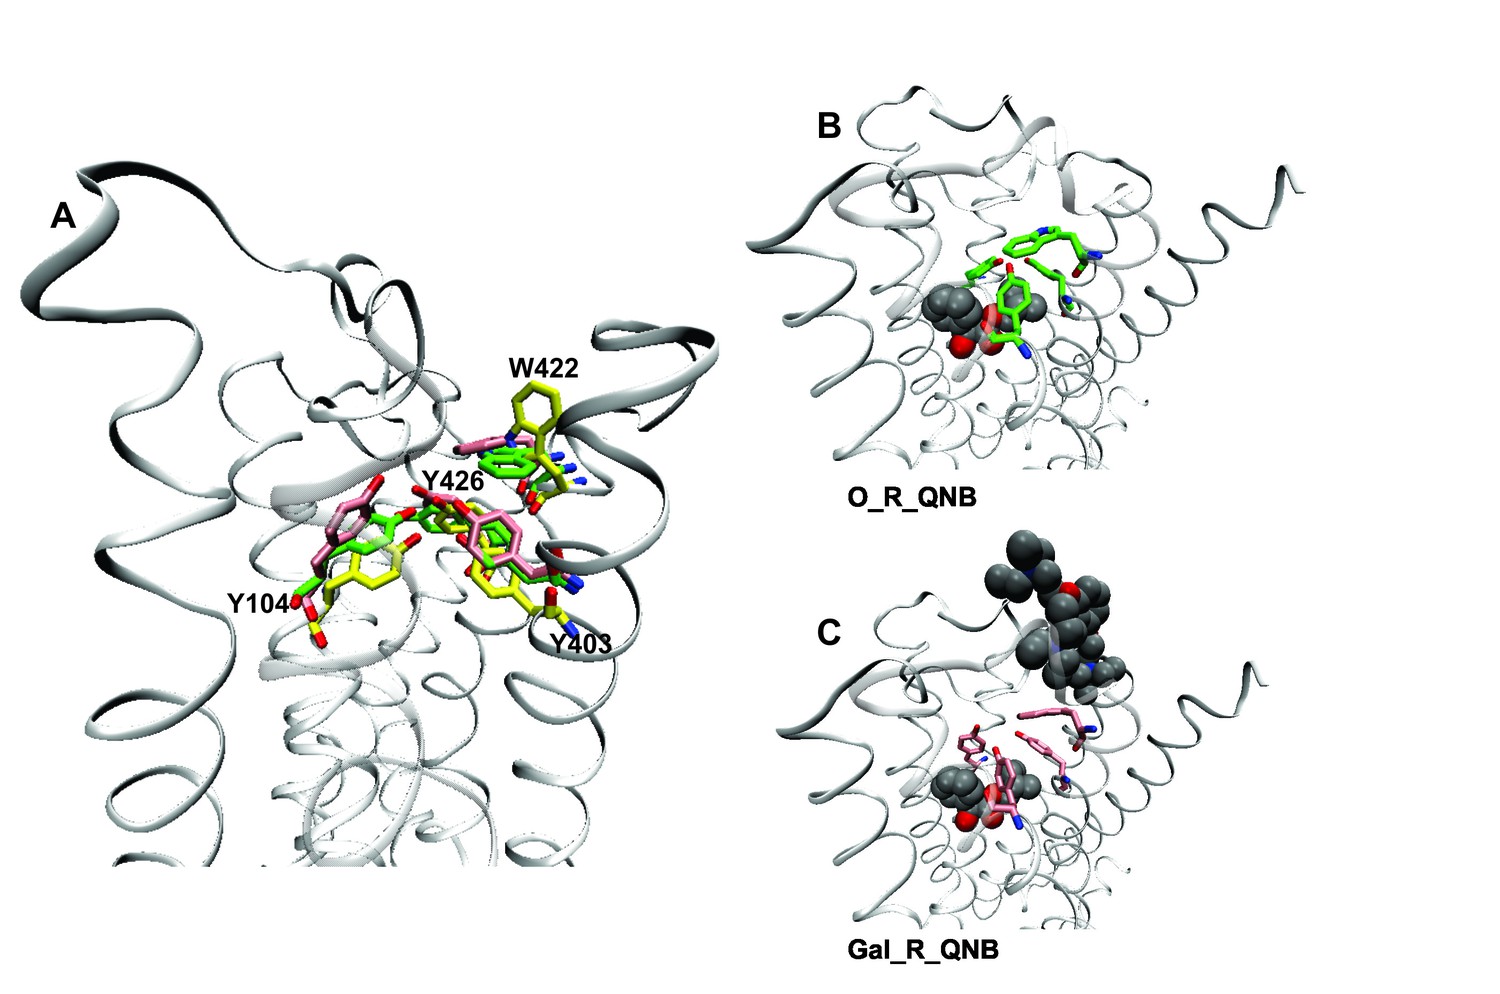
Effects of orthosteric and allsteric ligands on the aromatic cap and Trp422.
(A) The three residues of the aromatic cap (i.e., Tyr104, Tyr403, and Tyr426) and Trp422 are shown in an overlay of the results of three simulations: a vacant receptor (yellow), a QNB-bound receptor (green), and a receptor occupied by both QNB and gallamine (pink). The ligands are not shown. (B) The receptor with QNB at the orthosteric site. (C) The receptor with QNB at the orthosteric site and gallamine at the allosteric site. Here and elsewhere, different liganded states of the receptor are identified as X_R_Y, where X and Y are the allosteric and orthosteric ligands, respectively. Occupancy is represented as O for a vacant site or as Str (strychnine), Gal (gallamine), NMS, or QNB for a ligand-occupied site.
-
Figure 5—source data 1
Figure 5–figure supplement 2–Distance between the α-carbon atoms of Tyr177 and Asn419 in crystal structures of the M2 receptor
- https://doi.org/10.7554/eLife.11685.021
-
Figure 5—source data 2
Figure 5–figure supplement 3–Mean distances (Å) between the α-carbon atoms of Tyr177 and Asn419 in the M2 receptor with different combinations of allosteric and orthosteric ligands
- https://doi.org/10.7554/eLife.11685.022
Figure 5—figure supplement 1
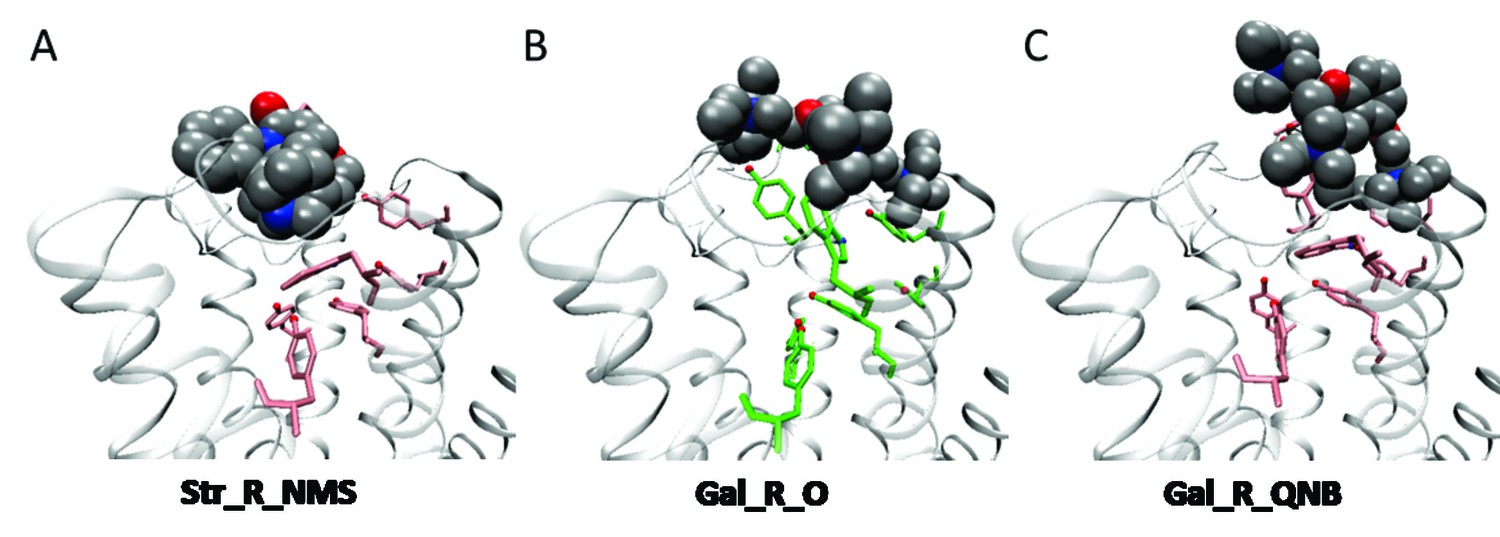
Orientation of ligands at the orthosteric site.
Strychnine adopts a similar pose at the vacant receptor and in the presence of either NMS (A) or QNB at the orthosteric site. The position of gallamine at a vacant receptor (B) is consistent throughout the simulation. At a QNB-bound receptor (C), gallamine is pushed outward, and its orientation is more variable. The orthosteric ligands are not shown in (A) and (C).
Figure 5—figure supplement 2
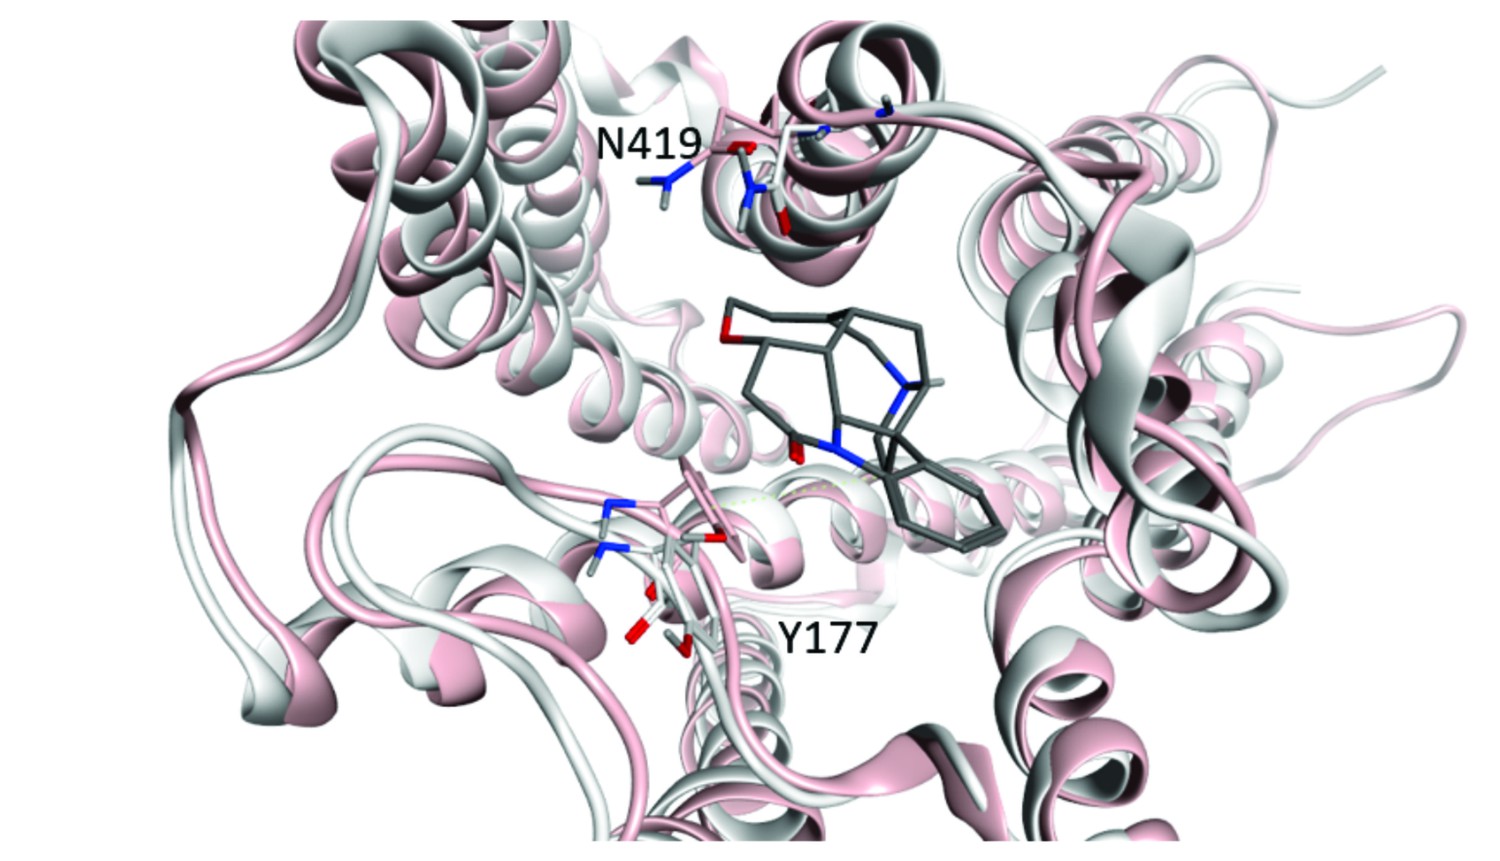
Width of the vestibule to the orthosteric site.
Changes in the distance between the α-carbon atoms of Tyr177 and Asn419 were taken as a measure of the effect of an orthosteric ligand on the conformation of the allosteric site. The structures of the receptor with QNB (3UON, white) and iperoxo (4MQS, pink) at the orthosteric site are superimposed, and the allosteric site is shown as occupied by strychnine. The perspective is toward the extracellular surface of the receptor.
Figure 5—figure supplement 3
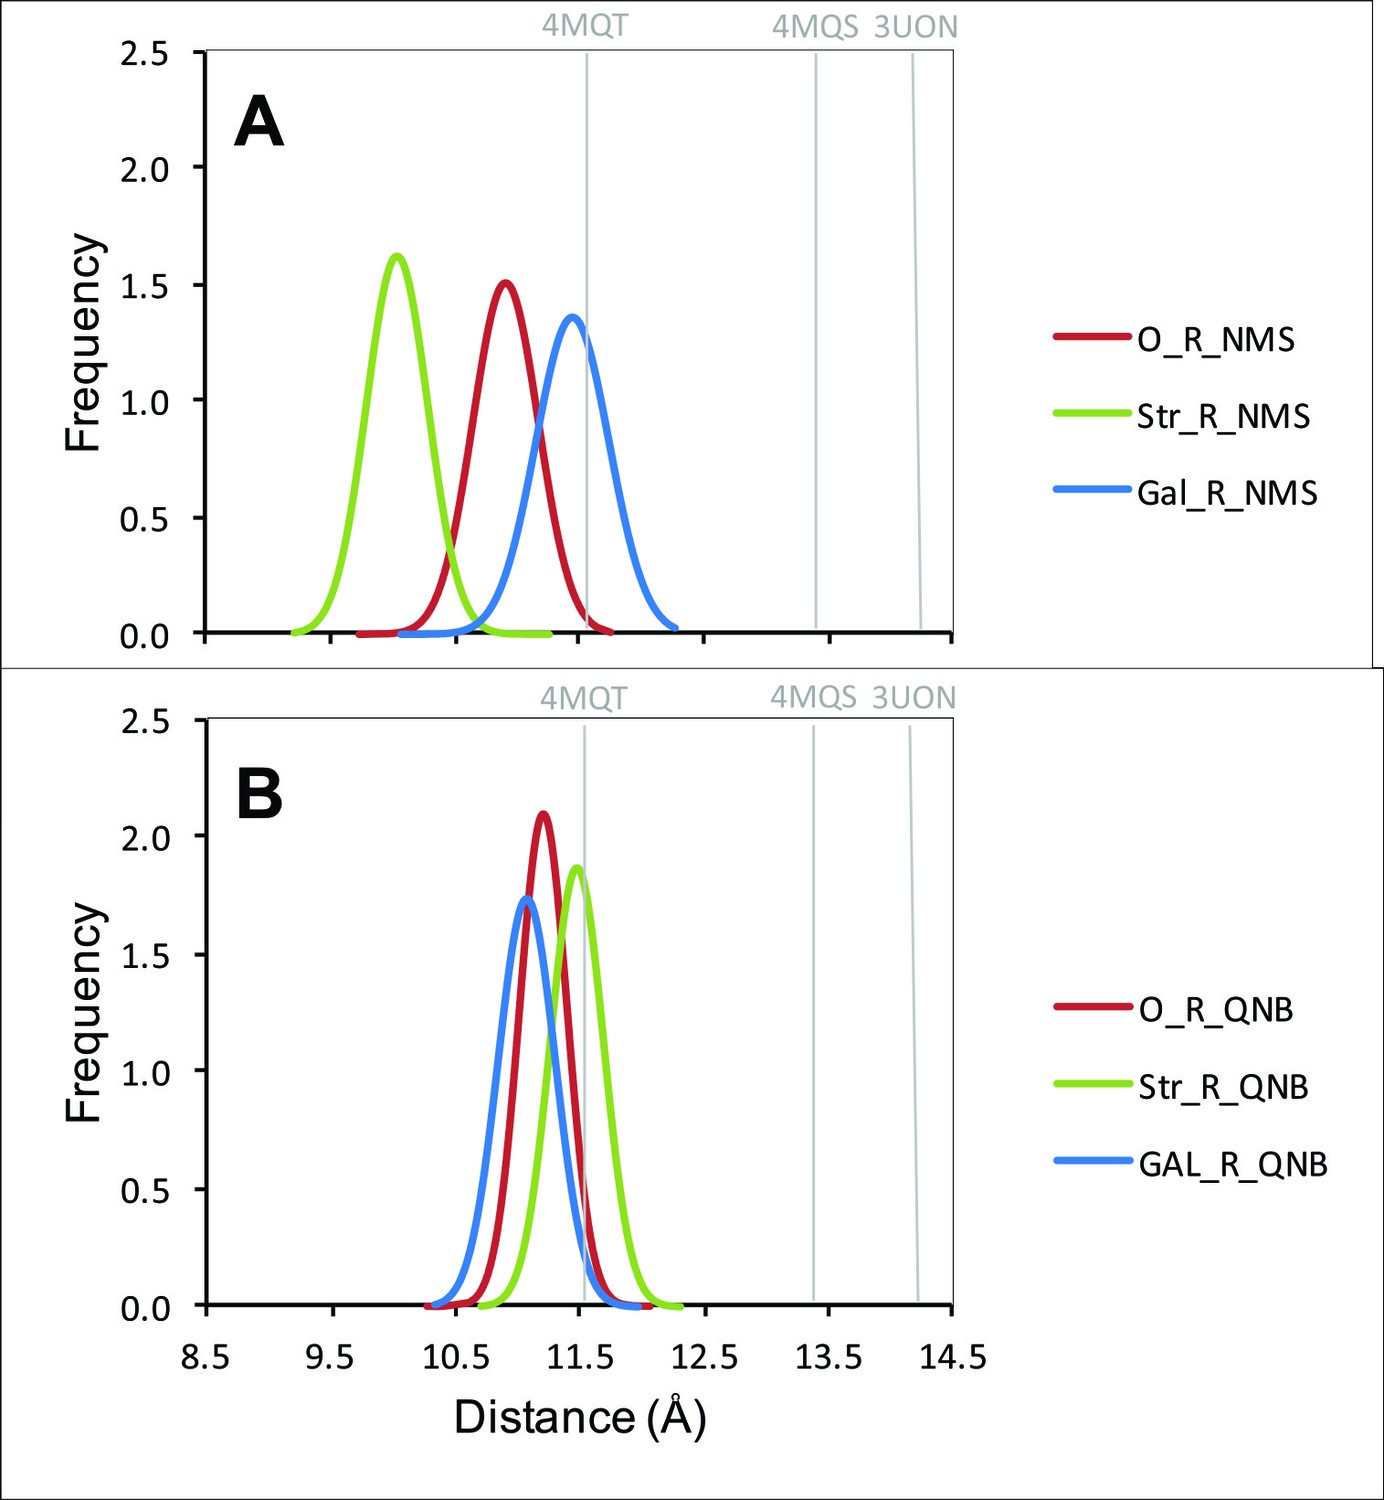
Distribution of distances between the α-carbon atoms of Tyr177 and Asn419.
The distances from all frames of the molecular dynamics simulations over the production period of 30 ns are shown in the figure for a receptor with NMS (A) or QNB (B) at the orthosteric site. In each case, the allosteric site was vacant (red), occupied by strychnine (green), or occupied by gallamine (blue).
Figure 6
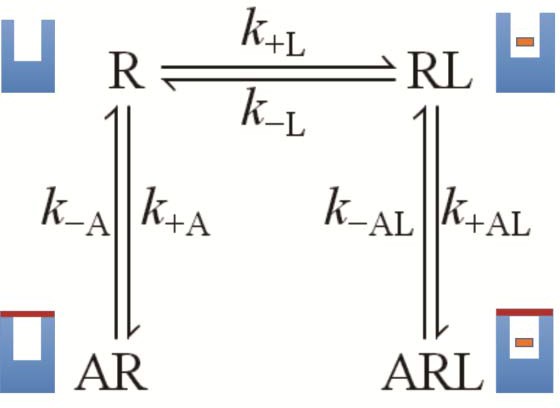
A receptor (R) binds an orthosteric ligand (L) and an allosteric ligand (A) to form a ternary complex (ARL).
Each ligand can bind separately to form AR or RL, but the ternary complex is accessible only via RL. The orthosteric site of the M2 receptor is located within the cluster of helical domains, with access via a vestibule that forms the allosteric site. Occupancy of the latter by an allosteric ligand precludes association and dissociation of the orthosteric ligand. The parameters k−L and k+L are the first- and second-order rate constants for the binding of L to R; similarly, k−A and k+A are the first- and second-order rate constants for the binding of A to R. The parameters k−AL and k+AL are the rate constants for the binding of A to RL.
Tables
Table 1
Correlates of electrostatic repulsion between orthosteric and allosteric ligands. The inter-cationic distance was calculated as that between the cationic nitrogen atom of the orthosteric ligand and the closest cationic nitrogen atom of the allosteric ligand. The difference in electrostatic potential was calculated as the increase in electrostatic energy of an allosteric modulator at a receptor with a vacant orthosteric site over that of the same modulator at a receptor with NMS or QNB at the orthosteric site.
| Allosteric–orthosteric pair | ||||
|---|---|---|---|---|
| Str_R_NMSa | Str_R_QNB | Gal_R_NMS | Gal_R_QNBa | |
| Inter-cationic distance (Å) | 13.7 | 15.7 | 16.5 | 16.8 |
| Difference in electrostatic potential (kcal/mol) | 0.0085 | 0.063 | 0.096 | 0.41 |
-
a The distances are shown in Figures 4A and B.
Additional files
-
Source code 1
Analysis of binding.
- https://doi.org/10.7554/eLife.11685.027
-
Source code 2
Calculation of FRET by spectral unmixing.
- https://doi.org/10.7554/eLife.11685.028
-
Source code 3
Simulation of the capped allosteric ternary complex model.
- https://doi.org/10.7554/eLife.11685.029
Download links
A two-part list of links to download the article, or parts of the article, in various formats.
Downloads (link to download the article as PDF)
Open citations (links to open the citations from this article in various online reference manager services)
Cite this article (links to download the citations from this article in formats compatible with various reference manager tools)
Allosteric modulation in monomers and oligomers of a G protein-coupled receptor
eLife 5:e11685.
https://doi.org/10.7554/eLife.11685


