Structural basis of death domain signaling in the p75 neurotrophin receptor
- National University of Singapore, Singapore
- Karolinska Institute, Sweden
Figures
Figure 1 with 2 supplements
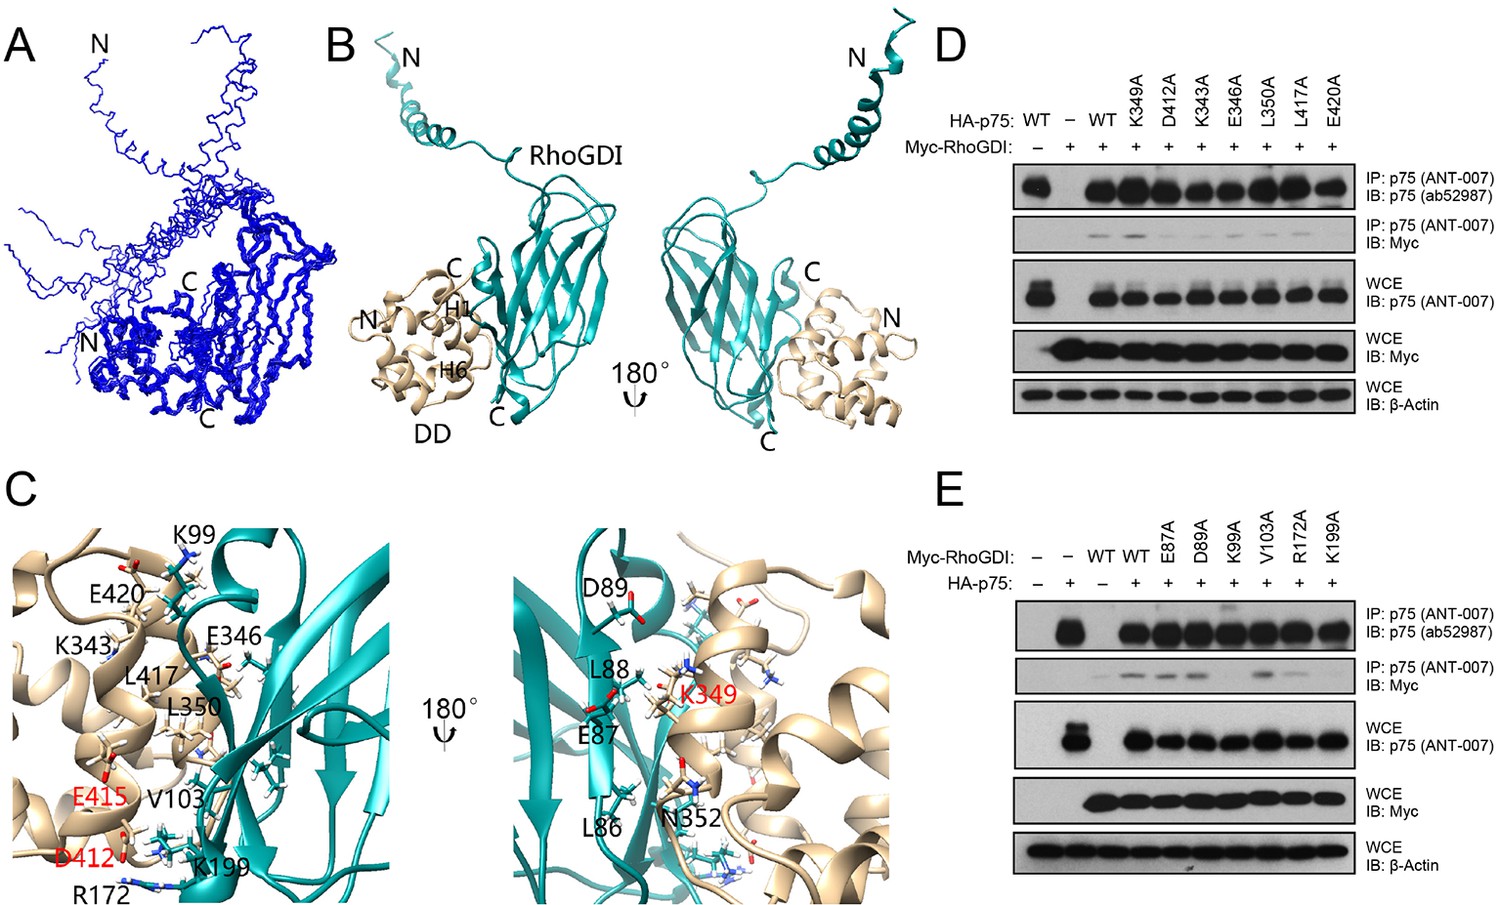
Solution structure of the complex between the p75NTR DD and RhoGDI.
(A) Superposition of backbone heavy atoms of the 10 lowest-energy structures of the human p75NTR DD:RhoGDI complex. N- and C-termini are indicated. (B) Ribbon drawing of the lowest-energy conformer. Light brown, p75NTR DD; Cyan, RhoGDI. N- and C-termini, as well as DD helices H1 and H6 are indicated. (C) Details of binding interface in the complex viewed in the same orientations as panel B, respectively. Key residues at the binding interface are labeled and depicted as stick models. Red labels denote interface residues functionally validated in our earlier mutagenesis study (Charalampopoulos et al., 2012). (D) Co-immunoprecipitation of wild type (WT) and DD point mutants of human p75NTR with Myc-tagged RhoGDI in transfected HEK 293 cells. Antibodies used for immunoprecipitation (IP) and Western blotting (WB) are indicated. WCE, whole cell lysate. The immunoblots shown are representative of three independent experiments. (E) Co-immunoprecipitation of WT and point mutants of Myc-tagged human RhoGDI with p75NTR in transfected HEK 293 cells. Antibodies used for immunoprecipitation (IP) and Western blotting (WB) are indicated. WCE, whole cell extract. The immunoblots shown are representative of three independent experiments.
Figure 1—figure supplement 1
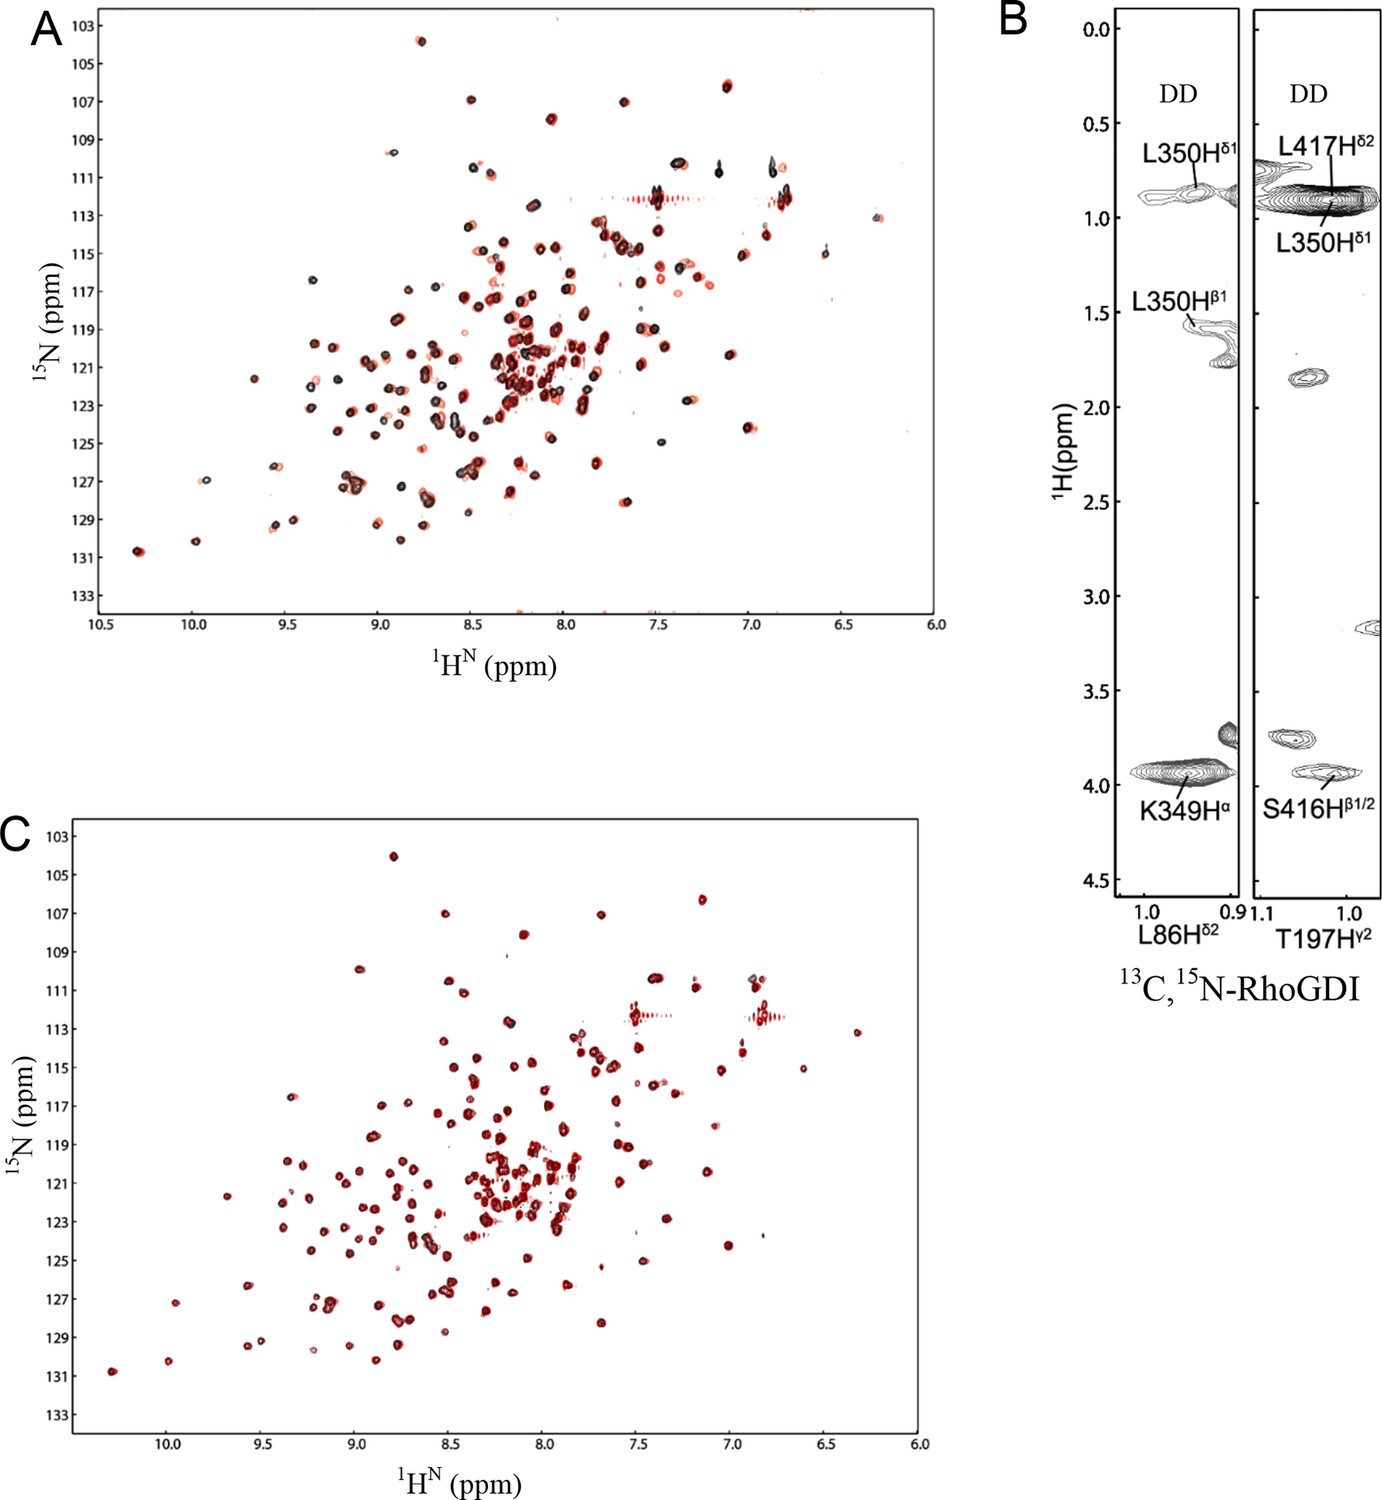
NMR spectra of DD:RhoGDI complex in 20 mM HEPES at 28°C and pH 6.9.
(A) [1H-15N] HSQC spectra of 15N-RhoGDI in the absence (black) and presence (red) of p75NTR DD. The concentration of RhoGDI and p75NTR DD was 0.5 and 2 mM, respectively. (B) Representative slices from the 13C,15N-filtered 3D NOESY spectrum. (C) [1H-15N] HSQC spectra of 15N-RhoGDI in complex with p75NTR DD in the absence (black) and presence (red) of 250 mM NaCl.
Figure 1—figure supplement 2
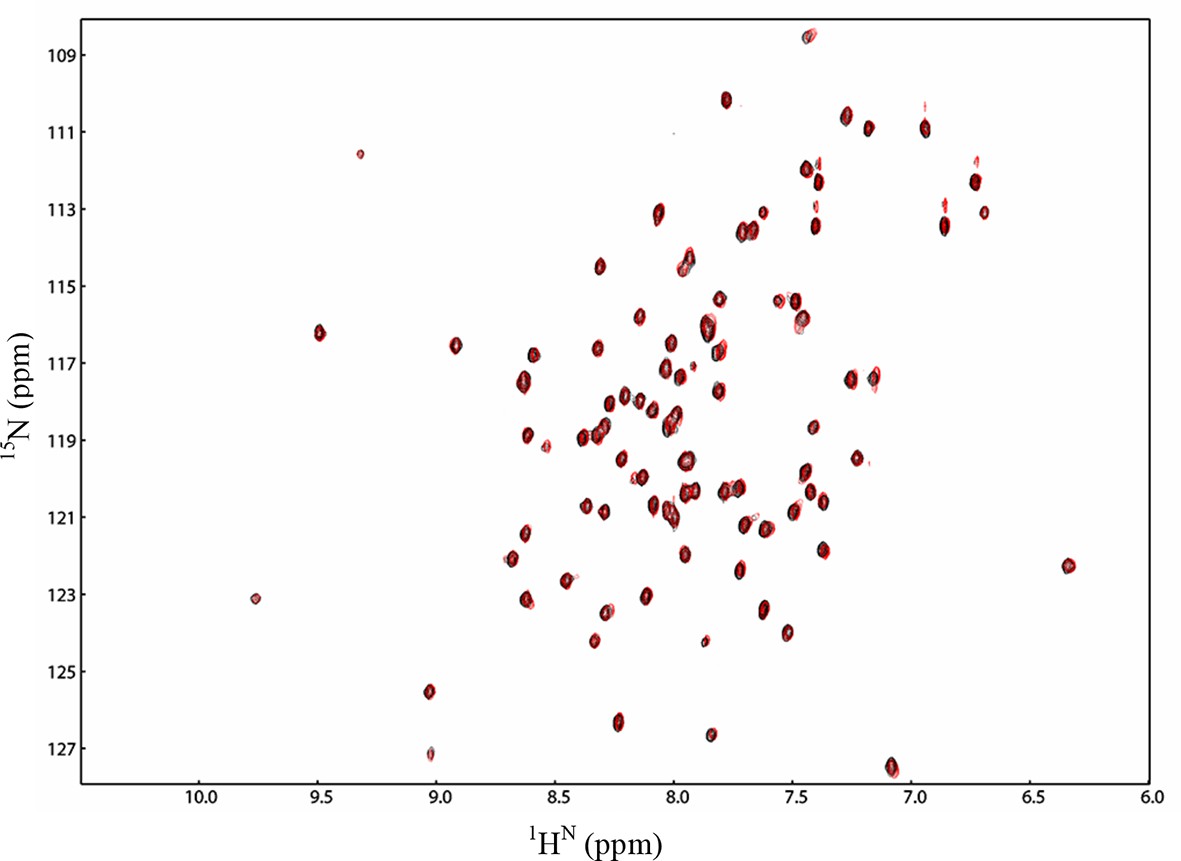
The N-terminal domain of RhoGDI does not bind to p75NTR DD.
[1H-15N] HSQC spectra of p75NTR DD in the presence of RhoGDI (black) and RhoGDI without N-terminal domain (RhoGDI ΔN, red) at 28°C and pH 6.9. Molar ratio of DD to RhoGDI or to RhoGDI ΔN was 1:4.
Figure 2 with 1 supplement
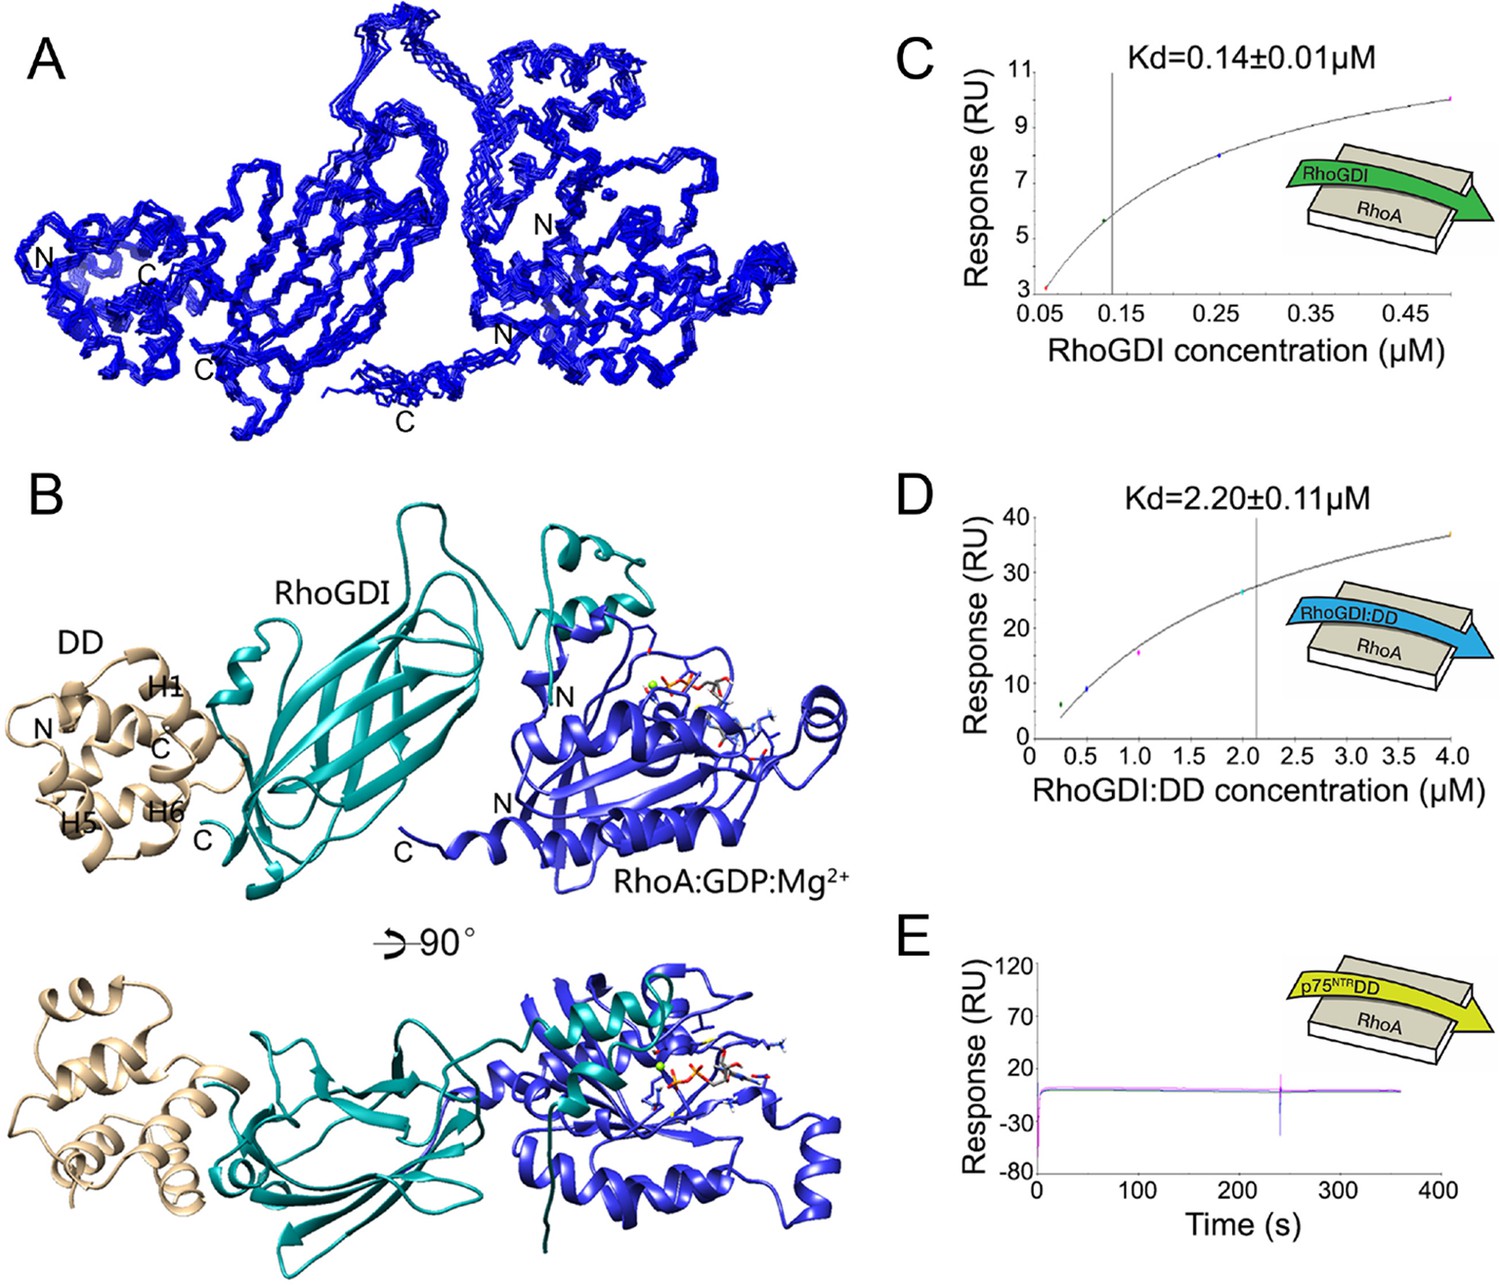
Structural model of tripartite complex between p75NTR death domain, RhoGDI and RhoA.
(A) Superposition of backbone traces of the 10 lowest-energy structures of p75NTR DD:RhoGDI:RhoA tripartite complex. N- and C-termini are indicated. (B) Ribbon diagram of a representative structure of p75NTR DD:RhoGDI:RhoA heterotrimer complex. Light brown, p75NTR DD; Cyan, RhoGDI; Blue, RhoA. Mg2+ and GDP appear in ball-and-stick models. p75NTR DD helices H1, H5 and H6 as well as N- and C-termini are indicated. (C) Binding of RhoGDI to immobilized RhoA:GDP:Mg2+ measured by surface plasmon resonance (SPR). Binding affinity was determined by steady-state analysis. One binding site model was used for fitting of SPR data. The sensorgram shown is representative from three independent experiments. (D) Binding of RhoGDI complexed with p75NTR DD (molar ratio 1:2) to immobilized RhoA:GDP:Mg2+ measured by SPR. Binding affinity was determined by steady-state analysis. One binding site model was used for fitting of SPR data. The sensorgram shown is representative from three independent experiments. (E) Sensorgram showing lack of interaction between p75NTR DD (tested at 125–500 nM) and immobilized RhoA:GDP:Mg2+. The sensorgram shown is representative from three independent experiments.
Figure 2—figure supplement 1
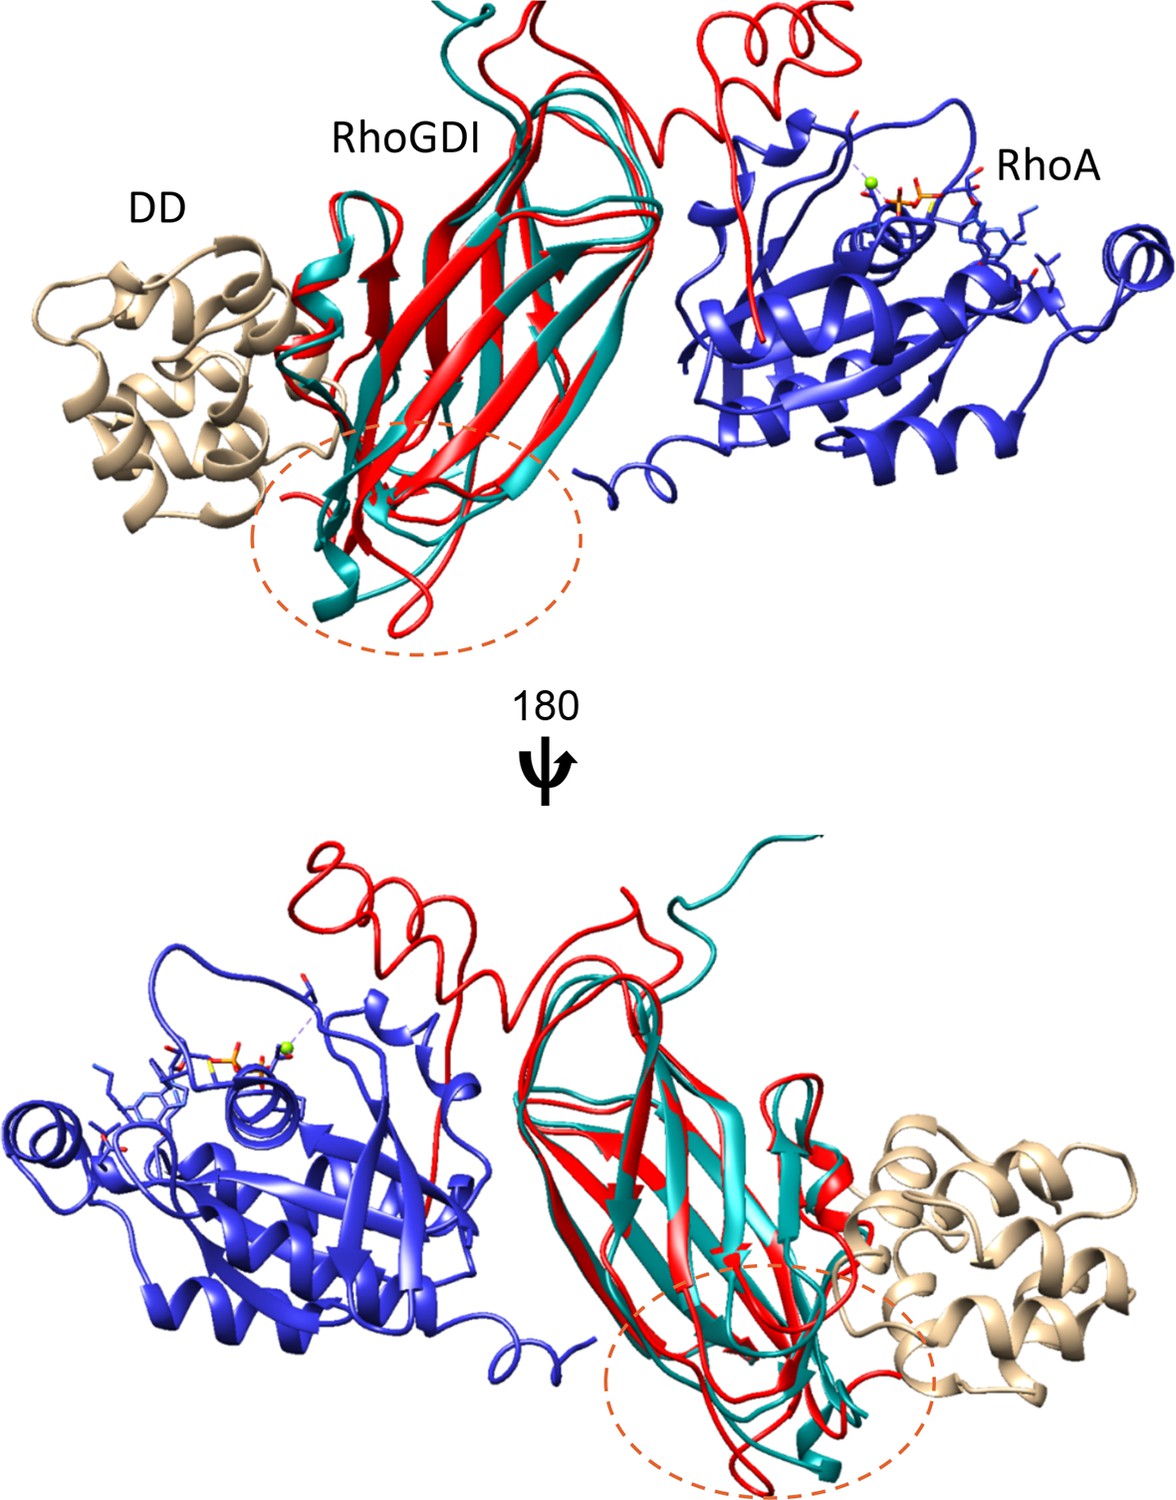
Local structural differences in RhoGDI after interaction with either p75NTR DD or RhoA:GDP.
Ribbon diagram of RhoGDI from the complex with p75NTR DD (light brown) is shown in cyan, and from the complex with RhoA (blue) in red (from Longenecker et al., 1999). Main structural differences in RhoGDI are indicated by the dotted line circle.
Figure 3 with 4 supplements

Solution structure of RIP2 CARD and its complex with p75NTR DD.
(A) Superposition of backbone heavy atoms of the 10 lowest-energy structures of human RIP2 CARD. N- and C-termini are indicated. (B) Ribbon drawing of the lowest-energy conformer of human RIP2 CARD. N- and C-termini, as well as selected residues in the C-terminal tail are indicated. (C) Superposition of backbone heavy atoms of the 10 lowest-energy structures of the human p75NTR DD:RIP2 CARD complex. N- and C-termini are indicated. (D) Ribbon drawing of the lowest-energy p75NTR DD:RIP2 CARD conformer. Light brown, p75NTR DD; Green, RIP2 CARD. N- and C-termini, as well as DD helices H2, H3, and H5 are indicated. (E and F) Details of binding interface in the complex viewed in the same orientations as panel D, respectively. Key residues at the binding interface are labeled and depicted as stick models. Red labels denote interface residues functionally validated in our earlier mutagenesis study (Charalampopoulos et al., 2012). (G) Co-immunoprecipitation of wild type (WT) and point mutants of Flag-tagged human RIP2 with p75NTR in transfected HEK 293 cells. In the overexpression conditions used for this experiment, interaction of RIP2 with p75NTR was constitutive in the absence of ligand. Antibodies used for immunoprecipitation (IP) and Western blotting (WB) are indicated. WCE, whole cell extract. The immunoblots shown are representative of three independent experiments.
Figure 3—figure supplement 1
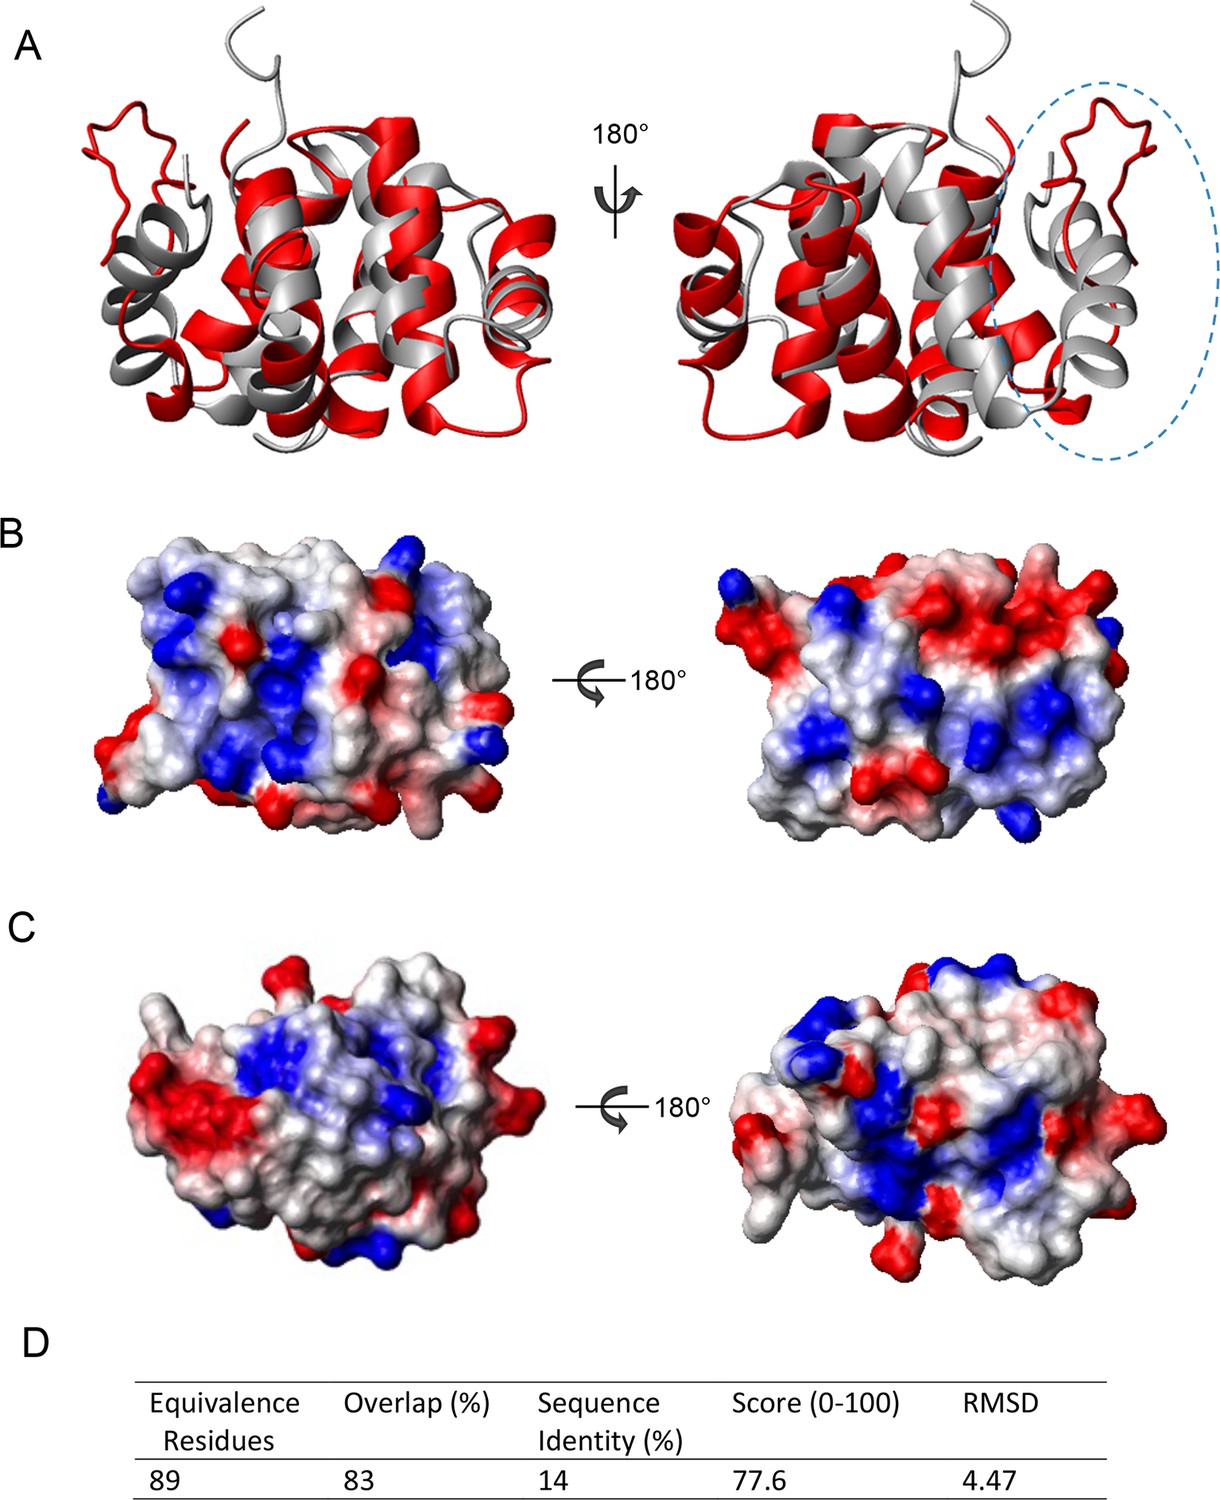
Structure comparison of CARD domains using a sequential structure alignment program (http://v3-4.cathdb.info/).
(A) Overlap of RIP2 CARD (red) and NOD1 CARD (gray, PDB ID: 2B1W). (B) Surface charge of RIP2 CARD without C-terminal tail. Positive charge surface is colored in blue, negative in red and noncharged in white. (C) Surface charge of NOD1 CARD. (D) Statistics of pairwise alignment of CARDs from RIP2 and NOD1.
Figure 3—figure supplement 2
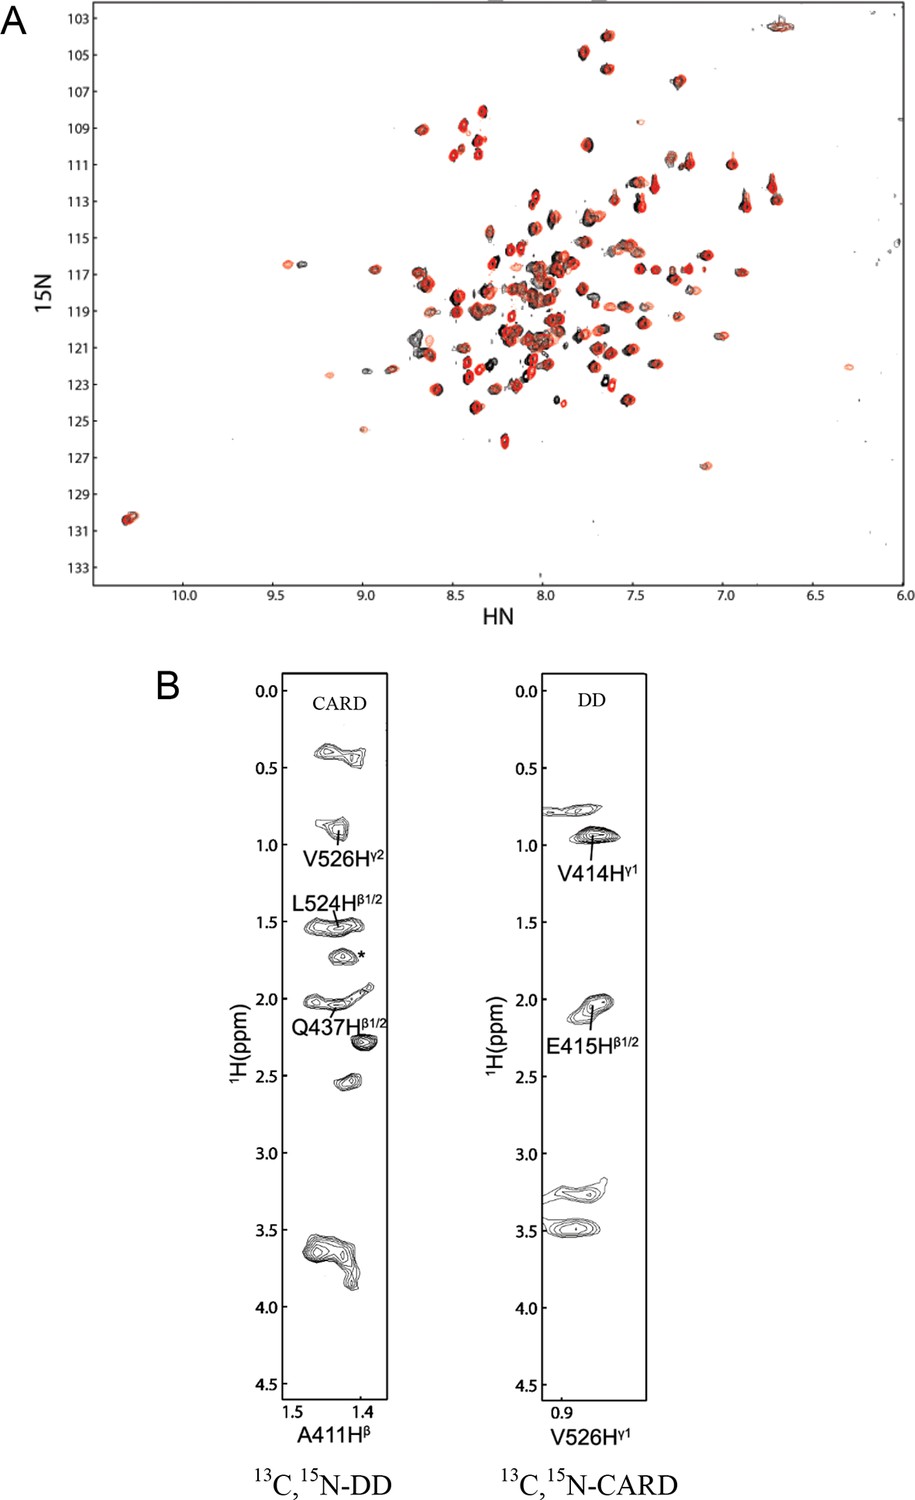
NMR Spectra of DD:CARD complex.
(A) [1H-15N] HSQC spectra of p75NTR DD in water in the absence (black) and presence (red) of RIP2 CARD. (B) Representative slices from the 13C,15N-filtered 3D NOESY spectra. Asterisk denotes ambiguous NOE peak.
Figure 3—figure supplement 3
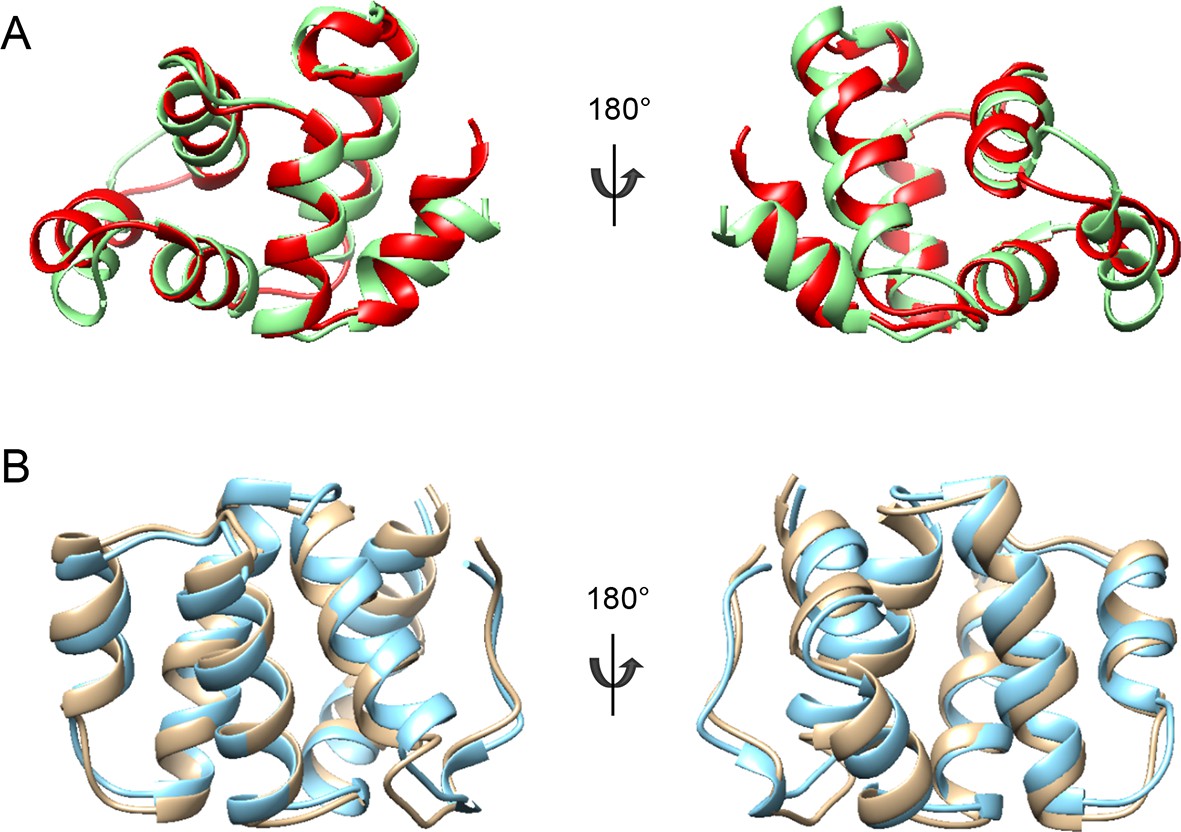
Structural comparisons of p75NTR DD and RIP2 CARD domains.
(A) Structural comparison between p75NTR DD from the DD:RhoGDI (red) and DD:CARD (green) complexes. (B) Structural comparison between monomeric RIP2 CARD (cyan) and RIP2 CARD from the DD:CARD complex (light brown).
Figure 3—figure supplement 4
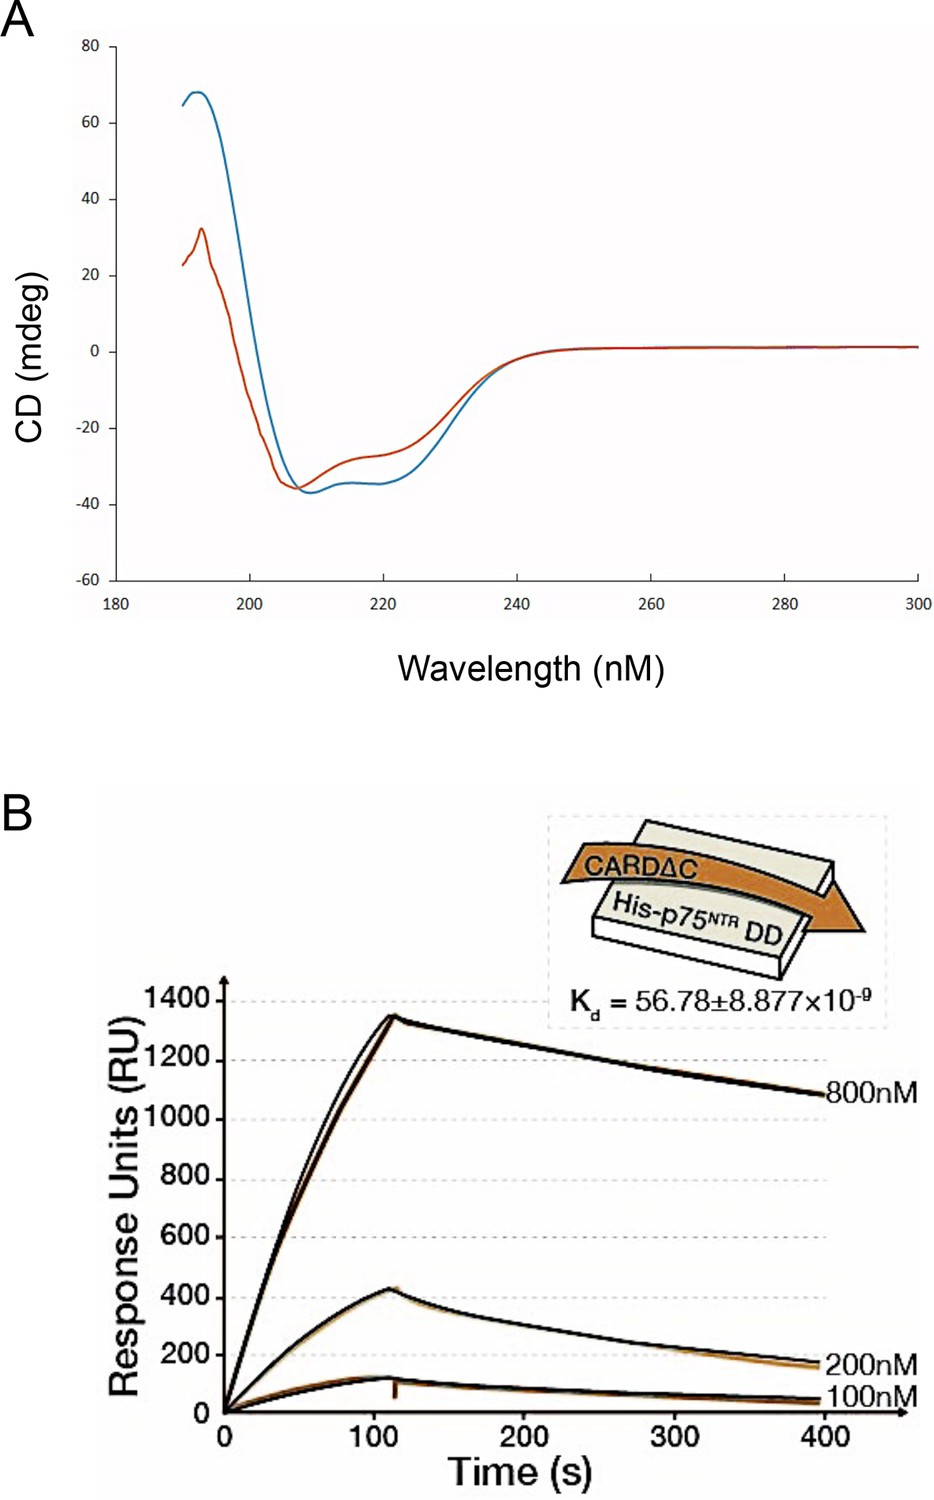
The C-terminal tail of RIP2 CARD contributes to its interaction with the p75NTRDD.
(A) CD spectra of CARD (orange) and CARD ΔC mutant lacking the C-terminal tail (blue). (B) Sensorgram of binding kinetics of CARD ΔC binding to p75NTR DD at pH 7.0. One binding site model was used for fitting of SPR data.
Figure 4
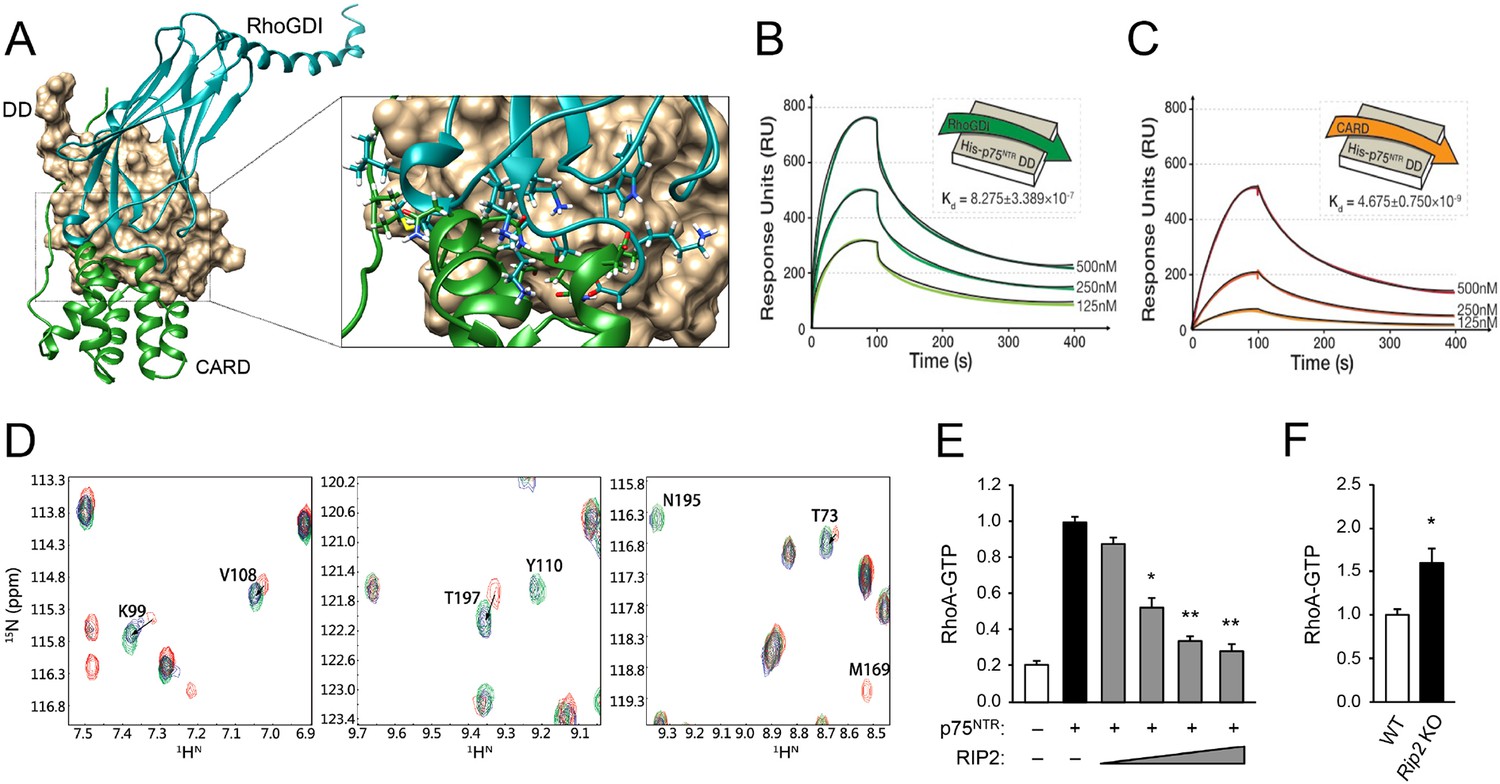
Structural basis for competitive interaction between RIP2 and RhoGDI on the p75NTR DD.
(A) Surface representation of p75NTR DD (light brown) with overlapped ribbon drawings of RhoGDI (cyan) and RIP2 CARD (green). The expanded view shows detail of the overlapping interfaces demonstrating steric clashes between residues in RhoGDI and CARD (highlighted as stick models). (B and C) Binding of RhoGDI (B) and RIP2 CARD (including C-terminal tail) (C) to captured His-tagged p75NTR DD measured by SPR. Colored lines represent experimentally recorded values at different concentrations and black lines are fitting data. Binding affinities were determined by kinetic analysis using one binding site model was used for fitting of SPR data. The sensorgrams shown are representative from three independent experiments. (D) [1H-15N] HSQC spectra of 15N-RhoGDI showing the ability of RIP2 to displace RhoGDI from the p75NTR DD. The panels show details of different regions of the spectra for RhoGDI alone (green), RhoGDI in the presence of p75NTR DD (red), and RhoGDI in the presence of both p75NTR DD and RIP2 CARD (blue). Representative RhoGDI residues located in and/or close to the DD:RhoGDI interface are labeled. Arrows denote shifts in the spectra of labeled RhoGDI residues upon addition of p75NTR DD and RIP2 CARD. All the spectra were recorded at pH 6.9 and 28°C. The concentrations of RhoGDI, p75NTR DD and RIP2 CARD were 0.05, 0.2, and 0.2 mM respectively. (E) Analysis of RhoA-GTP levels in lysates of HEK293 cells transfected with p75NTR and RIP2 expression constructs, as indicated. Increasing concentrations of RIP2 construct is indicated. The histogram shows average RhoA-GTP levels (from triplicate measurements) normalized to p75NTR alone. Protein expression levels were controlled by Western blotting (not shown). * p<0.01 vs. p75NTR alone (t-test). (F) Analysis of RhoA-GTP levels in cerebellar extracts prepared from P7 Rip2 knockout mice and wild type littermates (WT). The histogram shows average RhoA-GTP levels in WT (N = 3) and KO (N = 4) animals normalized to WT levels. *p<0.05 vs. WT (t-test).
Figure 5 with 1 supplement

Solution structure of the p75NTR DD homodimer.
(A) Superposition of backbone heavy atoms of the 10 lowest-energy structures of the human p75NTR DD homodimer. N- and C-termini are indicated. (B) Ribbon drawing of the lowest-energy conformer viewed perpendicular (top) and parallel (bottom) to the twofold symmetry axis. DD monomers are colored in light brown and orange. N- and C-termini, as well as DD helices H1, H2, H3, and H4 are indicated. (C) Detail of binding interface in the DD homodimer. The top image shows the same view as that in panel B, bottom. Key residues at the binding interface are labeled and depicted as stick models. Red labels denote interface residues functionally validated in a previous mutagenesis study (Vilar et al., 2014).
Figure 5—figure supplement 1
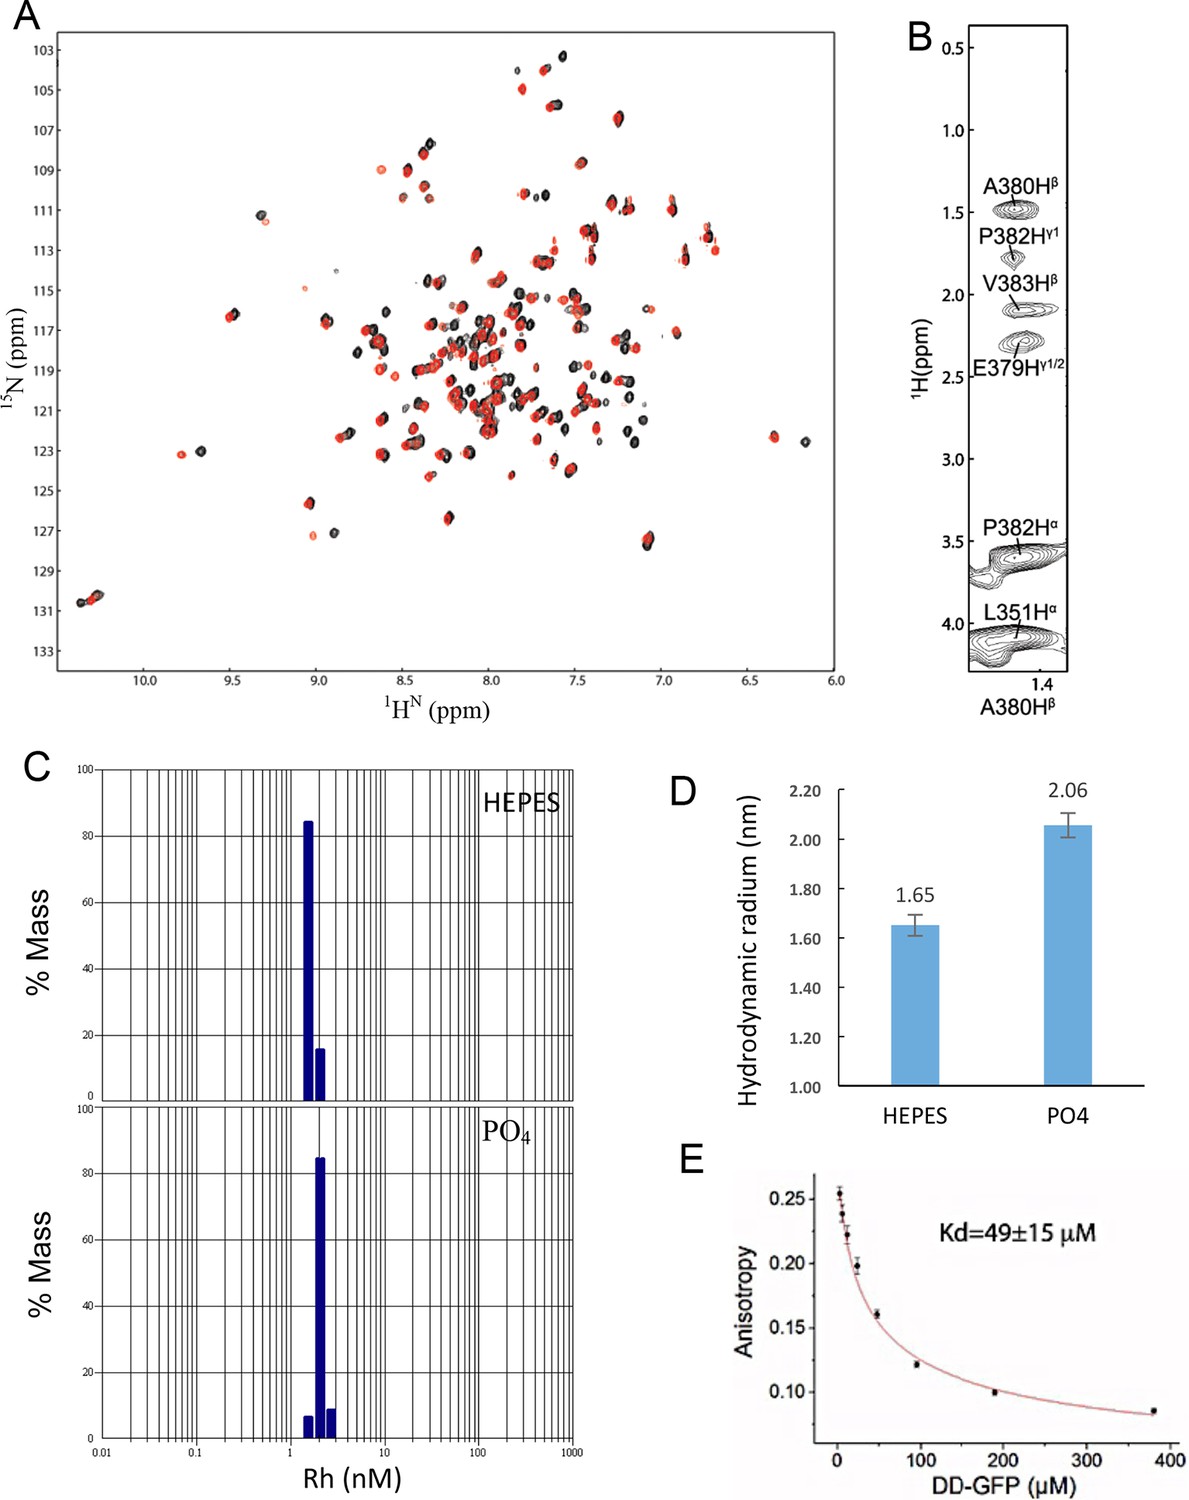
Homodimerization of p75NTR DD.
(A) [1H-15N] HSQC spectra of p75NTR DD in HEPES buffer (black) and phosphate buffer (red) at pH 6.9 and 28°C. (B) Representative slices from the 13C,15N-filtered 3D NOESY spectrum. (C) Apparent hydrodynamic radius (Rh) distribution of DD from DLS measurement in HEPES (top) and phosphate buffer (bottom), respectively. The protein concentrations used are ~0.2 mM. (D) Average Rh of DD in HEPES and phosphate buffers. The theoretical Rh of DD monomer (~10 kDa) and homodimer (~20 kDa) are ~1.6 and ~2.2 nm, respectively. (E) Determination of monomer-dimer Kd using anisotropy change resulting from FRET. p75NTR DD tagged with EGFP(A206K) in its C-terminus was used in these experiments. N= 3.
Figure 6
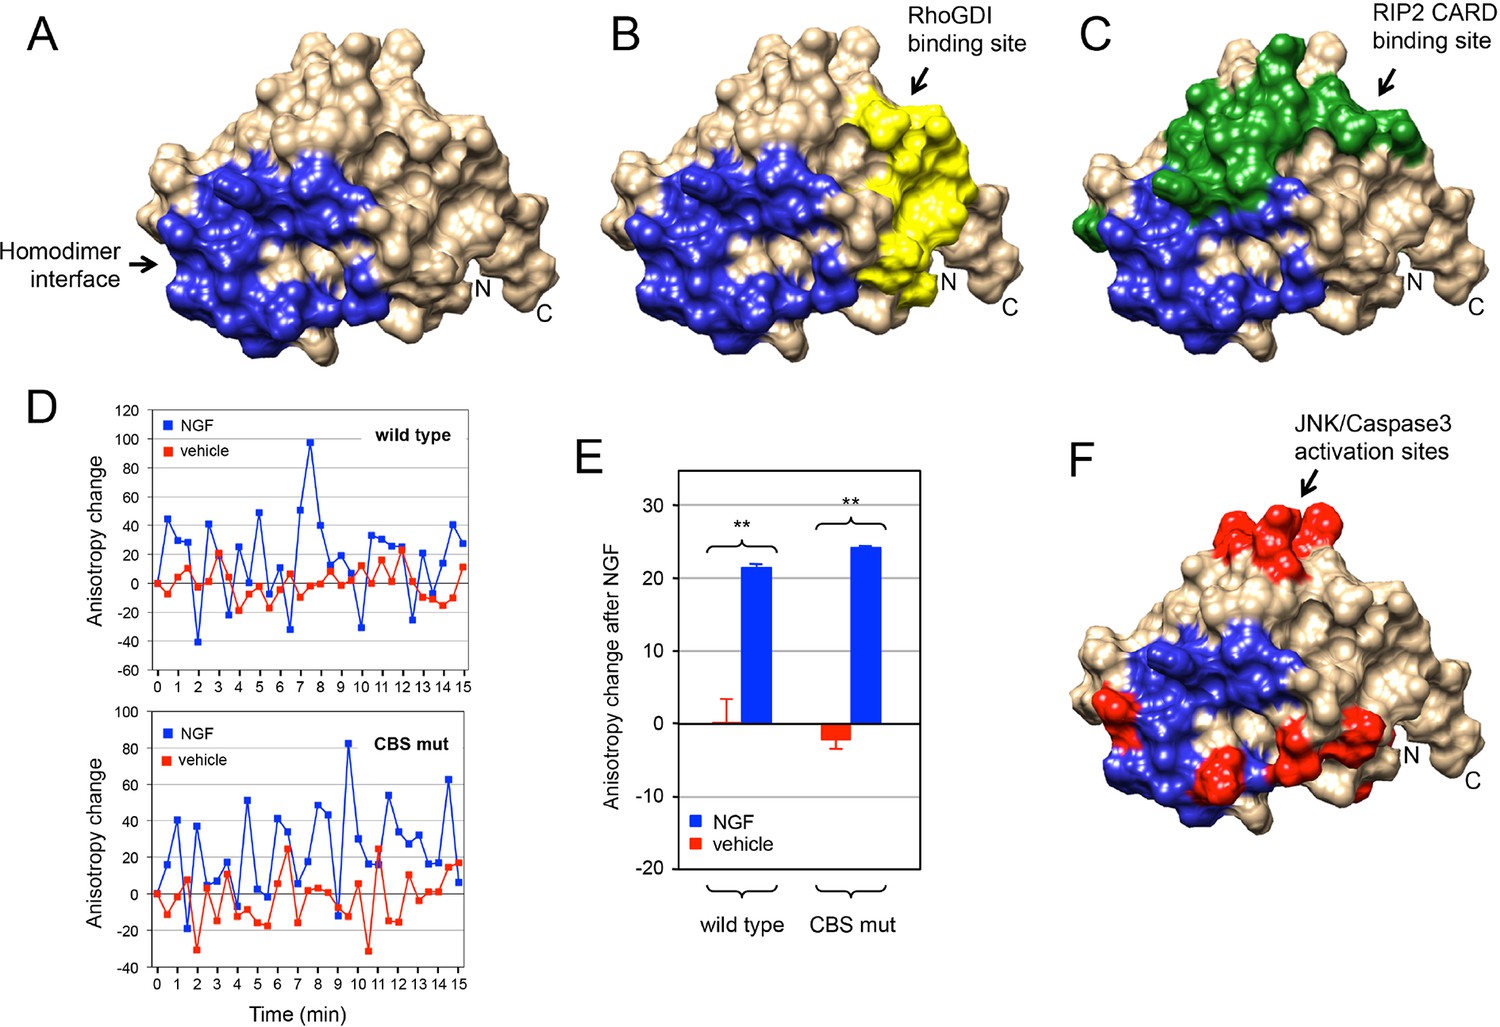
Relationship between p75NTR DD dimer interface and sites of interaction with downstream effectors.
(A) Surface presentation of p75NTR DD with homodimer interface colored in blue. N- and C-termini are indicated. (B, C and F) Representation of RhoGDI binding site (yellow in (B) RIP2 CARD binding site (green in (C) and JNK/caspase-3 activation sites (from [Charalampopoulos et al., 2012]) (red in (F) on the p75NTR DD surface showing overlap of DD homodimer interface (blue) with CARD binding and JNK/caspase-3 activation sites but not with RhoGDI binding site. N- and C-termini are indicated. (D) Representative experiment showing traces of average anisotropy change after addition of NGF or vehicle in cells expressing wild type p75NTR or a CARD binding site mutant (CBS mut) that is unable to bind RIP2 (Charalampopoulos et al., 2012). Addition of NGF, but not vehicle, induced positive anisotropy oscillations above baseline (horizontal axis at 0) in both wild type and mutant receptor constructs. (E) Net anisotropy change over 15 min after addition of NGF or vehicle in cells expression wild type p75NTR or the CARD binding site mutant (CBS mut). Results are expressed as average ± SD (N = 3 experiments; n = 15–17 cells examined per experiment). **p < 0.001 vs. vehicle.
Figure 7
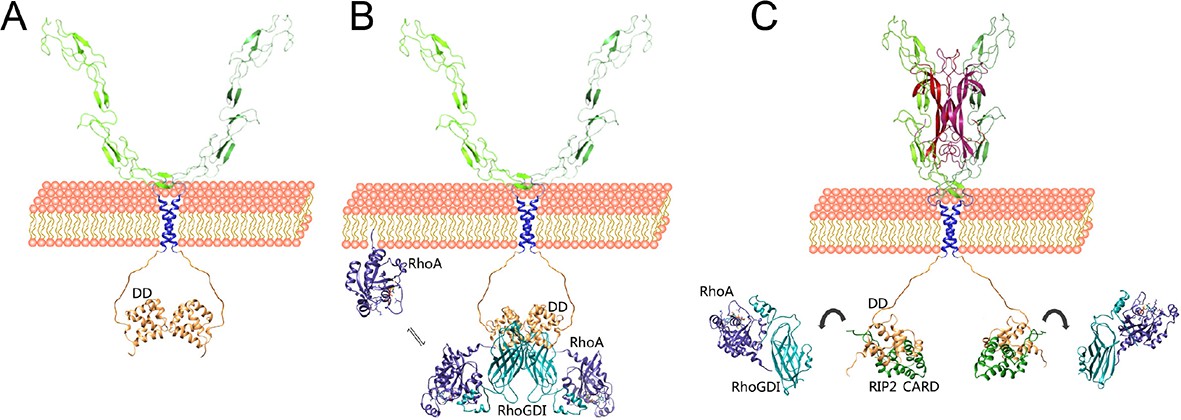
Competitive protein–protein interactions orchestrate coupling of p75NTR to the RhoGDI/RhoA and RIP2/NF-kB pathways.
Schematic drawing of a model for the coupling of p75NTR to the RhoGDI/RhoA and RIP2/NF-kB pathways based on the structural and biochemical studies presented above. (A) The p75NTR dimer in the cell membrane is held by homotypic interactions of DDs (light brown) and TM domains (blue). (B) RhoGDI (cyan) brings RhoA (dark purple) in proximity to the plasma membrane through its interaction with the DD of p75NTR. While the twofold symmetry axis of the DD:RhoGDI:RhoA hexametric complex is likely to be perpendicular to the plasma membrane, its relative orientation is hypothetical. RhoGDI binding to the p75NTR DD decreases its affinity for RhoA by 15-fold, and allows equilibration of RhoA with the plasma membrane, where it can be activated by GEFs. (C) Neurotrophin binding induces a conformational change in p75NTR resulting in the separation of its DDs (Vilar et al., 2009), exposing binding sites to downstream effectors that couple to the JNK/caspase-3 or NF-kB pathways, including RIP2. Recruitment of RIP2 to the p75NTR DD is mediated by the interaction of its CARD (green) with a binding surface that partially overlaps with that occupied by RhoGDI. As the binding affinity of the RIP2 CARD for the p75NTR DD is 100-fold higher than that of RhoGDI, the recruitment of RIP2 displaces RhoGDI from the receptor. Released from the DD, RhoGDI regains higher affinity for RhoA, extracting it from the membrane and holding it back in the cytosol.
Videos
Video 1
Model of the hexameric complex between p75NTR, RhoGDI and RhoA(GDP).
Animation around the two-fold symmetry axis of the hexameric p75NTR DD:RhoGDI:RhoA(GDP) complex. p75NTR DD appears in light brown, RhoGDI in cyan and RhoA in blue.
Tables
Table 1
NMR and refinement statistics for p75NTR DD complexes and RIP2 CARD.
| NMR distance and dihedral constraints | DD:RhoGDI | RIP2 CARD | DD:CARD | DD:DD |
|---|---|---|---|---|
| Distance constraints | ||||
| Total NOE | 3525 | 2107 | 3760 | 3344 |
| Intra-residue | 809 | 436 | 798 | 728 |
| Inter-residue | ||||
| Sequential ( i – j = 1) | 1054 | 656 | 1130 | 986 |
| Medium-range ( i – j ≤ 4) | 665 | 589 | 1016 | 892 |
| Long-range ( i – j ≥ 5) | 945 | 426 | 771 | 706 |
| Intermolecular NOE | 52 | - | 45 | 32 |
| Total dihedral angle restraints a | 222 | 132 | 260 | 280 |
| Structure Statistics | ||||
| Violations (mean and s.d.) | ||||
| Distance constraints (Å) | 0.36 ± 0.02 | 0.25 ± 0.01 | 0.36 ± 0.03 | 0.28 ± 0.01 |
| Dihedral angle constraints (º) | 3.50 ± 0.46 | 2.75 ± 0.28 | 3.37 ± 0.28 | 2.86 ± 0.59 |
| Max. dihedral angle violation (º) | 4.16 | 3.25 | 3.77 | 4.28 |
| Max. distance constraint violation (Å) | 0.39 | 0.26 | 0.44 | 0.29 |
| Ramachandran Plot (allowed region) | 99.8% | 99.5% | 99.8% | 99.9% |
| Average RMSD (Å) b | ||||
| Heavy atoms | 0.91 ± 0.12 | 0.83 ± 0.06 | 0.99 ± 0.08 | 0.77 ± 0.06 |
| Backbone atoms | 0.55 ± 0.13 | 0.36 ± 0.05 | 0.66 ± 0.09 | 0.43 ± 0.02 |
-
a Dihedral angle constraints were generated by TALOS based on Cα and Cβ chemical shifts.
-
b Average r.m.s. deviation (RMSD) to the mean structure was calculated among 10 refined structures. Superimposing residues for DD:RhoGDI, RIP2 CARD, DD:CARD, and DD:DD are 334–421 of DD with 70–204 of RhoGDI, 436–523 of RIP2 CARD, 334–420 of DD with 435–534 of RIP2 CARD and 334–421 of DD respectively. The total AMBER energy for DD:RhoGDI, RIP2 CARD, DD:CARD, and DD:DD are –9884 ± 41, –4437 ± 32, –7706 ± 32 and –7161 ± 18 kcal/mol respectively.
Table 2
Structural statistics for the 10 lowest-energy structures of p75NTRDD:RhoGDI:RhoA Trimer and Hexamera.
| Trimer | Hexamer | ||
|---|---|---|---|
| Backbone RMSD (Å) | |||
| From the mean, full complex | 0.61 ± 0.25 | 0.59 ± 0.20 | |
| From the mean, all interfaces | 0.58 ± 0.22 | 0.48 ± 0.13 | |
| Total energy (kcal/mol) | -20721 ± 137 | -37682 ± 210 | |
| Ramachandran plot (%)b | |||
| Residues in the most favored regions | 82.2 | 84.7 | |
| Residues in additional allowed regions | 14.1 | 12.5 | |
| Residues in generously allowed regions | 1.9 | 1.9 | |
| Residues in disallowed regions | 1.8 | 0.9 | |
-
aStructural statistics for the 10 lowest-energy conformers were obtained from HADDOCK calculation using NOEs between DD and RhoGDI.
-
bRamachandran analysis was carried out using PROCHECK-NMR.
Table 3
Association and dissociation binding constants of p75NTR DD binding to RhoGDI and RIP2 CARD.
| ka (µM-1·s-1) | kd (s-1·10-3) | Kd (nM) | |
|---|---|---|---|
| DD:RhoGDI | 0.06 ± 0.01 | 50 ± 9 | 827 ± 338 |
| DD:CARD | 0.72 ± 0.34 | 3.32 ± 1.5 | 4.67 ± 0.7 |
Download links
A two-part list of links to download the article, or parts of the article, in various formats.
Downloads (link to download the article as PDF)
Open citations (links to open the citations from this article in various online reference manager services)
Cite this article (links to download the citations from this article in formats compatible with various reference manager tools)
Structural basis of death domain signaling in the p75 neurotrophin receptor
eLife 4:e11692.
https://doi.org/10.7554/eLife.11692


