Glucocorticoid receptor-PPARα axis in fetal mouse liver prepares neonates for milk lipid catabolism
- University of Lausanne, Switzerland
- Nanyang Technological University, Singapore
- INRA, Université de Toulouse, France
- IFR 150 Plateforme Metatoul, Institut Fédératif de Recherche Bio-Médicale de Toulouse INSERM U563, France
Figures
Figure 1
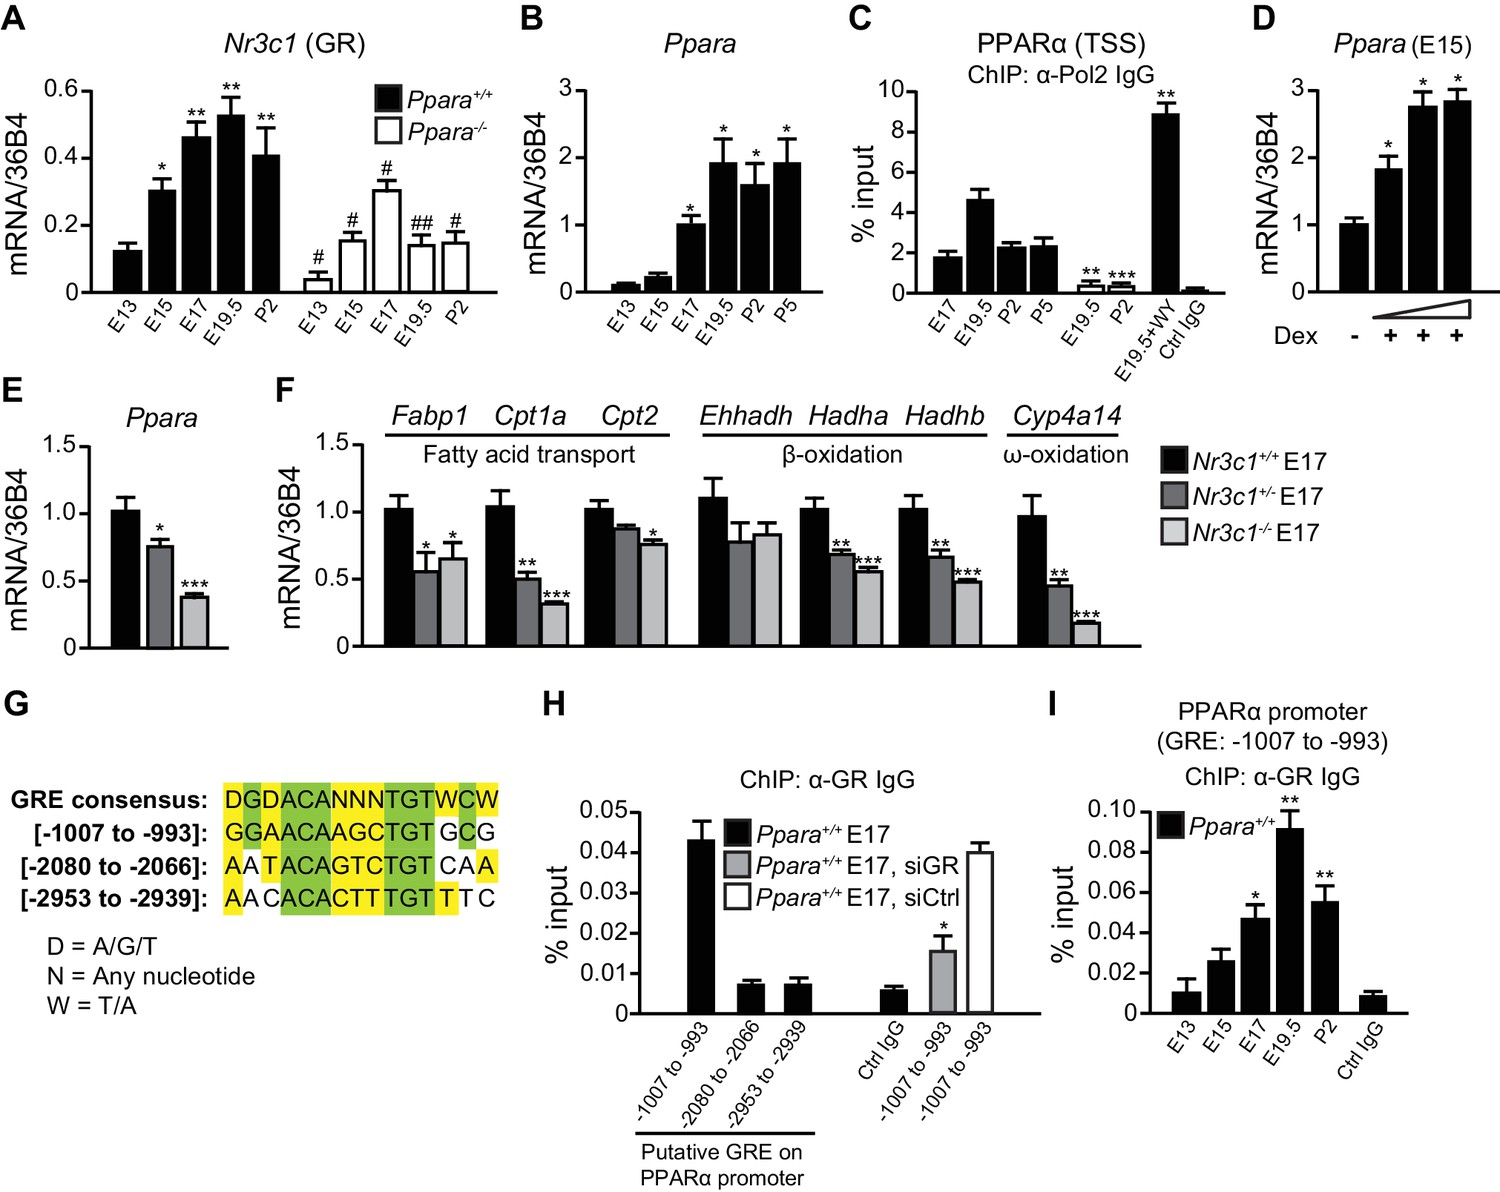
GR directly controls fetal PPARα expression.
(A, B) Ontogenic expression of Nr3c1 (A) and Ppara (B) mRNA in the developing mouse liver. *p<0.05, **p<0.01 vs. E13 samples; #p<0.05, ##p<0.01 vs. WT counterparts. (C) Enrichment of the DNA fragments containing the PPARα TSS using anti-Pol2 antibodies or pre-immune control IgG with or without PPARα agonist (WY-14643) treatment in pregnant dams. **p<0.01, ***p<0.001 vs. respective WT counterparts without WY-14643 treatment. (D) Ppara mRNA levels in the E15 Ppara+/+ liver explants with or without dexamethasone (Dex) treatment for 24 hr. Dex concentrations of 0.1 μM, 1 μM, and 10 μM were used. The vehicle control group was treated with 0.1% ethanol. *p<0.05 vs. vehicle control. (E,F) mRNA expression of PPARα and its target genes in the fetal livers of GR models at E17. *p<0.05, ** p<0.01, ***p<0.001 vs. Nr3c1+/+ liver. (G) Alignment of the GRE consensus sequence with the three putative GRE sequences located upstream of the PPARα promoter. (H) Enrichment of the DNA fragment containing the three putative GRE found within the PPARα promoter at regions spanning −1007 to −993, −2080 to −2066, and −2953 to −2939 in fetal liver at E17 using anti-GR antibody or pre-immune control IgG. Enrichment levels were expressed as the percentage input. GR-targeting siRNA was used to knockdown Nr3c1 expression and to determine the specificity of GR binding to this putative GRE. *p<0.05 vs. non-targeting siRNA treatment group. (I) Enrichment of GRE spanning -1007 to −993 of the PPARα promoter in Ppara+/+ liver during development. *p<0.05, **p<0.01 vs. E13 samples. Data are presented as mean ± SEM; n = 4–6. Statistical analyses were performed using two-tailed Mann-Whitney tests.
Figure 2 with 1 supplement
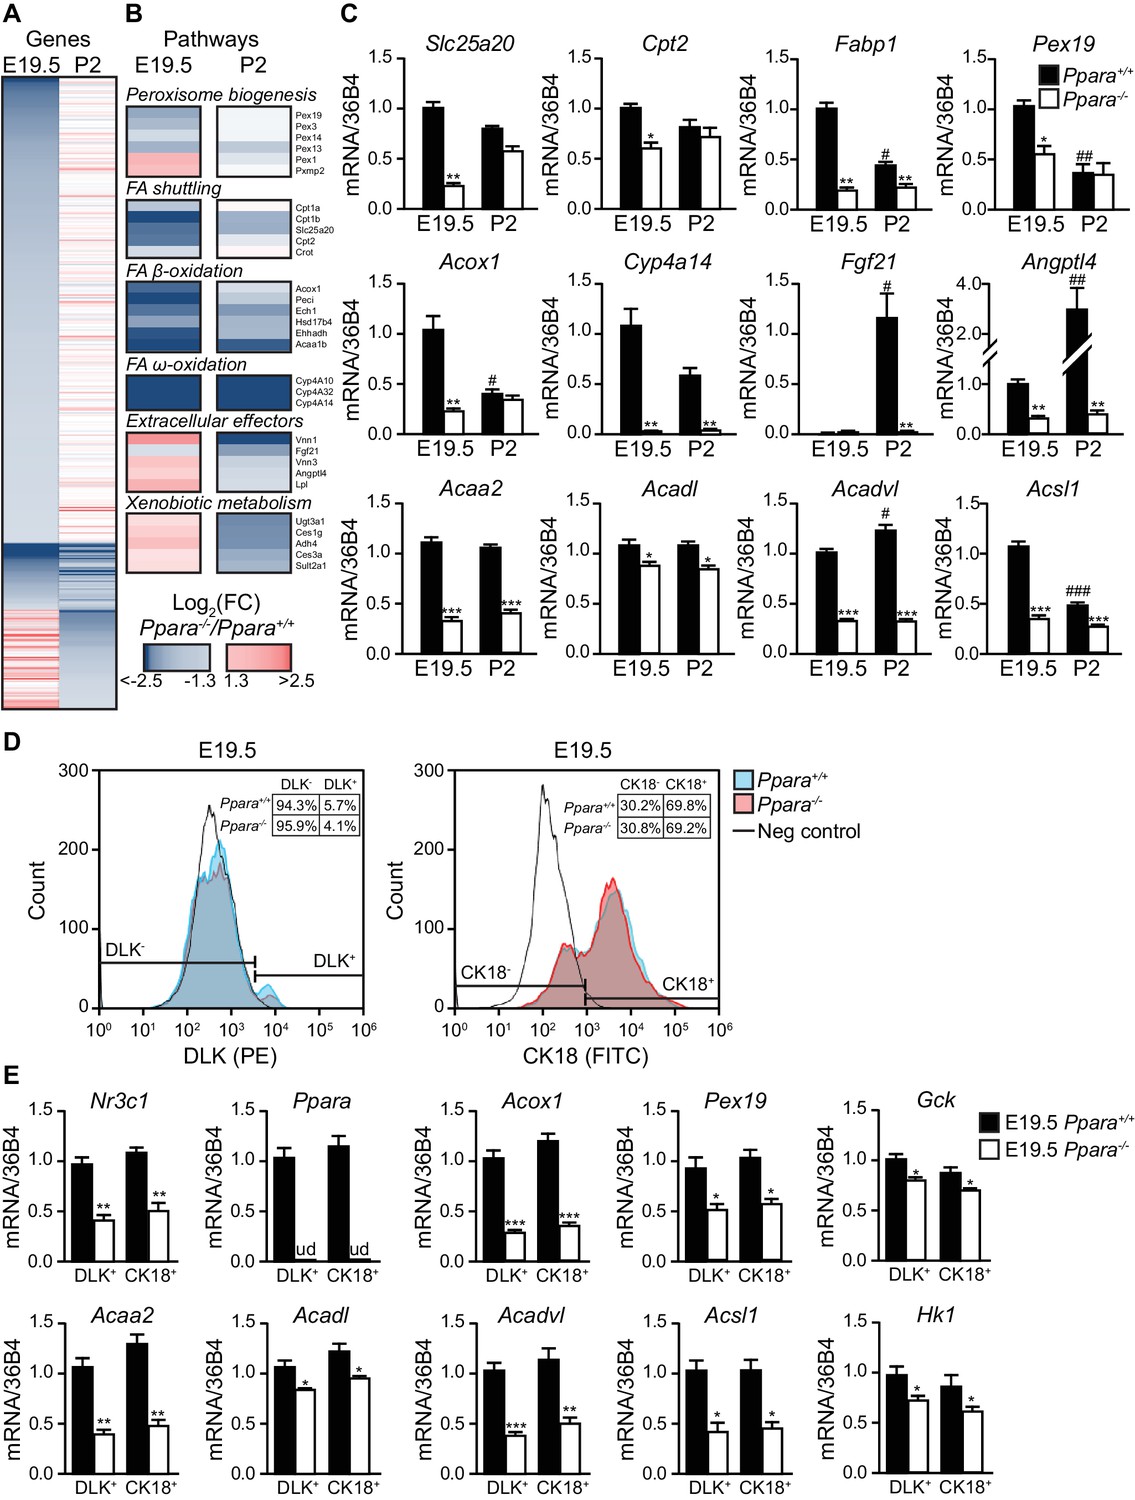
PPARα is a functional transcription factor in the term fetus.
(A) Heat map of genes significantly altered at E19.5 (left panel) or P2 (right panel) in Ppara-/- livers (red: up-regulation; blue: down-regulation). Genes were grouped by fetal (E19.5) or postnatal (P2) expression and ordered by strength of regulation based on the logarithmic fold change (log2FC). (B) Gene ontology summarizing prenatal and postnatal PPARα-mediated regulation of metabolic pathways. (C) mRNA levels of representative PPARα target genes with differential fetal (E19.5) and postnatal (P2) regulation in Ppara-/- and Ppara+/+ livers. Slc25a20: carnitine translocase; Cpt2: carnitine palmitoyltransferase 2; Fabp1: fatty acid binding protein 1; Pex19: peroxisome biogenesis factor 19; Acox1: peroxisomal acyl-CoA oxidase 1; Cyp4a14: cytochrome P450 4A14; Fgf21: fibroblast growth factor 21; Angptl4: angiopoietin-like protein 4; Acaa2: acetyl-CoA acyltransferase 2; Acadl: acyl-CoA dehydrogenase, long chain; Acadvl: acyl-CoA dehydrogenase, very long chain; Acsl1: acyl-CoA synthetase, long-chain family member 1. Data are presented as mean ± SEM; n = 6, *p<0.05, **p<0.01, ***p<0.001 vs. wild-type controls; #p<0.05, ##p<0.01, ###p<0.001 vs. respective E19.5 samples. (D) Flow cytometric analyses of hepatoblasts (DLK+) and hepatocytes (CK18+) in fetal livers at E19.5. (E) mRNA expression levels of Nr3c1, Ppara, and PPARα target genes involved in peroxisome biogenesis (Pex19), peroxisomal and mitochondrial FAO (Acox1, Acaa2, Acadl, Acadvl, and Acsl1) in sorted fetal hepatoblast and hepatocyte fractions. Glycolytic genes (e.g., Gck and Hk1) were also investigated in parallel with oxidative genes. Nr3c1: glucocorticoid receptor; Ppara: peroxisome proliferator-activated receptor α; ud: undetermined; Gck: glucokinase; Hk1: hexokinase 1. Data are presented as mean ± SEM; n = 4, *p <0.05, **p<0.01, ***p<0.001 vs. wild-type controls.
-
Figure 2—source data 1
A list of PPARα-regulated genes and pathways in prenatal and neonatal livers.
The dataset provides a list of PPARα-regulated genes (A) and pathways (B) in E19.5 and P2 mouse livers. Significant genes based on a false discovery rate < 0.05 were classified as regulated at both E19.5 and P2, in E19.5 only, or P2 only. The logarithmic fold change (logFC) cut-off value was set at 1.3. For each group, the significant enrichment of underlying KEGG, GO, and Reactome curated pathways was determined from the hypergeometric distribution and corrected for multiple comparisons.
- https://doi.org/10.7554/eLife.11853.005
Figure 2—figure supplement 1
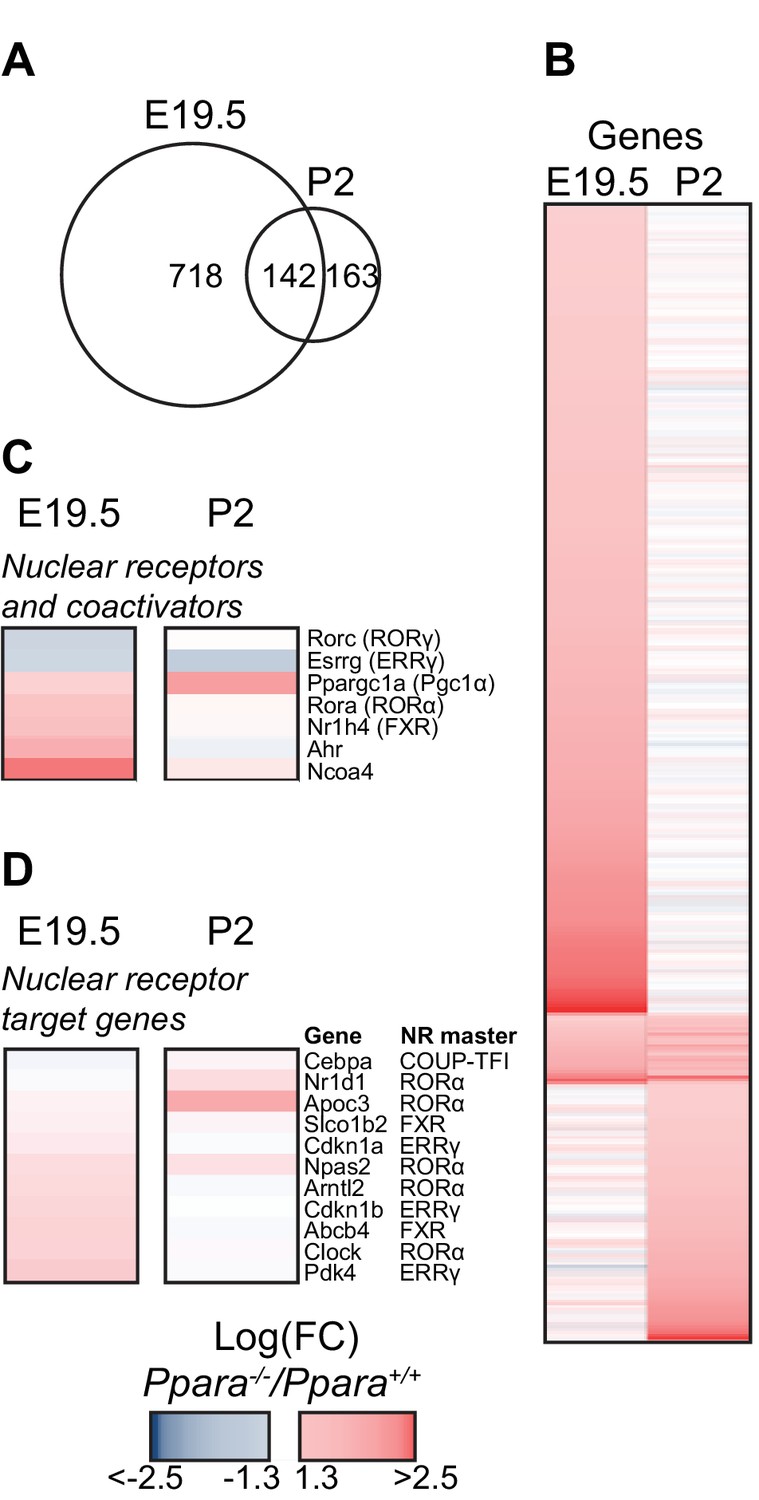
PPARα deficiency leads to compensatory up-regulation of genes.
(A) Venn diagram depicting the number of up-regulated genes in the Ppara-/- liver with overlapping PPARα regulation (false discovery rate <0.05) before (E19.5) and after (P2) birth. The absolute fold change cut-off value was set at 1.3. (B) Heat map of genes significantly altered at E19.5 (left panel) or P2 (right panel) in Ppara-/- livers (red: up-regulation; blue: down-regulation). Genes were grouped by fetal or postnatal expression and ordered by strength of PPARα regulation based on the logarithmic fold change (logFC). (C,D) Up-regulated and down-regulated nuclear receptors and co-regulators (C) and nuclear receptor target genes (D) in Ppara-/- livers.
Figure 3
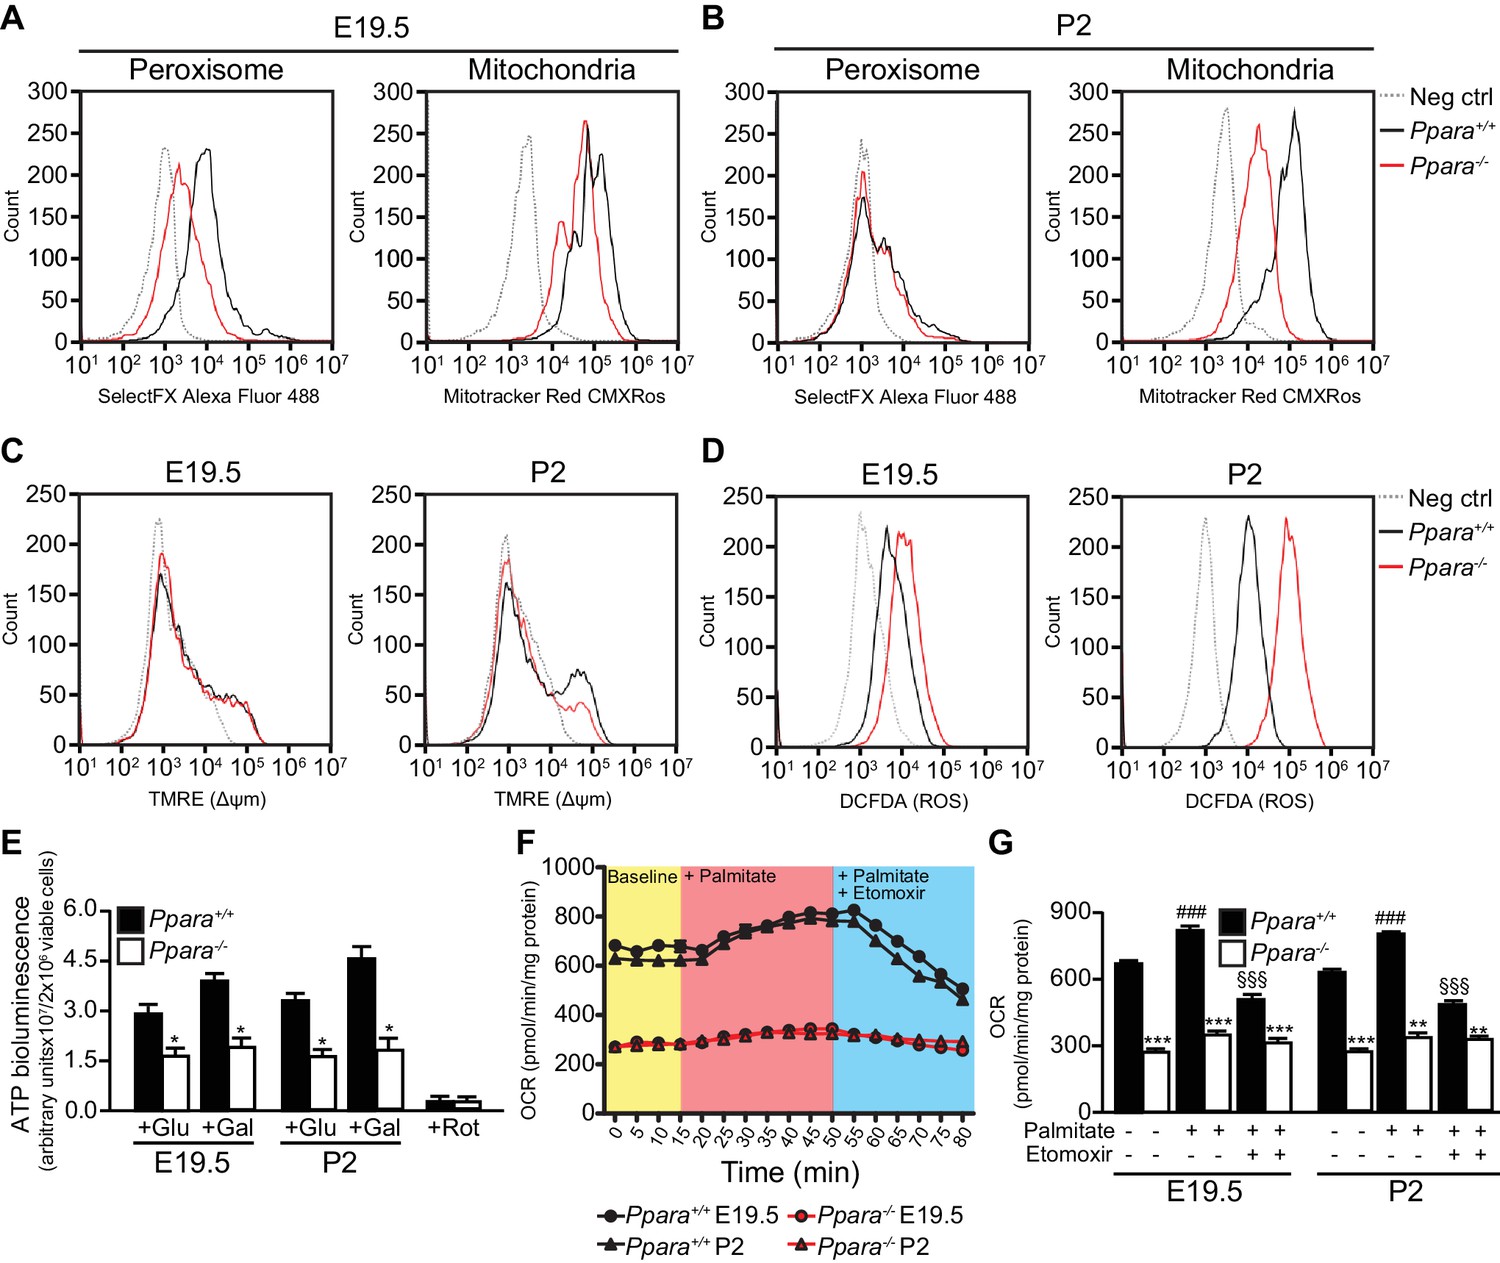
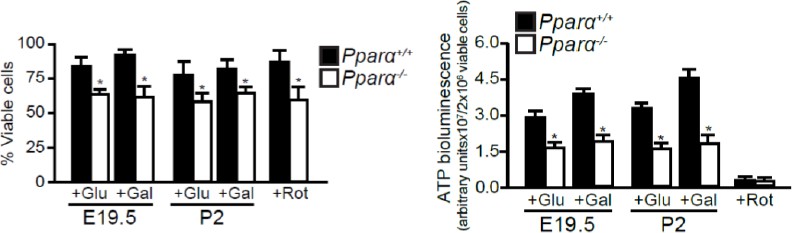
Defective mitochondrial function, fatty acid oxidation and energy production in Ppara-/- hepatocytes.
(A,B) Flow cytometric analyses of intracellular peroxisomes and mitochondria in primary hepatocytes isolated from Ppara-/- and Ppara+/+ livers at E19.5 (A) and P2 (B) using Alexa Fluor 488-labeled antibodies against peroxisome membrane protein 70 and Mitotracker Red, respectively. (C,D) Flow cytometric analyses of mitochondrial membrane potential (∆ΨM) (C) and intracellular ROS (D) in primary hepatocytes isolated from Ppara-/- and Ppara+/+ livers at E19.5 and P2 using tetramethylrhodamine, ethyl ester (TMRE) and 2’,7’-dichlorofluorescin diacetate (DCFDA), respectively. (E) ATP production in primary hepatocytes isolated from Ppara-/- and Ppara+/+ livers (n = 4 per group) in the presence of glucose (+Glu), galactose (+Gal), or rotenone (+Rot, a mitochondrial electron transport chain complex I inhibitor) as a negative control. Values represent arbitrary bioluminescence units normalized to the number of viable cells. (F,G) Oxygen consumption rates (OCRs) in primary hepatocytes isolated from Ppara-/- and Ppara+/+ livers in the presence or absence of palmitate and etomoxir, a mitochondrial β-oxidation inhibitor. Data are presented in time-lapse (F) and treatment end points (G) at 15 min for basal respiration, 50 min for palmitate treatment, and 80 min for palmitate cum etomoxir treatment. Data represent mean ± SEM; n = 3–9 unless otherwise stated, **p<0.01, ***p<0.001 vs. wild-type controls; ###p<0.001 vs. no treatment group; §§§p<0.001 vs. palmitate treatment group (two-tailed Mann-Whitney test).
Figure 4 with 2 supplements
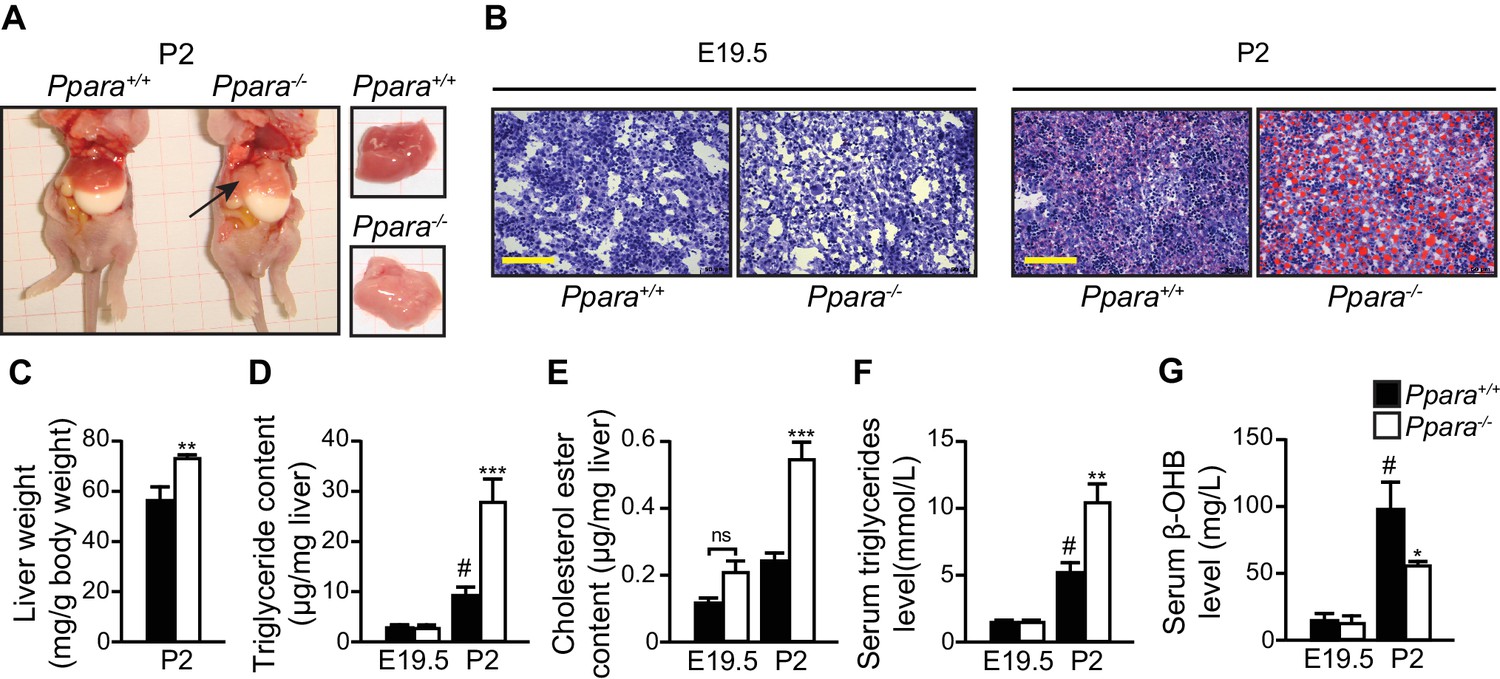
PPARα deficiency leads to congenital hepatic steatosis after birth.
(A) Photographs showing dissected Ppara-/- and Ppara+/+ pups (left) and livers (right). The pallid liver of a Ppara-/- pup is indicated by an arrow. The white content of the stomach indicates milk ingestion. (B) Representative Oil Red O-stained liver sections counterstained with methylene blue. Scale bars = 100 μm. (C–G) The Mean body weight (C), triglyceride (D) and cholesterol ester (E) contents of the liver, and serum levels of triglyceride (F) and β-hydroxybutyrate (β-OHB) (G). Data are presented as mean ± SEM; n = 6, *p<0.05, **p<0.01, ***p<0.001 vs. wild-type controls; #p<0.05 vs. respective E19.5; ns, not significant (two-way ANOVA with Bonferroni post-hoc analysis).
Figure 4—figure supplement 1
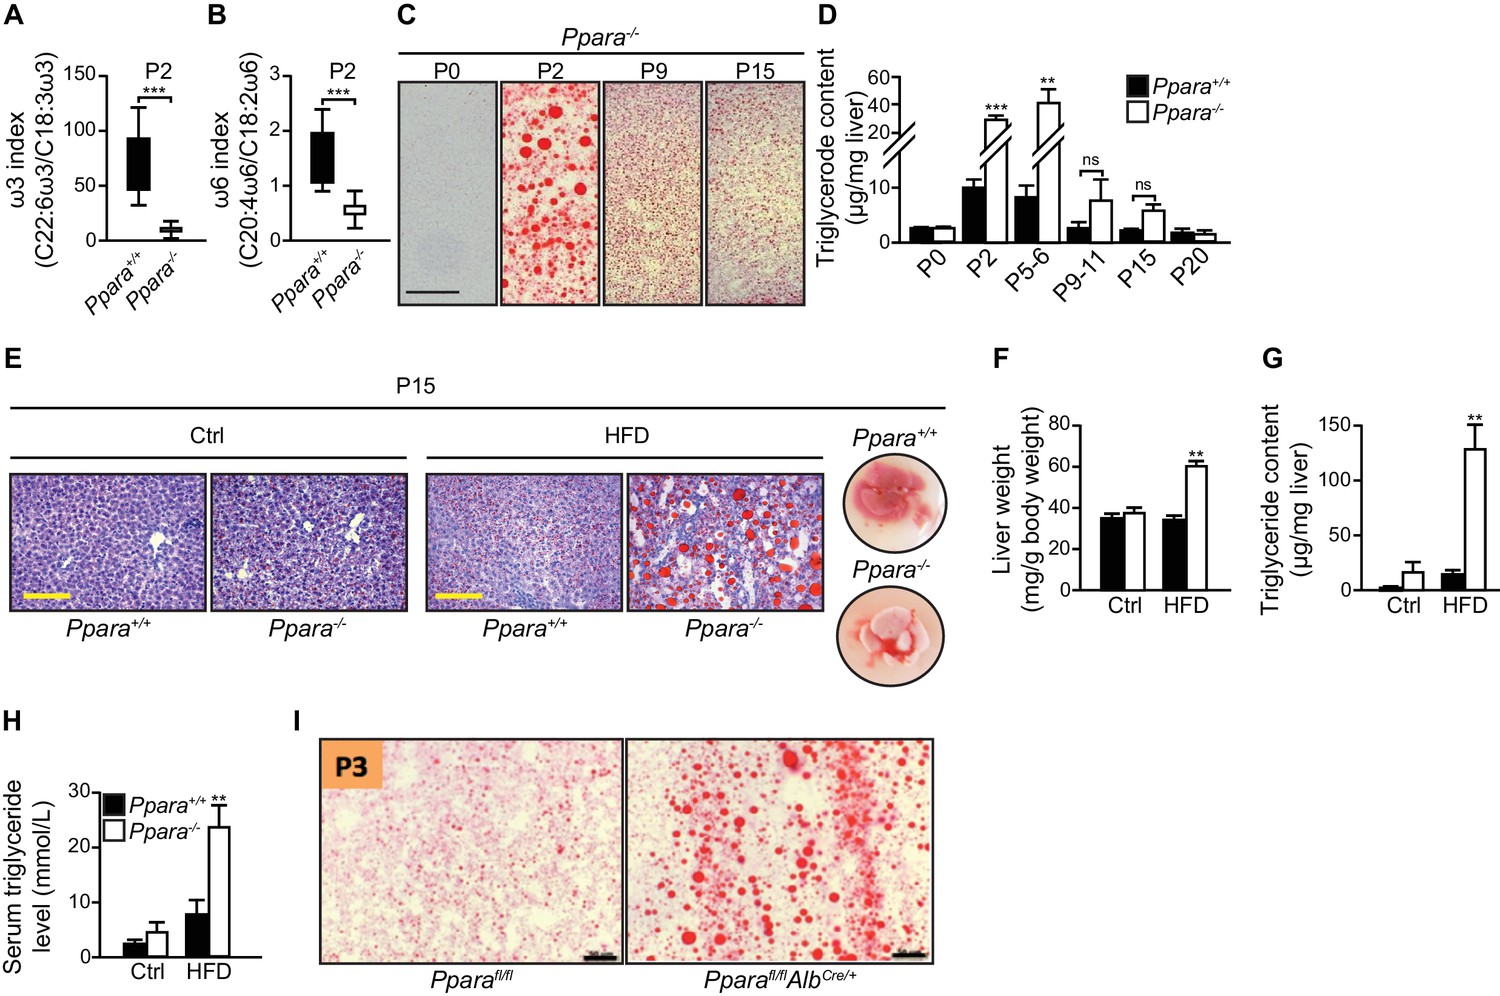
Postnatal lipid catabolic derangements in Ppara-/- pups.
(A,B) Boxplots showing the ω-3 (A) and ω-6 (B) indexes of the P2 livers calculated from the ratios of docosahexaenoic acid to α-linolenic acid and arachidonic acid to linoleic acid, respectively. Boxes indicate the 25th to 75th percentiles and whiskers represent the full range; n = 16, ***p<0.001 (two-tailed Mann-Whitney test). (C) Oil Red O staining of cryosections prepared from the PPARα-/- liver at the indicated postnatal days. Note the onset and the progressive recovery of hepatic steatosis in Ppara-/- mice from P2 to P15. (D) Liver triglyceride content measured by gas chromatography-high performance liquid chromatography; n = 4–6, **p<0.01, ***p<0.001 vs. wild-type controls; ns, not significant (two-tailed Mann-Whitney test). (E–H) Ten-day high-fat weaning challenge in 5-day-old Ppara+/+ and Ppara-/- pups. Representative images of the Oil Red O-stained liver sections after counterstaining with methylene blue are shown (E). Right-most panel shows the dissected livers at P15 after the challenge. Note the pallid color of Ppara-/-liver. Scale bars = 100 μm. Wet liver weight (F), liver triglyceride levels (G), and serum triglyceride levels (H) measured in P15 pups fed the control (Ctrl) or high-fat diet (HFD). (I) Oil Red O staining of cryosections prepared from the liver of hepatocyte-specific knockout of PPARα (Pparafl/flAlbCre/+) and control (Pparafl/fl) pups at postnatal day three (P3). Scale bars = 100 μm. Bars represent means ± SEM; n = 4–6, **p<0.01 vs. wild-type controls under the same dietary treatment (two-way ANOVA with Bonferroni post-hoc analysis).
Figure 4—figure supplement 2

Anaplerotic compensation for defective oxidative metabolism and ketogenesis in suckling Ppara-/- pups.
(A,B) Body weight (A) and plasma glucose levels (B) of Ppara+/+ and Ppara-/- pups at the indicated postnatal days. (C) Alanine aminotransferase (ALT) activity measured in liver lysates at P2. (D) Gluconeogenesis pathway in Ppara-/- liver at P2 with the supply of pyruvate through the anaplerotic metabolism of alanine indicated. (E) The affected amino acid oxidation pathways in Ppara-/- liver at P2. Colors indicate up-regulation (red) or down-regulation (blue) of genes identified by microarray analysis. The up-regulated genes are Hal (1), Uroc1(2), Amdhd1 (3), Ftcd (4), Glud (5), Pycr (6), Oat (7), Fah (8), Asl (9), Ass1 (10), Got2 (11), Got1 (12), Sds (13), Cth (14), Cbs (15), Cdo1 (16), Got1 (17), Sds (18), Gpt (19), Pcx (20). The down-regulated genes are Ehhadh (21,22,24), Hibch (23), Hmgcs2 (25), Hmgcl (26). (F,G) Body weight (F) and blood glucose (G) of P2pups before and after daily intraperitoneal injections of 30 mg/kg L-cycloserine for two days (P4), three days (P5), and four days (P6). Bars represent means ± SEM; n = 4–6, *p<0.05, **p<0.01 vs. wild-type controls (two-way Mann-Whitney test).
Figure 5
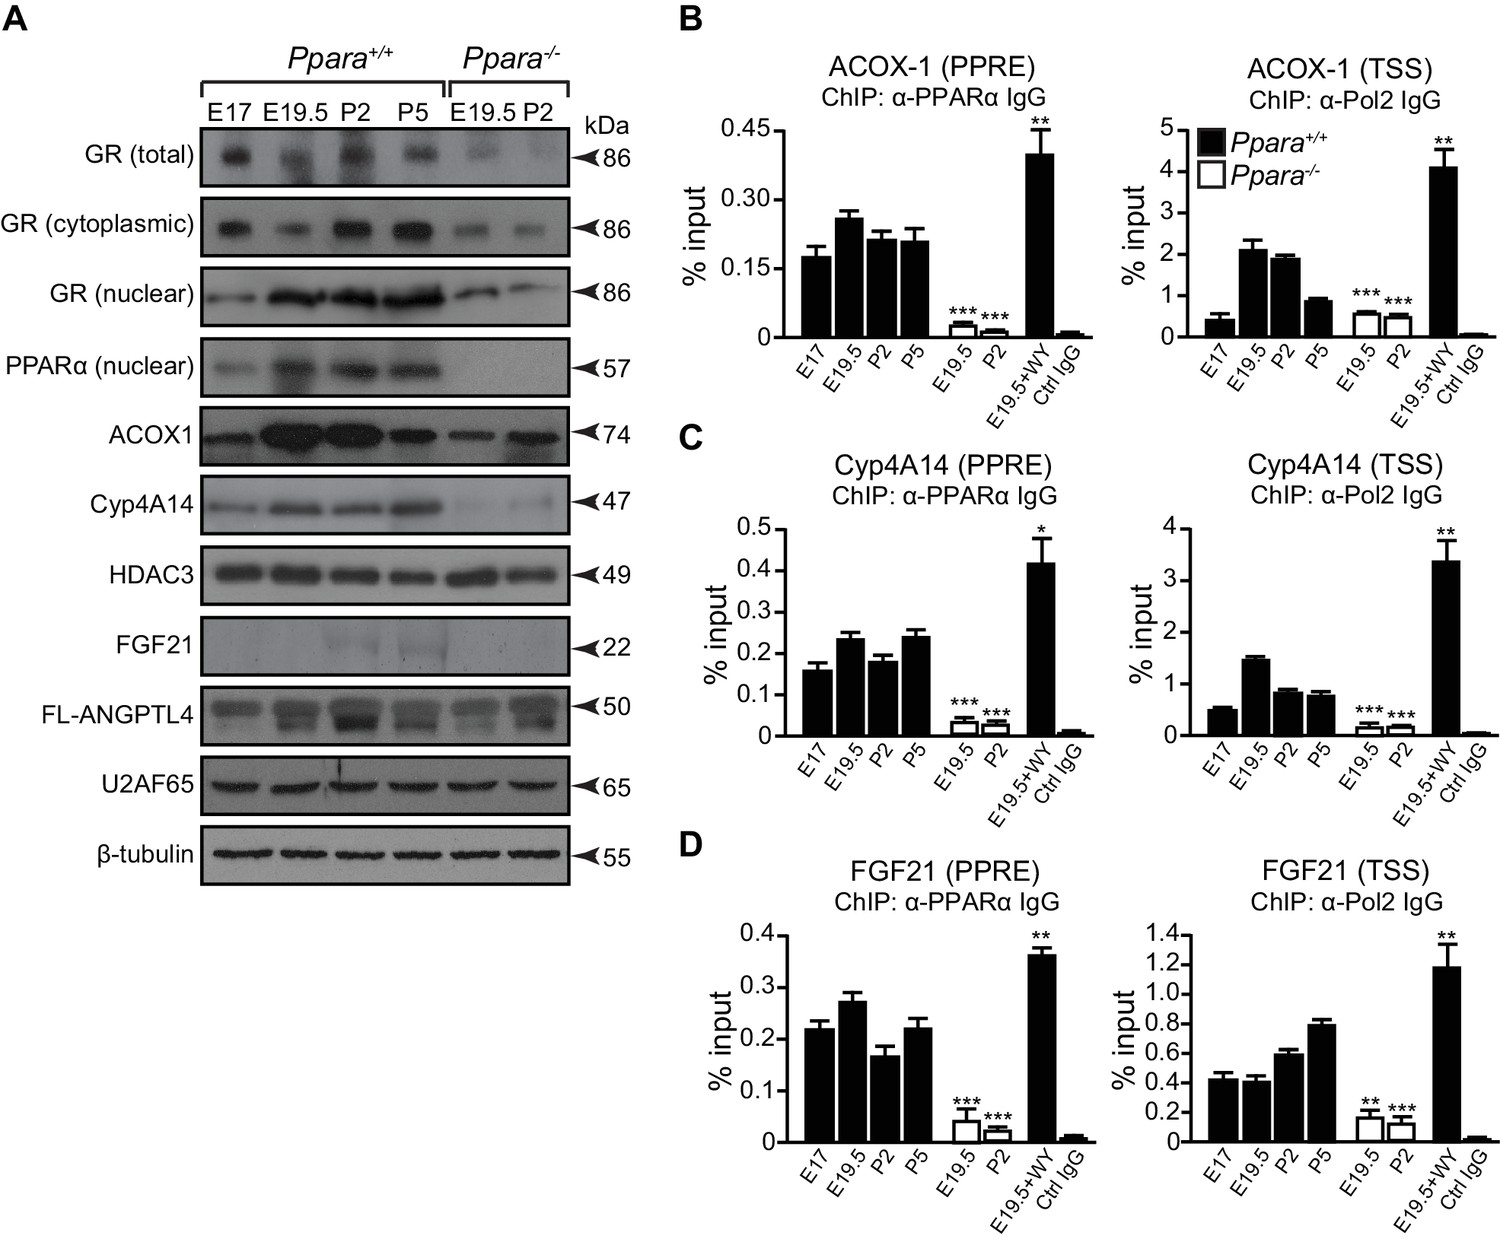
A temporal dichotomy in the regulation of PPARα target genes before and after birth.
(A) Immunoblots showing the ontogenic expression of cytoplasmic and nuclear GR, HDAC3, PPARα, and its target genes, including ACOX1, Cyp4A14, FGF21, and full-length (FL)-ANGPTL4, in Ppara-/- and Ppara+/+ livers. U2AF65 and β-tubulin were used as loading controls for nuclear and cytoplasmic proteins, respectively. (B–D) Enrichment of the DNA fragment containing the PPAR response element (PPRE) (left panels) on the ACOX1 (B), Cyp4A14 (C), and FGF21 (D) promoters or their respective TSS (right panels) using anti-PPARα and anti-Pol2 antibodies or pre-immune IgG. Data are presented as mean ± SEM; n = 4–6, *p<0.05, **p<0.01, ***p<0.001 vs. untreated wild-type controls (two-tailed Mann-Whitney test).
Figure 6

PPARα-mediated regulation of Fgf21 expression is dictated by the occupancy of HDAC3 on its promoter.
(A–C) Enrichment of the DNA fragment containing the ACOX1 (A), Cyp4A14 (B), or FGF21 (C) TSS in primary hepatocytes isolated from Ppara+/+ pups using antibodies against acetyl-histone four (AcH4), trimethylated histone three at lysine four (H3K4me3), lysine nine (H3K9me3), lysine 27 (H3K27me3), or pre-immune IgG (Ctrl IgG) and evaluated by real-time qPCR. (D–F) Enrichment of the DNA fragment containing the FGF21 (D), ANGPTL4 (E), or Cyp4A14 (F) TSS in primary hepatocytes isolated from Ppara-/- and Ppara+/+ pups with or without WY-14643 treatment in pregnant dams using anti-HDAC3 antibodies or control IgG. Data are presented as mean ± SEM; n = 4–6, *p<0.05, **p<0.01, ***p<0.001 vs. untreated wild-type controls unless otherwise indicated (two-tailed Mann-Whitney test).
Figure 7

β-hydroxybutyrate acts as an endogenous inhibitor of HDAC3 to activate Fgf21 expression upon milk suckling.
(A–C) Ex vivo liver explants isolated from Ppara+/+ fetuses at E19.5 were used to study the effects of butyrate, β-hydroxybutyrate, and trichostatin in the presence or absence of WY-14643 (WY) on PPARα target genes. Left: mRNA expression of Fgf21 (A), Cyp4a14 (B), and Acox1 (C). Right: enrichment of the DNA fragment containing the FGF21 (A), Cyp4A14 (B), or ACOX1 (C) TSS after chromatin immunoprecipitation (ChIP) using antibody against acetyl-histone 4 (AcH4). Data are presented as mean ± SEM; n = 6, *p<0.05, **p<0.01, ***p<0.001 vs. E19.5 samples without WY-14643 treatment (two-tailed Mann-Whitney test).
Figure 8
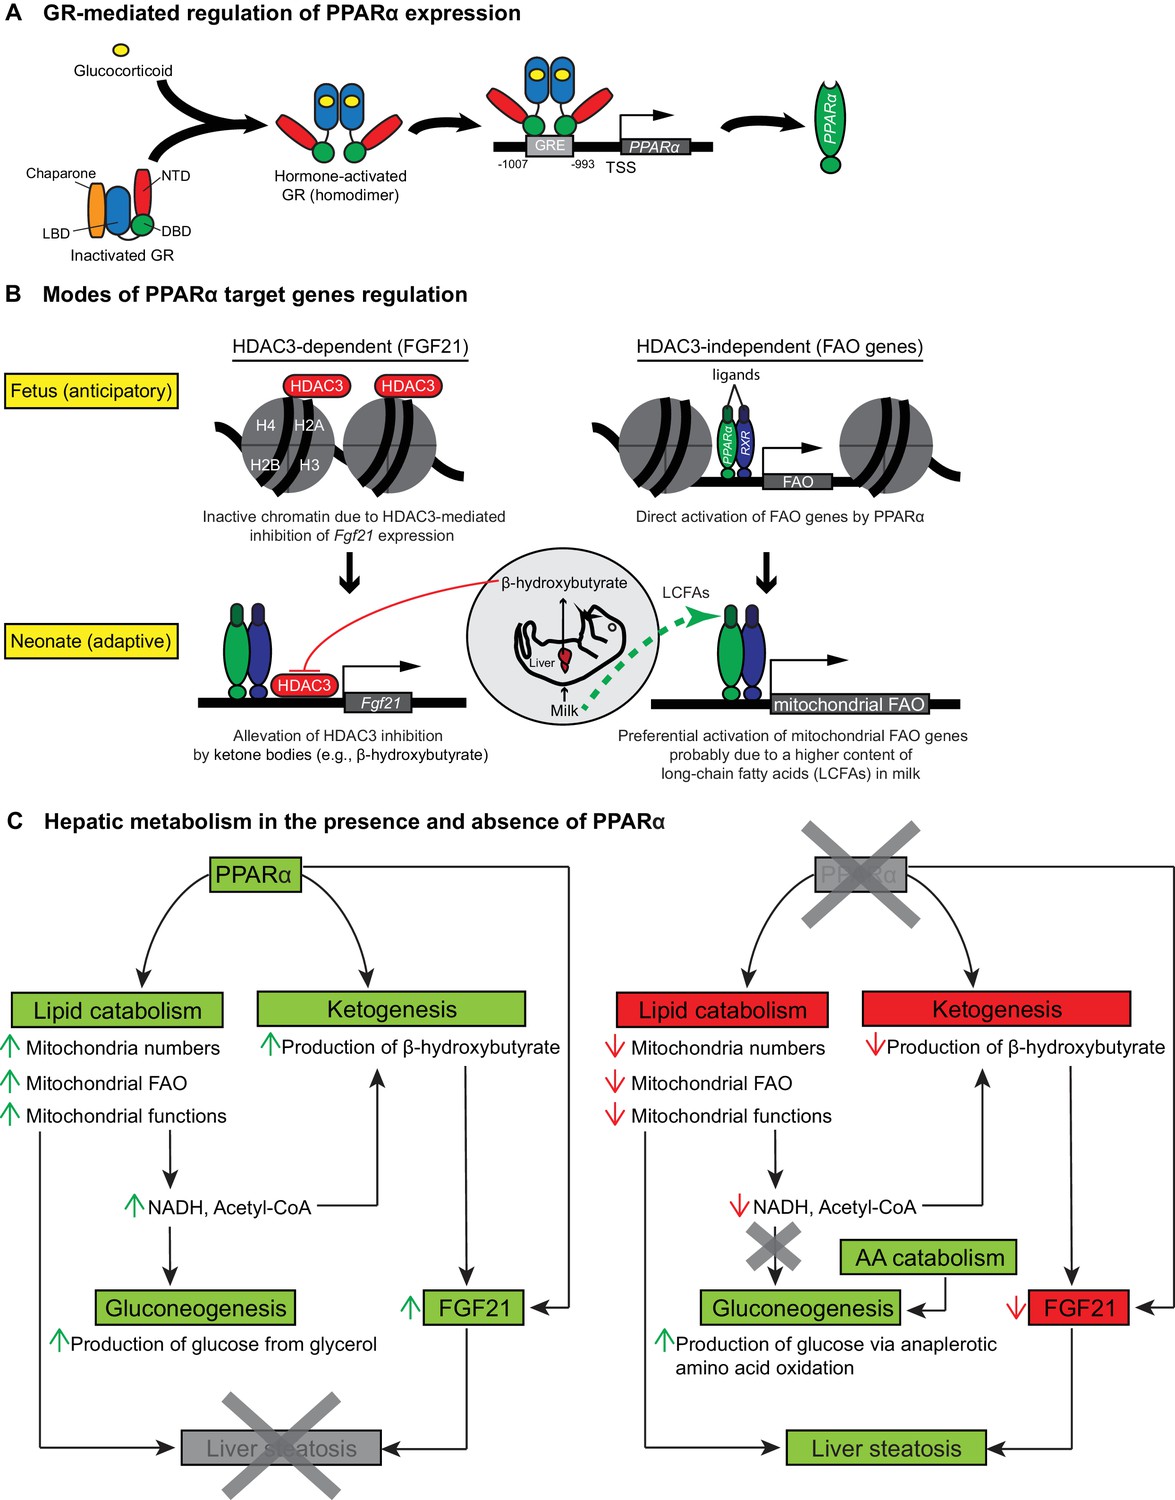
Schematic illustrations of GR-mediated regulation of PPARα expression, HDAC3-dependent and -independent regulation of PPARα target genes before and after birth, and the affected liver metabolic processes with or without PPARα.
(A) In fetal liver, hormone-activated GR binds to the GR response element (GRE) spanning -1007 to -993 within the PPARα promoter region to directly activate the transcription of Ppara. NTD: N-terminal domain, LBD: ligand-binding domain, DBD: DNA-binding domain. (B) At E19.5, direct binding of HDAC3 near the TSS of Fgf21 leads to the repression of Fgf21 transcriptional activity. Upon milk suckling, PPARα-dependent production of β-hydroxybutyrate from the neonatal liver alleviates the HDAC3-mediated repression of Fgf21 by directly inhibiting the activity of HDAC3, permitting PPARα-dependent Fgf21 expression. Activated GR leads to the stimulation of PPARα and its target genes in fetal liver, such as those involved in mitochondrial and peroxisomal fatty acid oxidation (FAO). After birth, the expression of PPARα target genes involved in mitochondrial FAO predominates the expression of genes involved in peroxisomal FAO, probably due to the higher long-chain fatty acid (LCFA) content than very-long-chain fatty acid (VLCFA) content in the milk. (C) Schematic illustration depicting the affected processes of hepatic metabolism in the presence and absence of PPARα. Green boxes/arrows indicate increments; reds indicate decrements.
Author response image 1
Tables
Table 1
Standard chow diet formulation.
| Manufacturer: SPECIALITY FEEDS Product ID: AIN93M | |||
|---|---|---|---|
Standard AIN93M rodent diet | |||
A semi-pure diet formulation for laboratory rats and mice based on AIN-93M. This formulation satisfies the maintenance nutritional requirements of rats and mice. Some modifications have been made to the original formulation to suit locally available raw materials.
| |||
| Calculated nutritional parameters | Ingredients | ||
| Protein | 13.6% | Casein (acid) | 140 g/kg |
| Total fat | 4.0% | Sucrose | 100 g/kg |
| Total digestible carbohydrate as defined by FSANZ Standard 1.2.8 | 64.8% | Canola oil | 40 g/kg |
| Cellulose | 50 g/kg | ||
| Crude fiber | 4.7% | Wheat starch | 472 g/kg |
| AD fiber | 4.7% | Dextrinised starch | 155 g/kg |
| Digestible energy | 15.1 MJ/kg | DL methionine | 1.8 g/kg |
| % Total calculated digestible energy from lipids | 9.0% | Calcium carbonate | 13.1 g/kg |
| % Total calculated digestible energy from protein | 15.0% | Sodium chloride | 2.6 g/kg |
| AIN93 trace minerals | 1.4 g/kg | ||
| Diet form and features | Potassium citrate | 1.0 g/kg | |
| Potassium dihydrogen phosphate | 8.8 g/kg | |
| Potassium sulphate | 1.6 g/kg | ||
| Choline chloride (75%) | 2.5 g/kg | ||
| AIN93 vitamins | 10 g/kg | ||
| Calculated amino acids | Calculated total vitamins | ||
| Valine | 0.90% | Vitamin A (retinol) | 4000 IU/kg |
| Leucine | 1.30% | Vitamin D (cholecalciferol) | 1000 IU/kg |
| Isoleucine | 0.60% | Vitamin E (α-tocopherol acetate) | 75 mg/kg |
| Threonine | 0.60% | Vitamin K (menadione) | 1 mg/kg |
| Methionine | 0.60% | Vitamin C (ascorbic acid) | None added |
| Cystine | 0.05% | Vitamin B1 (thiamine) | 6.1 mg/kg |
| Lysine | 1.00% | Vitamin B2 (riboflavin) | 6.3 mg/kg |
| Phenylanine | 0.70% | Niacin (nicotinic acid) | 30 mg/kg |
| Tyrosine | 0.70% | Vitamin B6 (pryridoxine) | 7 mg/kg |
| Tryptophan | 0.20% | Pantothenic acid | 16.5 mg/kg |
| Histidine | 0.42% | Biotin | 200 μg/kg |
| Calculated total minerals | Folic acid | 2 mg/kg | |
| Calcium | 0.47% | Inositol | None added |
| Phosphorus | 0.35% | Vitamin B12 (cyancobalamin) | 103 μg/kg |
| Magnesium | 0.09% | Choline | 1670 mg/kg |
| Sodium | 0.15% | Calculated fatty acid composition | |
| Chloride | 0.16% | Myristic acid 14:0 | No data |
| Potassium | 0.40% | Palmitic acid 16:0 | 0.20% |
| Sulphur | 0.17% | Stearic acid 18:0 | 0.10% |
| Iron | 75 mg/kg | Palmitoleic acid 16:1 | No data |
| Copper | 6.9 mg/kg | Oleic acid 18:1 | 2.40% |
| Iodine | 0.2 mg/kg | Gadoleic acid 20:1 | trace |
| Manganese | 19.5 mg/kg | Linoleic acid 18:2 n6 | 0.80% |
| Cobalt | No data | α-Linolenic acid 18:3 n3 | 0.40% |
| Zinc | 47 mg/kg | Arachidonic acid 20:4 n6 | No data |
| Molybdenum | 0.15 mg/kg | EPA 20:5 n3 | No data |
| Selenium | 0.3 mg/kg | DHA 22:6 n3 | No data |
| Cadmium | No data | Total n3 | 0.45% |
| Chromium | 1.0 mg/kg | Toal n6 | 0.76% |
| Fluoride | 1.0 mg/kg | Total mono-unsaturated fats | 2.46% |
| Lithium | 0.1 mg/kg | Total polyunsaturated fats | 1.21% |
| Boron | 3.1 mg/kg | Total saturated fats | 0.28% |
| Nickel | 0.5 mg/kg | ||
| Vanadium | 0.1 mg/kg | ||
-
Calculated data uses information from typical raw material composition. It could be expected that individual batches of diet will vary from this figure. Diet post treatment by irradiation or autoclave could change these parameters. We are happy to provide full calculated nutritional information for all of our products, however we would like to emphasise that these diets have been specifically designed for manufacture by Specialty Feeds.
Table 2
Primer sequences for mouse genes used in quantitative real-time PCR.
| Gene | Forward primer (5’-3’) | Reverse primer (5’-3’) |
|---|---|---|
| Acaa2 | ATGTGCGCTTCGGAACCAAA | CAAGGCGTATCTGTCACAGTC |
| Acetyl-coenzyme A acyltransferase 2/short chain-specific 3-ketoacyl-CoA thiolase (mitochondrial) | ||
| Acadl | TGCCCTATATTGCGAATTACGG | CTATGGCACCGATACACTTGC |
| Acyl-coenzyme A dehydrogenase, long chain | ||
| Acadvl | TGACCTTGGTGTTAGCGTTAC | CTGGGCCTTTGTGCCATAGAG |
| Acyl-coenzyme A dehydrogenase, very long chain | ||
| Acox1 | TCGAAGCCAGCGTTACGAG | ATCTCCGTCTGGGCGTAGG |
| Acyl-CoA oxidase 1, palmitoyl | ||
| Acsl1 | ACCAGCCCTATGAGTGGATTT | CAAGGCTTGAACCCCTTCTG |
| Acyl-CoA synthetase, long chain family member 1 | ||
| Angptl4 | TCCAACGCCACCCACTTAC | TGAAGTCATCTCACAGTTGACCA |
| Angiopoietin-like 4 | ||
| Cpt1a | CTATGCGCTACTCGCTGAAGG | GGCTTTCGACCCGAGAAGA |
| Carnitine palmitoyltransferase 1a (liver) | ||
| Cpt2 | CAAAAGACTCATCCGCTTTGTTC | CATCACGACTGGGTTTGGGTA |
| Carnitine palmitoyltransferase 2 | ||
| Cyp4a14 | TCATGGCGGACTCTGTCAATA | GCAGGCGAAAGAAAGTCAGG |
| Cytochrome P450, family 4, subfamily a, polypeptide 14 | ||
| Ehhadh | ACAGCGATACCAGAAGCCAG | TGGCAATCCGATAGTGACAGC |
| Enoyl-coenzyme A, hydratase/3-hydroxyacyl coenzyme A dehydrogenase | ||
| Fabp1 | AAGGCAGTCGTCAAGCTGG | CATTGAGTTCAGTCACGGACTT |
| Fatty acid bind protein 1 (liver) | ||
| Fgf21 | CTGCTGGGGGTCTACCAAG | CTGCGCCTACCACTGTTCC |
| Fibroblast growth factor 21 | ||
| Gck | AGACGAAACACCAGATGTATTCC | GAAGCCCTTGGTCCAGTTGAG |
| Glucokinase | ||
| Nr3c1 | CCGGGTCCCCAGGTAAAGA | TGTCCGGTAAAATAAGAGGCTTG |
| Glucocorticoid receptor | ||
| Hadha | AGCAACACGAATATCACAGGAAG | AGGCACACCCACCATTTTGG |
| Hydroxyacyl-coenzyme A dehydrogenase, alpha subunit | ||
| Hadhb | TGAATATGCACTGCGTTCTCAT | CCTTTCCTGGTACTTTGAAGGG |
| Hydroxyacyl-coenzyme A dehydrogenase, beta subunit | ||
| Hk1 | CGGAATGGGGAGCCTTTGG | GCCTTCCTTATCCGTTTCAATGG |
| Hexokinase 1 | ||
| Fkbp51 | TTTGAAGATTCAGGCGTTATCCG | GGTGGACTTTTACCGTTGCTC |
| FK506 binding protein 51 | ||
| Pex19 | GACAGCGAGGCTACTCAGAG | GCCCGACAGATTGAGAGCA |
| Peroxisomal biogenesis factor 19 | ||
| Ppara | TCGGCGAACTATTCGGCTG | GCACTTGTGAAAACGGCAGT |
| Peroxisome proliferator activated receptor alpha | ||
| Slc25a20 | GCGCCCATCATTGGAGTCA | CACACCAGATAACATCCCAGC |
| Solute carrier family 25 (mitochondrial carnitine/acylcarnitine translocase), member 20 | ||
| 36B4/RplP0 | CGAGGACCGCCTGGTTCTC | GTCACTGGGGAGAGAGAGG |
| Ribosomal protein P0 | ||
Table 3
Primer sequences for mouse genes used in chromatin immunoprecipitation.
| Gene | Forward primer (5’-3’) | Reverse primer (5’-3’) |
|---|---|---|
| ACOX1_TSS | TCCCGGAAAGATCACGTGAACC | TCCCCGAGCGGCTCCTCGCCA |
| ACOX1_PPRE | TAGCCAACGACAATGAACC | CGGAAACCAGAAGGGAATG |
| ANGPTL4_TSS | CCAGCAAGTTCATCTCGTCC | TCCCTCCCACTCCCACACC |
| CYP4A14_TSS | ATTCCCCCTCCCACAAGTAG | CCCATGGTTAGTAGTTTCTGGA |
| CYP4A14_PPRE | AAGGAAAAGGCCACCGTCTA | TCCATCTCACTGAACTTTACCC |
| FGF21_TSS | ATATCACGCGTCAGGAGTGG | TCCCCAGCTGAGAAGACACT |
| FGF21_PPRE | AGGGCCCGAATGCTAAGC | AGCCAAGCAGGTGGAAGTCT |
| PPARα_TSS | GTTGTCATCACAGCTTAGCG | CAGATAAGGGACTTTCCAGGTC |
| PPARα_GRE (−1007 to −993) | GGGACTCGGGGAACAAGCTGTGCGATCTAG | GGAAGGGTGCGCCTTGGCGCGCACTCC |
| PPARα_GRE (−2080 to −2066) | CTTTCCTCTCAATACAGTCTGTCAAACAAAA | GTTTTGTTTGTTTTGACTCTCTGTCCAG |
| PPARα_GRE (−2953 to −2939) | AAGGGTGAACACACTTTGTTTCCTGGATG | TCCACCAGGGCAGGGGAAGTAGGTATT |
Table 4
Control diet formulation.
| Manufacturer: KLIBA NAFAG, SWITZERLAND Product ID: 2222 | |
| Mouse and rat | Experimental diet, purified diet |
AIN-93G | |
| Major nutrients | |
| Dry matter | 90.0% |
| Crude protein | 18.0% |
| Crude fat | 7.0% |
| Crude fiber | 3.5% |
| Crude ash | 3.0% |
| Nitrogen-free extract (NFE) | 58.5% |
| Gross energy | 17.5 MJ/kg |
| Metabolic energy | 15.9 MJ/kg |
| Starch | 35.0% |
| Amino acids |
|
| Arginine | 0.65% |
| Lysine | 1.40% |
| Methionine | 0.50% |
| Methionine + cystine | 0.85% |
| Tryptophan | 0.22% |
| Threonine | 0.70% |
| Major mineral elements |
|
| Calcium | 0.52% |
| Phosphorus | 0.32% |
| Magnesium | 0.08% |
| Sodium | 0.22% |
| Potassium | 0.36% |
| Chlorine | 0.15% |
| Trace elements |
|
| Iron | 65 mg/kg |
| Zinc | 45 mg/kg |
| Copper | 6 mg/kg |
| Iodine | 0.6 mg/kg |
| Manganese | 12 mg/kg |
| Selenium | 0.2 mg/kg |
| Vitamins |
|
| Vitamin A | 4000 IU/kg |
| Vitamin D3 | 1000 IU/kg |
| Vitamin E | 100 mg/kg |
| Vitamin K3 | 4 mg/kg |
| Vitamin B1 | 6 mg/kg |
| Vitamin B2 | 6 mg/kg |
| Vitamin B6 | 7 mg/kg |
| Vitamin B12 | 0.05 mg/kg |
| Nicotinic acid | 30 mg/kg |
| Pantothenic acid | 16 mg/kg |
| Folic acid | 2 mg/kg |
| Biotin | 0.2 mg/kg |
| Choline | 1200 mg/kg |
| Ingredients |
|
| Corn starch, casein, dextrose, sucrose, refined soybean oil, cellulose, minerals, vitamins, amino acids |
|
| Remarks |
|
| - Experimental diet for mice and rats |
|
| - Given values are calculated averages in air-dry feed |
|
| - Production on demand |
|
| Delivery form |
|
| Pellets 10 mm round |
|
| 2222.PH.A05: |
|
| 5 kg in welded aluminium bag 2222.MA.A05: 5 kg in welded aluminium bag |
|
| KLIBA NAFAG | PROVIMI KLIBA AG | CH-4303 Kaiseraugst | Tel. +41 61 816 16 16 | Fax. +41 61 816 18 00 | kliba-nafag@provimi-kliba.ch | www.kliba-nafag.ch | |
Table 5
High-fat diet formulation.
| Manufacturer: KLIBA NAFAG, SWITZERLAND Product ID: 2201 | |
|---|---|
| Mouse and rat | Experimental diet, purified diet |
Ketogenic diet XL75:XP10 | |
| Major nutrients | |
| Dry matter | 99.1% |
| Crude protein | 9.9% |
| Crude fat | 74.4% |
| Crude fiber | 5.5% |
| Crude ash | 6.3% |
| Nitrogen-free extract (NFE) | 3.0% |
| Metabolic energy | 7208 kcal/kg |
| Starch | 0.7% |
| Amino acids | |
| Arginine | 0.35% |
| Lysine | 0.79% |
| Methionine | 0.28% |
| Methionine + cystine | 0.90% |
| Tryptophan | 0.13% |
| Threonine | 0.38% |
| Major mineral elements | |
| Calcium | 0.98% |
| Phosphorus | 0.61% |
| Magnesium | 0.15% |
| Sodium | 0.40% |
| Potassium | 0.69% |
| Chlorine | 0.57% |
| Trace elements | |
| Iron | 151 mg/kg |
| Zinc | 97 mg/kg |
| Copper | 16 mg/kg |
| Iodine | 1.4 mg/kg |
| Manganese | 31 mg/kg |
| Selenium | 0.6 mg/kg |
| Vitamins | |
| Vitamin A | 8000 IU/kg |
| Vitamin D3 | 2000 IU/kg |
| Vitamin E | 200 mg/kg |
| Vitamin K3 | 9 mg/kg |
| Vitamin B1 | 12 mg/kg |
| Vitamin B2 | 13 mg/kg |
| Vitamin B6 | 14 mg/kg |
| Vitamin B12 | 0.1 mg/kg |
| Nicotinic acid | 66 mg/kg |
| Pantothenic acid | 32 mg/kg |
| Folic acid | 5 mg/kg |
| Biotin | 0.4 mg/kg |
| Choline | 1975 mg/kg |
| Ingredients | |
| Beef fat, casein, cellulose, minerals, vitamins, amino acids | |
| Remarks | |
| - Experimental diet for mice and rats | |
| - Given values are calculated averages in air-dry feed | |
| - Production on demand | |
| Delivery form | |
| Paste | |
| 2201.MA.A05: | |
| 5 kg in welded aluminium bag | |
| KLIBA NAFAG | PROVIMI KLIBA AG | CH-4303 Kaiseraugst | Tel. +41 61 816 16 16 | Fax. +41 61 816 18 00 | kliba-nafag@provimi-kliba.ch | www.kliba-nafag.ch | |
Download links
A two-part list of links to download the article, or parts of the article, in various formats.
Downloads (link to download the article as PDF)
Open citations (links to open the citations from this article in various online reference manager services)
Cite this article (links to download the citations from this article in formats compatible with various reference manager tools)
Glucocorticoid receptor-PPARα axis in fetal mouse liver prepares neonates for milk lipid catabolism
eLife 5:e11853.
https://doi.org/10.7554/eLife.11853


