Human cytomegalovirus IE1 protein alters the higher-order chromatin structure by targeting the acidic patch of the nucleosome
- Chinese Academy of Sciences, China
- University of Chinese Academy of Sciences, China
Figures
Figure 1 with 1 supplement
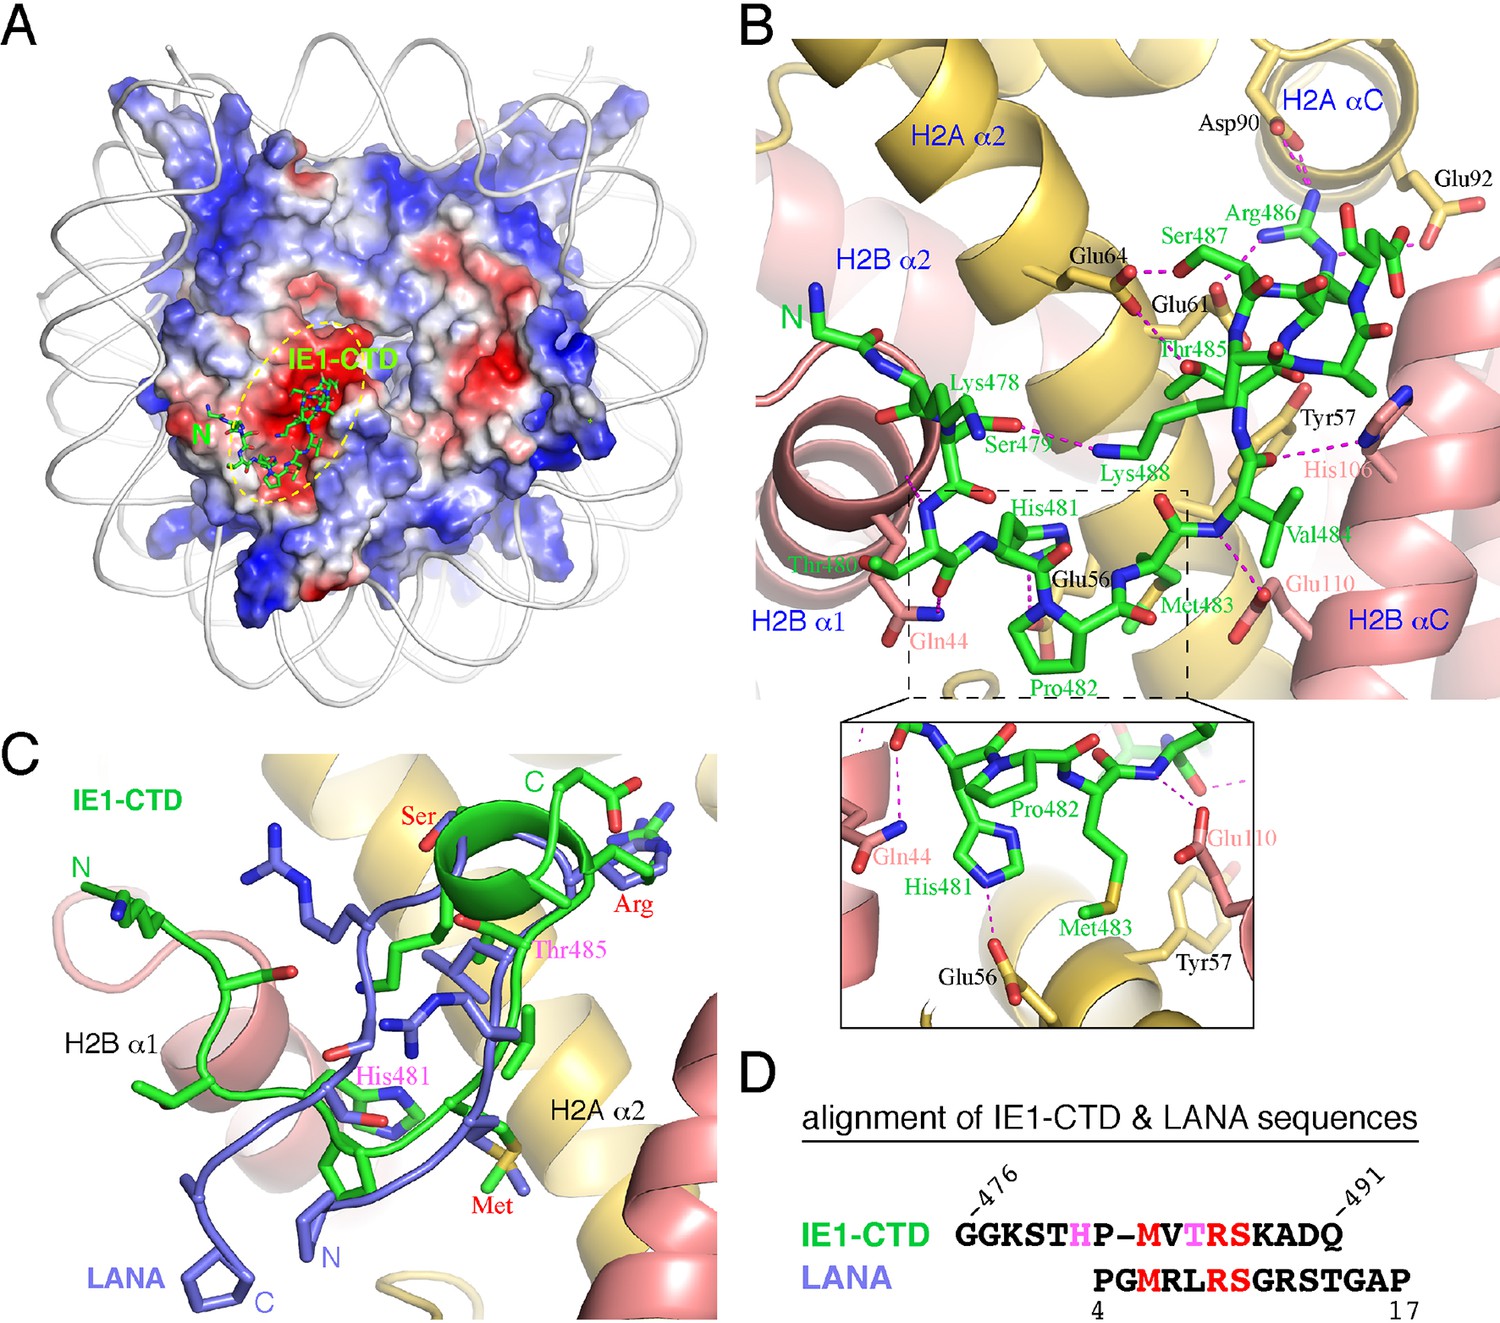
Structure of the IE1-CTD–NCP complex.
(A) Location of the IE1-CTD binding site on the acidic patch of the nucleosomal surface. The histone octamer is shown as a surface representation colored according to electrostatic potential distribution (positive, blue; neutral, white; negative, red). DNA is shown as a cartoon colored white, and IE1-CTD is shown as a stick model. (B) A detailed view of the interaction between IE1-CTD and NCP. Histones H2A and H2B are shown in a ribbon representation superimposed with selected residues (in sticks) involved in interaction with IE1-CTD. Dashed lines indicate hydrogen bonds. An enlarged view of the region surrounding His481 of IE1-CTD is shown in an inset at the bottom of the figure. (C) Superposition of IE1-CTD and LANA. Both peptides are shown as a ribbon representation superimposed with sidechains (IE1-CTD, green; LANA, blue). (D) Structure-based alignment of IE1-CTD and LANA sequences. Residues colored in red are involved in similar interactions with the histones, and the two residues colored in magenta are engaged in IE1-CTD-specific interactions with histone H2A.
Figure 1—figure supplement 1
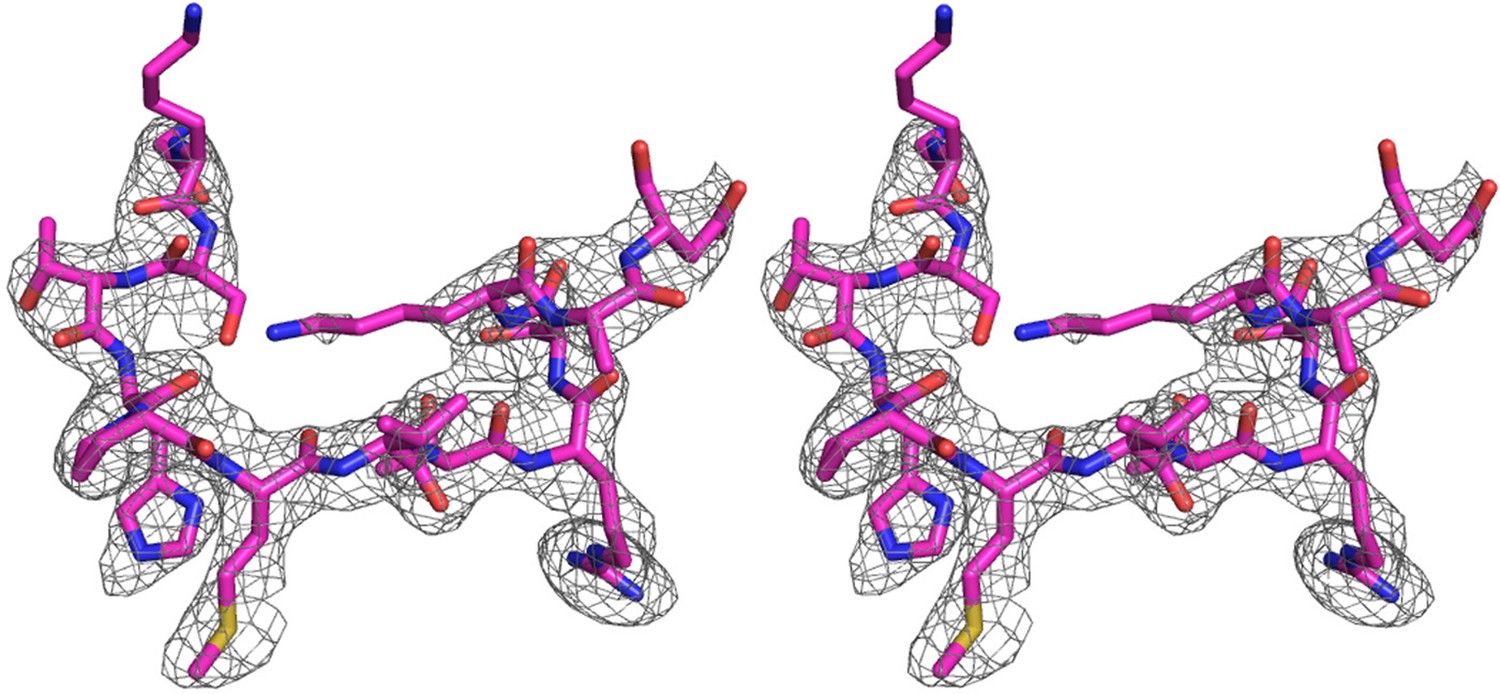
An omit electron density map of the bound IE1-CTD.
A stereo view of the simulated annealing (Fo-Fc) omit map showing the presence of IE1-CTD. The map is contoured at 2.5 σ level. A stick model of IE1-CTD is superimposed.
Figure 2

Comparison of protein binding modes to the acidic patch of NCP.
All NCP-binding peptides or protein segments, shown in a stick model superimposed onto a cartoon representation of the backbone, were superimposed onto the structure of NCP, shown in a surface representation colored according to electrostatic potential, of the IE1-CTD complex based on alignment of NCP structures. (A) The binding of IE1-CTD to NCP. (B) LANA (PDB id: 1ZLA). (C) RCC1 segment (PDB id: 3MVD). The green ovals indicate distinct binding zones of the acidic patch. The protruding ridge at the junction between zone I and zone II is also labeled. (D) Sir3 (PDB1d: 4KUD). (E) CENP-C (PDB id: 4X23). (F) PRC1-RING1B (PDB id: 4R8P).
Figure 3 with 1 supplement
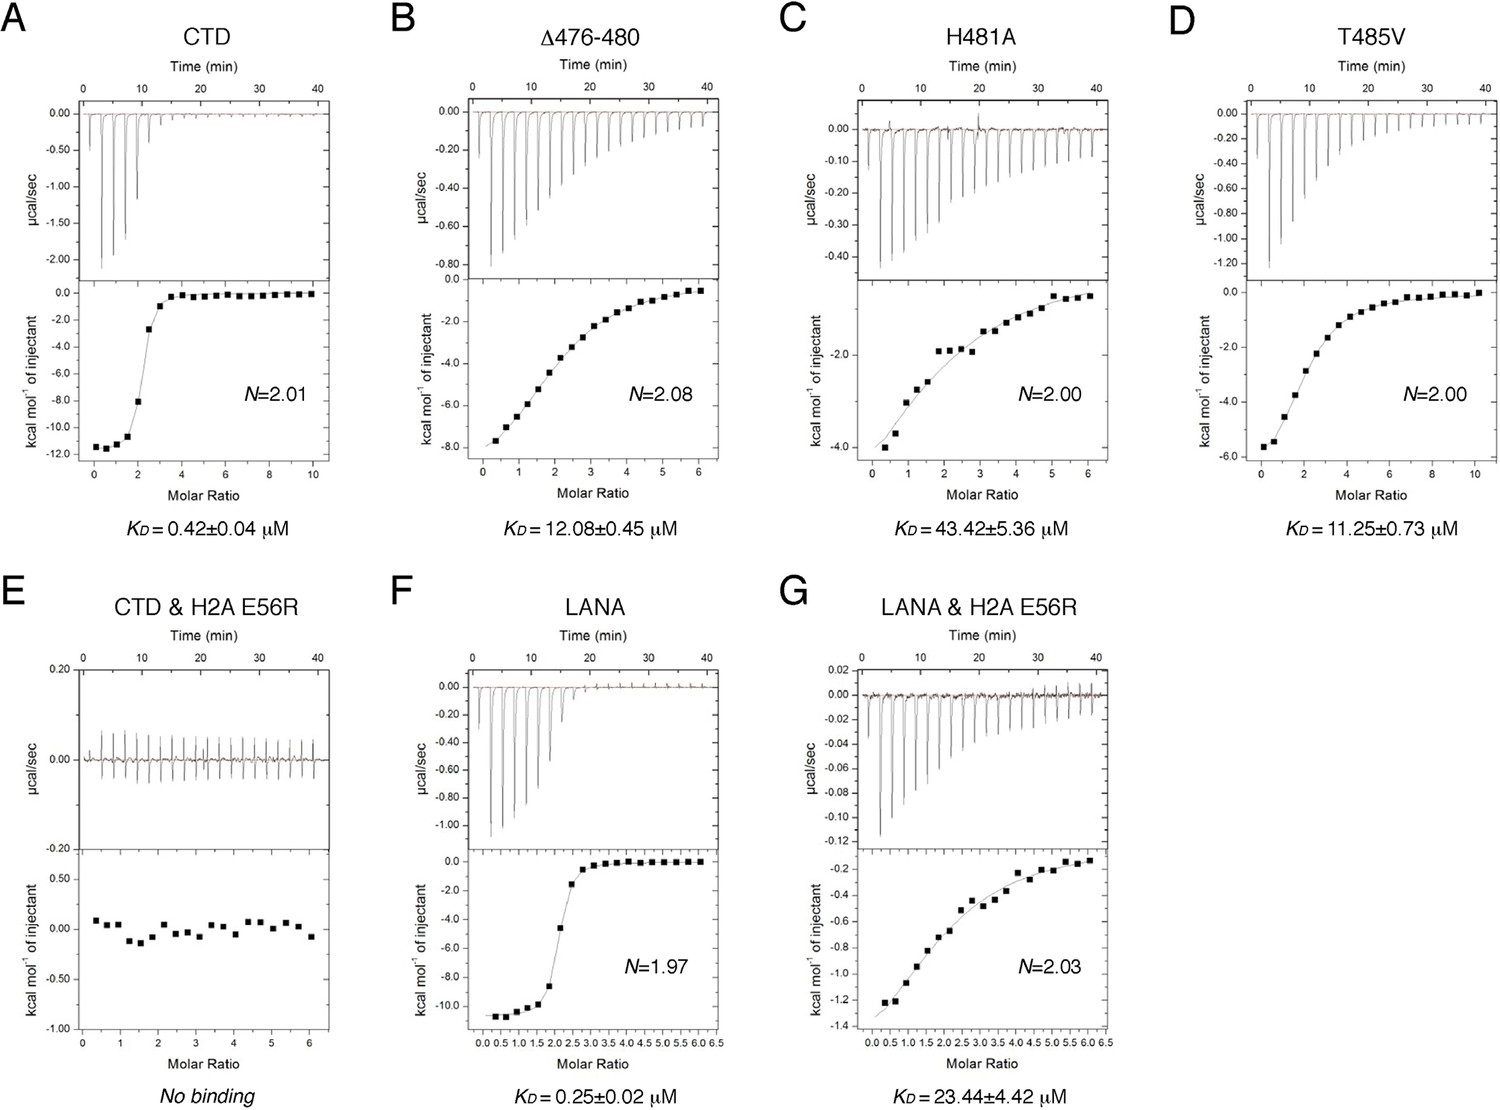
ITC measurements of peptide-NCP binding affinities.
(A–G) Raw data and fitting curves of the integrated data for the indicated peptides and NCPs are shown together with the derived KD values and fitting errors.
Figure 3—figure supplement 1
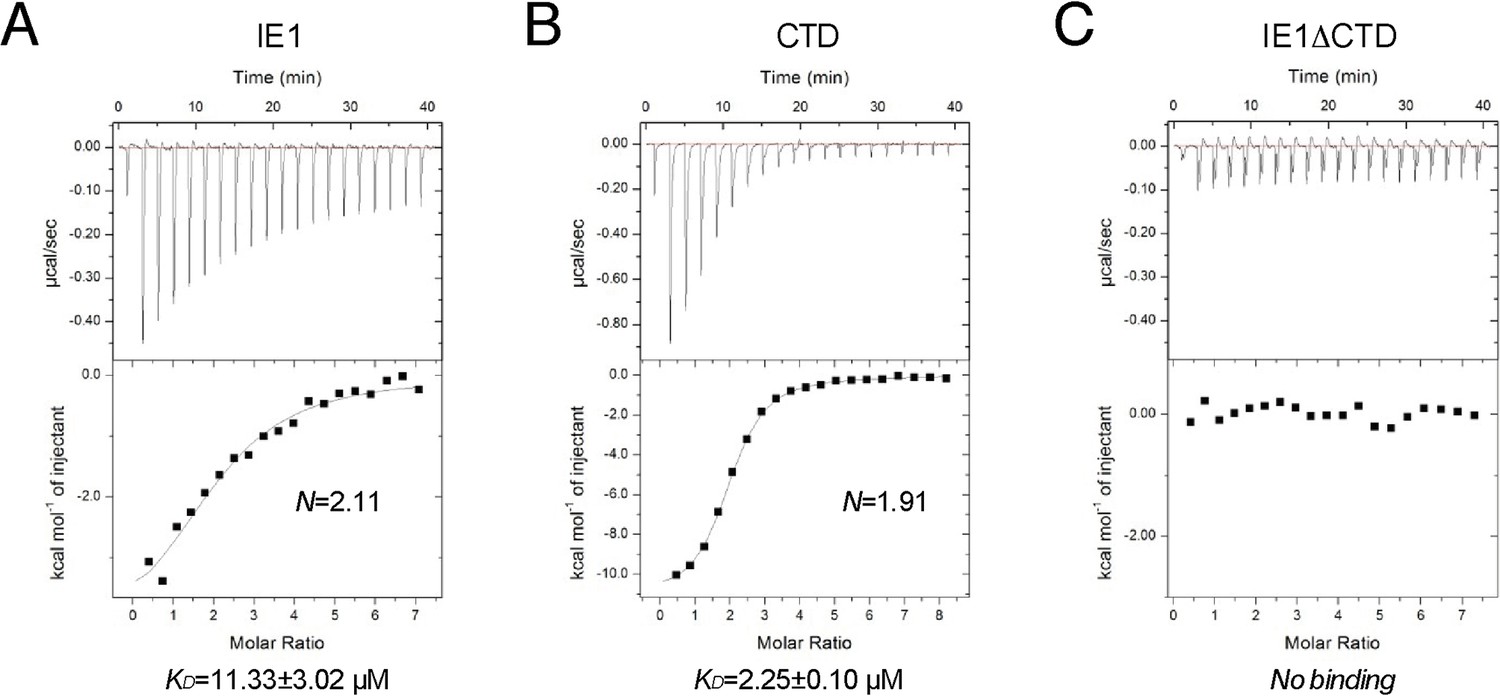
Binding of full-length IE1 to NCP.
Bindings of full-length IE1 (A), IE1-CTD (B), and IE1 lacking CTD (C) are measured by ITC at 150 mM NaCl concentration.
Figure 4 with 1 supplement

Influence of IE1-CTD on higher-order chromatin structure.
(A) AUC analyses showing that IE1-CTD has little effect on the folding of the 10-nm nucleosomal array. Green and black data points represent that of 10-nm nucleosomal arrays in the absence and presence of IE1-CTD, respectively. In contrast, sedimentation profile of the 30-nm chromatin fiber reconstituted in the presence of linker histone H1 (blue squares) was shifted with the addition of IE1-CTD (red dots). (B) Full-length IE1 shares the property of IE1-CTD in selectively altering the folding of the 30-nm chromatin fiber. (C) A truncation variant of IE1 lacking CTD (IE1ΔC) does not alter chromatin structure. (D–F) Indicated IE1-CTD mutants retain the ability to impact the folding of the 30-nm chromatin fiber. (G) An E56R mutant of histone H2A renders IE1-CTD ineffective in altering the structure of the 30-nm chromatin fiber. (H) LANA-CTD (red dots) does not affect the folding of the 30-nm chromatin fiber. Instead, the 10-nm nucleosome array appears to be slightly affected with the addition of LANA-CTD peptide.
Figure 4—figure supplement 1
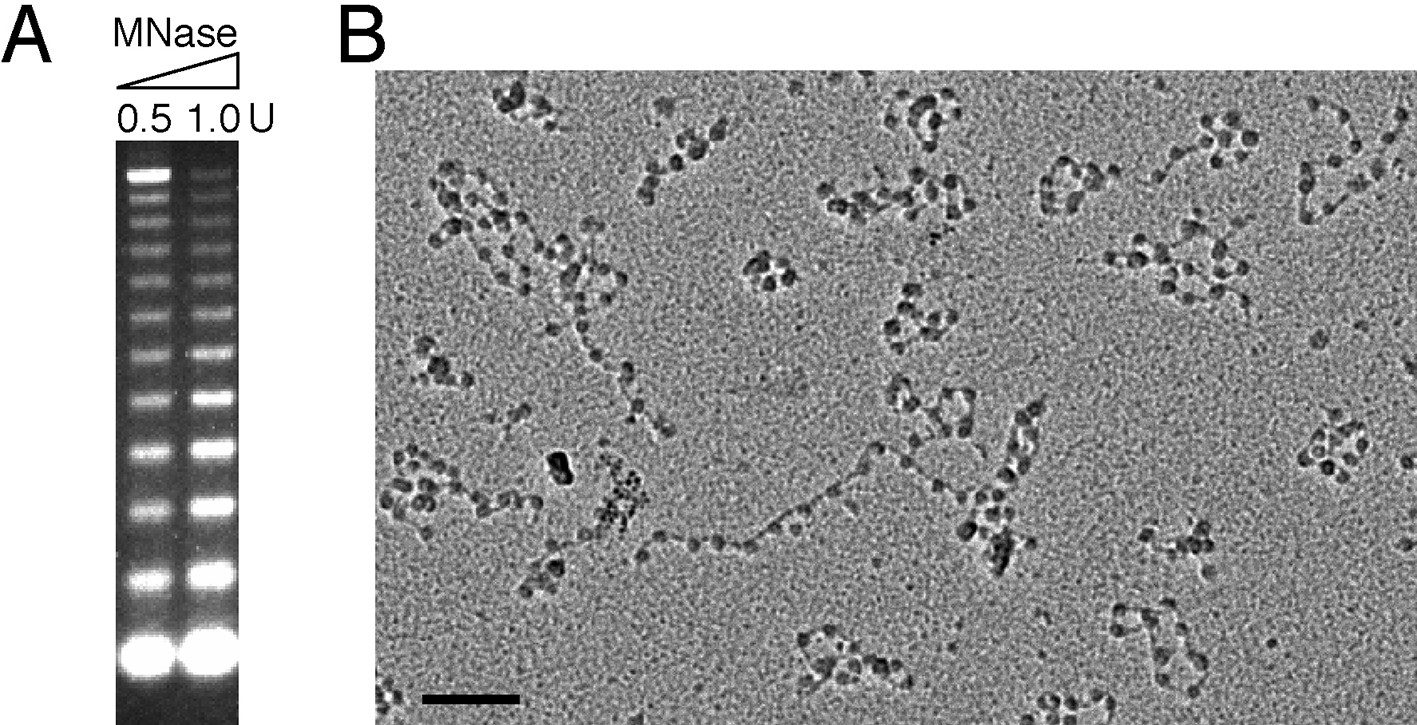
Assessment of the quality of reconstituted nucleosomal array.
(A) Nucleosomal arrays corresponding to ~1 μg DNA were cleaved with indicated amount of micrococcal nuclease (MNase). (B) EM analysis of the reconstituted nucleosomal array (Bar: 100 nm).
Tables
Table 1
Statistics of crystallographic analysis.
| Data collection statistics | |
| wavelength (Å) | 1.0308 |
| space group | P212121 |
| unit cell (Å) | a = 106.70, b = 109.47, c = 181.98 |
| resolution (Å) | 30.00–2.80 (2.90–2.80) |
| Rmerge | 0.133 (0.611) |
| I/σI | 12.5 (3.3) |
| Completeness (%) | 99.9 (100.0) |
| Total/Unique reflections | 346679/52496 |
| Refinement statistics | |
| Rwork/Rfree | 0.195/0.244 |
| rmsd bonds (Å) | 0.008 |
| rmsd angles (º) | 0.935 |
| No. of Atoms | |
| Protein | 6116 |
| DNA | 5982 |
| Peptide | 104 |
| Ion | 4 |
| Water | 230 |
| B factor (Å2) | |
| Protein | 35.9 |
| DNA | 87.8 |
| Peptide | 56.9 |
| Ion | 47.5 |
| Water | 36.0 |
| Ramachandran plot | |
| favored | 750 (98.7%) |
| allowed | 8 (1.1%) |
| outlier | 2 (0.3%) |
Download links
A two-part list of links to download the article, or parts of the article, in various formats.
Downloads (link to download the article as PDF)
Open citations (links to open the citations from this article in various online reference manager services)
Cite this article (links to download the citations from this article in formats compatible with various reference manager tools)
Human cytomegalovirus IE1 protein alters the higher-order chromatin structure by targeting the acidic patch of the nucleosome
eLife 5:e11911.
https://doi.org/10.7554/eLife.11911


