Probing the catalytic functions of Bub1 kinase using the small molecule inhibitors BAY-320 and BAY-524
- University of Basel, Switzerland
- Bayer Pharma AG, Germany
Figures
Figure 1 with 1 supplement
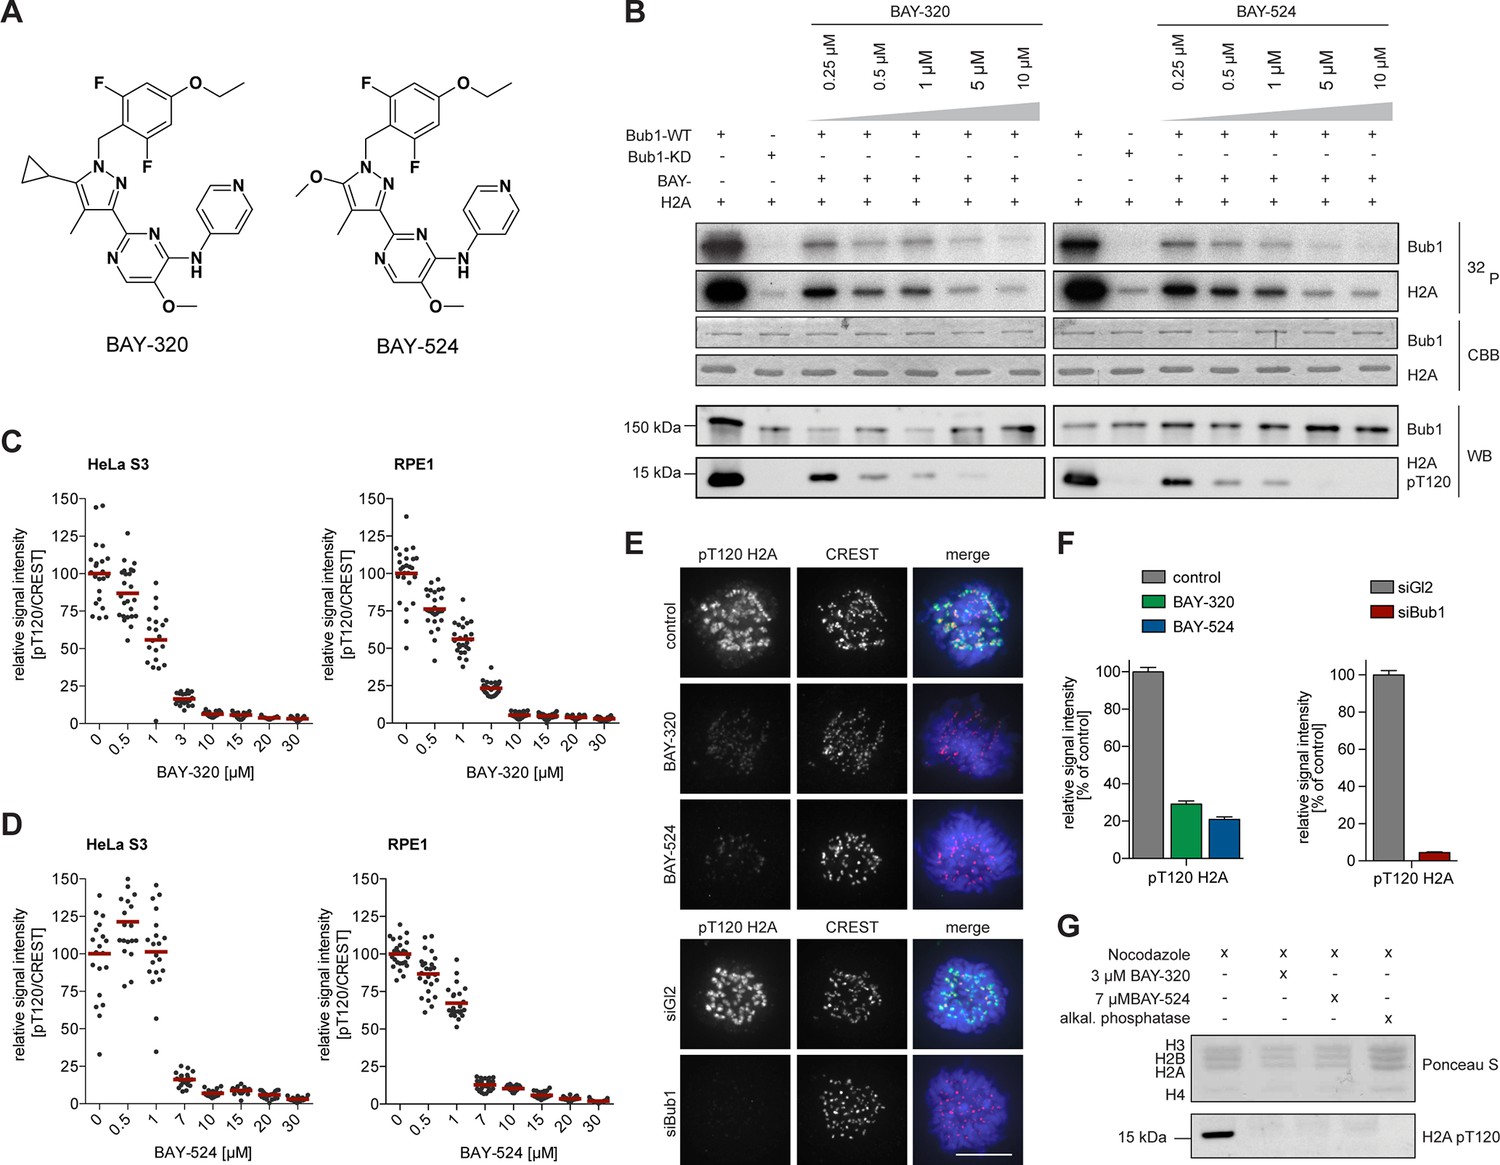
BAY-320 and BAY-524 inhibit Bub1 kinase.
(A) Chemical structure of ATP-competitive inhibitors BAY-320 and BAY-524. (B) In vitro kinase assays showing dose-dependent inhibition of Bub1 kinase activity towards histone H2A. The assays were performed by mixing human wild-type (WT) or kinase-dead (KD) LAP-Bub1, ectopically expressed in and purified from mitotic HEK 293T cells, with recombinantly expressed histone H2A as a substrate, γ-32P-ATP and increasing doses of the Bub1 inhibitors BAY-320 and BAY-524. After 30 min at 30°C, reactions were stopped and analyzed by gel electrophoresis. Bub1 autophosphorylation and H2A phosphorylation were visualized by autoradiography (32P) and protein levels monitored by Coomassie brilliant blue staining (CBB). Histone H2A-T120 phosphorylation (pT120-H2A) was detected by phospho-antibody probing of Western blots (WB) and Bub1 was monitored as control. (C, D) Inhibition of Bub1 reduces histone H2A-T120 phosphorylation. Asynchronous cultures of HeLa S3 (left panels) and RPE1 cells (right panels) were treated with the proteasomal inhibitor MG132 for 2 hr, followed by the addition of 3.3 μM nocodazole and increasing doses of BAY-320 (C) or BAY-524 (D) for 1 hr. The cells were fixed and analyzed by immunofluorescence microscopy (IFM). Scatter plots show centromeric levels of pT120-H2A (n = 19–28 cells per condition). Bars represent mean values. (E) HeLa S3 cells were synchronized by thymidine block, released for 10 hr in the presence of solvent (control), 3 μM BAY-320 or 7 μM BAY-524 and analyzed by quantitative IF (top panels). Cells transfected with mock (Gl2) or Bub1 siRNA-oligonucleotides for 48 hr were synchronized and analyzed in parallel (bottom panels). The cells were stained with antibodies raised against Bub1 and pT120-H2A. Human CREST serum was used to identify centromeres and DNA was stained with DAPI; scale bars represent 10 µm. (F) Histograms showing the average signal intensities of centromeric pT120-H2A observed in the experiments described in (E); n = 73–107 cells per condition. Error bars represent standard error of the mean (SEM). (G) To monitor the efficacy of Bub1 kinase inhibition within cells, HeLa S3 cells were synchronized by thymidine block and released for 14 hr in the presence of 3.3 μM nocodazole as well as Bub1 inhibitors or solvent as indicated. Prometaphase-arrested cells were harvested by shake-off and mitotic cell extracts were treated with or without phosphatase inhibitor for 30 min at 30°C. Histone isolation was followed by Western blot analysis of pT120-H2A. Equal loading was monitored by Ponceau S staining.
Figure 1—figure supplement 1
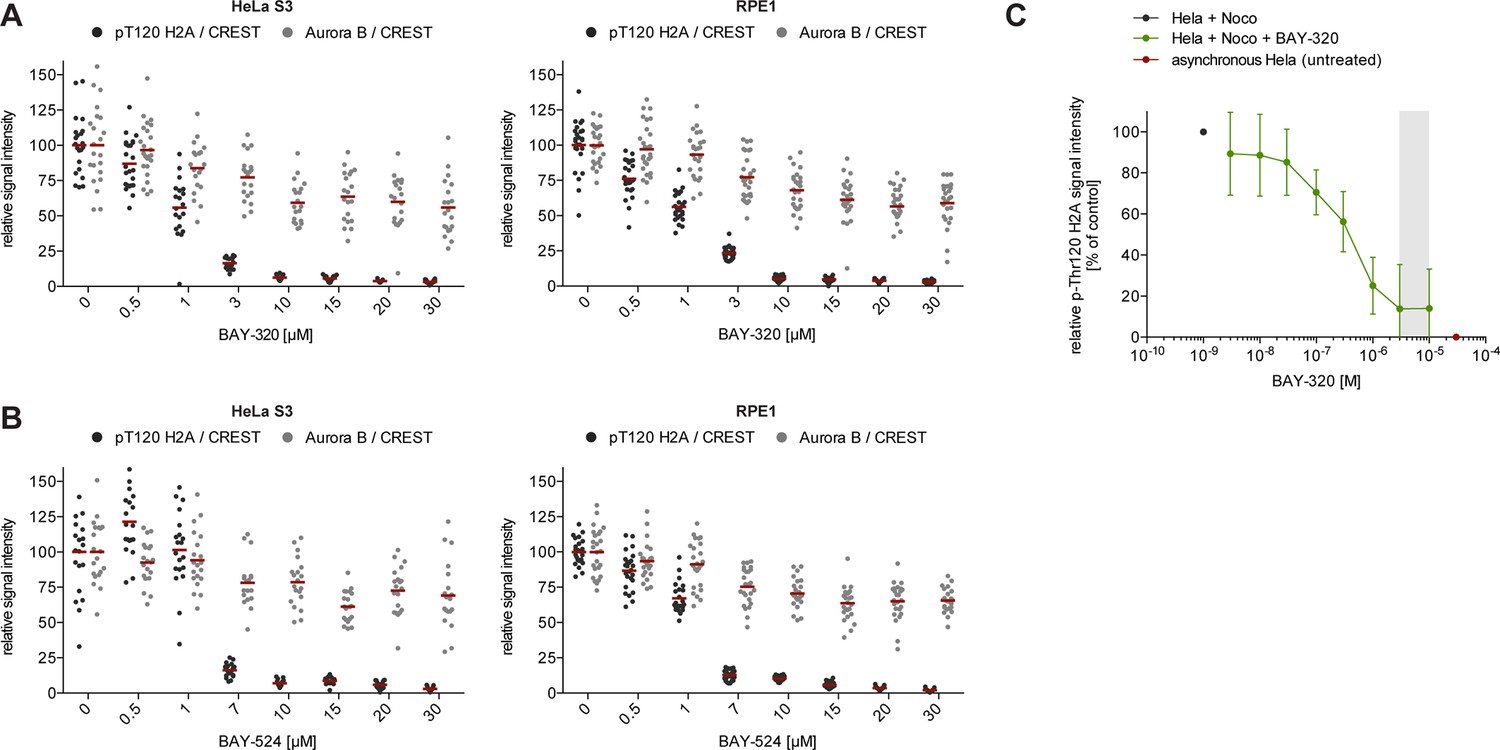
BAY-320 and BAY-524 inhibit Bub1 kinase.
(A, B) BAY-320 and BAY-524 treatment coordinately reduces histone H2A-T120 phosphorylation as well as Aurora B centromere/KT binding, until maximal Bub1 inhibition is reached at 10 μM. Asynchronous cultures of HeLa S3 (left panels) and RPE1 cells (right panels) were treated with the proteasomal inhibitor MG132 for 2 hr, followed by the addition of 3.3 μM nocodazole and increasing doses of BAY-320 (A) or BAY-524 (B) for 1 hr. The cells were fixed and analyzed by immunofluorescence microscopy (IFM). Scatter plots show centromere/KT levels of pT120-H2A and Aurora B (n = 19–28 cells per condition). Bars represent mean values. (C) Untreated HeLa cells (red) or HeLa cells treated with nocodazole for 16 hr, followed by various concentrations of BAY-320 (green) or solvent (black) for 1 hr, were fixed and analyzed by quantitative in-cell western. Plot shows total pT120-H2A signal intensity. Grey area highlights the concentration range between 3 and 10 μM. The IC50 (reflecting the inhibition of Bub1 kinase activity compared to control and normalized to cell number) was determined to be 379 +/- 156 nM.
Figure 2 with 1 supplement
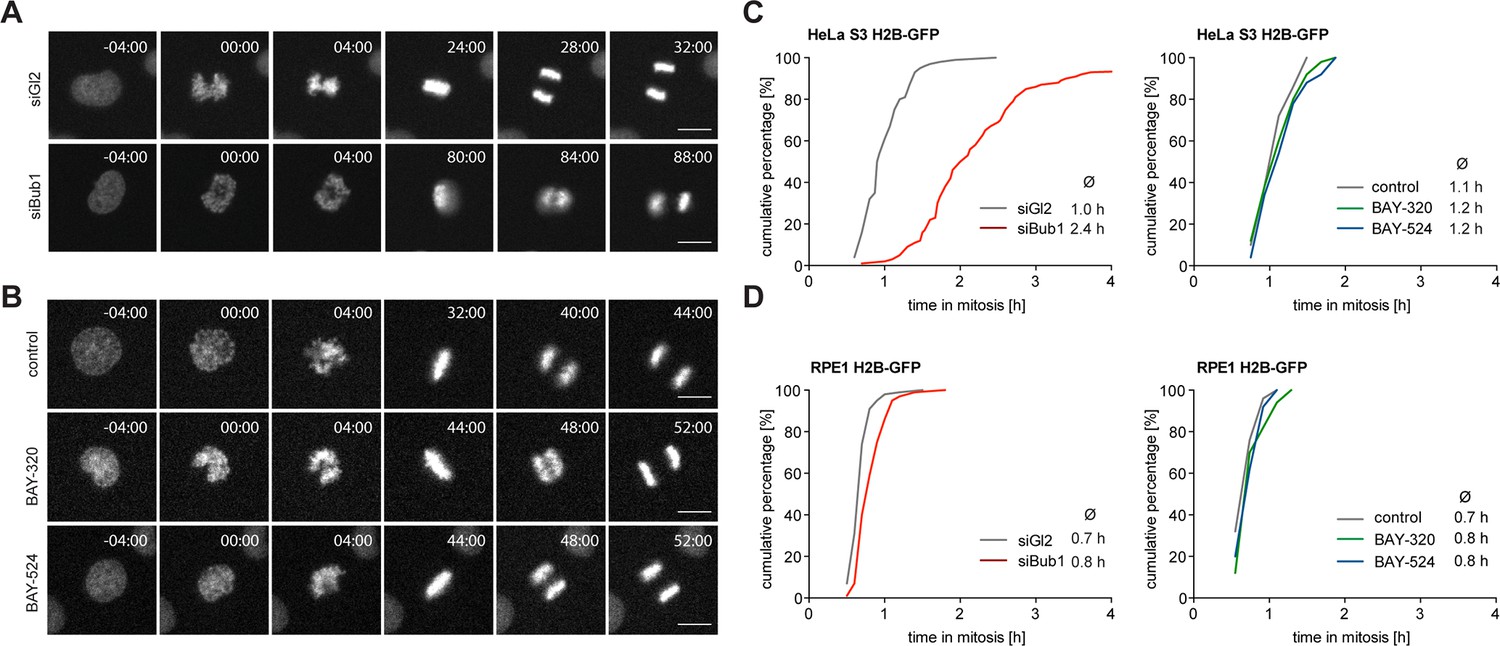
Inhibition of Bub1 kinase activity barely affects mitotic progression.
(A, B) Representative stills from time-lapse recordings of asynchronously growing cultures of HeLa S3 cells stably expressing GFP-tagged histone H2B. The cells were either treated with Bub1 inhibitors (3 μM BAY-320 and 7 μM BAY-524) or transfected with control (Gl2) or Bub1 siRNA for 48 hr prior to time-lapse microscopy. Scale bars represent 10 µm. (C, D) Graphs show the cumulative frequency of mitotic duration determined by cell rounding/flattening. Indicated averages represent the time spent in mitosis (n = 100 cells per condition).
Figure 2—figure supplement 1
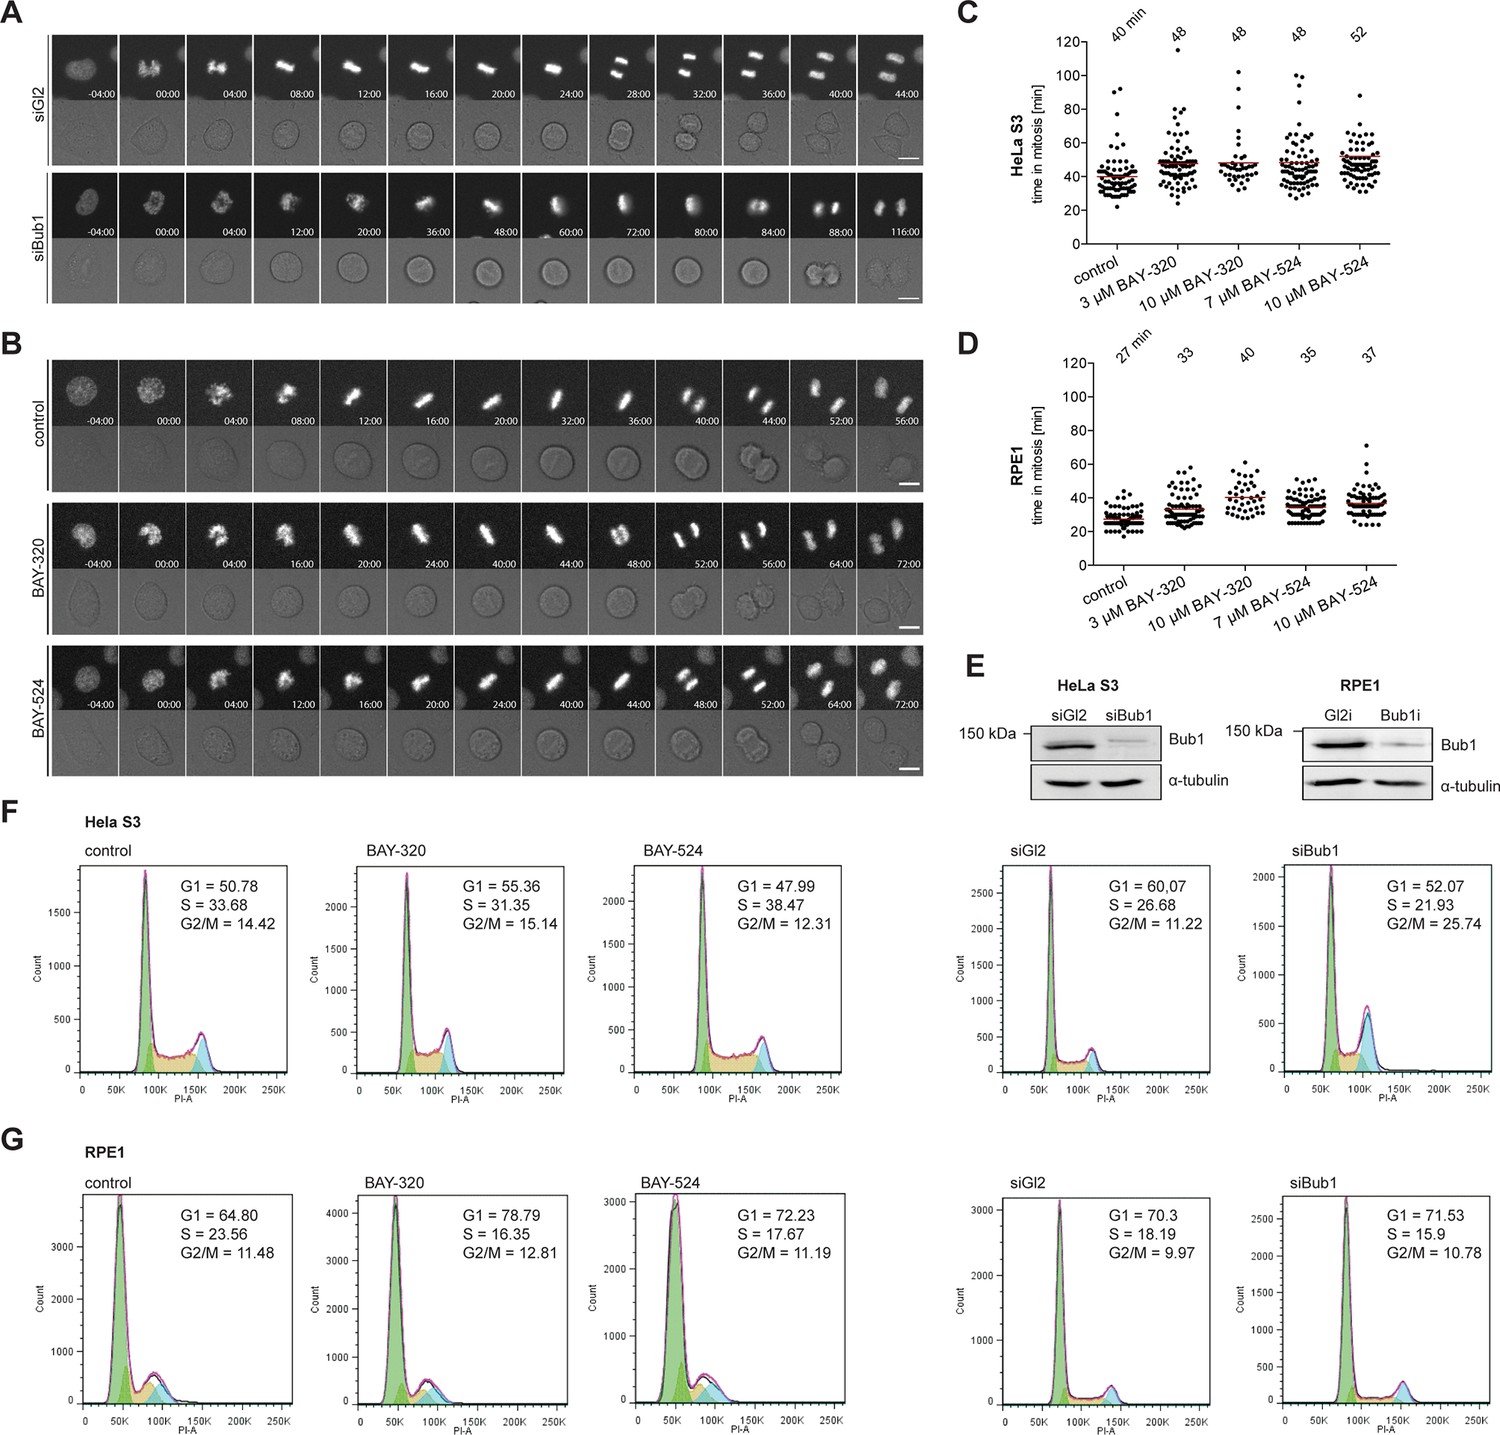
Inhibition of Bub1 kinase activity barely affects mitotic progression.
(A, B) Representative stills from time-lapse recordings described in Figure 2. Micrographs show fluorescence or DIC images of HeLa S3 cells stably expressing GFP-tagged histone H2B. Time is indicated relative to mitotic entry. (C, D) Hela S3 cells stably expressing GFP-H2B were treated with solvent (control) or Bub1 inhibitors at indicated doses and monitored by fluorescence time-lapse imaging. Dot plots show the time from mitotic entry to anaphase onset; bars represent mean values (n = 80 cells per condition). (E) Representative Western blots show Bub1 depletion efficiencies. Asynchronous cultures of HeLa S3 or RPE1 cells were transfected with control (Gl2) or Bub1 siRNA-oligonucleotides for 48 hr, harvested and analyzed by Western blotting; α-tubulin served as loading control. (F, G) Cell cycle distribution of exponentially growing HeLa S3 (F) and RPE1 (G) cells upon treatment with solvent (control), 3 μM BAY-B320, 7 μM BAY-B524 or after Bub1 protein depletion (siGl2 served as control). After 48 hr of treatment or siRNA oligonucleotide transfection cells were permeabilized and DNA was stained with propidium iodide. Cellular DNA content was determined using flow cytometry and frequencies of G1, S and G2/M phases were determined. Considering that Bub1 inhibition did not influence cell cycle profiles in HeLa and RPE1 cells and that the increase in the G2/M population after depletion of Bub1 from HeLa cells correlated with an increase in mitotic duration (Figure 2), we anticipate that the increase in the corresponding G2/M population mostly reflects mitotic cells.
Figure 3 with 1 supplement
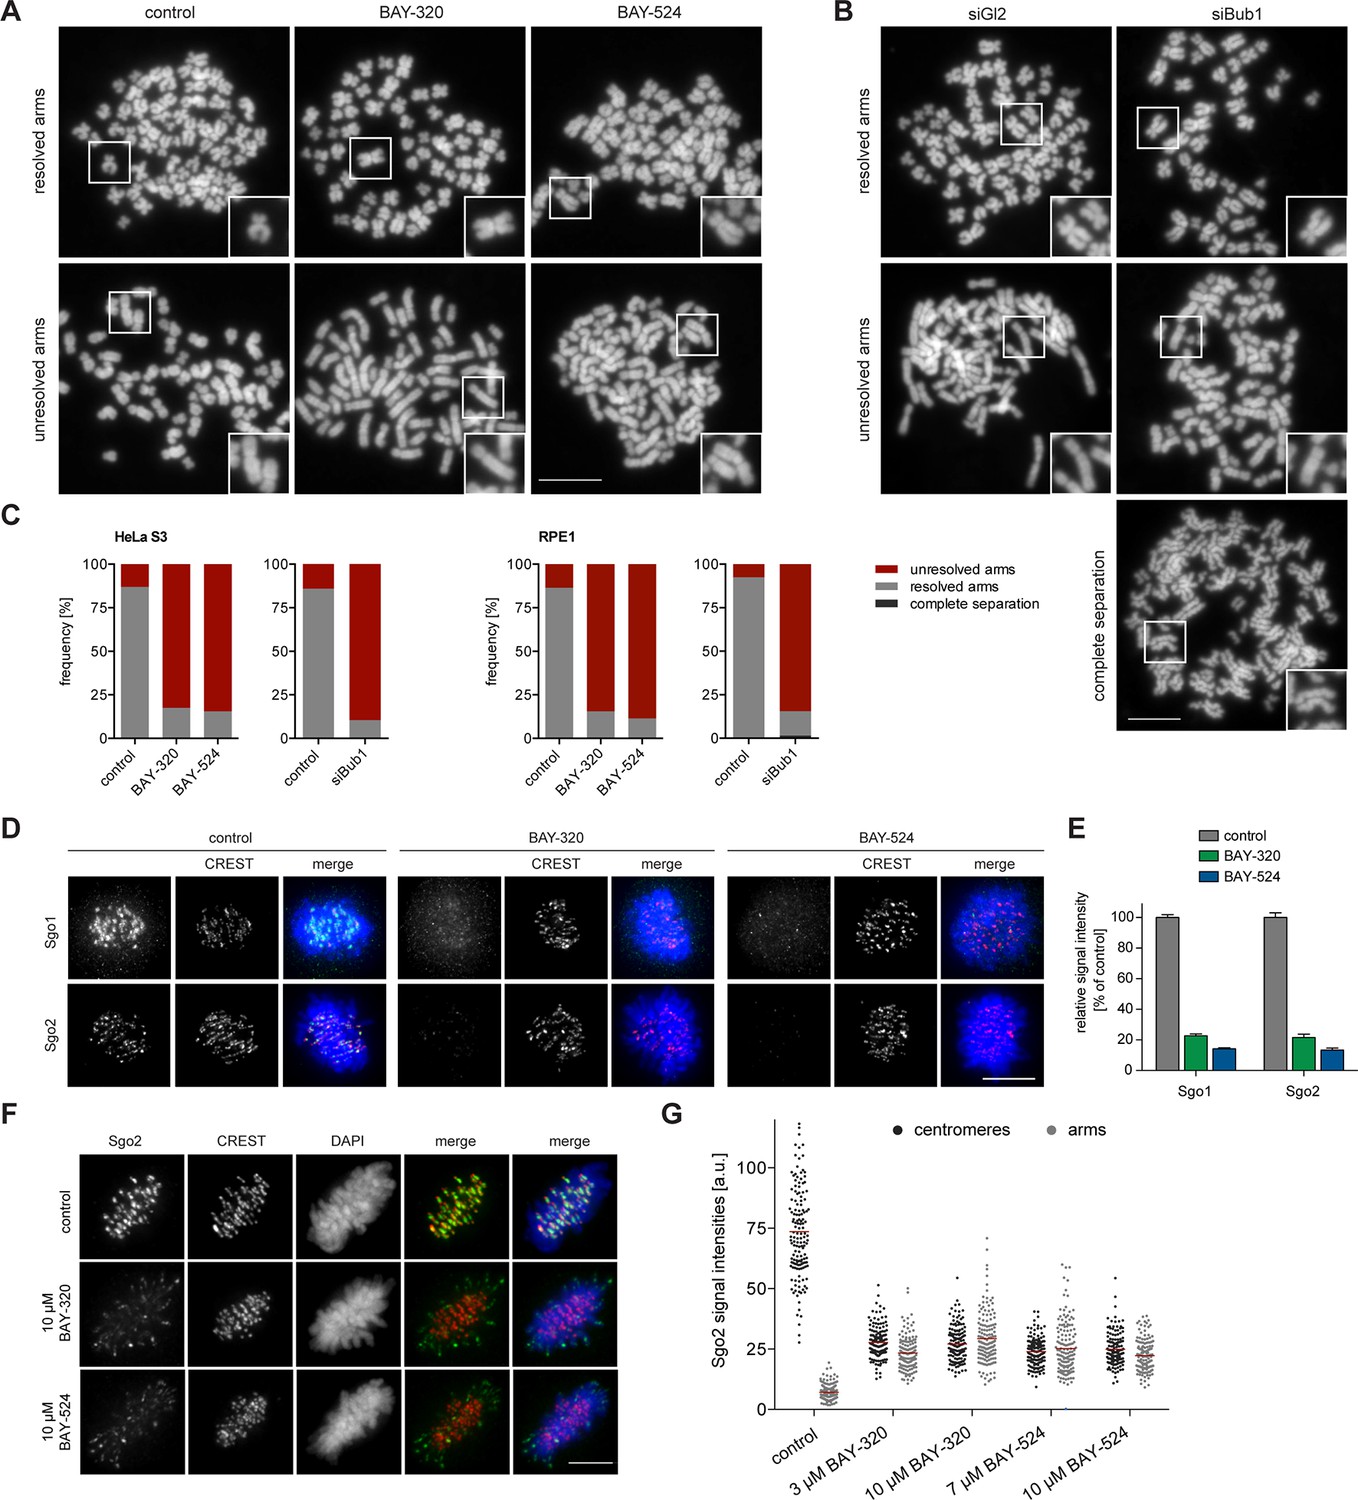
Inhibition of Bub1 affects Sgo1 and Sgo2 localization and chromatid cohesion.
(A, B) HeLa S3 cells were synchronized by thymidine block and released for 12 hr in the presence of 3.3 μM nocodazole as well as solvent (control), 3 μM BAY-320 or 7 μM BAY-524. Cells transfected with mock (Gl2) or Bub1 siRNA-oligonucleotides for 48 hr were synchronized and analyzed in parallel. Micrographs show representative chromosome spreads prepared from mitotic cells. Insets show magnifications of chromosomes; they illustrate representative chromatid cohesion states. (C) Quantification of results of the experiments described in (A) and (B) as well as Figure 3—figure supplement 1; n = 200 cells per condition. (D) HeLa S3 cells were released from a thymidine arrest into solvent, 3 μM BAY-320 or 7 μM BAY-524. The cells were fixed and stained for Sgo1, Sgo2, CREST and DNA (DAPI) and analyzed by IFM. Scale bars represent 10 µm. (E) Histogram showing average centromeric Sgo levels observed in the experiments described in (A); n = 43–120 cells per condition. Error bars represent SEM. (F) Asynchronous cultures of RPE1 cells were treated with indicated doses of Bub1 inhibitors for 3 hr, fixed and analyzed by IFM. Scale bar represents 5 µm. (G) Dot plot showing the quantitative results of the experiment shown in (F). Sgo2 levels at centromeres and chromosome arms were determined in metaphase cells (n = 150 centromere/arm regions from 15 different cells). Bars represent mean values.
Figure 3—figure supplement 1
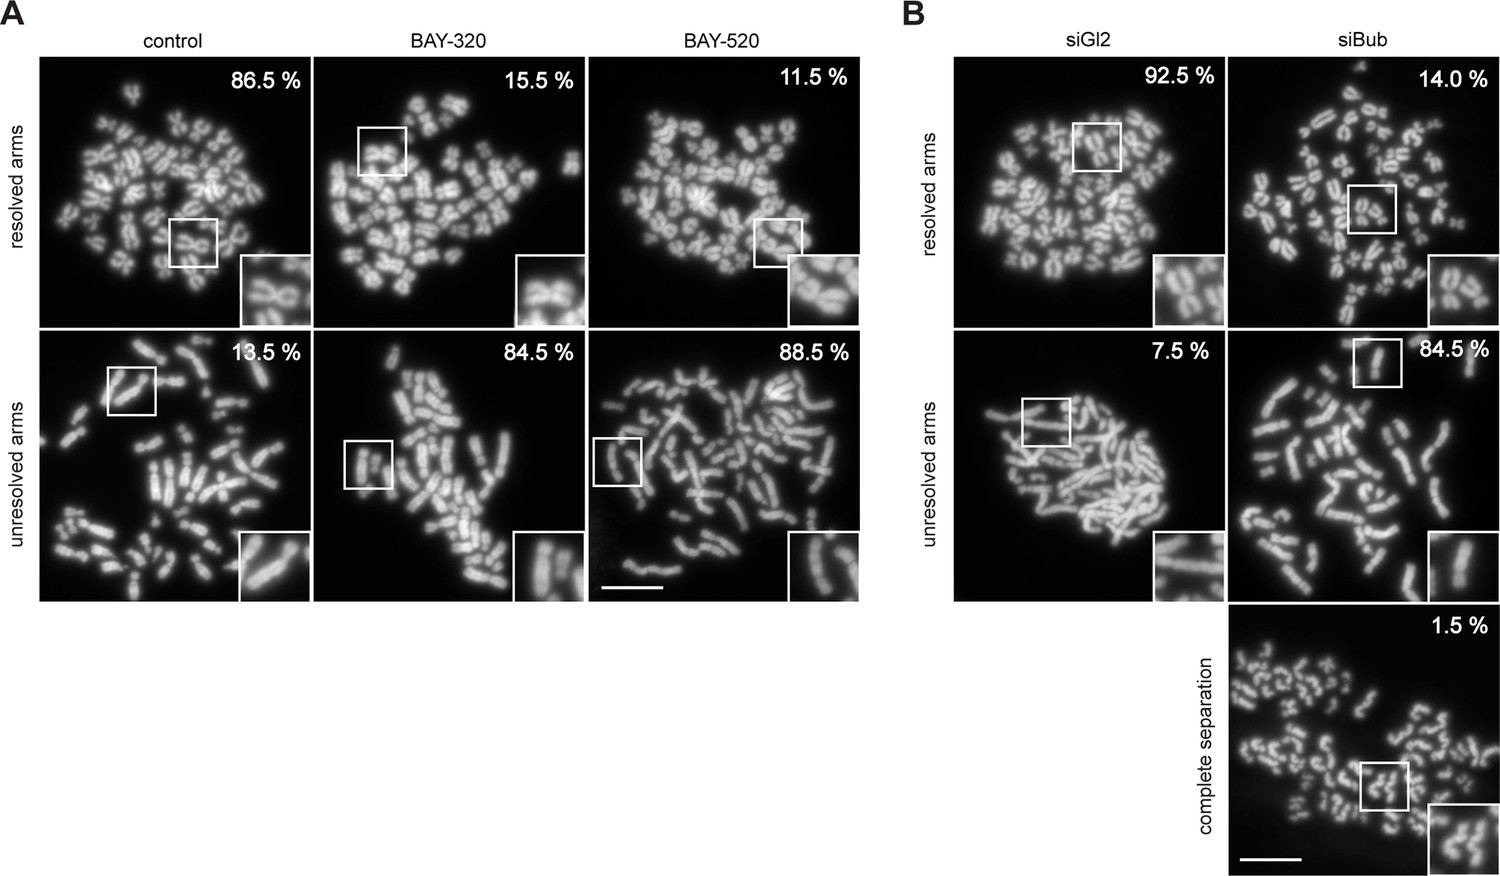
Inhibition of Bub1 affects chromatid cohesion.
(A, B) RPE1 cells were synchronized by thymidine block (4 mM) and released for 12 hr in the presence of 3.3 μM nocodazole as well as solvent (control), 3 μM BAY-320 or 7 μM BAY-524. The cells transfected with mock (Gl2) or Bub1 siRNA-oligonucleotides for 48 hr were synchronized and analyzed in parallel. Micrographs show representative chromosome spreads prepared from mitotic cells. Insets show magnifications of chromosomes; this illustrates representative chromatid cohesion states. Data relate to Figure 3C. Scale bars represent 10 µm.
Figure 4 with 1 supplement
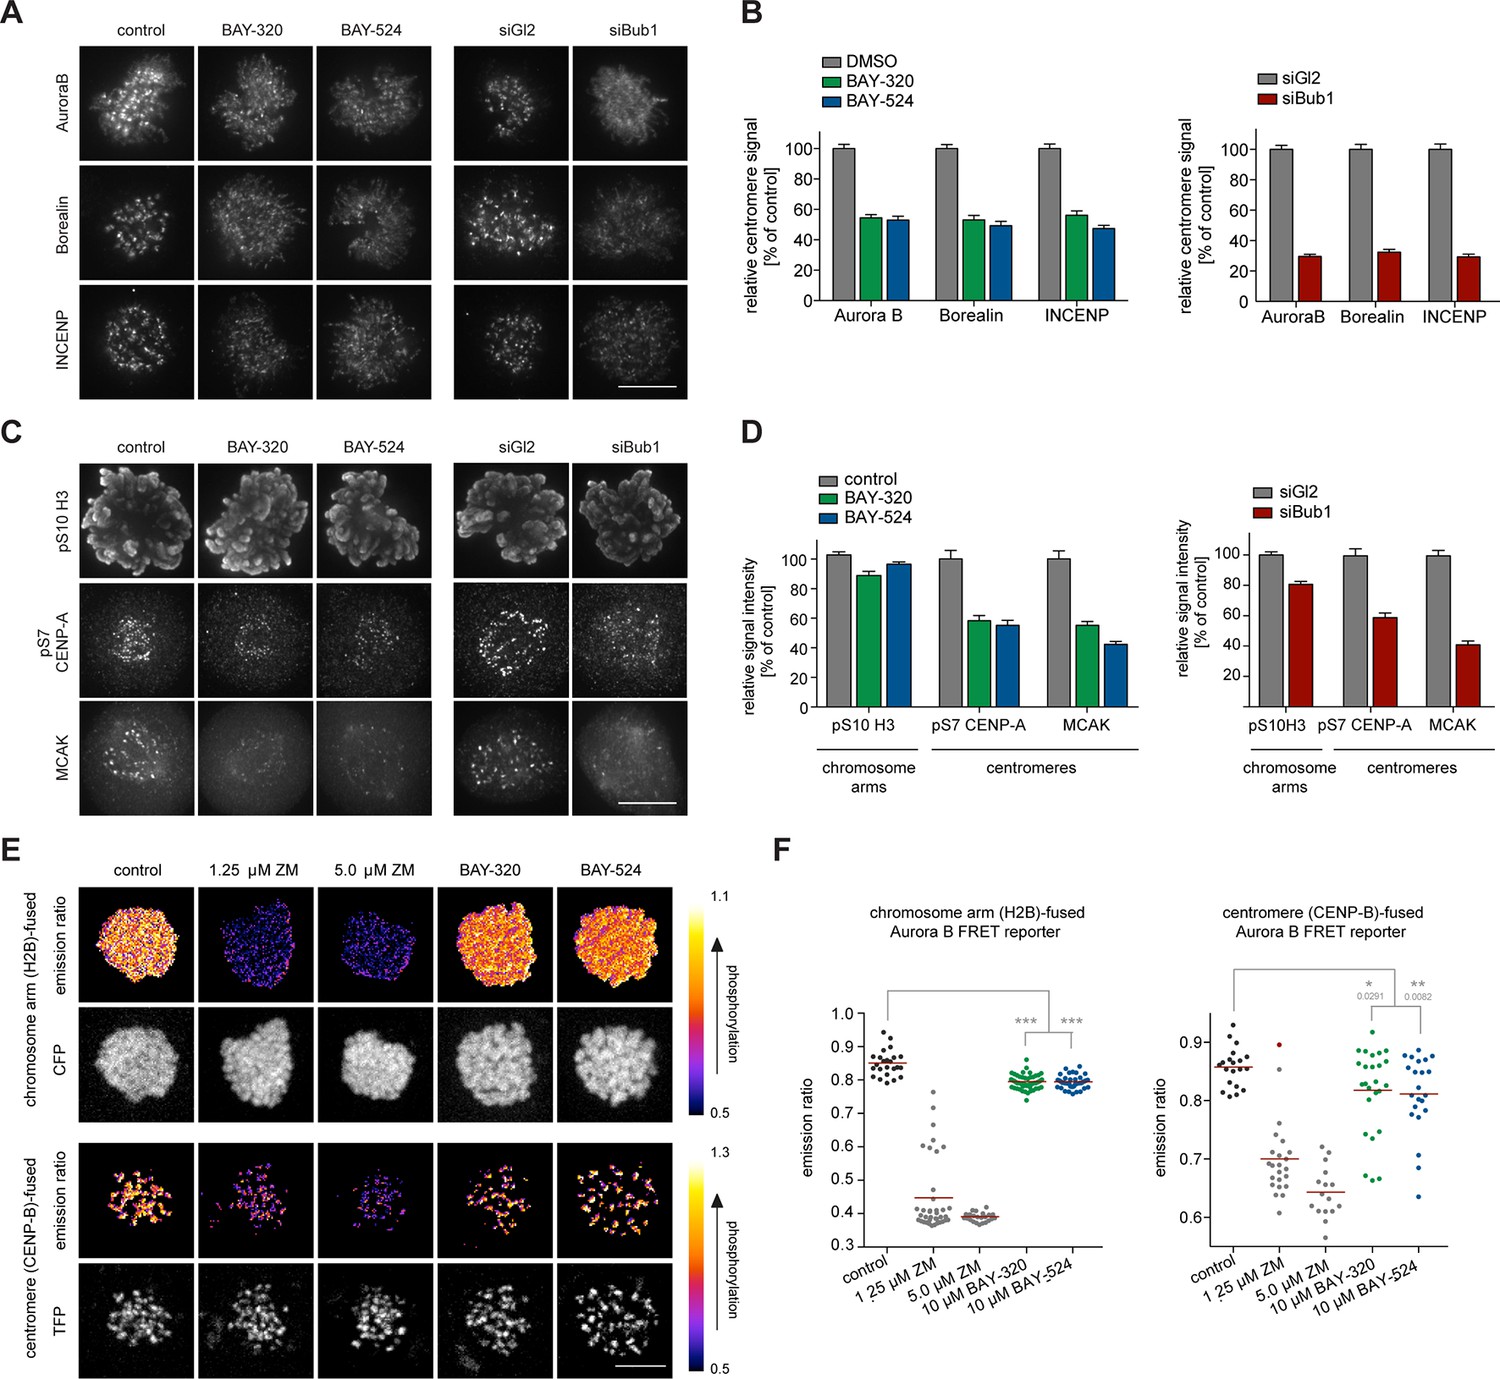
Bub1 inhibition affects localization and activity of the CPC.
(A, C) Untreated or siRNA transfected (siBub1, siGl2 for control) HeLa S3 cells were synchronized by thymidine block and released for 10 hr, as indicated (BAY-320 was used at 3 μM, BAY-524 at 7 μM). Cells were fixed and stained for Aurora B, Borealin, INCENP, pS7-CENP-A, pS10-histone H3, MCAK, CREST and DNA (DAPI) and analyzed by IFM. Scale bars represent 10 µm. (B, D) Histograms show quantitative results of the experiments described in (A, C). Measurements represent centromeric levels except for pS10-histone H3 signals, which was monitored along chromosome arms (n = 40–113 cells per condition). Scale bars represent 10 µm, error bars represent SEM. (E) FRET experiments were performed on HeLa Kyoto cells stably expressing chromatin (H2B)- or centromere (CENP-B)-fused FRET reporters for Aurora B activity. Cells were synchronized in mitosis by 6 hr treatment with 3.3 μM nocodazole, before the indicated inhibitors and 20 μM MG132 were added prior to live fluorescence microscopy. Heat-map represents the phosphorylation status of the reporter. Scale bar represents 10 µm. (F) Left panel: scatter plot depicts CFP/FRET emission ratios of reporter targeted to chromatin (H2B; n = 23–52 cells per condition). Right panel: scatter plot depicts TFP/FRET emission ratios of reporter targeted to centromeres (CENP-B, n = 16–34 cells per condition). Bars represent mean values; ***p<0.001 (from unpaired two-tailed Student’s t-test).
Figure 4—figure supplement 1

Bub1 inhibition affects localization and activity of the CPC.
(A, B) Panels relate to the quantitative data shown in Figure 4B and D. Scale bars represent 10 µm. (C) HeLa Kyoto cells stably expressing the chromatin-targeted Aurora B FRET reporter were transfected with control (Gl2) or Bub1 siRNA oligonucleotides for 48 hr and synchronized by 6 hr treatment with 3.3 μM nocodazole, before 20 μM MG132 were added prior to live fluorescence microscopy. Top panel: heat-map represents the phosphorylation status of the reporter. Scale bar represents 10 μm. Bottom panel: dot plot shows measured CFP/FRET emission ratios (n = 14–19 cells per condition). Bars represent mean values; ***p < 0.001 (from unpaired two-tailed Student’s t-test.
Figure 5 with 1 supplement
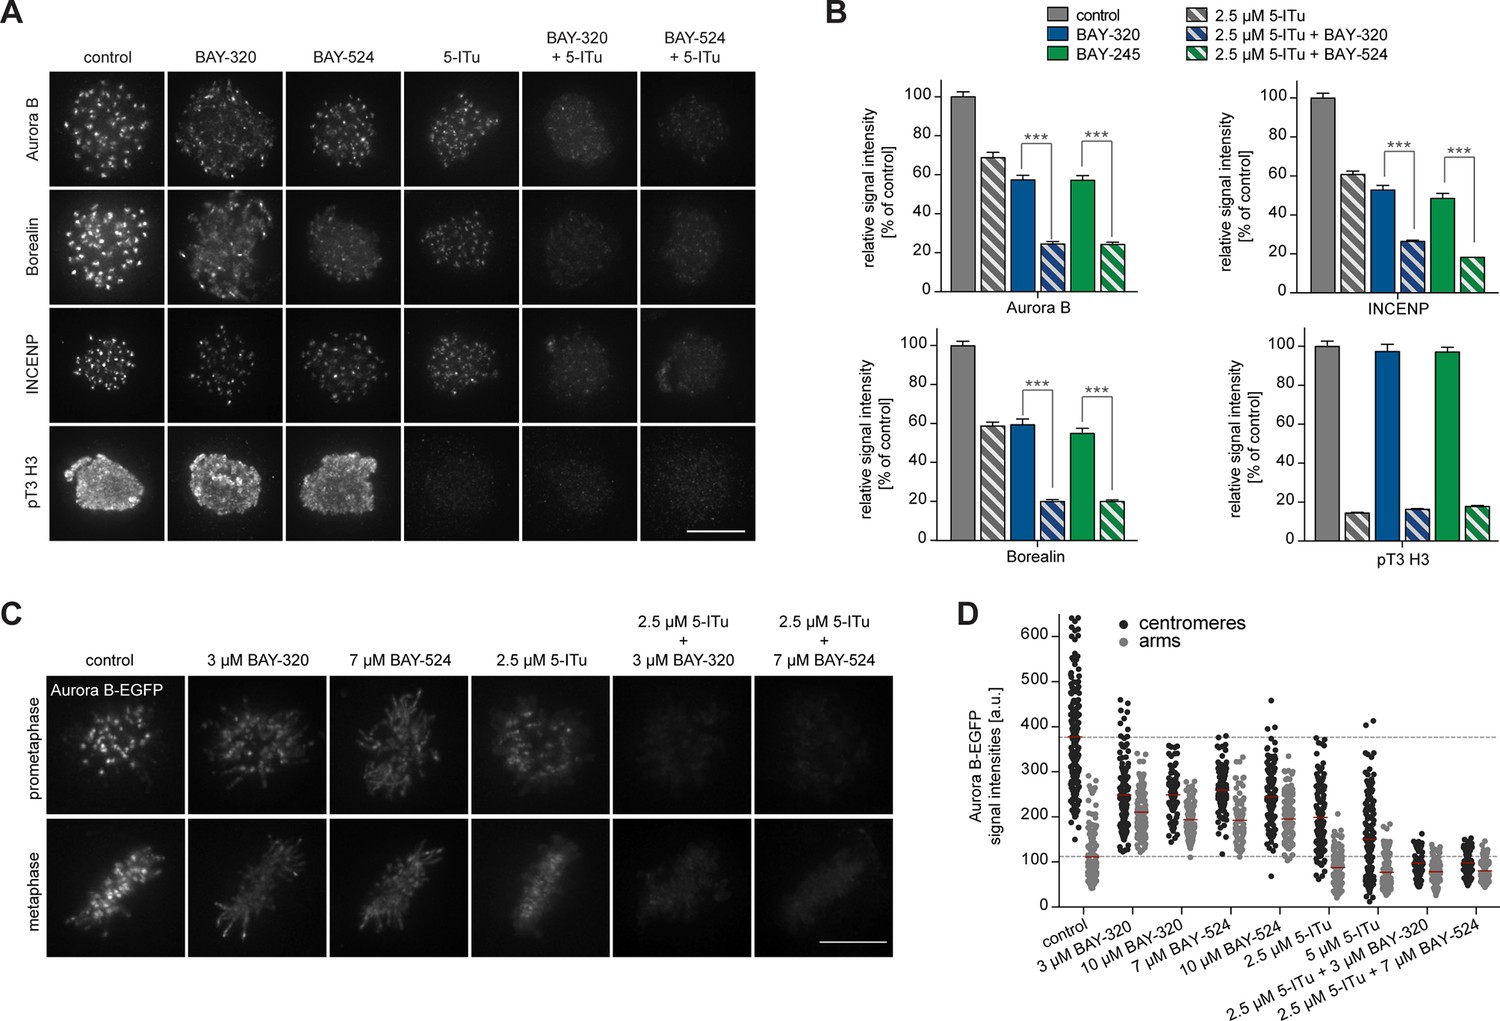
Bub1 and Haspin inhibition exert additive effect on centromere association of CPC.
(A) HeLa S3 cells were released from a thymidine block into 3.3 µM nocodazole, before they were additionally treated for 2 hr with the proteasomal inhibitor MG132 and indicated kinase inhibitors. The Haspin inhibitor 5-iodotubercidin (5-ITu [De Antoni et al., 2012]) was used at a concentration of 2.5 µM, BAY-320 at 3 μM and BAY-524 at 7 μM. Cells were fixed, stained for pT3-H3, Aurora B, Borealin, INCENP, CREST and DNA (DAPI) and analyzed by IFM. Anti-pT3-H3 antibody was used to monitor Haspin and Bub1 inhibition, respectively. Scale bar represents 10 µm. (B) Histograms show average centromeric (AurB, Borealin, INCENP) or chromosome arm (pT3-H3) signal intensities observed in the experiments shown in (A); n = 20–100 cells per condition. Error bars represent SEM, ***p < 0.001 (from unpaired two-tailed Student’s t-test). (C) RPE1 cells expressing endogenously EGFP-tagged Aurora B were incubated with the indicated drugs for several hours before EGFP signals were recorded by live fluorescence imaging. Scale bar represents 5 µm. (D) Scatter plots depict Aurora B-EGFP signal intensities at centromeres or arms after treatment with indicated drugs (n = 84–185 centromeres/arm regions from 5–6 cells per condition). Bars represent mean values. For comparison, dashed lines mark the mean values of Aurora B-EGFP signal intensities at arms and centromeres in control cells. Measurements relate to the experiment shown in (C).
Figure 5—figure supplement 1

Bub1 and Haspin inhibition exert additive effect on centromere association of CPC.
(A) Panels relate to the quantitative data shown in Figure 5B. Scale bars represent 5 µm. (B) Asynchronous cultures of RPE1 cells expressing endogenously EGFP-tagged Aurora B were treated with indicated doses of Bub1 inhibitors for 3 hr, fixed and analyzed by IFM. Scale bar represents 5 µm. (C) Dot plots show the quantitative results of the experiment shown in (C). EGFP-Aurora B and Sgo2 levels at centromeres and chromosome arms were determined in metaphase cells (n = 100 centromeres or arm regions from 10 different cells). Bars represent mean values.
Figure 6 with 2 supplements
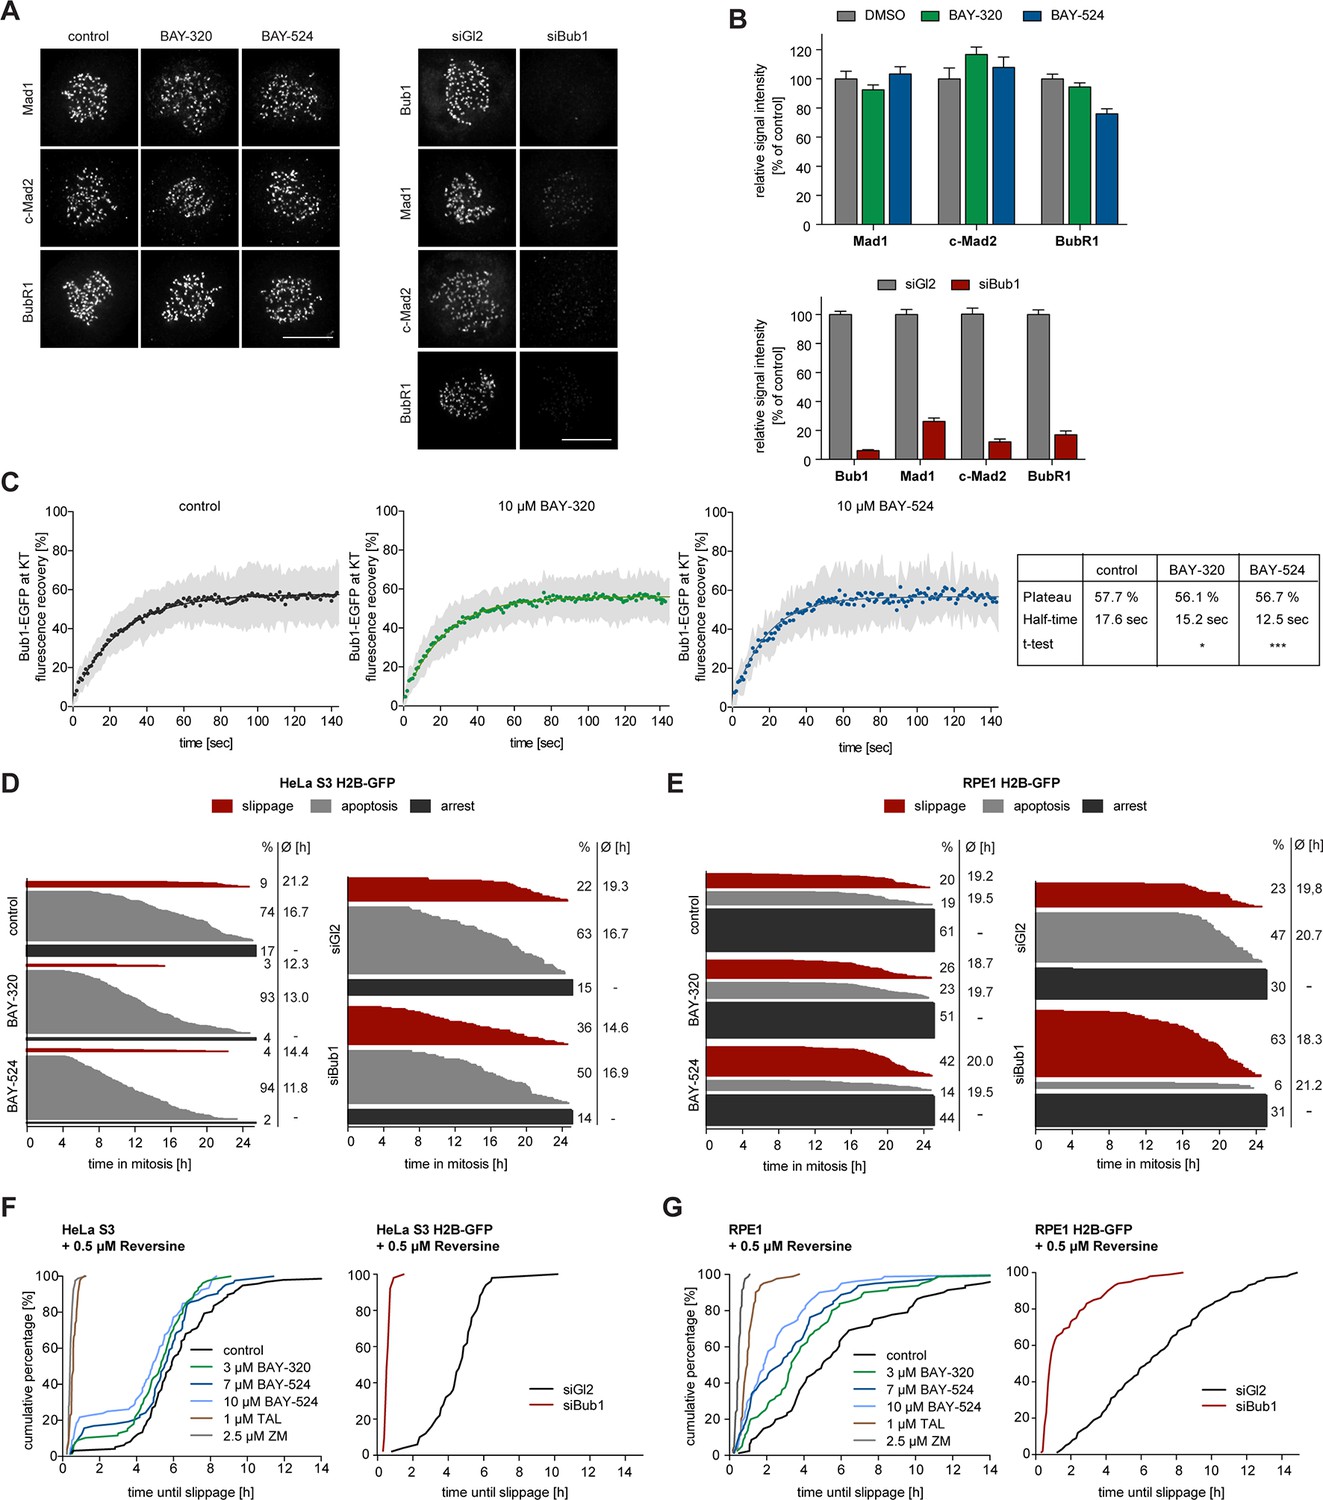
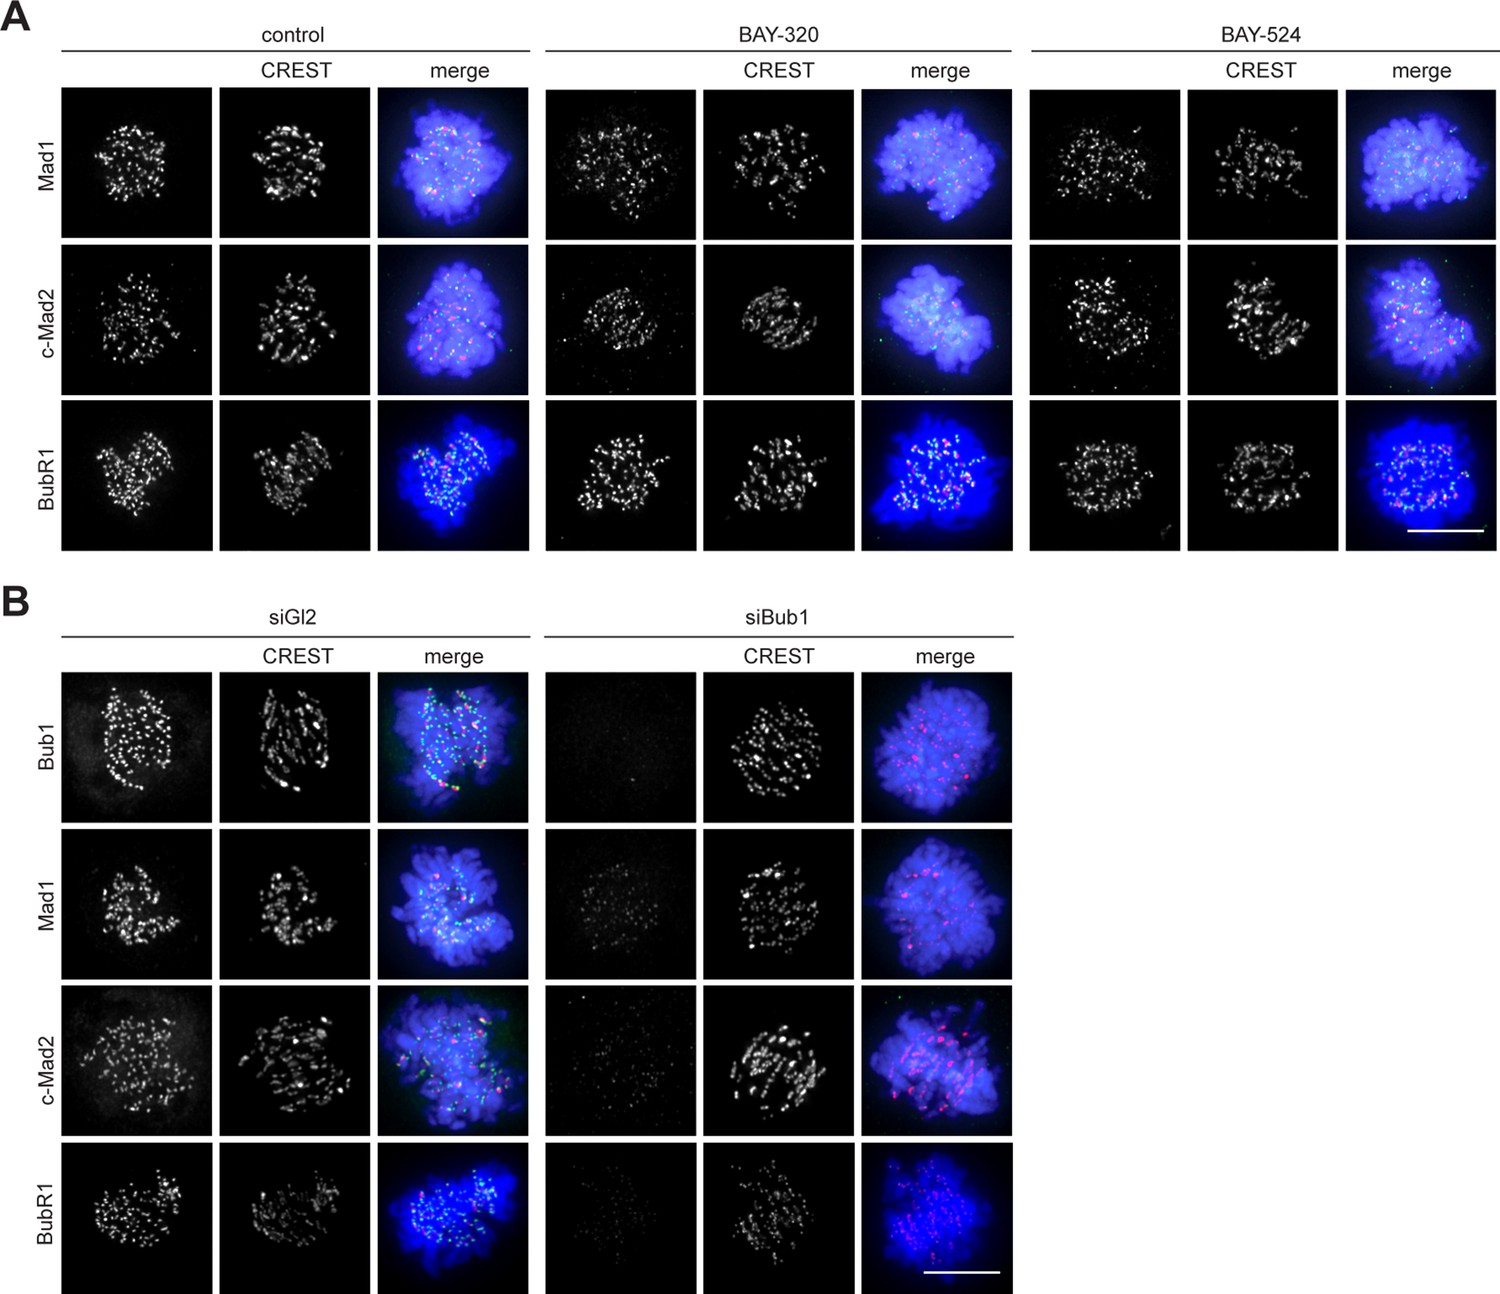
Bub1 inhibition marginally affects SAC signaling.
(A) Inhibition of Bub1 kinase does not significantly affect recruitment of SAC effectors to unattached KTs. HeLa S3 cells were synchronized by thymidine block and released for 10 hr in the presence of solvent (control), 3 μM BAY-320 or 7 μM BAY-524. Cells transfected with mock (Gl2) or Bub1 siRNA-oligonucleotides for 48 hr were synchronized and analyzed in parallel. The cells were fixed and stained for Bub1, Mad1, closed Mad2 (C-Mad2), CREST and DNA (DAPI) and analyzed by IFM. (B) Histogram shows average KT levels of indicated proteins (n = 20–50 cells per condition) observed in the experiment shown in (A). Error bars represent SEM. (C) RPE1 cells expressing endogenously tagged Bub1-EGFP were synchronized in mitosis by overnight treatment with the Eg5 inhibitor STLC (10 μM) and subsequently treated with 3.3 µM nocodazole and 20 μM MG132 as well as solvent (control), 10 μM BAY-320 or 10 μM BAY-524. Bub1-EGFP KT levels were recorded by 1 sec time-lapse microscopy. After 5 sec, a single KT pair was bleached and fluorescence recovery was monitored. Traces illustrate average fluorescence recovery at KT pairs (n = 10–16 KT pairs per condition); shaded areas represent standard deviation (SD). Half-times and plateaus were determined by non-linear curve fitting based on a one-phase association. (D, E) Asynchronously growing cultures of HeLa S3 (D) or RPE1 (E) cells stably expressing GFP-tagged histone H2B were either directly treated with 3.3 µM nocodazole and the kinase inhibitors BAY-320 (3 μM) and BAY-524 (7 μM) or transfected with control (Gl2) or Bub1 siRNA for 48 hr prior to addition of nocodazole. Cell fates (continued arrest, apoptosis or slippage) and duration of mitotic arrest were determined by fluorescence time-lapse imaging (n = 150 cells per condition, accumulated from 3 independent experiments). Frequencies of observed cell fates as well as average times of arrest are indicated. (F) Asynchronously growing HeLa S3 cells or HeLa cells stably expressing GFP-tagged histone H2B were treated with 3.3 µM nocodazole and 0.5 µM of the Mps1 inhibitor Reversine as well as solvent (control), 3 and 10 μM BAY-320, 7 and 10 μM BAY-524 or 2.5 µM of the Aurora B inhibitor ZM-447439 (ZM) (left panel). Alternatively, cells were transfected with control (Gl2) or Bub1 siRNA oligonucleotides for 48 hr prior to addition of 3.3 μM nocodazole and 0.5 µM Reversine (right panel). The cells were monitored by fluorescence time-lapse microscopy and the time elapsed from nuclear envelope breakdown to SAC override and mitotic slippage was determined. Traces illustrate the cumulative frequency of mitotic duration before slippage (n = 50 cells per condition). (G) Asynchronously growing RPE1 cells stably expressing GFP-tagged histone H2B were treated and analyzed as described in (F). Scale bars represent 10 µm.
Figure 6—figure supplement 1
Panels relate to the quantitative data shown in Figure 6D.
Scale bars represent 10 µm.
Figure 6—figure supplement 2

Tagging strategy and IFM analysis of Bub1 KT levels.
(A) Schematic illustrating the targeting strategy used to introduce the EGFP open-reading frame into the indicated locus of RPE1 cells. The EGFP open reading frame was fused to the 3’ exon of one allele of the BUB1L gene. (B) HeLa cells were synchronized by thymidine block and released for 10 hr in the presence of solvent (control), 3 μM BAY-320 or 7 μM BAY-524. Cells were fixed and stained for Bub1, CREST and DNA (DAPI) and analyzed by IFM. Scale bar represents 10 µm. (C) Histogram shows average Bub1 KT levels as measured in the experiment shown in (B); n = 20–22 cells per condition.
Figure 7
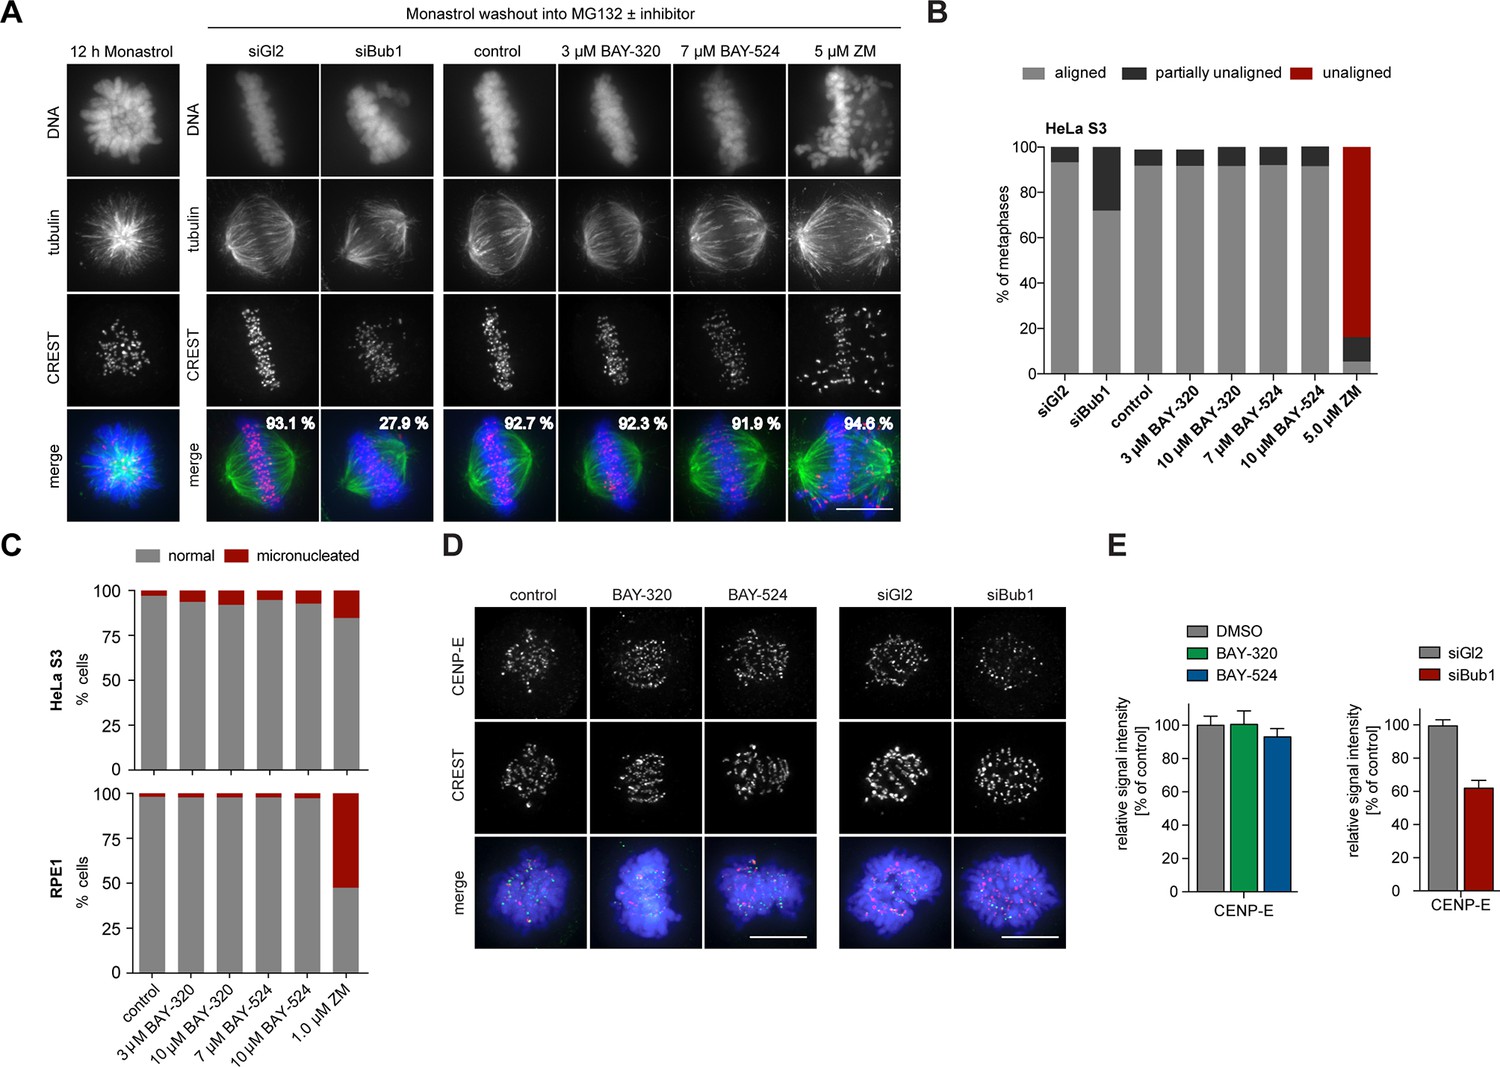
Bub1 inhibition does not significantly affect chromosome congression.
(A) HeLa S3 cells were transfected with control (Gl2) or Bub1 siRNA-oligonucleotides for 48 hr, synchronized by thymidine block and released for 12 hr in the presence of the Eg5 inhibitor monastrol to induce the formation of monopolar spindles. The capacity of spindle bipolarization and metaphase plate formation was tested by monastrol wash-out and addition of MG132 and indicated drugs for 2 hr (n = 170–200 cells). Percentages indicate the frequencies of depicted spindle morphologies. (B) Histograms show the frequencies of full, partial (≤5 unaligned chromosomes) or failed metaphase chromosome alignments that were observed in the experiment shown in (A). (C) HeLa S3 and RPE1 cells were treated for 16 hr with the indicated drugs, fixed and analyzed by IFM. Histograms show the frequency of micronucleation among interphase cells (n = 300 cells per condition). (D) Depletion but not inhibition of Bub1 kinase affects recruitment of CENP-E to unattached kinetochores. Untreated HeLa S3 cells or cells transfected with control (Gl2) or Bub1 siRNA-oligonucleotides (for 48 hr) were synchronized by thymidine block and released for 10 hr in the presence or absence of 3 μM BAY-320 or 7 μM BAY-524. The cells were fixed and stained for CENP-E, CREST, DNA (DAPI) and analyzed by IFM. (E) Histograms show average CENP-E KT levels observed in prometaphase cells. Data relate to micrographs shown in (D). Error bars represent SEM. Scale bars represent 10 µm.
Figure 8
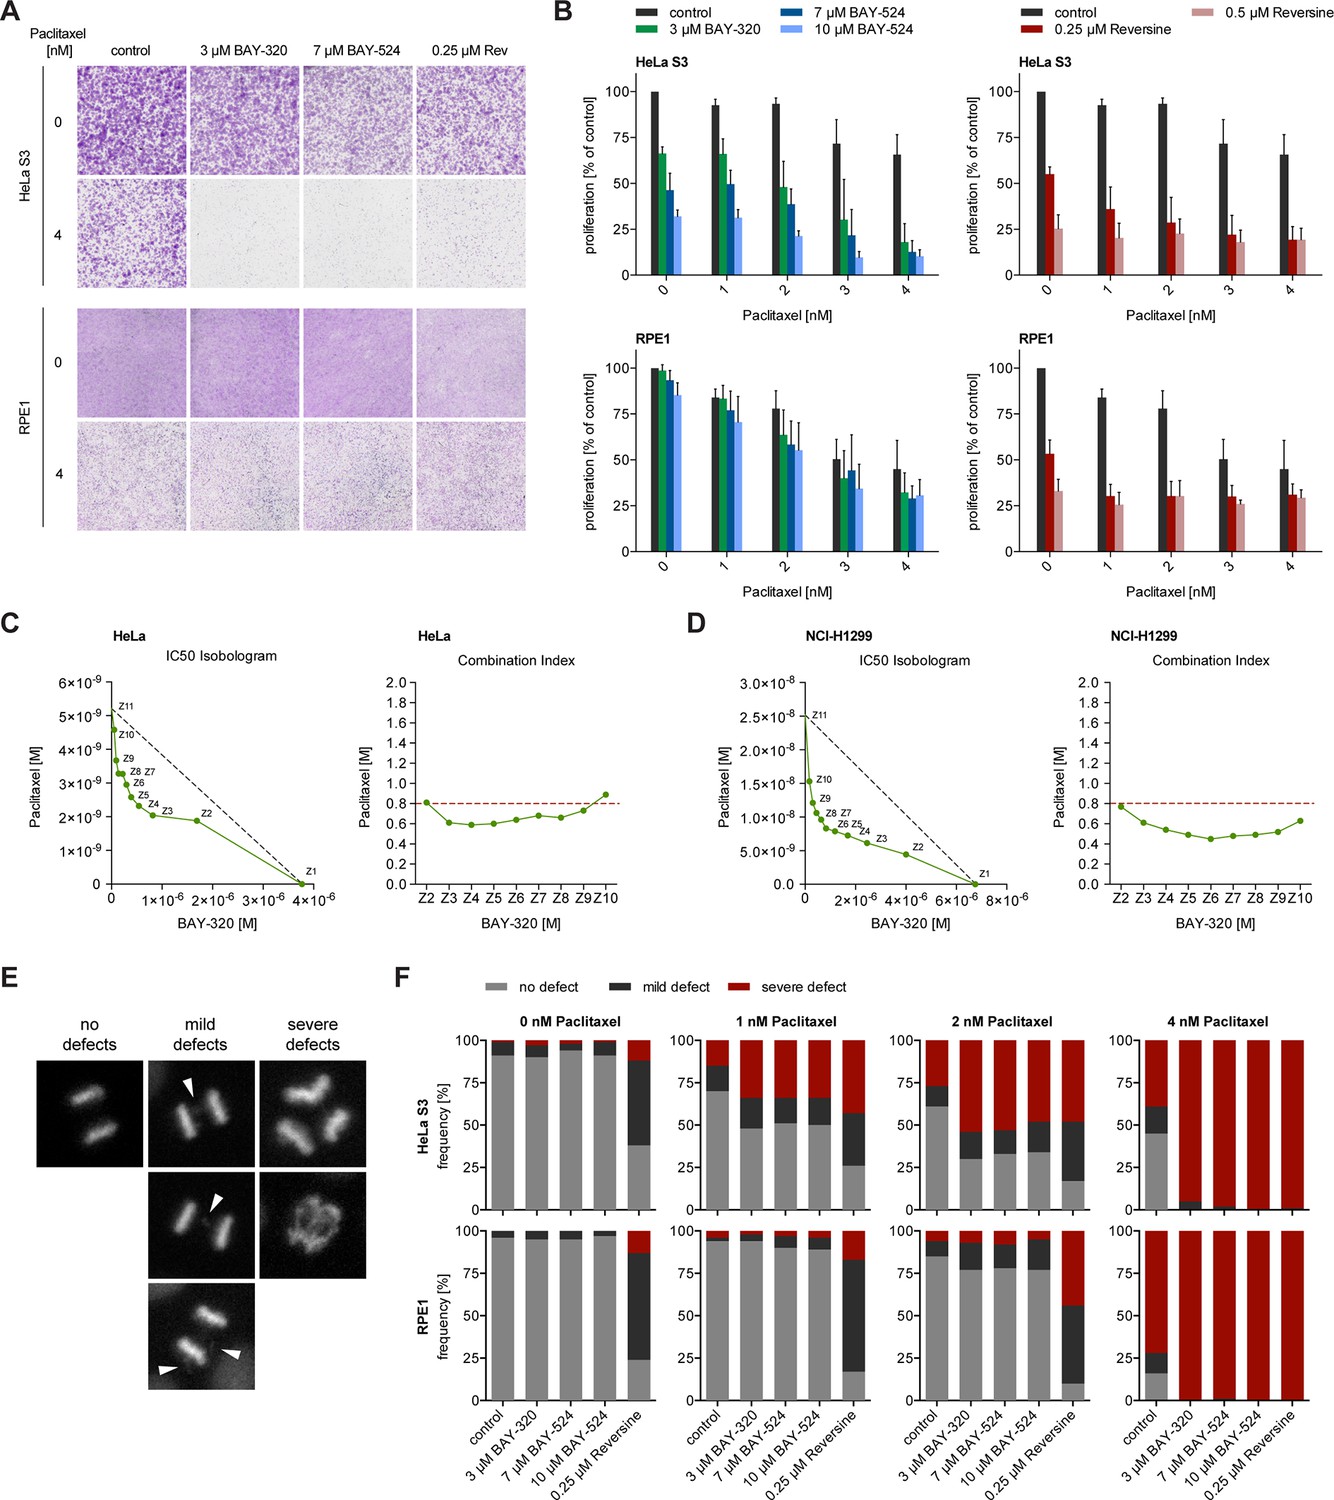
BAY-320 and BAY-524 treatment sensitizes cells to low doses of Paclitaxel.
(A) Micrographs show colony formation of HeLa (top panel) and RPE1 cells (bottom panel) treated for 7 days with solvent (control) or the indicated kinase inhibitors in the presence or absence of 4 nM Paclitaxel. (B) Histograms quantify colony formation in HeLa (top panels) and RPE1 cells (bottom panels) treated with the indicated kinase inhibitors in the presence or absence of 1–4 nM Paclitaxel for 7 days. (C, D) IC50-Isobolograms confirm the synergistic effect of BAY-320 and Paclitaxel on cell survival. HeLa cells (C) or NCI-H1299 non-small cell lung cancer cells (D) were grown in the presence various concentrations of BAY-320 (0.1–10 μM) and paclitaxel (1–100 nM) in mono (Z1, Z11) and in nine different fixed-ratio combinations (Z2-Z10). IC50 values were determined and the respective BAY-320 and Paclitaxel concentrations plotted in IC50 Isobolograms (left panel). The grey dashed lines indicate the results expected for additivity. Combination indices (CIs) were calculated according to the median-effect model of Chou-Talalay (Chou, 2006) and plotted over fixed-ratio combinations Z2-Z10 (right panel). The red dashed line indicates a CI of 0.8 (defined as upper limit for a synergistic interaction). (E) Time-lapse stills of HeLa cells expressing H2B-GFP illustrate chromosome segregation defects that were used to classify cell fates in the experiments described in (F); arrowheads point to chromosome bridges and lagging chromosomes. (F) HeLa (top panels) and RPE1 cells (bottom panels) stably expressing H2B-GFP were treated with solvent (control) or the indicated kinase inhibitors in the presence or absence of 1–4 nM Paclitaxel and monitored by fluorescence time-lapse imaging. Histograms show the frequencies of chromosome segregation defects, following the classification illustrated in (E) (n = 100 cells per condition).
Additional files
-
Supplementary file 1
Related to Figure 1.
IC50 profile of BAY-320 and BAY-524.
- https://doi.org/10.7554/eLife.12187.018
-
Supplementary file 2
Related to Figure 1.
In vitro kinase-selectivity profile of BAY-320 on a panel of 222 human kinases (Eurofins kinase profiler screen, Millipore). Shown are percentages of residual kinase activity at 10 µM BAY-320 and 10 µM ATP.
- https://doi.org/10.7554/eLife.12187.019
-
Supplementary file 3
Related to Figure 1.
In vitro kinase-selectivity profile of BAY-320. Results are based on an active site-directed competition-binding assay using a panel of 403 human kinases (DiscoverX Kinome Scan, Lead Hunter). Results show ligand binding at 300 and 1000 nM BAY-320 relative to control condition.
- https://doi.org/10.7554/eLife.12187.020
Download links
A two-part list of links to download the article, or parts of the article, in various formats.
Downloads (link to download the article as PDF)
Open citations (links to open the citations from this article in various online reference manager services)
Cite this article (links to download the citations from this article in formats compatible with various reference manager tools)
Probing the catalytic functions of Bub1 kinase using the small molecule inhibitors BAY-320 and BAY-524
eLife 5:e12187.
https://doi.org/10.7554/eLife.12187


