Tumor suppressive role of sestrin2 during colitis and colon carcinogenesis
- University of Michigan, United States
- University of Nebraska, United States
- Konyang University, Republic of Korea
- Myung-Gok Eye Research Institute, Konyang University, Republic of Korea
Figures
Figure 1 with 2 supplements
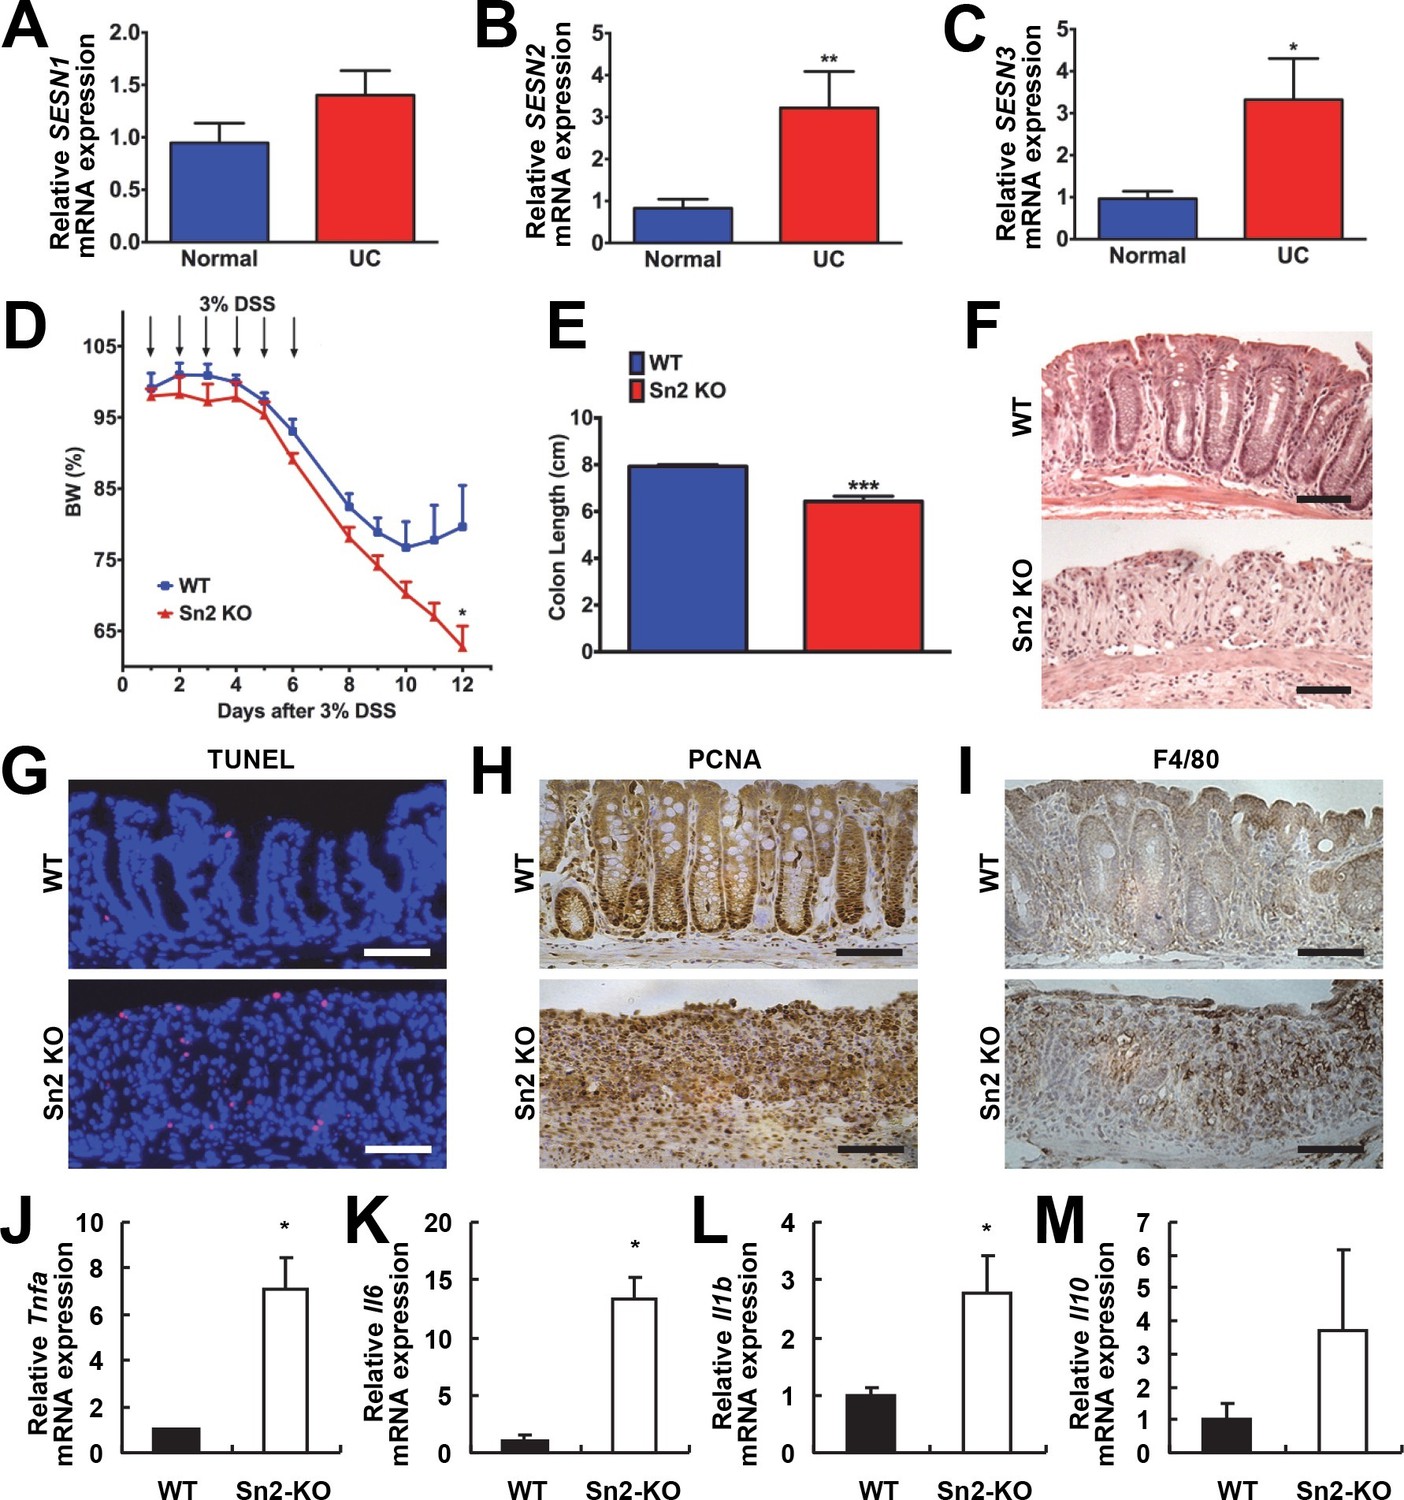
Protective function of Sestrin2 against colon injury.
(A-C) Upregulation of human SESN2 and SESN3 expression in ulcerative colitis (UC). mRNA expression of human SESN1-3 was analyzed through quantitative RT-PCR of non-inflamed (Normal) and inflamed (UC) colon tissues from patients with UC (n=10; mean ± s.e.m.). These samples were histologically confirmed and formerly described (Xue et al, 2013). (D-M) Loss of Sestrin2 impairs recovery from DSS-induced colitis in mice. 6-month-old WT and Sesn2-/- mice (n=4 each) were treated with 3% DSS in drinking water for 6 days (arrows), followed by 6 days of regular water. Body weight was measured over 12 days (D; mean ± s.e.m.). At the final day of the experiment, mice were sacrificed and colon length was measured (E). The data are shown as the mean ± s.e.m. The colons were isolated and fixed for H&E staining (F), TUNEL staining (G), PCNA staining (H) and F4/80 staining (I). The levels of the indicated mRNAs, which are indicative of active inflammation, were quantified by real-time PCR (J-M; mean ± s.e.m.). *p<0.05, **p<0.01, ***p<0.001. P values are from Student’s t-test. Scale bars, 100 μm.
Figure 1—figure supplement 1
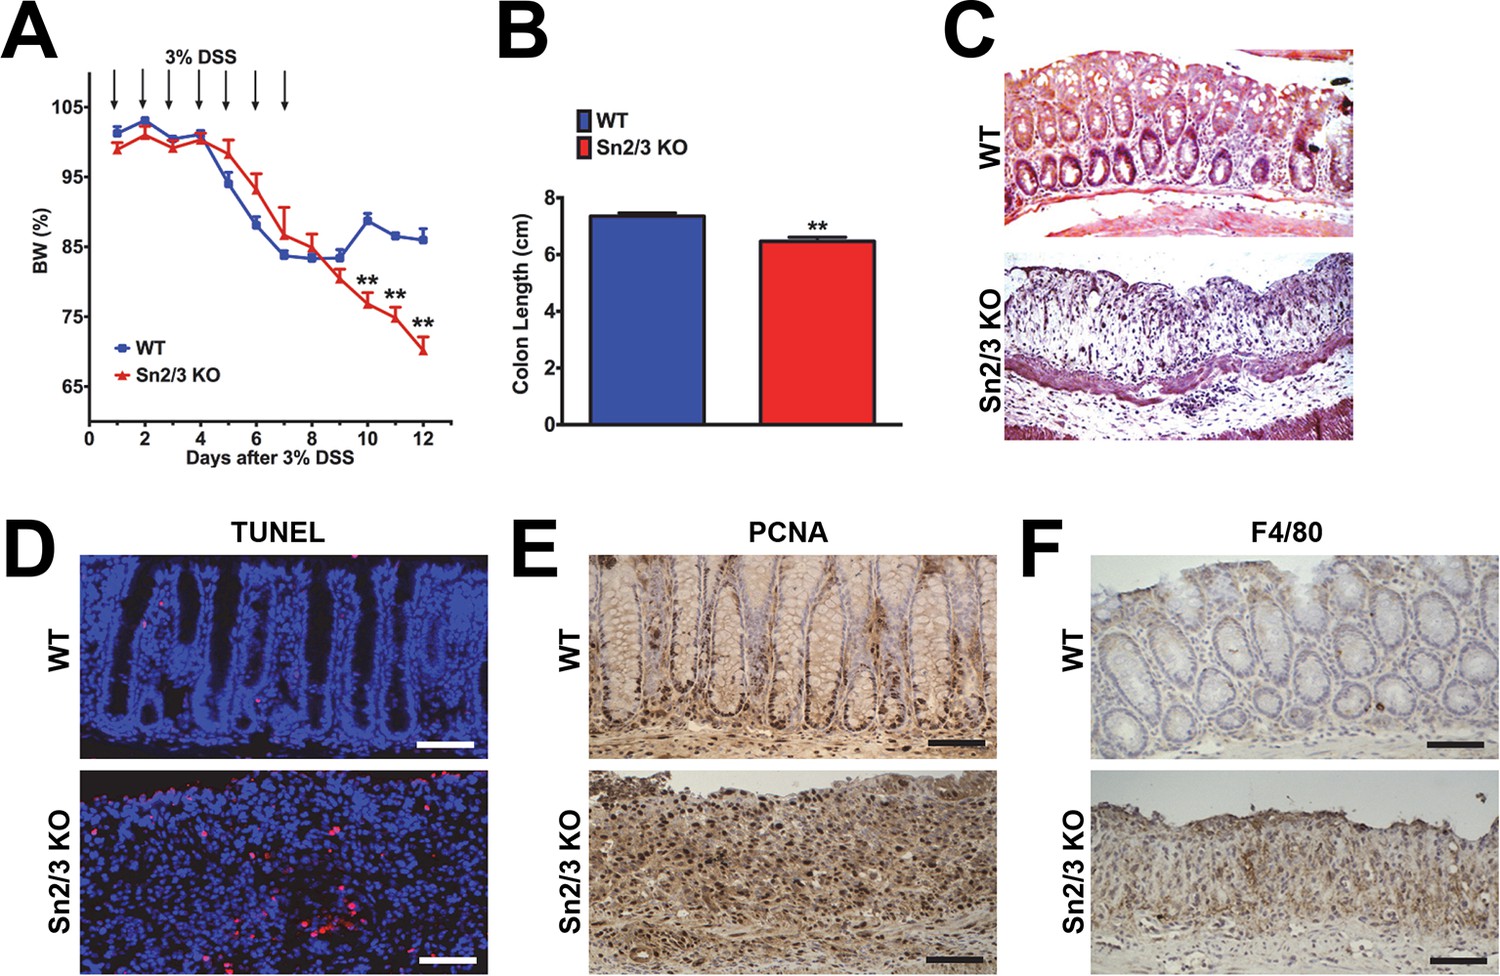
Hypersensitivity of Sesn2-/-/Sesn3-/- mice against DSS-induced colon injury.
1-year-old WT and Sesn2-/-/Sesn3-/- mice (n=4 each) were treated with 3% DSS in drinking water for 7 days (arrows in A), followed by 5 days of regular water.Body weight was measured over 12 days (A). At the final day of the experiment, mice were sacrificed and colon length was measured (B). The colons were isolated and fixed for H&E staining (C), TUNEL staining (D), PCNA staining (E) and F4/80 staining (F). Data are shown as the mean ± s.e.m. **p<0.01. P values are from Student’s t-test. Scale bars, 100 μm.
Figure 1—figure supplement 2
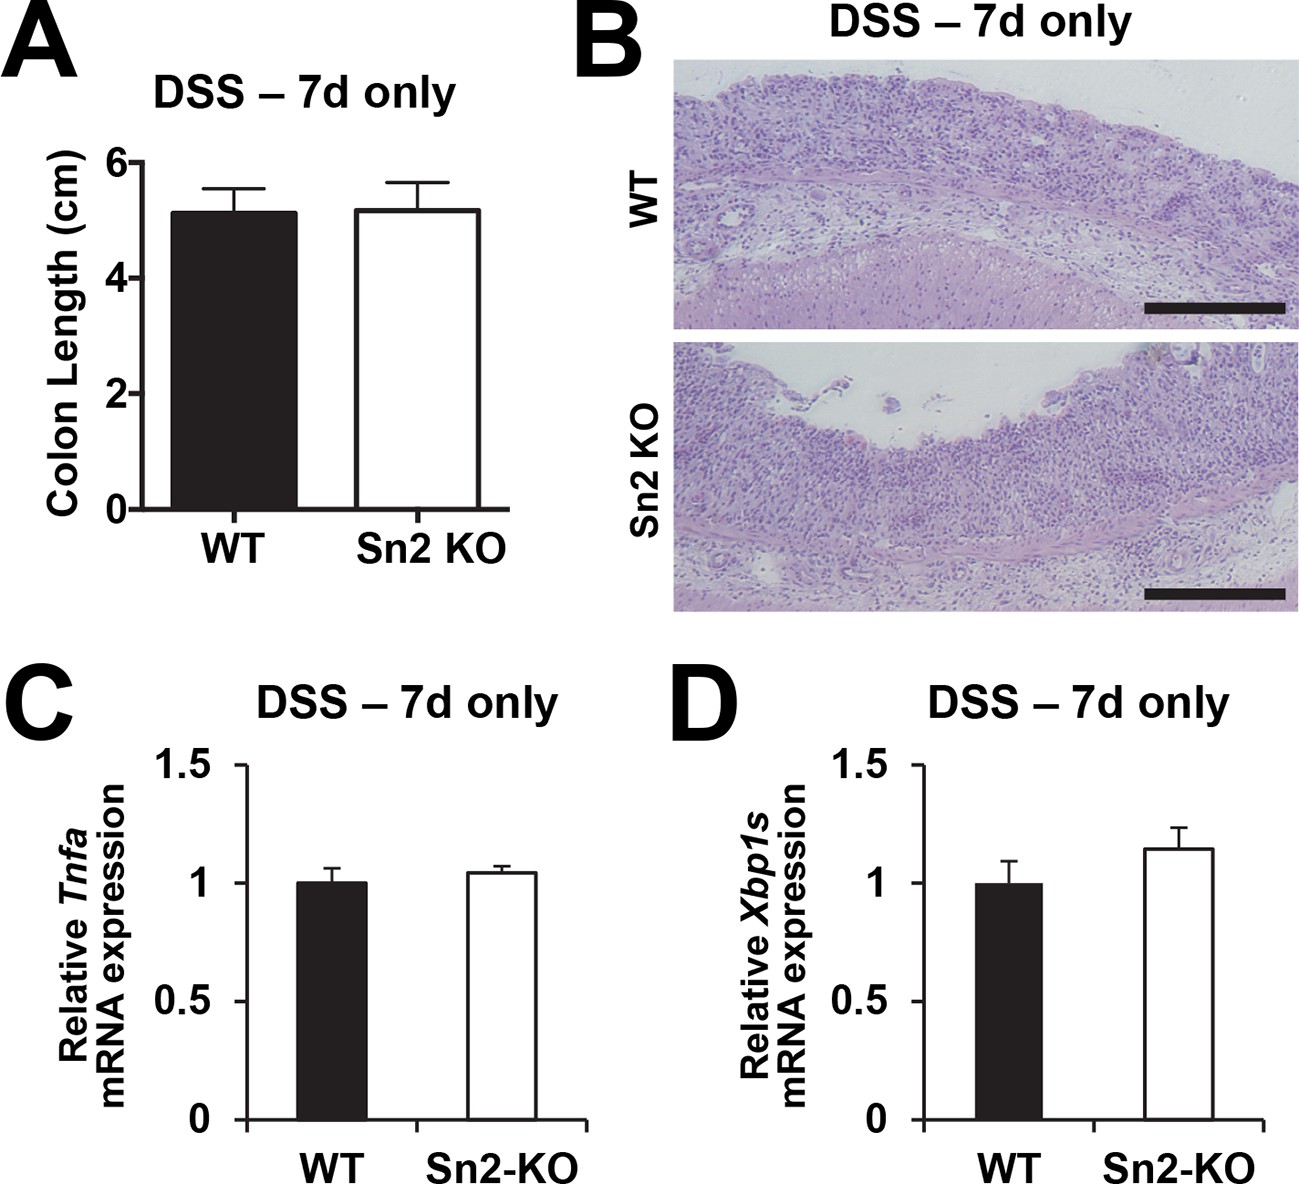
Acute colon injury is comparable between WT and Sesn2-/- mice during DSS treatment.
2-month-old WT and Sesn2-/- mice (n=4 each) were treated with 3% DSS in drinking water for 7 days (DSS – 7d only).At this time point, mice were sacrificed and colon length was measured (A). The data are shown as the mean ± s.e.m. The colons were isolated and fixed for H&E staining (B). The levels of Tnfa and Xbp1s mRNAs, which are respectively indicative of active inflammation and ER stress, were quantified by real-time PCR (C,D; mean ± s.e.m.). Scale bars, 200 μm.
Figure 2 with 3 supplements
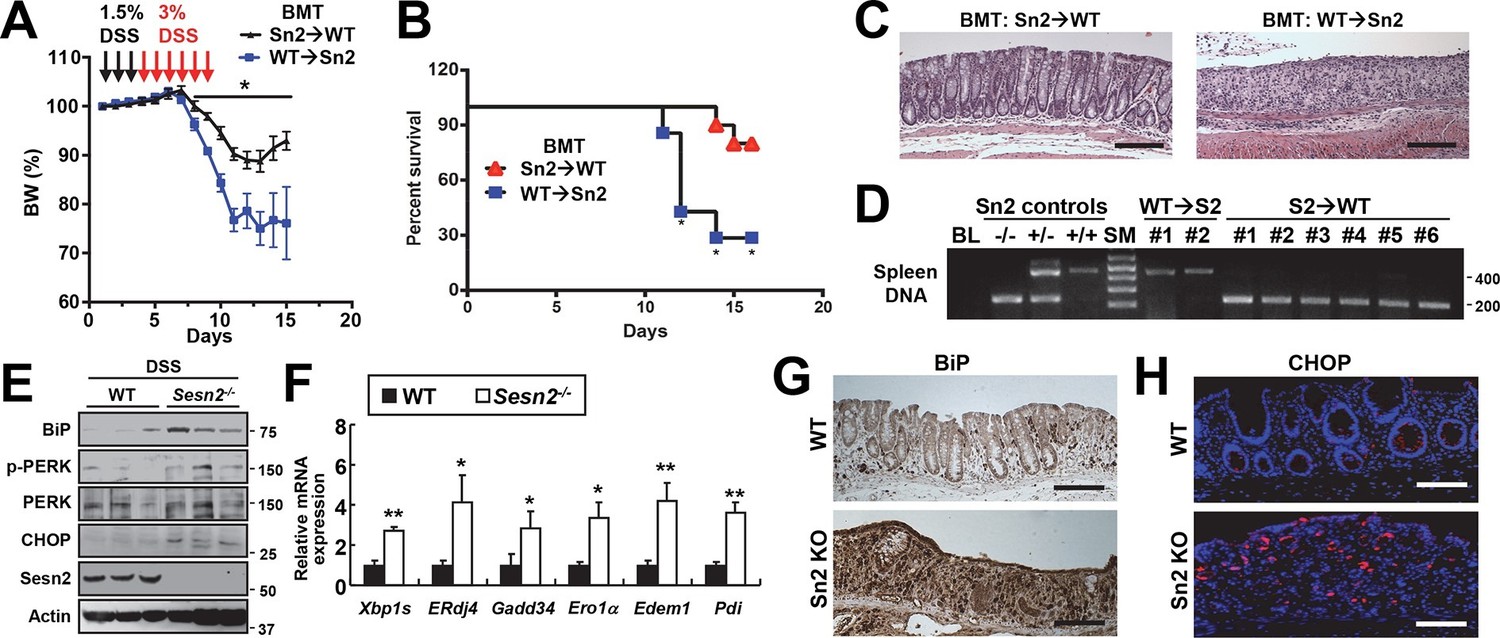
Sestrin2 prevents colitis-associated ER stress in colonic epithelia.
(A-D) Sestrin2 expression in the extra-hematopoietic compartment is critical for the resolution of DSS-induced colitis. 3-month-old WT and Sesn2-/- mice (n=7 each) were subjected to lethal irradiation and injected with bone marrow cells from age-matched Sesn2-/- (Sn2→WT) and WT (WT→Sn2) mice, respectively. After 1 month, mice were subjected to DSS administration as indicated in the panel A. Body weight was measured over 15 days (A). Data are shown as mean ± s.e.m. Percent survival was calculated for each day (B). The colons of surviving mice at the final day of experiment were isolated and fixed for H&E staining (C). The spleens of surviving mice were genotyped for WT (upper band, ~450bp) and Sesn2-KO (lower band, ~200bp) alleles (D). (E-H) Loss of Sesn2 aggravates colitis-induced ER stress in colon. Expression or phosphorylation of ER stress signaling markers were analyzed from indicated mice (described in Figure 1D-M) through immunoblotting (E), real-time PCR (F) or immunohistochemistry (G,H). Data are shown as mean ± s.e.m. *p<0.05, **p<0.01. P values are from Student’s t-test. Scale bars, 200 μm (black), 100 μm (white). Molecular weight markers are indicated in bp (D) or kDa (E).
Figure 2—figure supplement 1

Induction of ER stress and Sestrin2 upon DSS treatment.
4-month-old WT mice were treated with 3% DSS in drinking water for 7 days, followed by 7 days of regular water (RW).Mice were sacrificed before the treatment (Con; n=3), right after 7 days of DSS treatment (DSS 7d only; n=5) or after completion of the experiment (DSS 7d + RW 7d; n=3). Expressions of ER stress signaling markers (A), inflammation markers (B) and Sestrin2 (C,D) were analyzed from indicated mice through real-time PCR (A-C) or immunoblotting (D). Data are shown as mean ± s.e.m. *p<0.05, **p<0.01, ***p<0.001. P values are from Student’s t-test between control and indicated groups. Molecular weight markers are indicated in kDa (D).
Figure 2—figure supplement 2
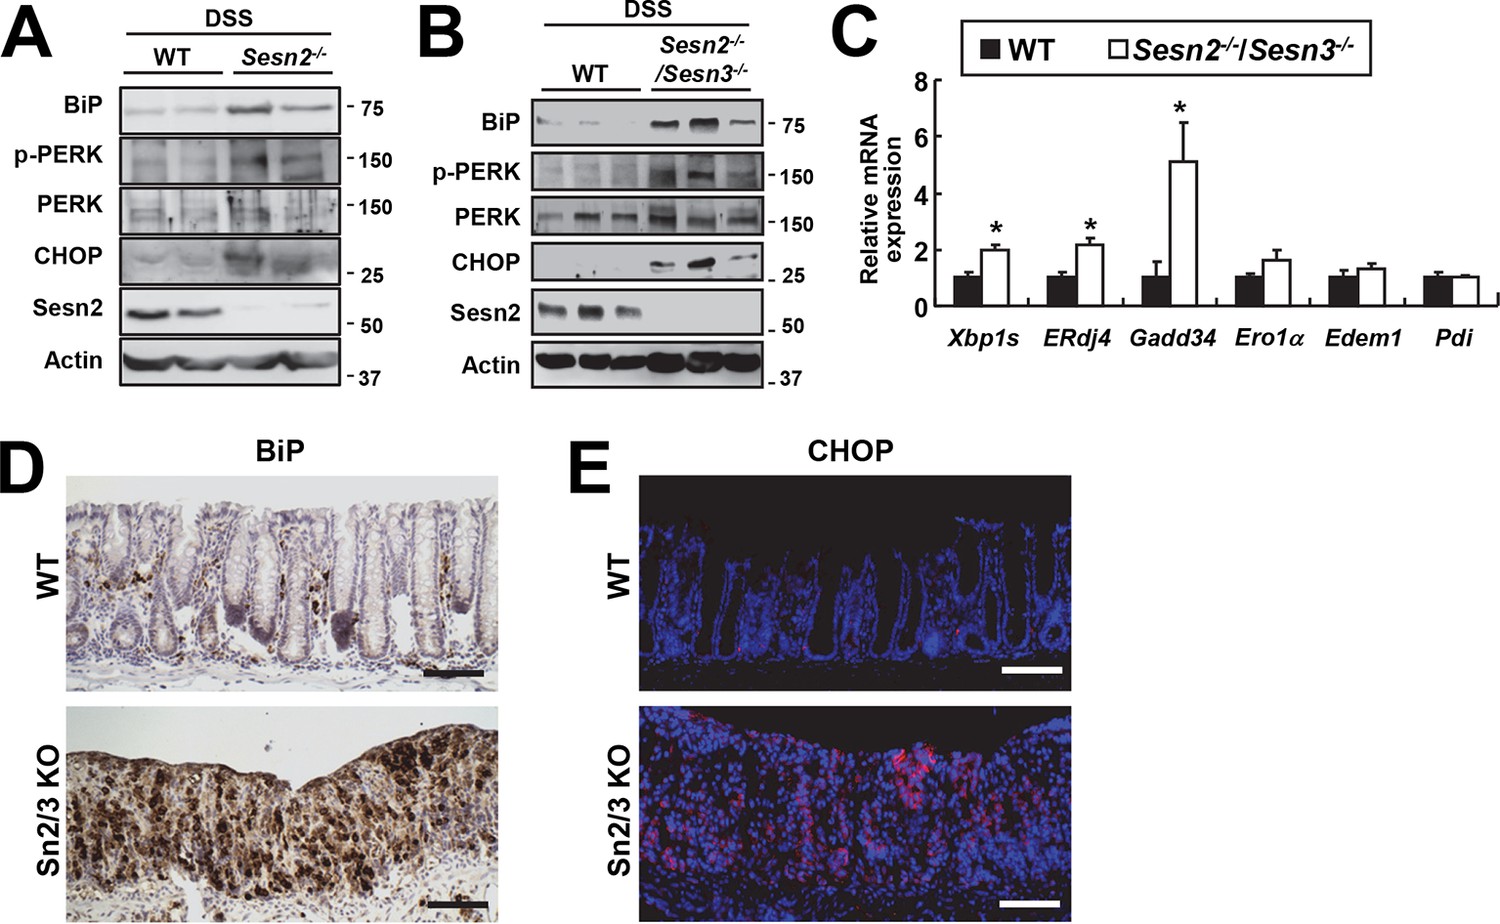
Increased ER stress in colon epithelia of Sesn2-/- and Sesn2-/-/Sesn3-/- mice during DSS-induced colon injury.
Expression or phosphorylation of ER stress signaling markers were analyzed from indicated mice through immunoblotting (A,B), real-time PCR (C; n=4) or immunohistochemistry (D,E). Data are shown as mean ± s.e.m. *p<0.05. P values are from Student’s t-test. Scale bars, 100 μm. Molecular weight markers are indicated in kDa.
Figure 2—figure supplement 3

Uncropped images of blots.
Red boxes indicate the cropped regions. Molecular weight markers are indicated in kDa.
Figure 3 with 1 supplement
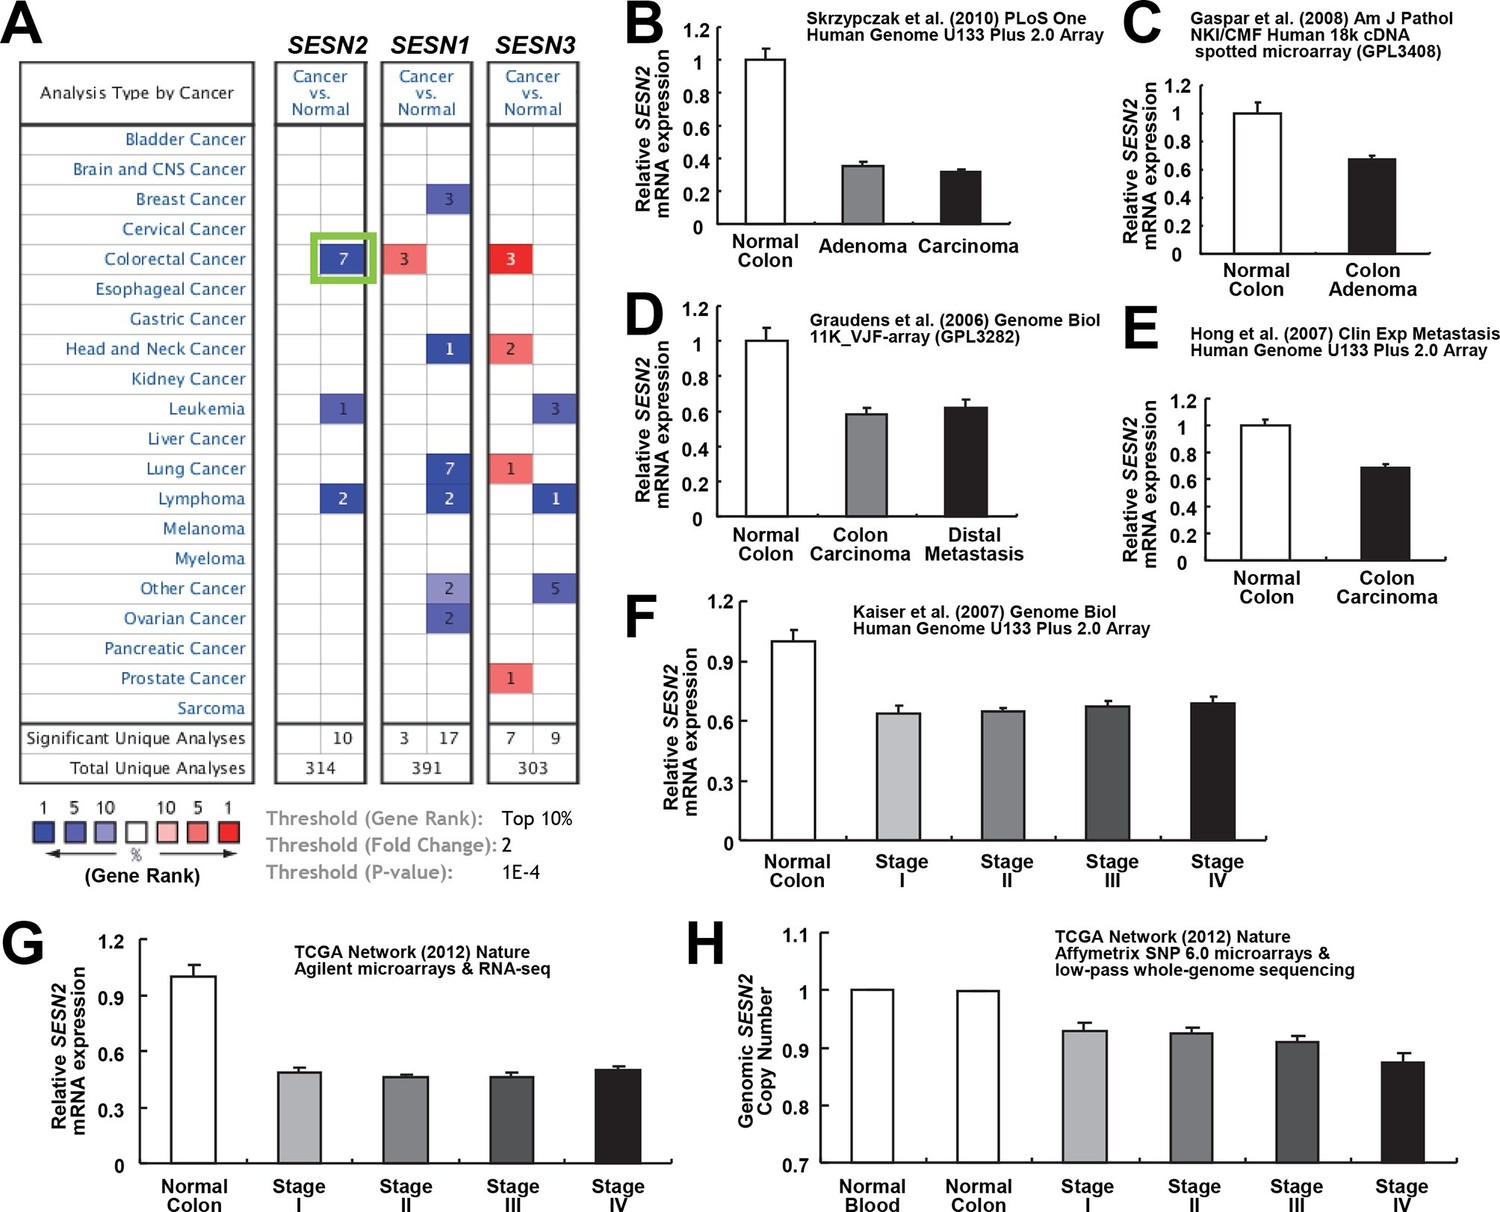
Downregulation of SESN2 in human colon cancer tissues.
(A) Oncomine analysis of Sestrin-family gene expression in normal and cancer tissues of different types. Gene summary views for SESN2, SESN1 and SESN3 genes are shown. Cell color is determined by the best gene rank percentile for the analyses within the cell, as described below the table. Thresholds for gene rank, fold change and P value are also described below the table. Reduction of SESN2 in colorectal cancer tissue (highlighted in the green box) was one of the most significant alterations. (B-G) human SESN2 mRNA expression in normal colon and colon cancer tissues, derived from six independent studies (B-G; total n=40, 78, 58, 82, 80 and 165, respectively) conducted in different platforms (Gaspar et al, 2008; Graudens et al, 2006; Hong et al, 2010; Kaiser et al, 2007; Cancer Genome Atlas Network, 2012; Skrzypczak et al, 2010). (H) DNA copy number analysis of human SESN2 gene in normal blood, normal colon and colon cancer tissues (total n=975), derived from TCGA dataset (Cancer Genome Atlas Network, 2012). Colon cancer staging in F, G and H is according to the TNM staging system from the American Joint Committee on Cancer (AJCC). All data are shown as the mean ± s.e.m. P values between normal and cancer tissues, calculated from Student’s t-test, are all below 10–4 (B-H). For TCGA dataset, P values between normal and cancer tissues are 1.6 x 10⁻³⁰ (G) and 3.7 x 10–58 (H).
Figure 3—figure supplement 1

Expression of cell-type specific markers in human colon cancer tissues.
(A-E) Levels of the following mRNAs were analyzed in the studies described in Figure 3. SESN2, Sestrin2; VIL1, Villin – Expressed in Enterocytes; DLL1, Delta-like 1 – Expressed in Progenitor cells; EMR1, F4/80 – Expressed in Macrophages; LY6G5B, Gr-1 – Expressed in Leukocytes; CTNNB, β-catenin – Expressed in Colonic Epithelia; LGR5, Gpr49 – Expressed in Colonic Stem Cells. All data are shown as the mean ± s.e.m. *p<0.05, **p<0.01, ***p<0.001. N/D, not determined. P values were calculated from Student’s t-test between normal and cancer tissues.
Figure 4 with 1 supplement
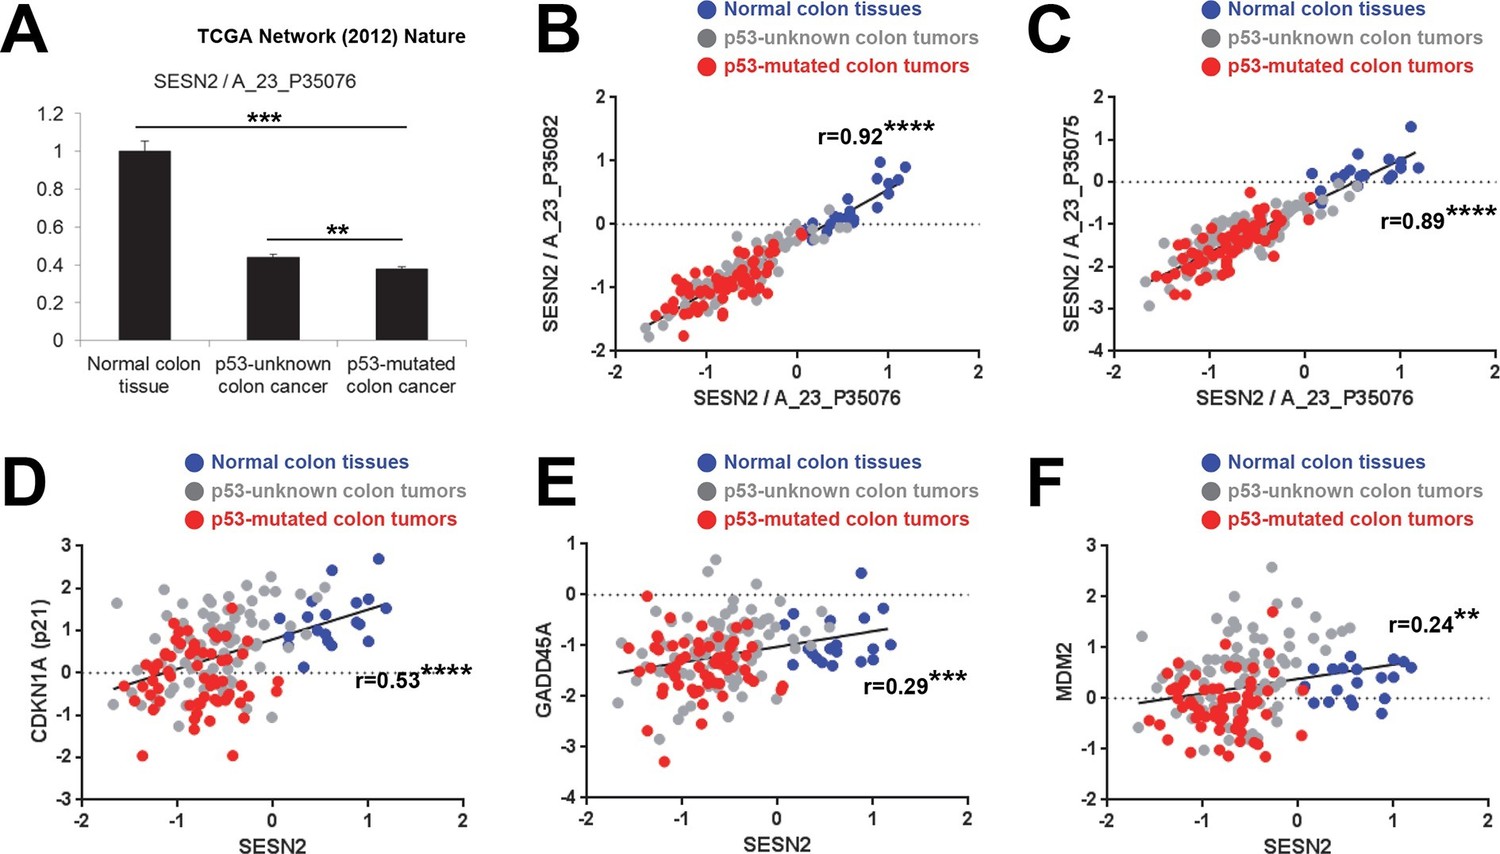
Correlation between p53 status and SESN2 expression in human colon cancer.
TCGA colon/colon cancer dataset (total n=165) was partitioned according to the p53 status (Cancer Genome Atlas Network, 2012). Normal colon tissues do not reveal any TP53 mutation (n=19 in the dataset), while ~43% of tumor samples in the gene expression dataset (n=63 out of total 146 tumor samples), designated as 'p53-mutated', identified missense or nonsense point mutations in the TP53 coding region. Other tumor samples (n=83) are designated as 'p53-unknown'. (A) SESN2 expression was analyzed in indicated tissues. Data are shown as the mean ± s.e.m. **p<0.01,***p<0.001. P values were calculated from Student’s t-test. (B,C) Expression of SESN2 was analyzed in three different probes, and their correlations were visualized by a scatter plot of individual patient tissue samples. Trend lines were approximated through linear regression. Y axis is in a log scale. Normal colon samples are in blue, 'p53-unknown' tumor samples are in gray, and 'p53-mutated' tumor samples are in red. Pearson’s correlation coefficients (r) with P values were calculated and presented. ****p<0.0001. (D-F) Expression of SESN2, CDKN1A, GADD45A and MDM2 was analyzed and their correlations were analyzed as described above for B and C. **p<0.01, ***p<0.001, ****p<0.0001.
Figure 4—figure supplement 1
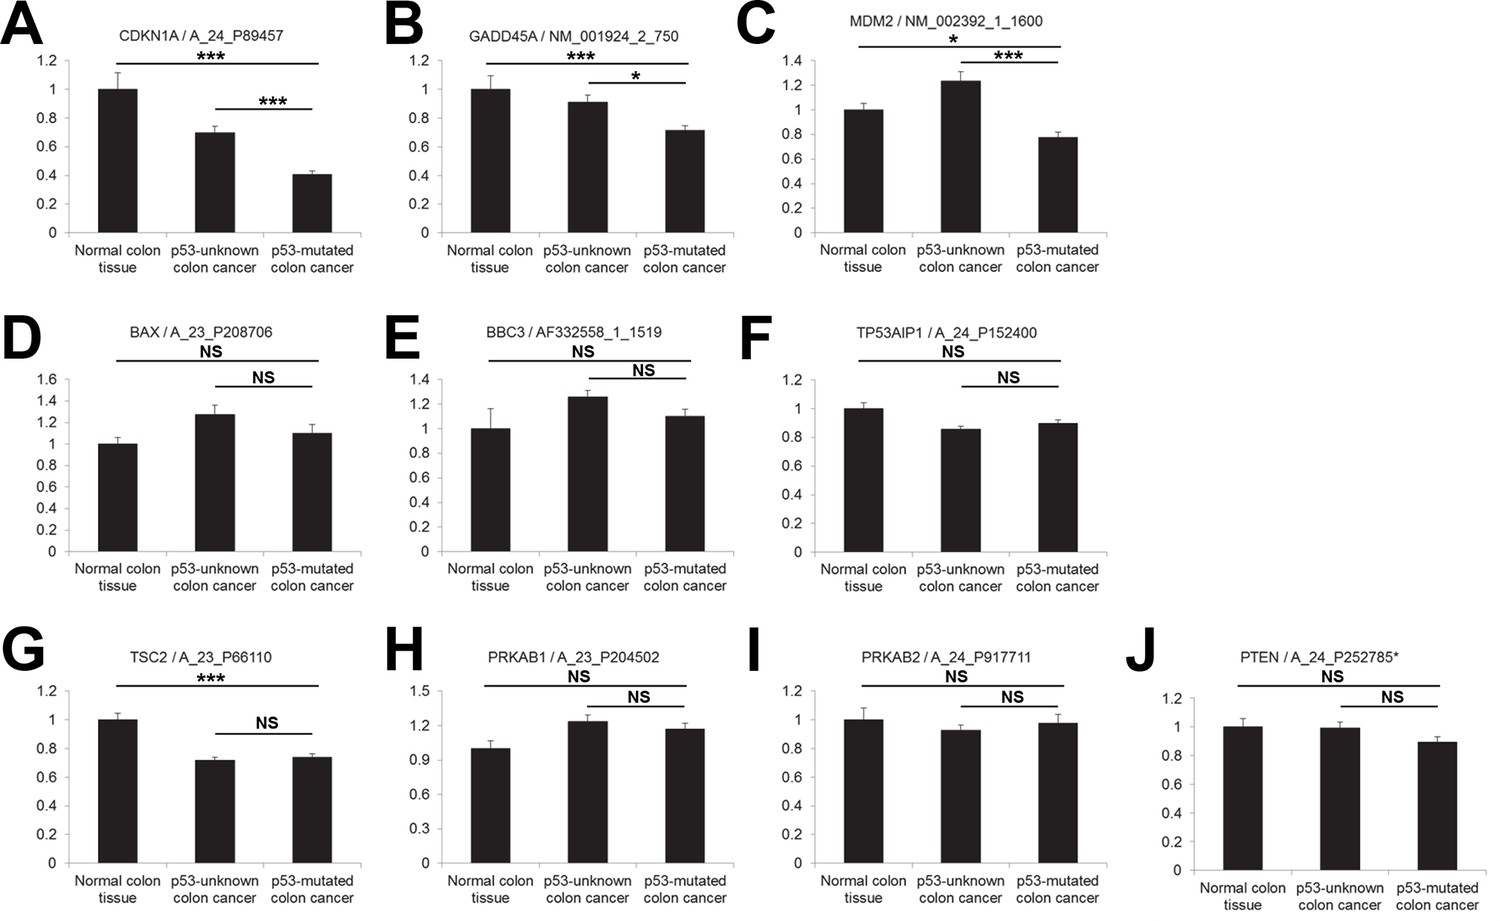
Correlation between p53 status and expression of CDKN1A, GADD45A, MDM2, BAX, PUMA (BBC3), p53AIP1 (TP53AIP1), TSC2, AMPKβ (PRKAB1, PRKAB2) and PTEN in human colon cancer.
(A-J) Gene expression was analyzed in indicated tissues, using the same dataset as in Figure 4. The data are shown as the mean ± s.e.m. NS, not significant; *p<0.05, ***p<0.001. P values were calculated from Student’s t-test.
Figure 5
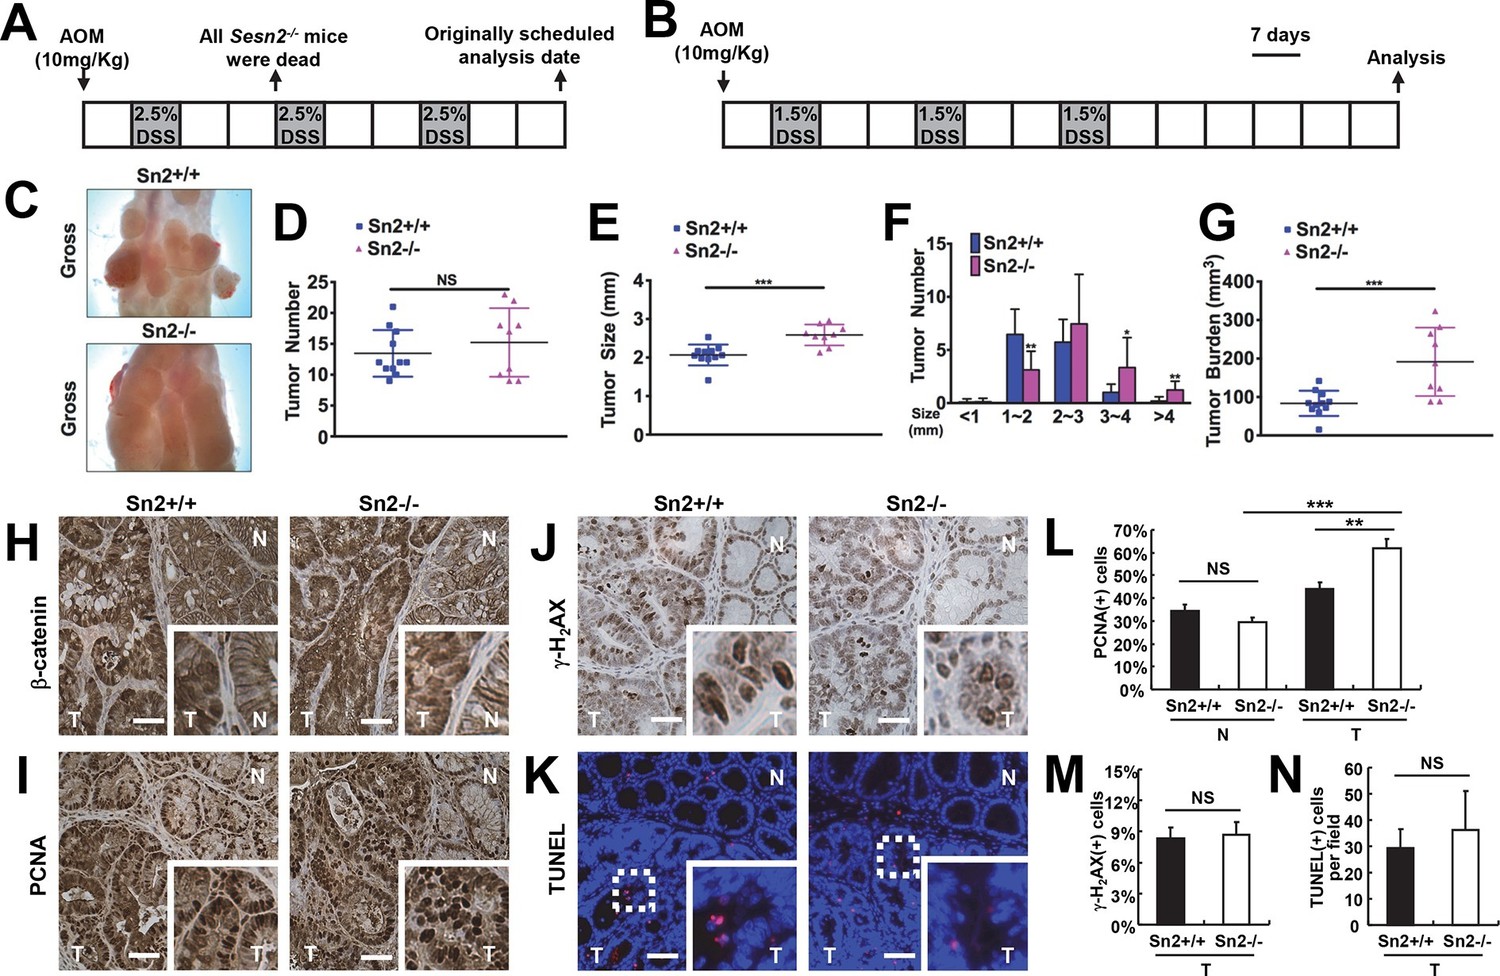
Loss of Sesn2 promotes colon tumor growth in mice.
(A) 2-month-old WT and Sesn2-/- mice were exposed to a standard protocol of azoxymethane (AOM)-dextran sulfate sodium (DSS)-induced colon carcinogenesis as outlined in this figure panel. However, none of the Sesn2-/- mice (n=7) survived after the first round of administration of DSS , suggesting that they are hypersensitive to DSS-induced colitis. (B) WT and Sesn2-/- mice (n=11 each) were subjected to a modified protocol of AOM-DSS-induced colon cancer. By reducing the dose of DSS to 1.5%, we were able to keep a substantial number of Sesn2-/- mice (n=9) alive until the experimental endpoint. Tumor incubation period was extended to 100 days to compensate for the lower dose of DSS treatment. (C-G) After completion of the experiment, colons were examined under a dissection microscope (C), and tumor number (D), average tumor size (E), size of individual tumors (F) and total tumor burden (G) were analyzed and presented as means from each mouse and as mean ± s.d. of the whole groups. (H-N) Sestrin2-deficient tumors exhibit increased proliferation. Colon tumor (T) and normal colon (N) tissues of indicated mice were subjected to immunohistochemistry of β-catenin (H), PCNA (I) and γ-H2AX (J) or TUNEL staining (K). PCNA- (L), γ-H2AX- (M) and TUNEL-positive (N) cells from indicated tissues were quantified and presented as mean ± s.e.m. NS, not significant; *p<0.05, **p<0.01, ***p<0.001. P values are from Student’s t-test. Scale bars, 100 μm.
Figure 6 with 4 supplements
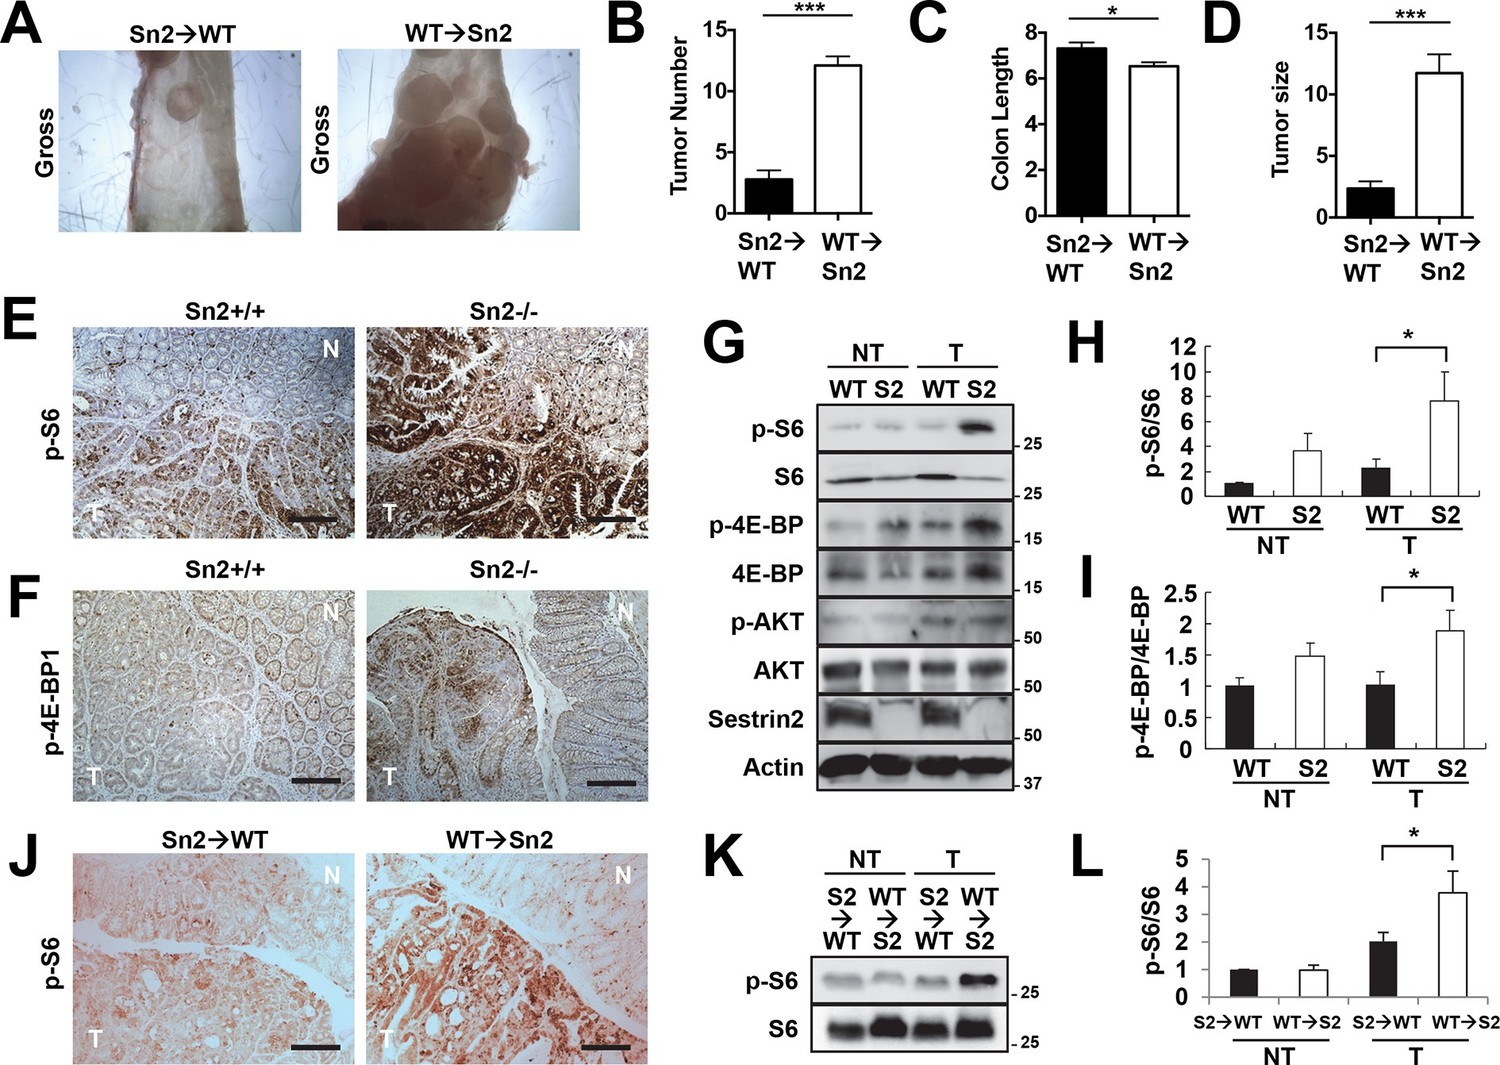
Sestrin2 loss increases mTORC1 signaling in colon cancer.
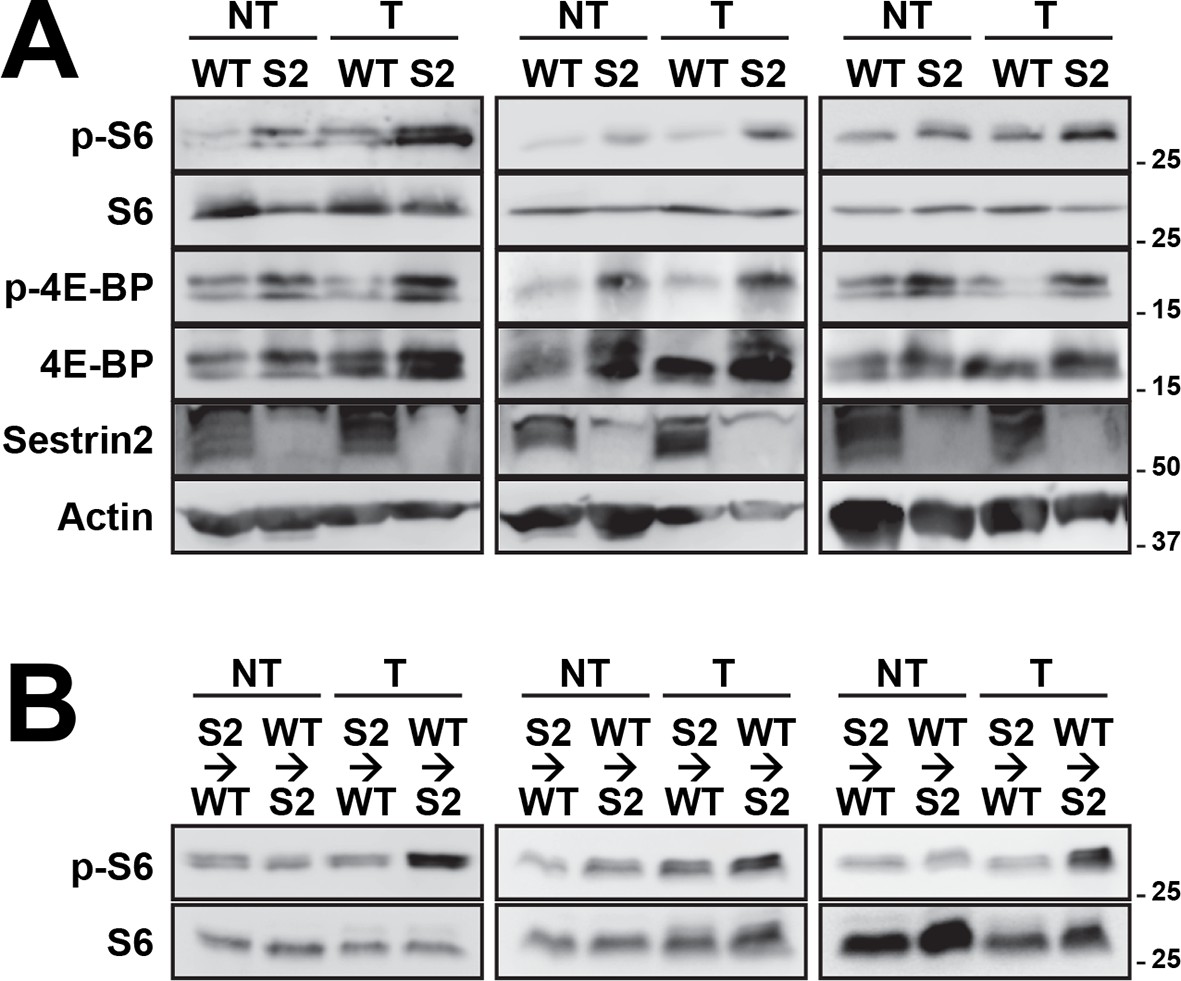
(A-D) 3-month-old WT and Sesn2-/- mice (n=11 each) were subjected to lethal irradiation and injected with bone marrow cells from age-matched Sesn2-/- (Sn2→WT) and WT (WT→Sn2) mice, respectively. After 1 month, mice were subjected to AOM/DSS administration as indicated in Figure 5B. After completion of the experiment, colons were examined under a dissection microscope (A), and tumor number (B), colon length (C) and tumor size (D) were analyzed and presented as mean ± s.e.m. (E, F and J) Colon tumor (T) and normal colon (N) tissues of indicated mice were subjected to immunohistochemistry of phospho-Ser235/236-S6 (E and J) or phospho-Thr37/46-4E-BP (F). (G-I, K and L) Colon tumor (T) and normal colon (NT) tissues of WT and Sesn2-/- (S2) mice (G-I), as well as WT→Sn2 and Sn2→WT mice (K and L), were subjected to immunoblotting of indicated mTORC1 and mTORC2 signaling markers (G and K). Relative band intensities were quantified through densitometry and presented as mean ± s.e.m (H, I and L; n=6 in each group). *p<0.05, ***p<0.001. P values are from Student’s t-test. Scale bars, 200 μm. Molecular weight markers are indicated in kDa.
Figure 6—figure supplement 1
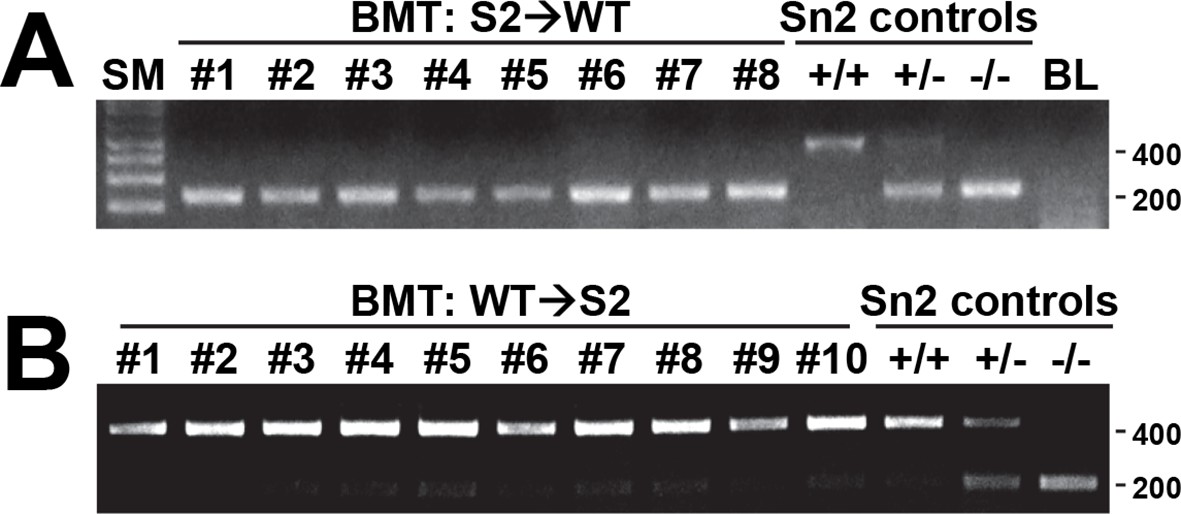
Efficiency of bone marrow transplantation.
Spleen tissues from S2→WT (A) and WT→S2 (B) mice described in Figure 6 were genotyped for WT (upper band, ~450bp) and Sesn2-KO (lower band, ~200bp) alleles. Molecular weight markers are indicated in bp.
Figure 6—figure supplement 2
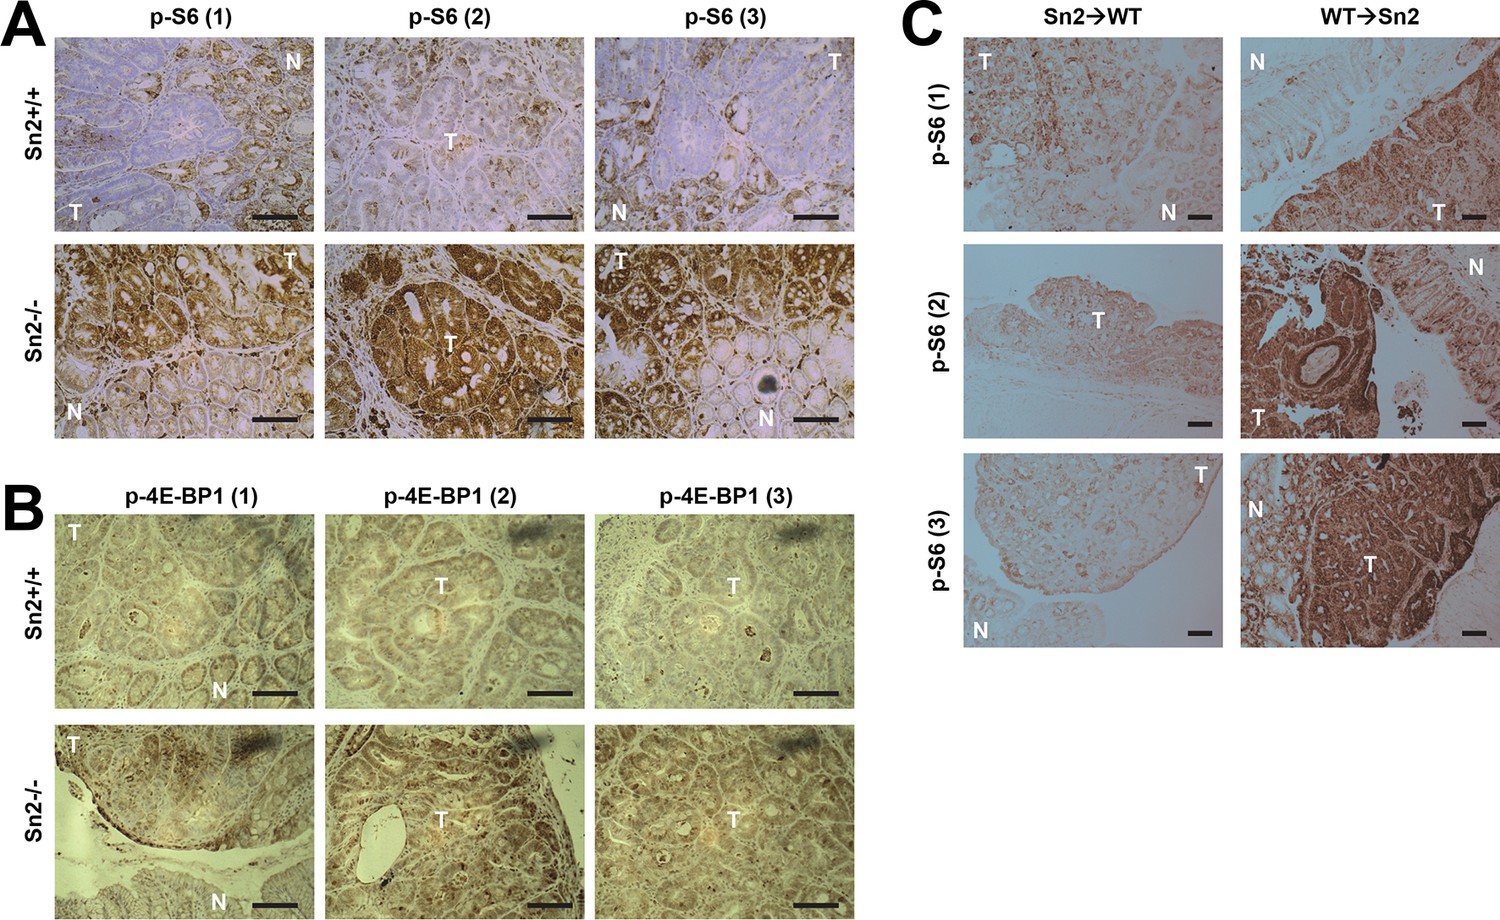
Additional immunohistochemistry results for Figure 6E (A), Figure 6F (B) and Figure 6J (C).
Colon tumor (T) and normal colon (N) tissues of indicated mice were subjected to immunohistochemistry of phospho-Ser235/236-S6 (A and C) or phospho-Thr37/46-4E-BP (B). Scale bars, 100 μm.
Figure 6—figure supplement 3
Additional immunoblotting results for Figure 6G (A) and Figure 6K (B).
Colon tumor (T) and normal colon (NT) tissues of WT and Sesn2-/- (S2) mice (A), as well as WT→Sn2 and Sn2→WT mice (B), were subjected to immunoblotting of indicated mTORC1 and mTORC2 signaling markers. Molecular weight markers are indicated in kDa.
Figure 6—figure supplement 4
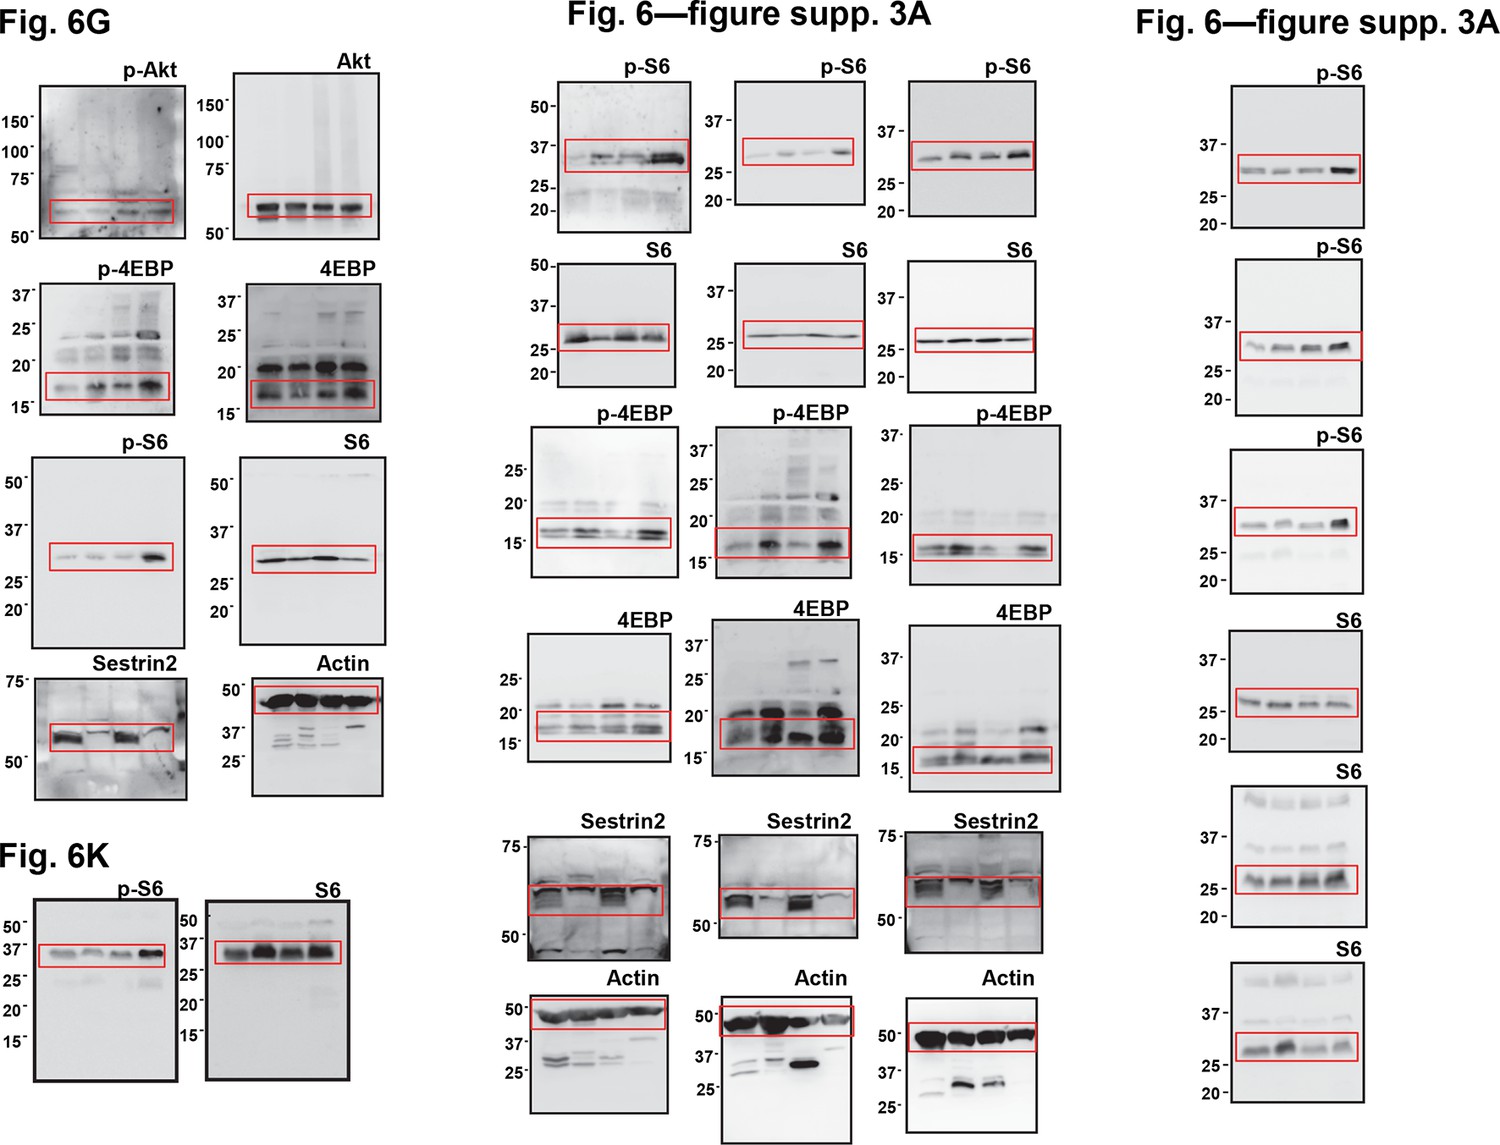
Uncropped images of blots.
Red boxes indicate the cropped regions. Molecular weight markers are indicated in kDa.
Figure 7 with 3 supplements
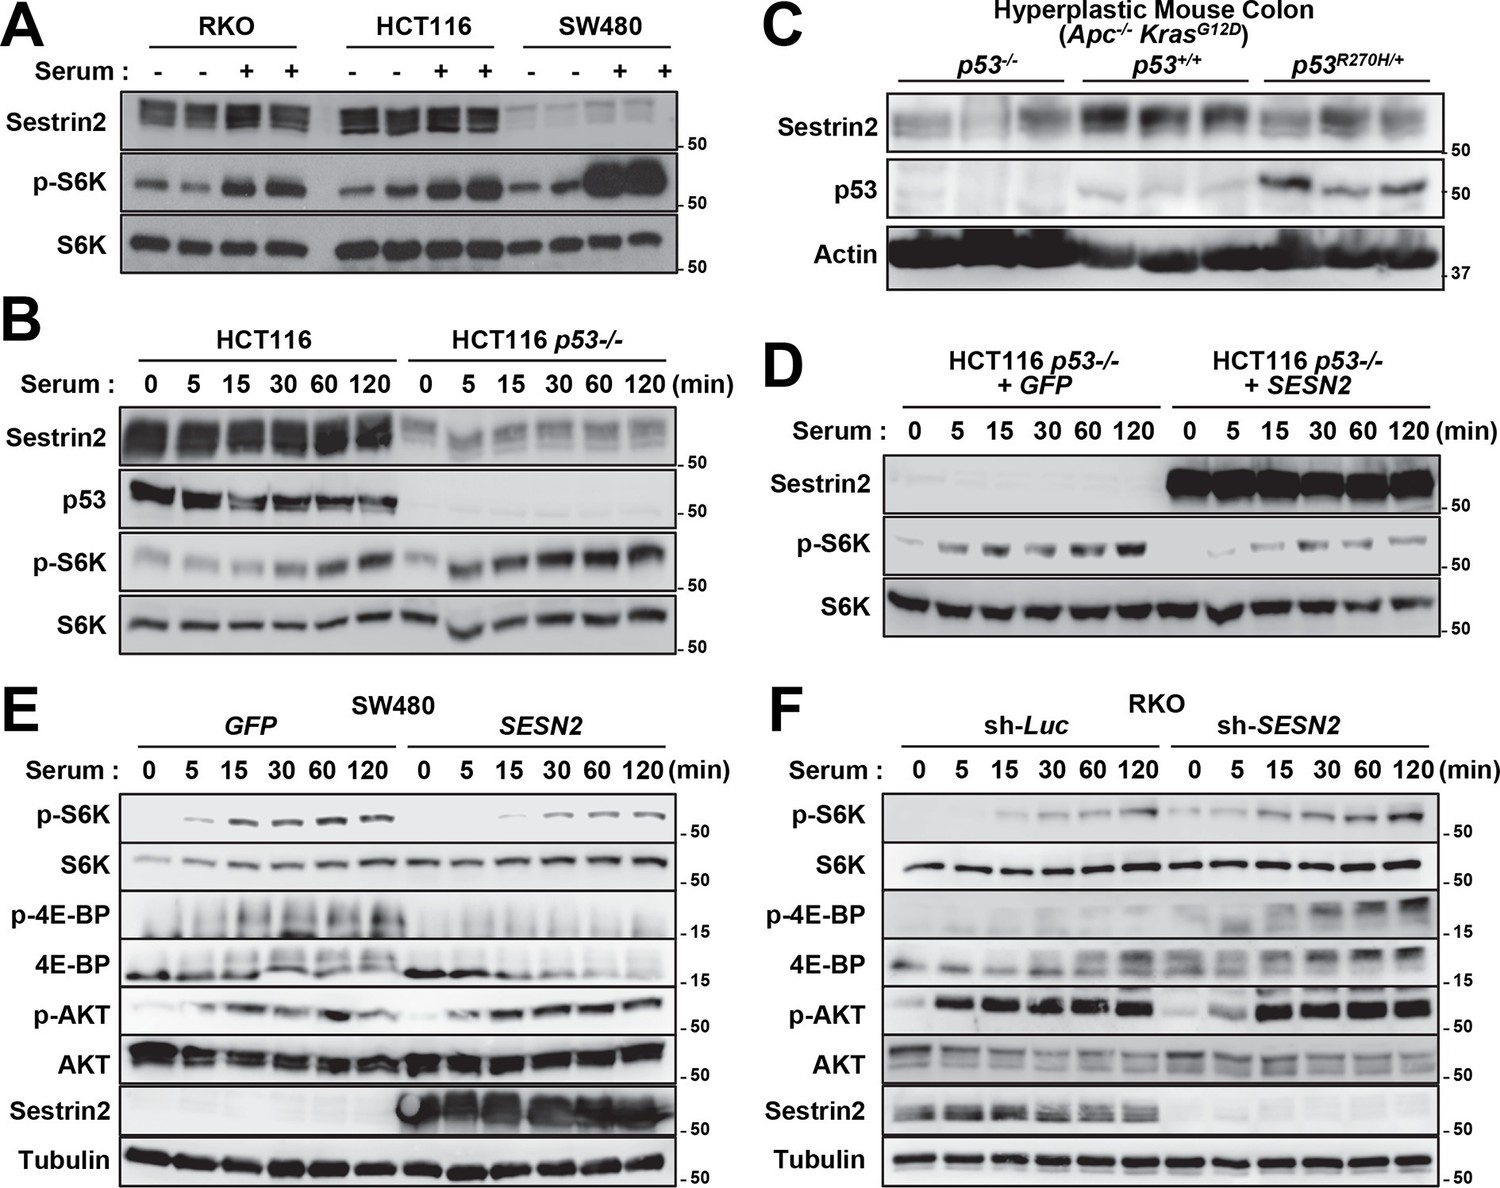
p53 controls mTORC1 signaling through Sestrin2 in colon cancer cells.
(A-F) Whole cell or tissue lysates from the following experiments were subjected to immunoblotting of indicated proteins. (A) Human colon cancer cell lines (RKO, HCT116 and SW480) were serum-starved for 24 hr and then treated with 10% FBS (serum) for 2 hr. (B) p53-knockout (HCT116 p53-/-) and control HCT116 cells were serum-starved for 24 hr and then treated with 10% FBS for indicated time. (C) CDX2P-CreERT2Apcflox/flox KrasLSL-G12D/+ p53flox/flox (left three lanes), CDX2P-CreERT2Apcflox/flox KrasLSL-G12D/+ p53+/+ (centre three lanes), and CDX2P-CreERT2Apcflox/flox KrasLSL-G12D/+ p53R270H/+ (right three lanes) mice (Feng et al, 2013) were daily injected with 100 mg/kg tamoxifen (i.p.) for 3 days, and dysplastic colon tissues were harvested after 8 days. (D) HCT116 p53-/- cells were infected with GFP- or Sestrin2-expressing lentiviruses. After 24 hr, cells were serum-starved for 24 hr and treated with 10% FBS for indicated time. (E) SW480 cells were infected with GFP- or Sestrin2-expressing lentiviruses. After 24 hr, cells were serum-starved for 24 hr and treated with 10% FBS for indicated time. (F) RKO cells, stably infected with lentiviruses expressing shRNA targeting luciferase (sh-Luc) or the SESN2 (sh-SESN2) gene, were serum-starved for 24 hr and then treated with 10% FBS for indicated time. Molecular weight markers are indicated in kDa.
Figure 7—figure supplement 1
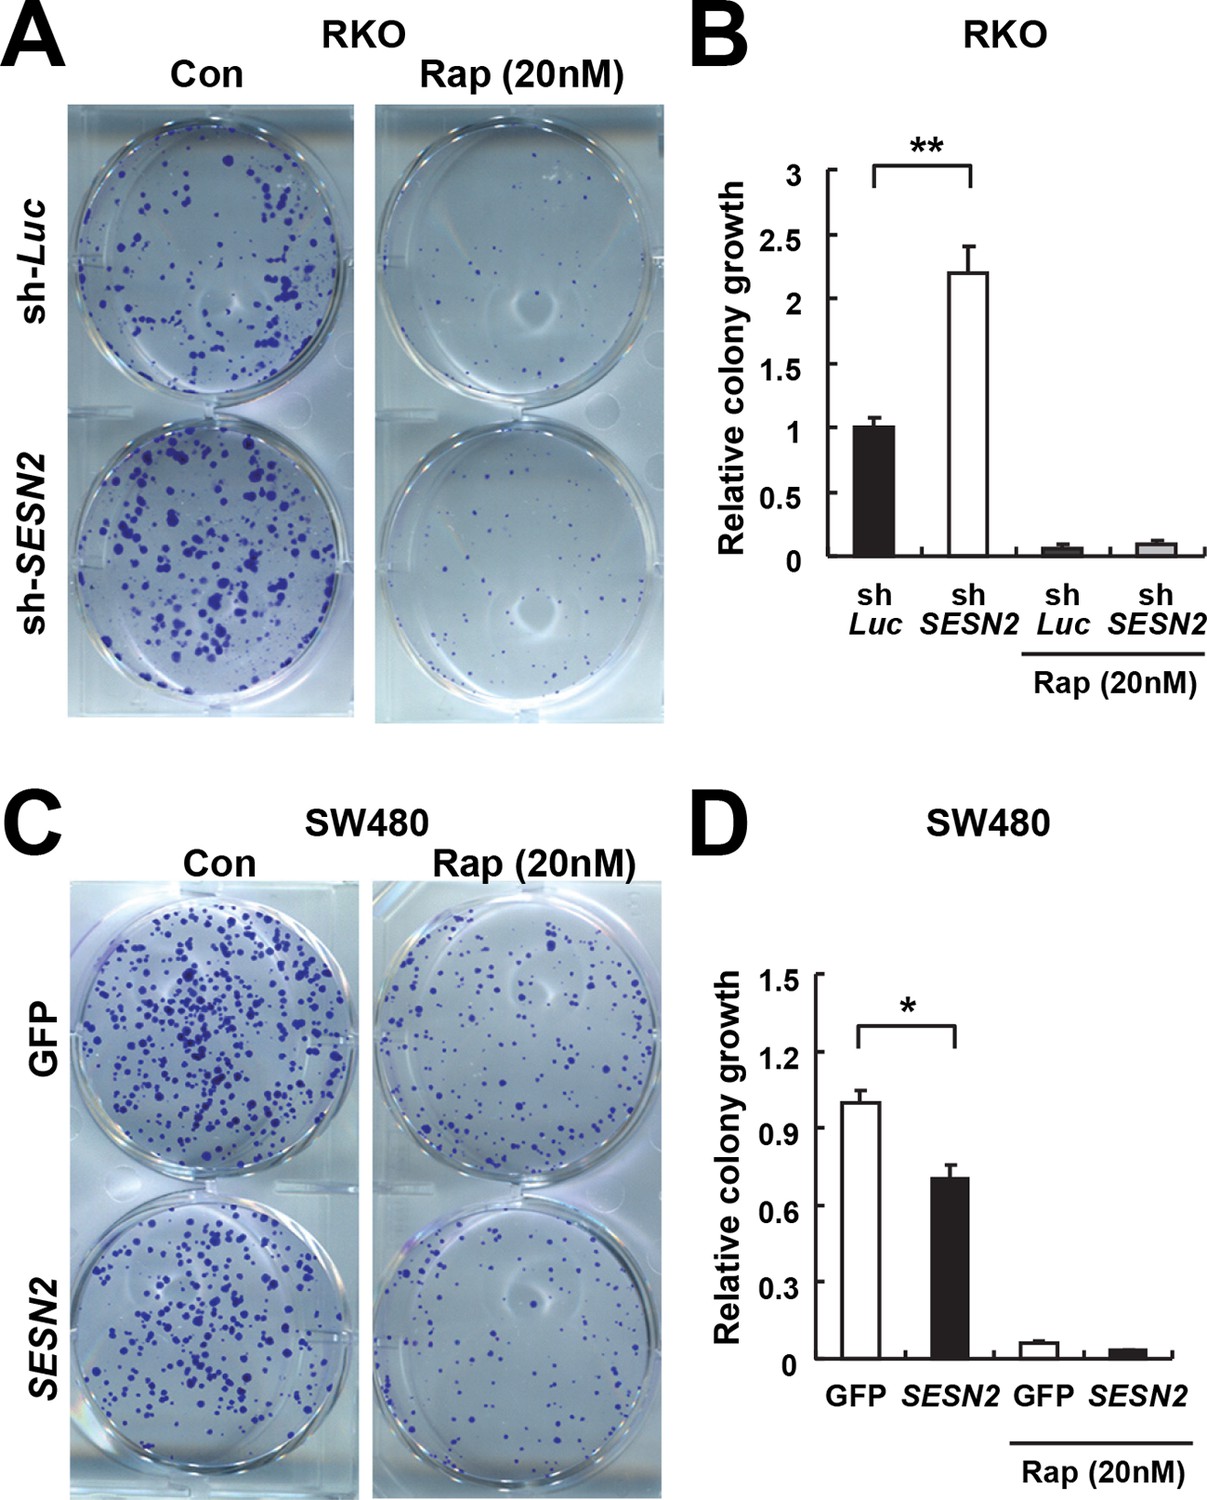
Sestrin2 inhibits colon cancer cell growth through mTORC1 inhibition.
(A and B) RKO cells, stably infected with lentiviruses expressing shRNA targeting luciferase (sh-Luc) or the SESN2 (sh-SESN2) gene, were subjected to colony-forming assay. In brief, cells were seeded sparsely (1000 cells per well for 6-well plates) and grown for 10 days in normal medium with or without rapamycin (Rap, 20 nM). Colonies were fixed in methanol and stained with 0.1% crystal violet (C581, Fisher Scientific). The plates were imaged under EPSON Perfection V30 scanner (A). Relative colony growth was determined by densitometry of stained images (B; n=3 from three different plates per group). (C and D) SW480 cells were infected with lentiviruses expressing GFP or SESN2. At 24 hr after the infection, the cells were subjected to a colony-forming assay as described above (n=3). All data are shown as the mean ± s.e.m. *p<0.05, **p<0.01. P values are from Student’s t-test.
Figure 7—figure supplement 2
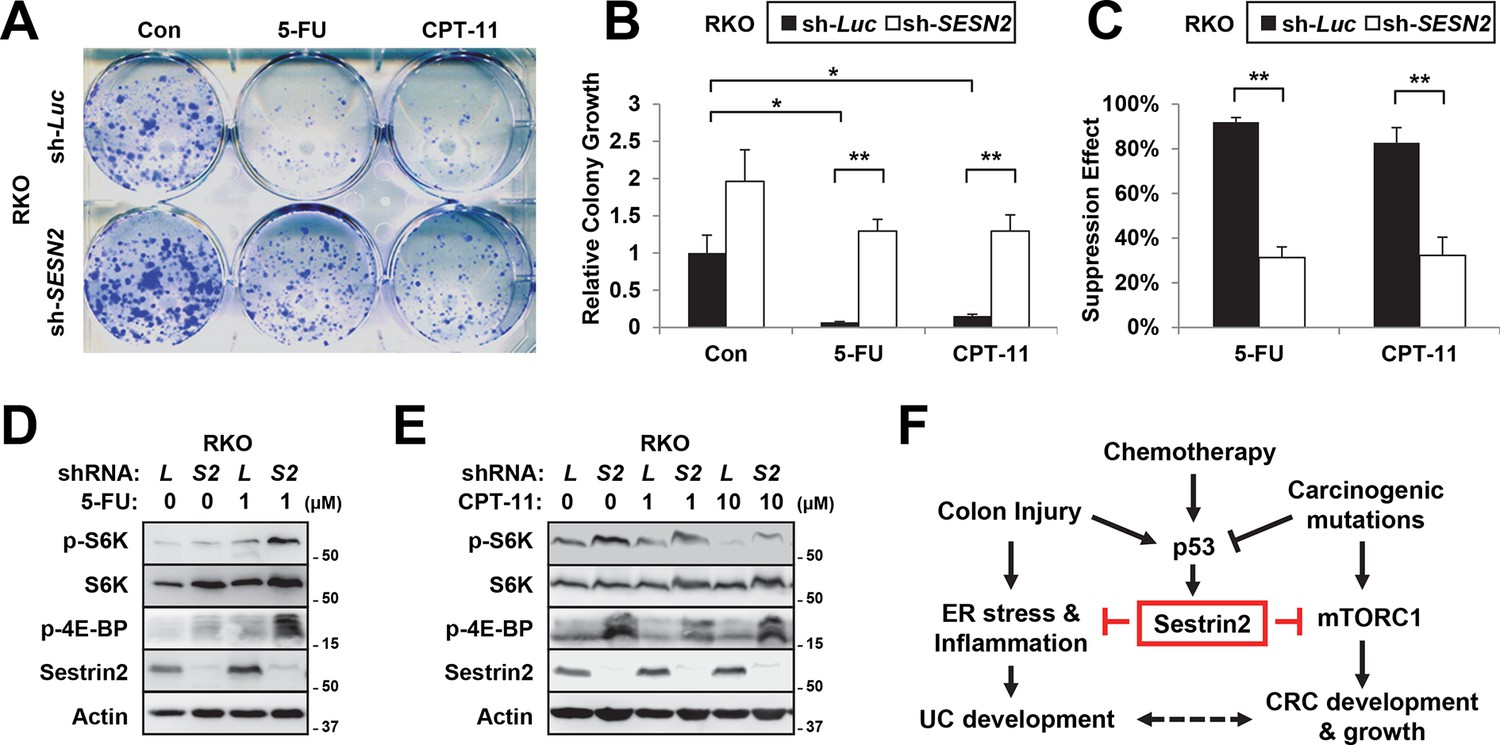
Sestrin2-deficiency renders cancer cells less sensitive to chemotherapy.
(A-C) RKO cells, stably infected with lentiviruses expressing shRNA targeting luciferase (sh-Luc) or the SESN2 (sh-SESN2) gene, were subjected to colony-forming assay. In brief, cells were seeded sparsely (1000 cells per well for 6-well plates), treated with 5-fluorouracil (5-FU, 1 μM) and irinotecan (CPT-11, 10 μM) as indicated for 24 hr, and grown for 14 days in normal medium. Colonies were fixed in methanol and stained with 0.1% crystal violet (C581, Fisher Scientific). The plates were imaged under EPSON Perfection V30 scanner (A). Relative colony growth was determined by densitometry of stained images (B; n=3 from three different plates per group), and the growth suppression effects of 5-FU and CPT-11 were calculated from the densitometry results (C; n=3 from three different plates per group). (D,E) RKO cells, stably infected with sh-Luc or sh-SESN2 gene, were treated with indicated concentrations (μM) of 5-FU and CPT-11 for 24 hr and subjected to immunoblotting of indicated proteins. (F) Current model of how Sestrin2 suppresses colon cancer progression. During colitis, Sestrin2 promotes restoration of colon homeostasis after injury through limiting ER stress. However, during carcinogenesis, p53 is inactivated and Sestrin2 expression is downregulated, which subsequently causes hyperactivation of mTORC1 signaling and promotes colon cancer development and growth. The p53-Sestrin2 axis may also be important for the effect of chemotherapy in attenuating colon cancer growth. All data are shown as the mean ± s.e.m. *p<0.05, **p<0.01. P values are from Student’s t-test.
Figure 7—figure supplement 3
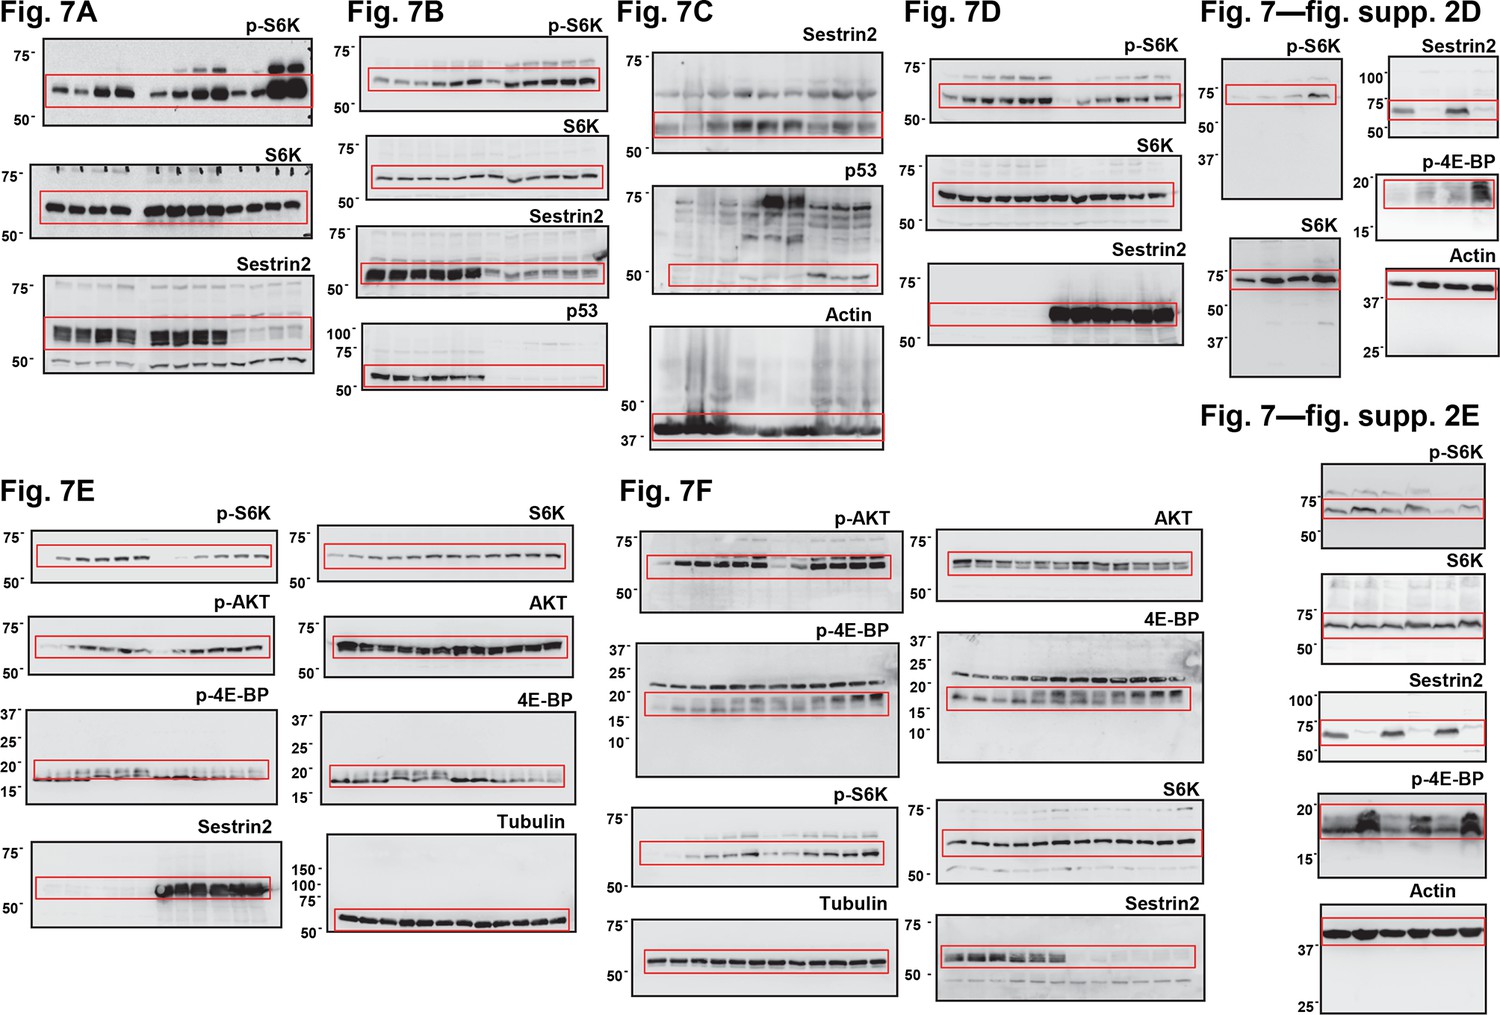
Uncropped images of blots.
Red boxes indicate the cropped regions. Molecular weight markers are indicated in kDa.
Download links
A two-part list of links to download the article, or parts of the article, in various formats.
Downloads (link to download the article as PDF)
Open citations (links to open the citations from this article in various online reference manager services)
Cite this article (links to download the citations from this article in formats compatible with various reference manager tools)
Tumor suppressive role of sestrin2 during colitis and colon carcinogenesis
eLife 5:e12204.
https://doi.org/10.7554/eLife.12204


