Mapping the functional versatility and fragility of Ras GTPase signaling circuits through in vitro network reconstitution
- Howard Hughes Medical Institute, University of California, San Francisco, United States
- University of California, San Francisco, United States
Figures
Figure 1
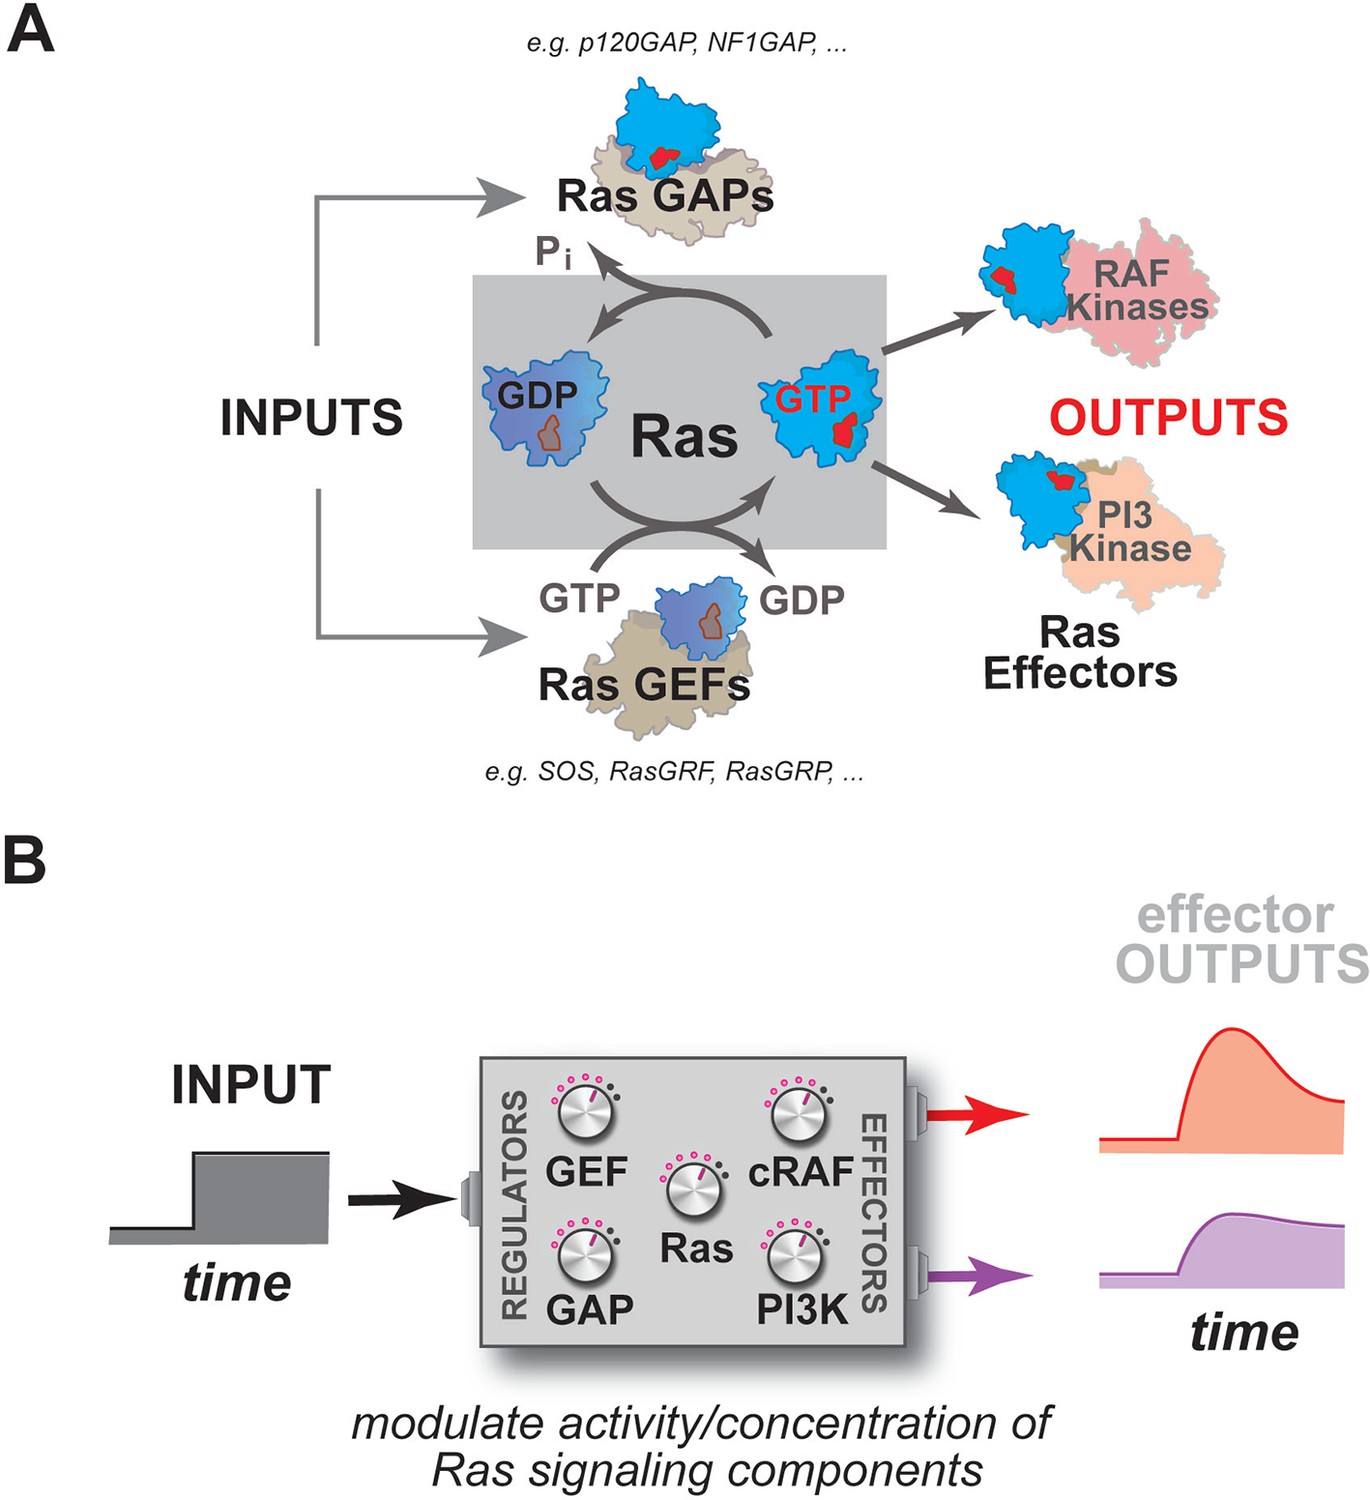
Multiple activities that are frequently perturbed in disease dynamically regulate Ras activity to control the assembly of downstream effectors during signal processing.
(A) Depiction of the proximal architecture of Ras signaling systems. Ras is activated by guanine exchange factors (GEFs) that exchange GDP for GTP and is inactivated by GTPase-activating proteins (GAPs) that accelerate the hydrolysis of GTP. Activated Ras interacts with downstream effectors such as Raf or PI3 Kinase to assemble signaling complexes and elicit signaling outputs. (B) Abstraction of the proximal biochemical machinery underlying Ras processing of inputs into outputs, raising the question as to how the network configuration shapes signaling to multiple effector outputs.
Figure 2 with 1 supplement
A network-level multi-turnover reconstitution of dynamic signal transmission from Ras to downstream effectors.
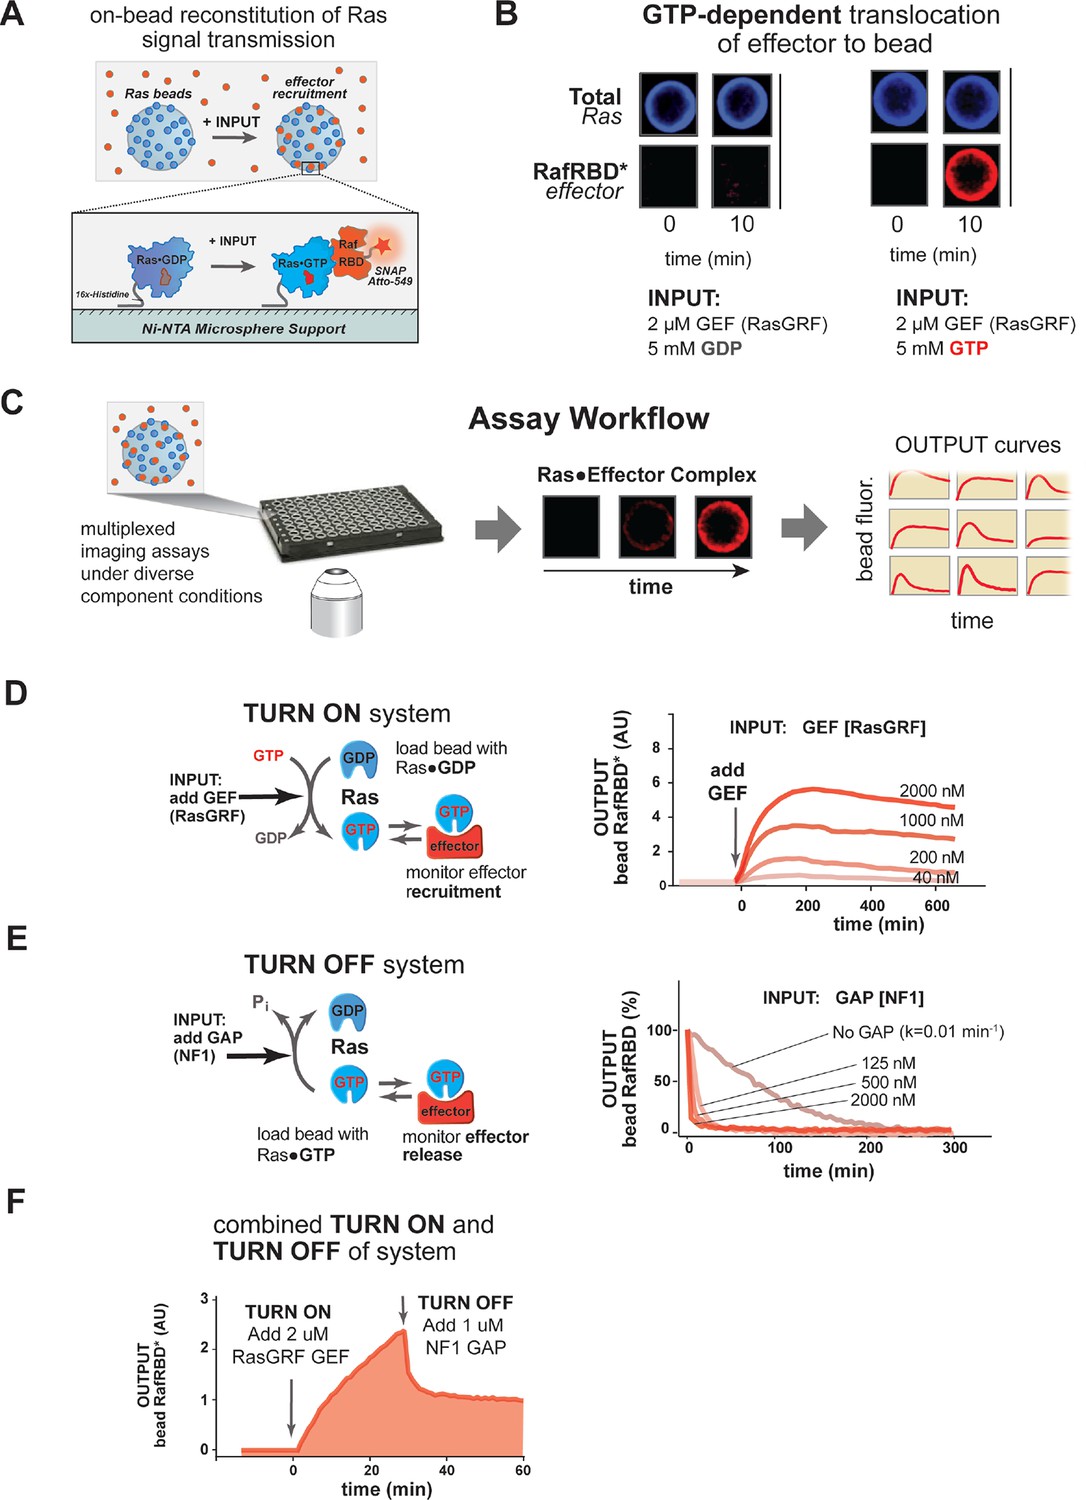
(A) Bead-based approach used to study how Ras systems assemble effector complexes in response to inputs. By incubating Ni-NTA microspheres that have been loaded with Ras in solutions containing GEFs, GAPs, and fluorescent effectors, system outputs can be observed by monitoring the accumulation of effector on the bead-bound Ras. (B) Example of GEF-catalyzed GTP-dependent translocation of fluorescent effector to Ras-loaded bead. The amount of fluorescent effector bound to an individual bead before or after (10 min) addition of 2 μM GEF +/- 5 mM GDP or GTP is shown. (C) Schematic depicting multiplexed assay workflow in which the output dynamics for many different system configurations can be measured by microscopy. (D) Dose-dependent signaling response of effector translocation in response to increasing amounts of indicating RasGRF GEF activity. (E) Dose-dependent turn-off of output in the presence of saturating effector and increasing amounts of indicated NF1 GAP activity. (F) Combined turn on and turn off behavior of effector response when the system was activated with 2 μM RasGRF GEF and after 30 min NF1-GAP was added. GAPs, GTPase-activating proteins; GEFs, guanine exchange factors.
Figure 2—figure supplement 1

RasGRF GEF and NF1 GAP dose-dependent effects on effector output behaviors.
(A) Dose-dependent effect of increasing RasGRF GEF concentratiosn on initial rates of the c-Raf RBD effector to Ras-loaded beads. (B) Dose-dependent effect of increasing RasGRF GEF concentrations on steady state levels of the c-Raf RBD effector on Ras-loaded beads. (C) Dose-dependent effect of increasing NF1 GAP concentrations on disappearance of c-Raf RBD effecro from Ras•GTP-loaded beads. GAP, GTPase-activating protein; GEF, guanine exchange factor; RBD, Ras-binding domain.
Figure 3 with 2 supplements
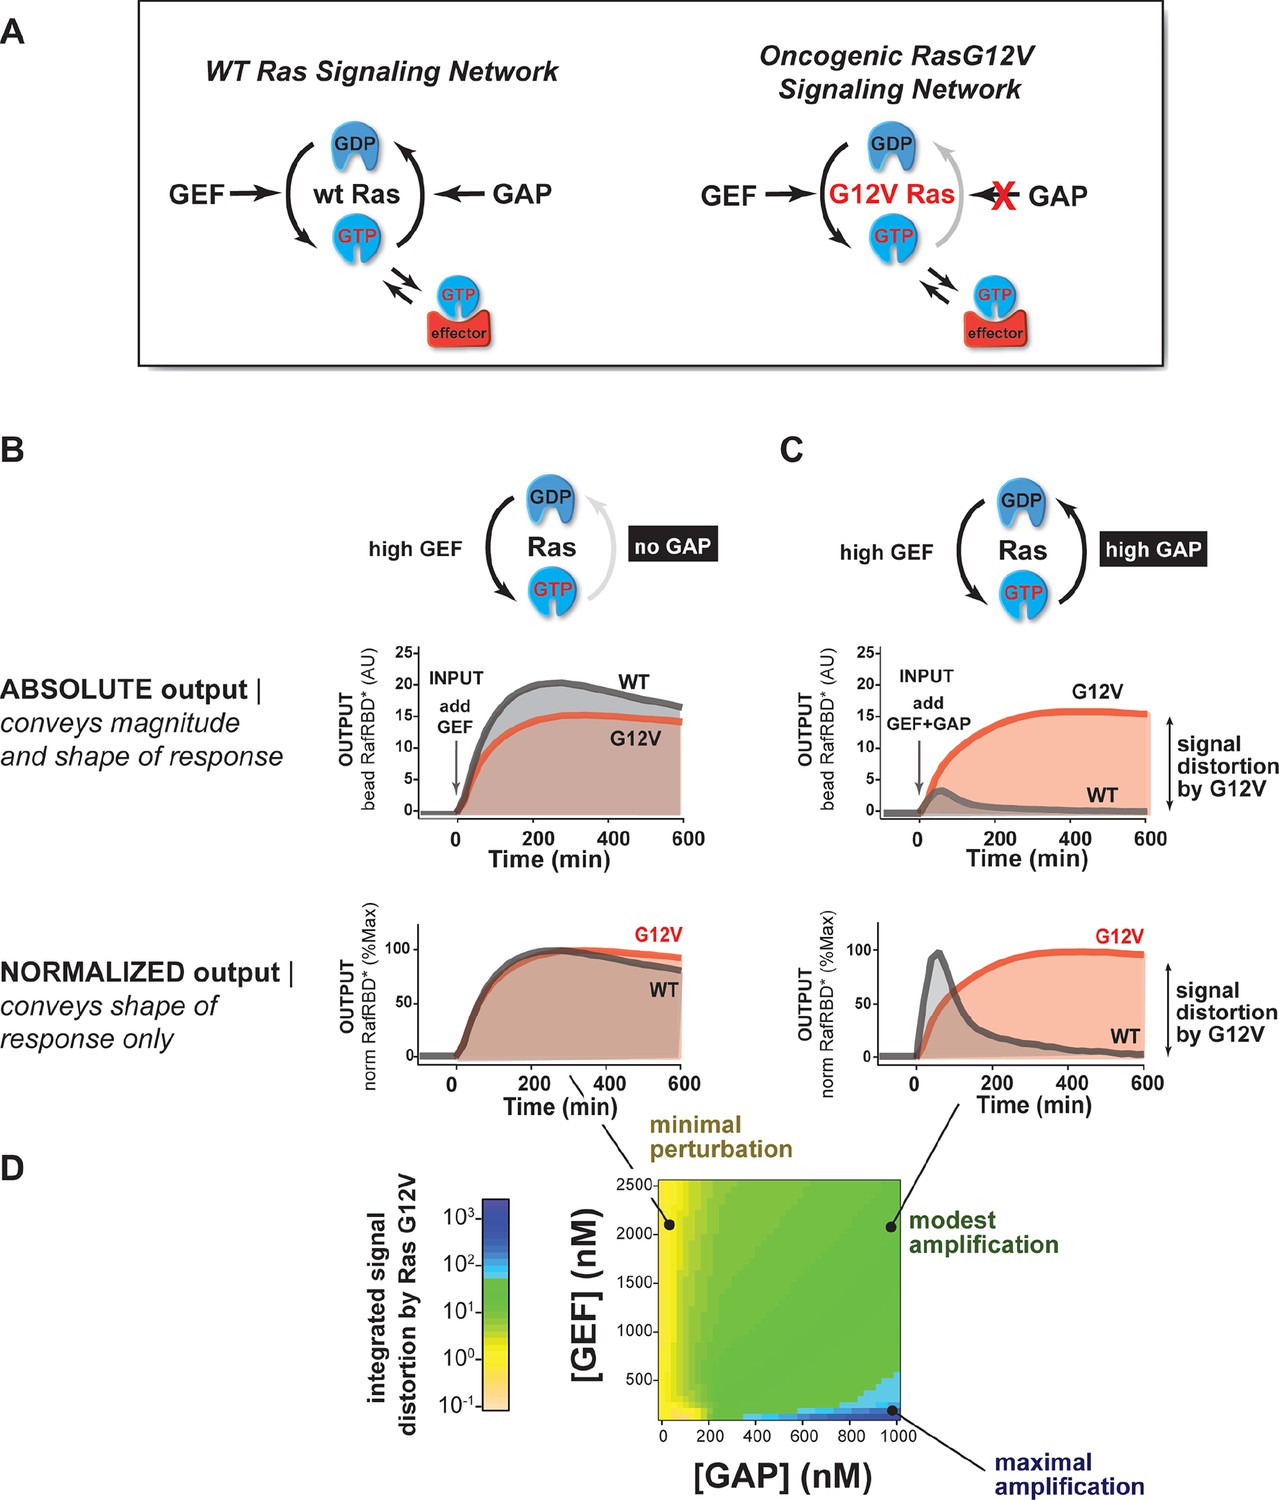
The extent of signal processing distortion by oncogenic alleles of Ras depends on the balance of positive and negative regulatory activities in the network.
(A) Depiction of wild-type (WT) Ras and oncogenic G12V Ras, illustrating the modes by which mutation is thought to impact the network behavior: changing intrinsic hydrolysis rate, blocking GAP-mediated hydrolysis, and modulating effector interactions. (B) Absolute and normalized effector responses to a 2 μM RasGRF GEF step input in the absence of any GAP activity. (C) Absolute and normalized responses of the same step input as in (B), but with 1 μM NF1 GAP activity present in the network. (D) Experimentally determined phase diagram derived from 16 output responses showing the magnitude of signal distortion caused by G12V substitution (defined as fold-change in integrated signal of G12V relative to WT) in different GEF and GAP network configurations. GAP, GTPase-activating protein; GEF, guanine exchange factor.
Figure 3—figure supplement 1

The extent of signal processing distortion by oncogenic G12C and Q61L alleles of Ras depends on the balance of positive and negative regulatory activities in the network.
(A) Depiction of wild-type Ras and oncogenic G12C/Q61L Ras illustrating the modes by which mutation is thought to impact the network behavior: changing in intrinsic hydrolysis rate, blocking GAP-mediated hydrolysis, and modulating effector interactions. (B) Absolute effector responses for G12C and WT Ras in response to a 2 μM RasGRF GEF step input in the absence of any GAP activity. (C) As in (B) but with 1 μM NF1 GAP activity present in the network. (D) Absolute effector responses for Q61L and WT Ras in response to a 2 μM RasGRF GEF step input in the absence of any GAP activity. (E) As in (D) but with 1 μM NF1 GAP activity present in the network. GAP, GTPase-activating protein; GEF, guanine exchange factor; WT, wild type.
Figure 3—figure supplement 2

Kinetic modeling and simulations suggest competition and intermediate GTPase states contribute to transient system behavior.
Kintek simulations for a variety of models. Each simulation contains initial conditions of 50 nM effector, 10 nM GDP bound Ras, a GEF activity of ~1 υM, and an 'infinite' supply of nucleotide (100000 nM). (A) Output of Kintek simulation based on the simplest two-state model described in the main text methods. [GAP] is titrated by varying the hydrolysis rate constant over 5 orders of magnitude. (B) Output of Kintek simulation based on extending the simplest two-state model to include competition between GAP and effectors as described in the main text methods. The output from six different GAP concentrations are shown for two different GAP parameter choices. Overshoot is observed for the non-physiologic GAP parameter set (koff = 0.0001 s-1 and kcat = 0.0001 s-1). However, this is not observed when physiologic GAP parameters are used (koff = 0.01 s-1, kcat = 1s-1). (C) Output from a three-state GTPase model that includes competition between GAP and effector, as described in the main text methods. The output from six different GAP concentrations are shown for a physiologic choice of GAP parameters (koff = 0.01 s-1, kcat = 1 s-1). Transient overshoot behavior mirroring the experimentally obtained data in Figure 3 are obtained in this simulation. GAP, GTPase-activating protein; GEF, guanine exchange factor.
Figure 4
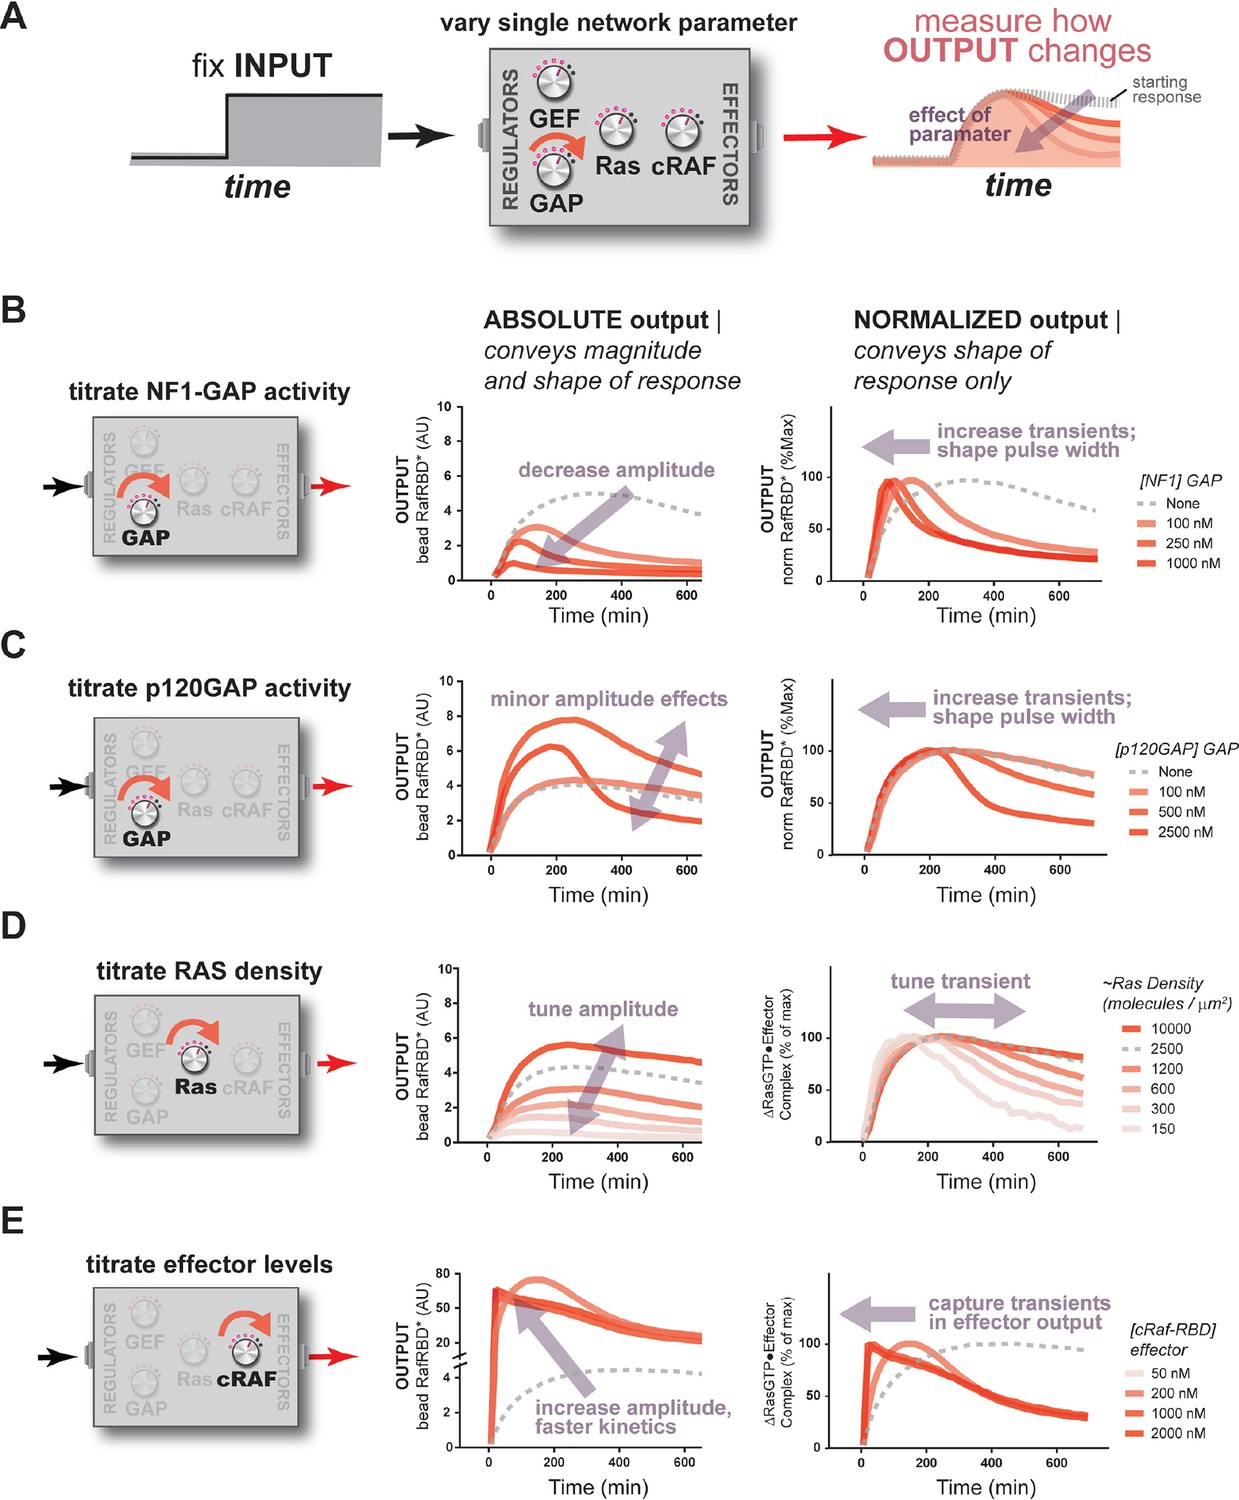
The concentration and identity of each Ras network component can modulate the timing, duration, shape, or amplitude of effector outputs.
(A) Depiction of the experimental setup: a fixed step-input is applied to a panel of Ras signaling systems in which the concentration of a single network component is varied to determine how each network component individually modulates system output. (B) Absolute and normalized effector responses to step-input in the presence of increasing amounts of the NF1 gap. (C) Absolute and normalized effector responses to step-input in the presence of increasing amounts of the p120 GAP. (D) Absolute and normalized responses to step-input in the presence of different densities of Ras on the bead surface. (E) Absolute and normalized responses to step-input in the presence of increasing amounts of the C-Raf RBD effector. GAP, GTPase-activating protein; RBD, Ras-binding domain.
Figure 5 with 3 supplements
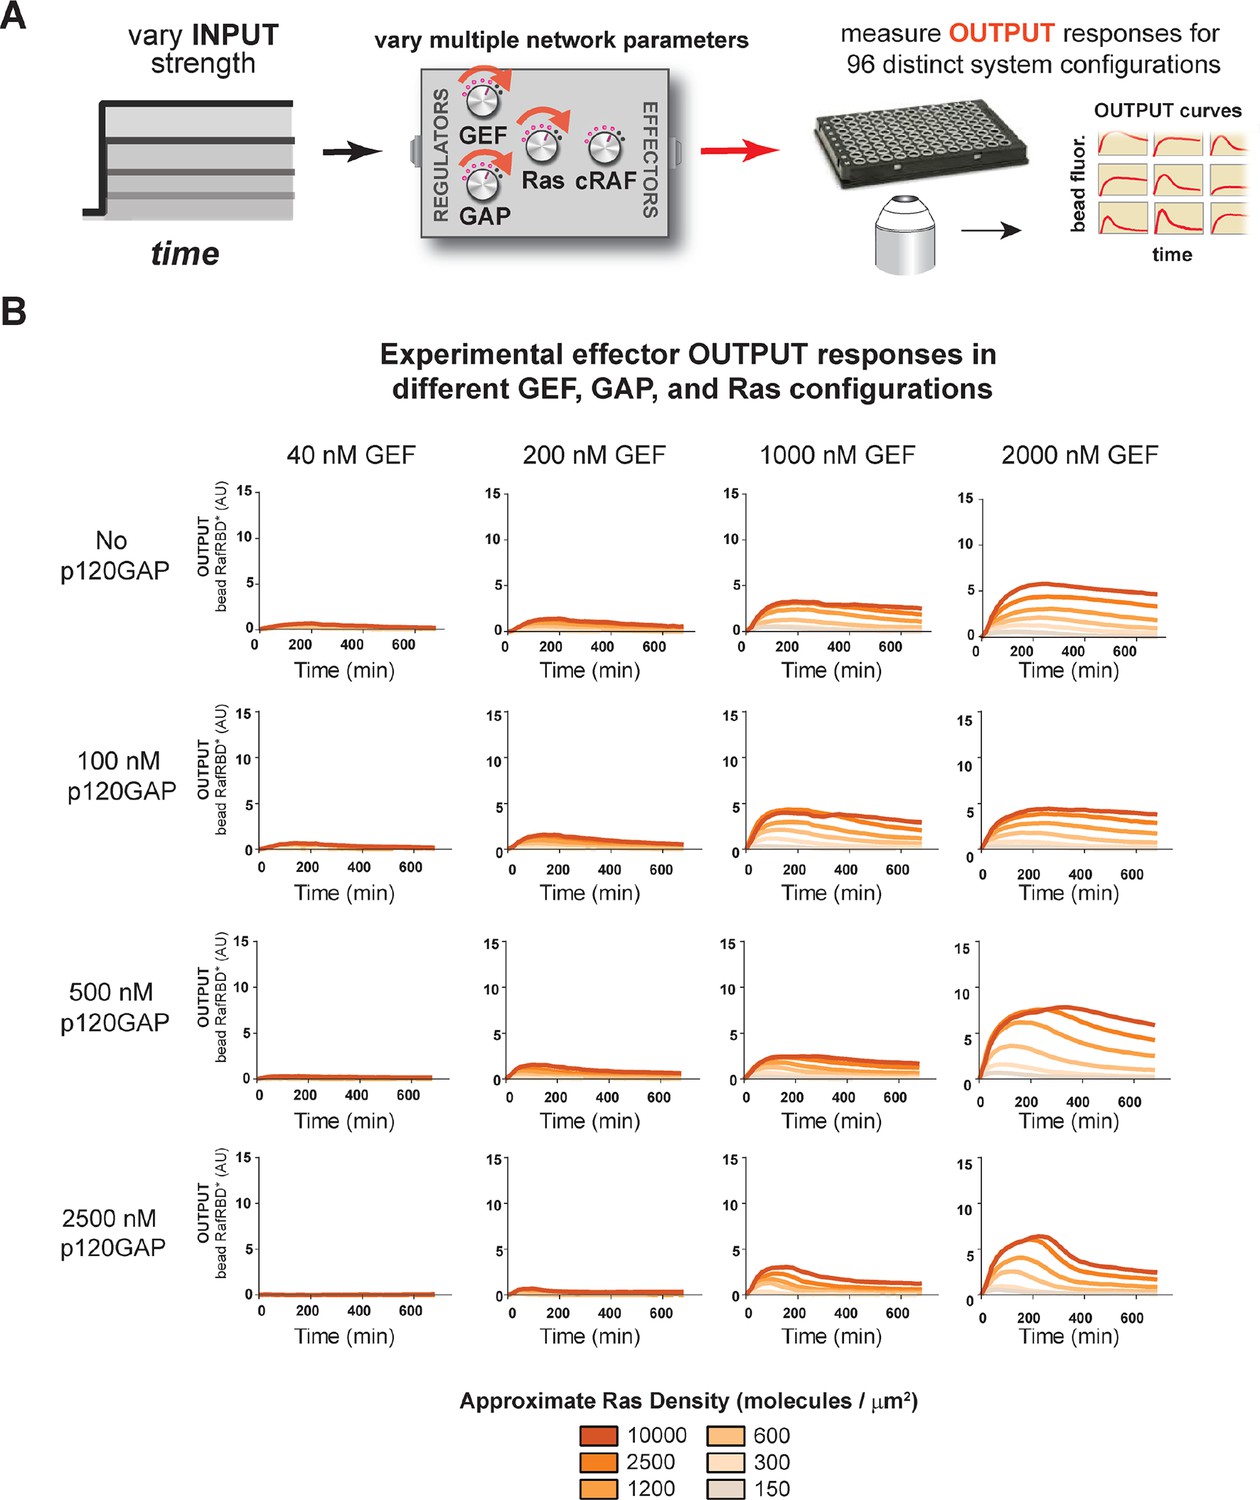
Tuning the levels of GEF, GAP, and GTPase provide access to a rich and diverse space of possible Ras signal processing behaviors.
(A) Depiction of the experimental setup: four different inputs (changes in apparent GEF activity) are applied to a panel of Ras signaling systems sampling four different p120GAP concentrations, and six different Ras densities resulting in experimentally determined output responses for 96 different system configurations. (B) Experimentally determined absolute effector OUTPUT responses across 96 different system configurations. Each graph corresponds to a particular GEF/GAP configuration, and each of the curves within that plot corresponds to a different Ras density as indicated by the color of the curve. GAP, GTPase-activating protein; GEF, guanine exchange factor.
Figure 5—figure supplement 1
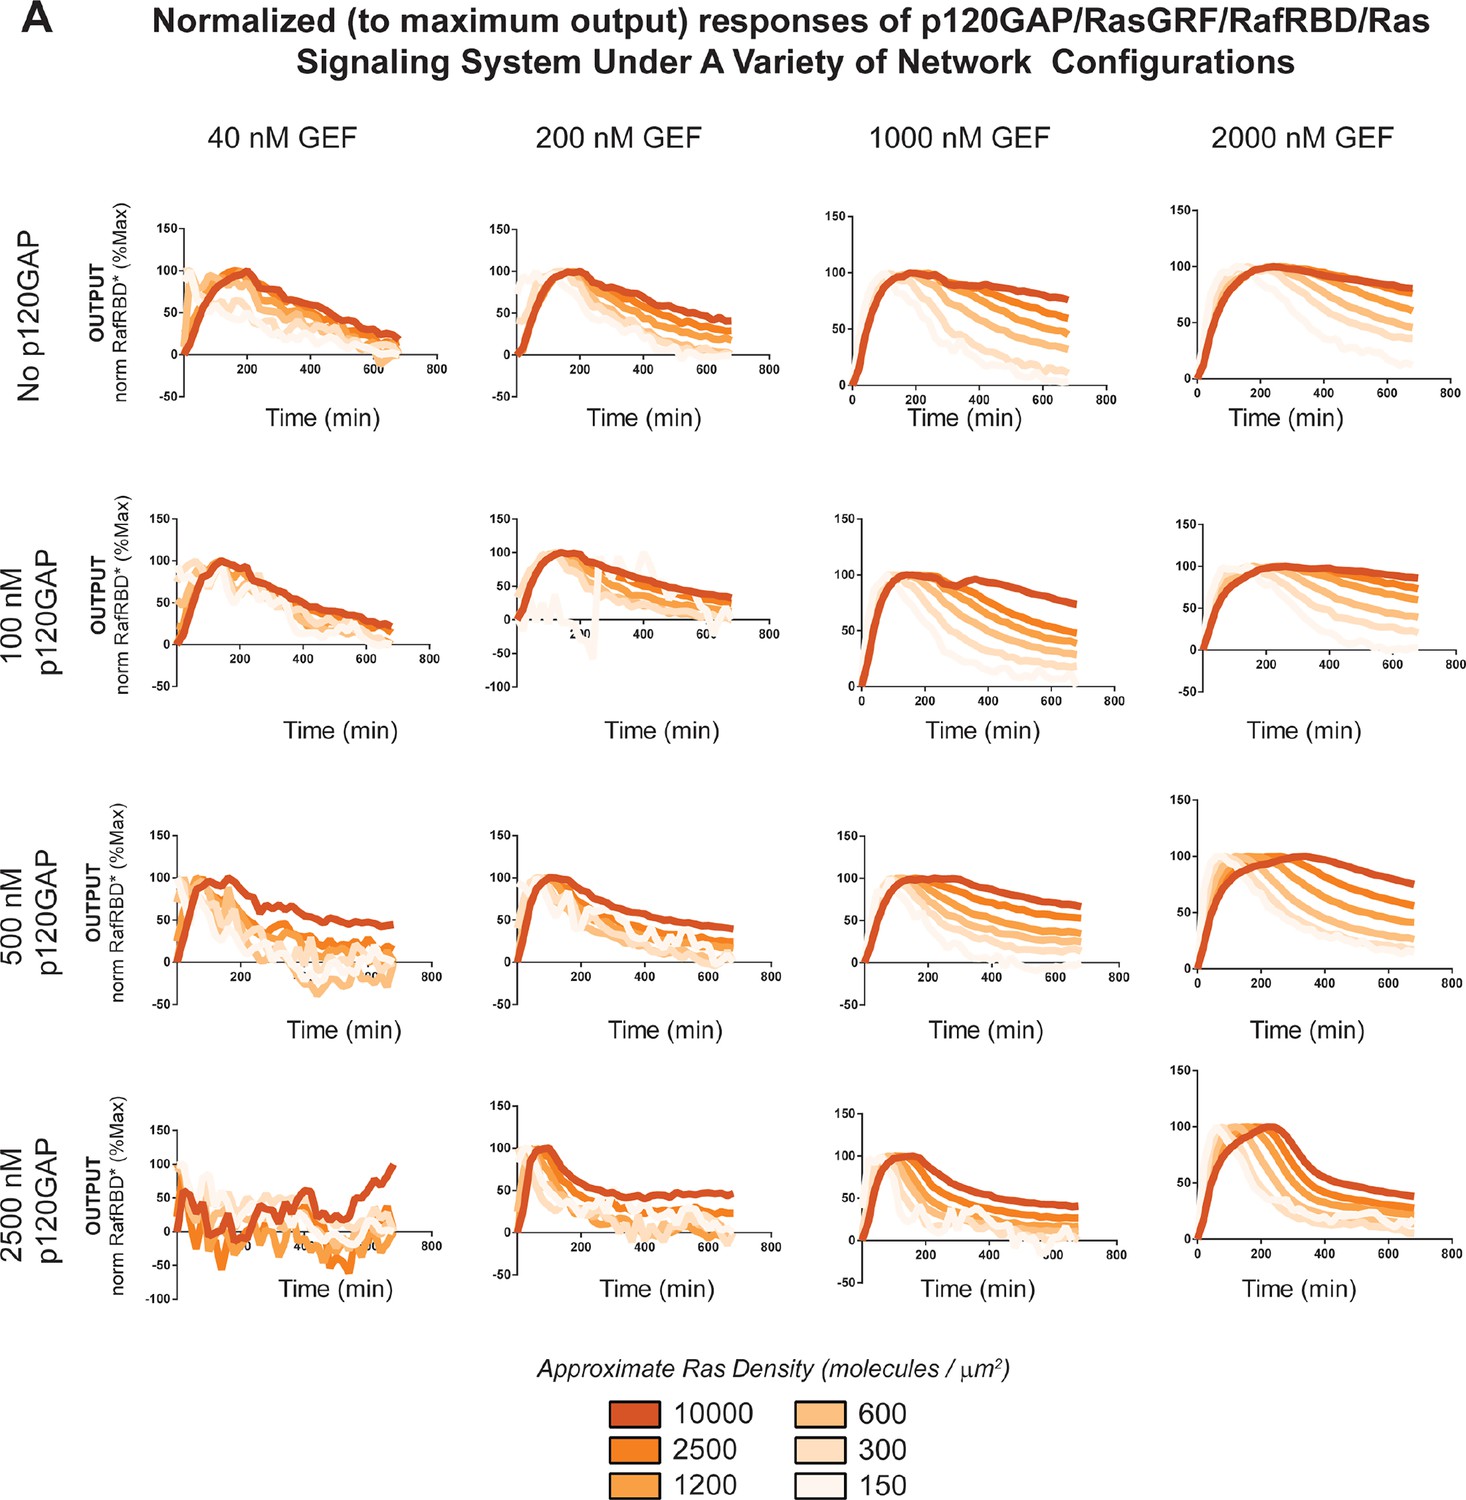
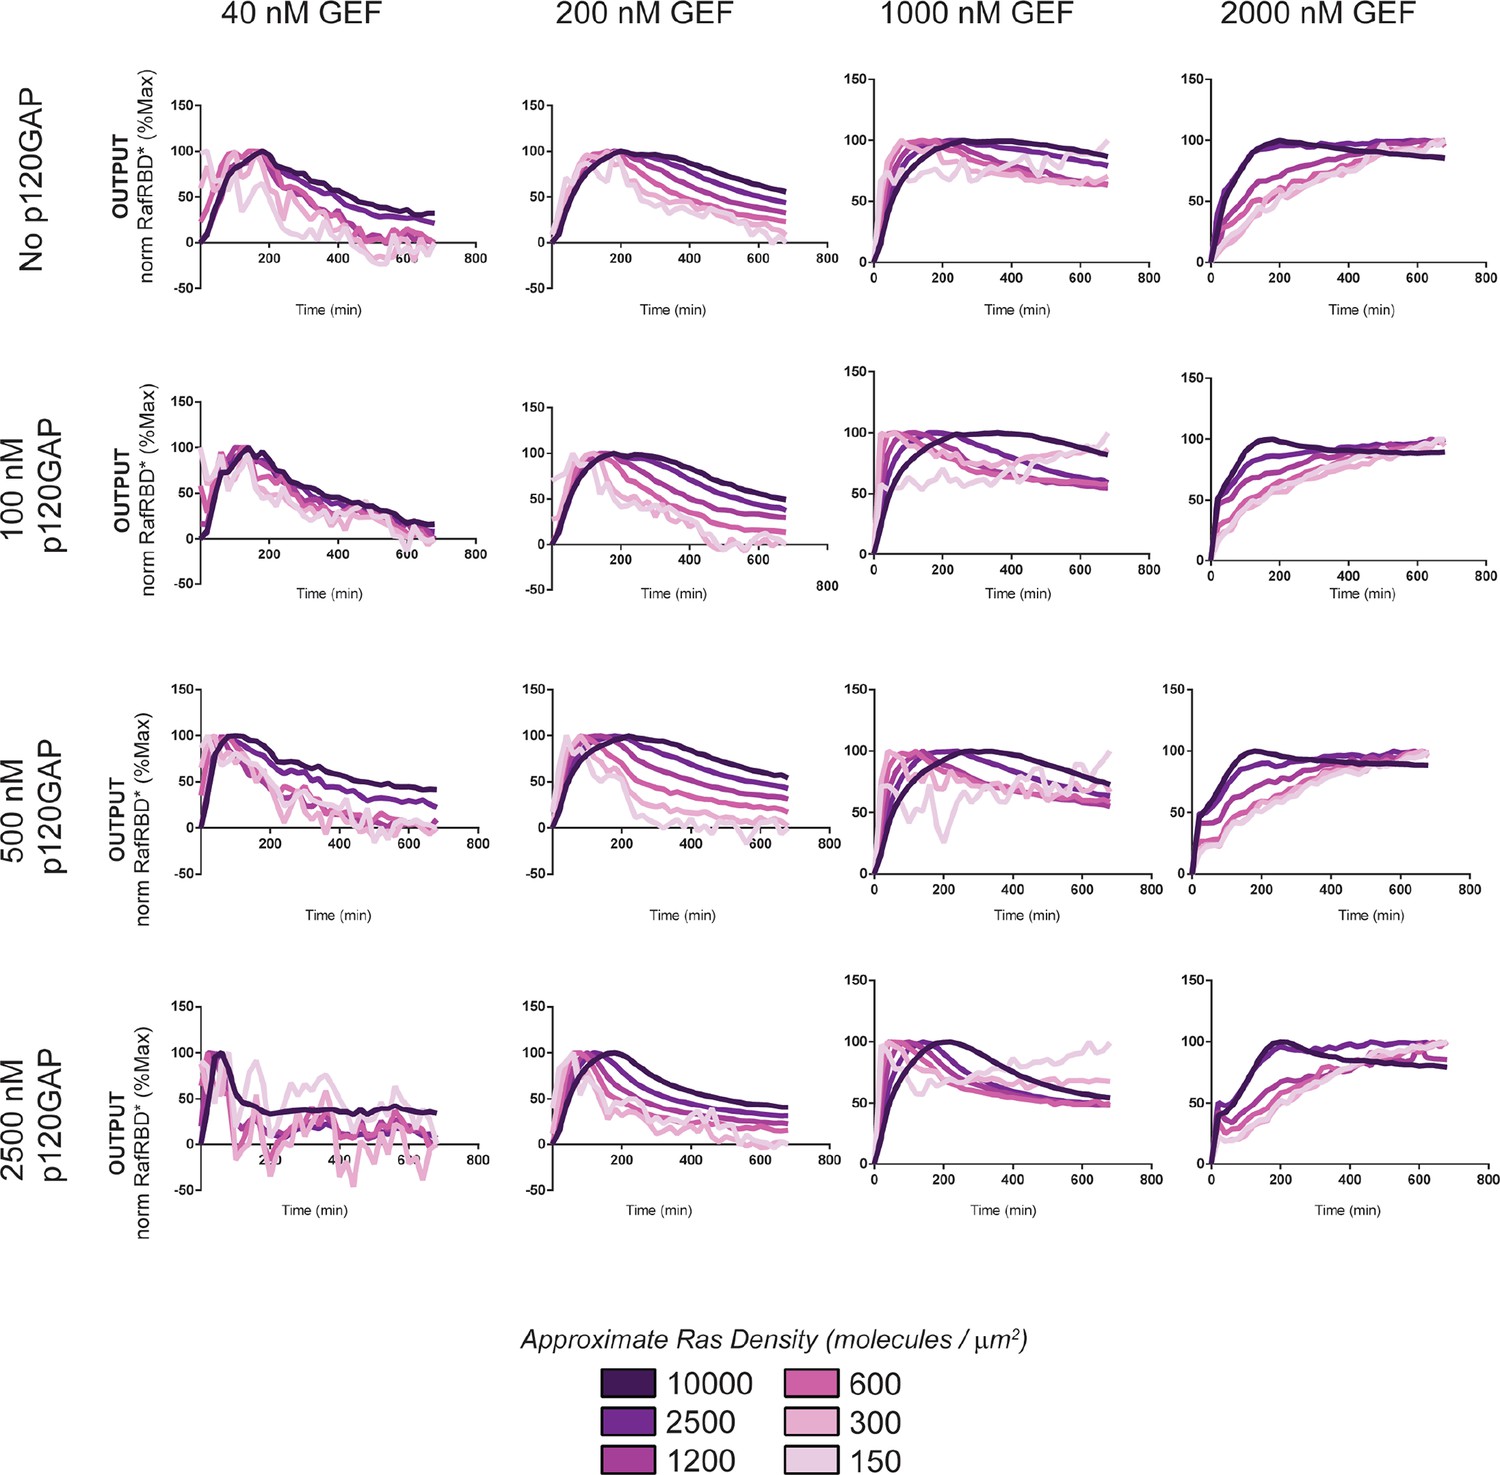
Normalized (to maximum output) responses of p120GAP/RasGRF/RafRBD/Ras signaling system under a variety of network configurations.
Normalized (to the maximum output value of the response) signaling responses for different network GEF/GAP/Ras density configurations. The RasGRF catalytic domain was used as the activating GEF in these experiments. The p120GAP catalytic domain was used as the GAP in these experiments; 50 nM cRaf-RBD was used as the effector in these experiments. The response for differing densities of Ras in each GEF/GAP configuration is shown by different color lines in each plot, with estimated densities indicated in the key. GAP, GTPase-activating protein; GEF, guanine exchange factor; RBD, Ras-binding domain.
Figure 5—figure supplement 2

Structure of RasGRF/p120GAP/H-Ras/cRaf response space determined from outputs of 96 system configurations.
Phase diagrams for three different output features – integrated signal, initial rate of response, and overshoot behavior – at three different Ras density levels, constructed by interpolating these output features from the 96 responses shown in Figure 5B.
Figure 5—figure supplement 3
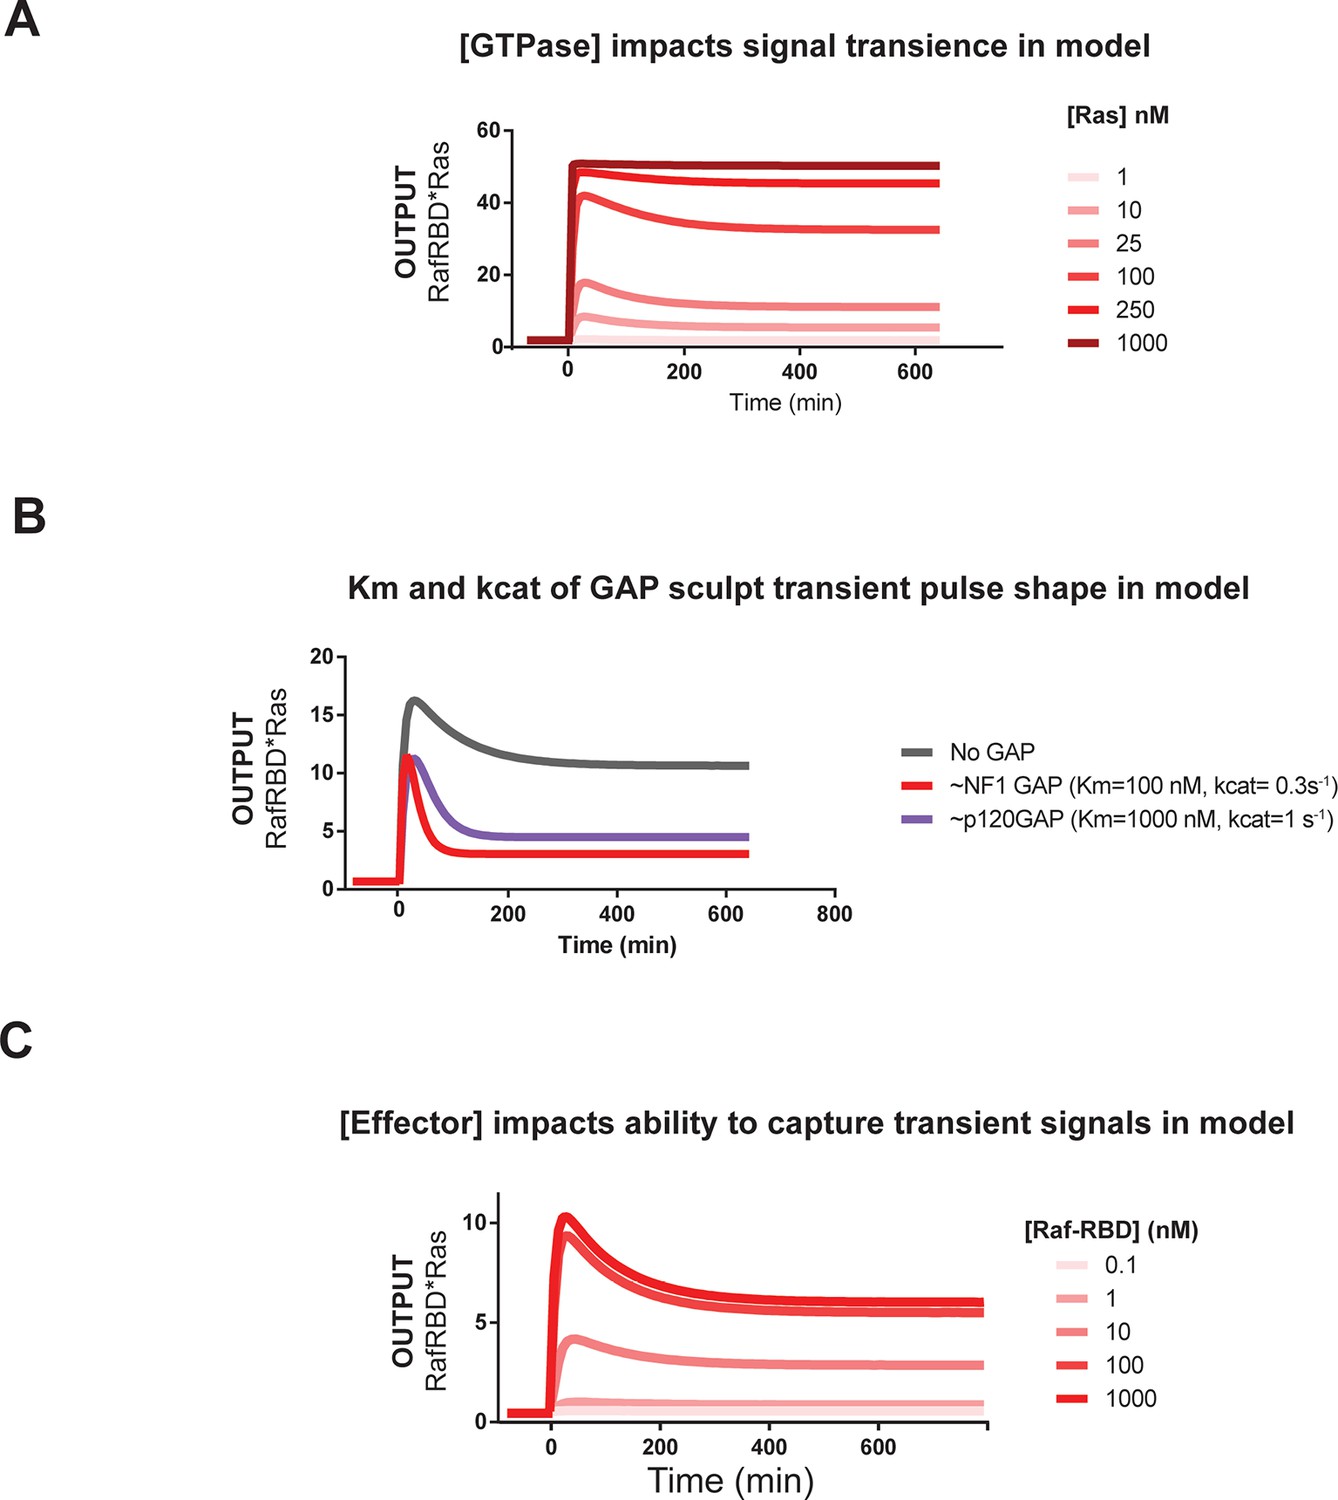
Kinetic modeling and simulations are consistent with experimental observations about how system behavior is influenced by network configuration.
(A) Output of Kintek simulation using a three-state GTPase model with competition between GAP and effectors as described in the main-text 'Materials and methods', in which the Ras density (i.e. concentration in this model) is varied over four orders of magnitude as indicated. Initial conditions were 50 nM effector, 1 μM GEF, no GAP, and 'infinite' nucleotide (100000 nM). The model recovers the observation that at low densities, more transient behavior is observed than at high Ras densities, which show a more associative response. (B) Output of Kintek simulation using a three-state GTPase model with competition between GAP and effectors as described in the main-text 'Materials and methods', in which GAP parameter choices that resemble the NF1-GAP (koff = 0.01 s-1, kcat = 0.1 s-1) or p120GAP (koff = 0.25 s-1, kcat = 0.4 s-1) are used. Initial conditions were 50 nM effector, 10 nM Ras, 1 μM GEF, 1 μM GAP, and 'infinite' nucleotide (100000 nM). This model recovers the observation that differences in Km and kcat can result in equivalent amounts of NF1gap and p120GAP producing different transient behaviors in the system output. (C) Output of Kintek simulation using a three-state GTPase model with competition between GAP and effectors as described in the main-text Materials and methods, in which effector concentrationsare varied over 5 orders of magnitude. Initial conditions were 10 nM Ras, 1 μM GEF, no GAP, and 'infinite' nucleotide (100000 nM). This model recovers the observation that higher effector concentrations allow more transient features of the time-varying GTPase signal to be captured in the system output. GAP, GTPase-activating protein; GEF, guanine exchange factor.
Figure 6 with 2 supplements
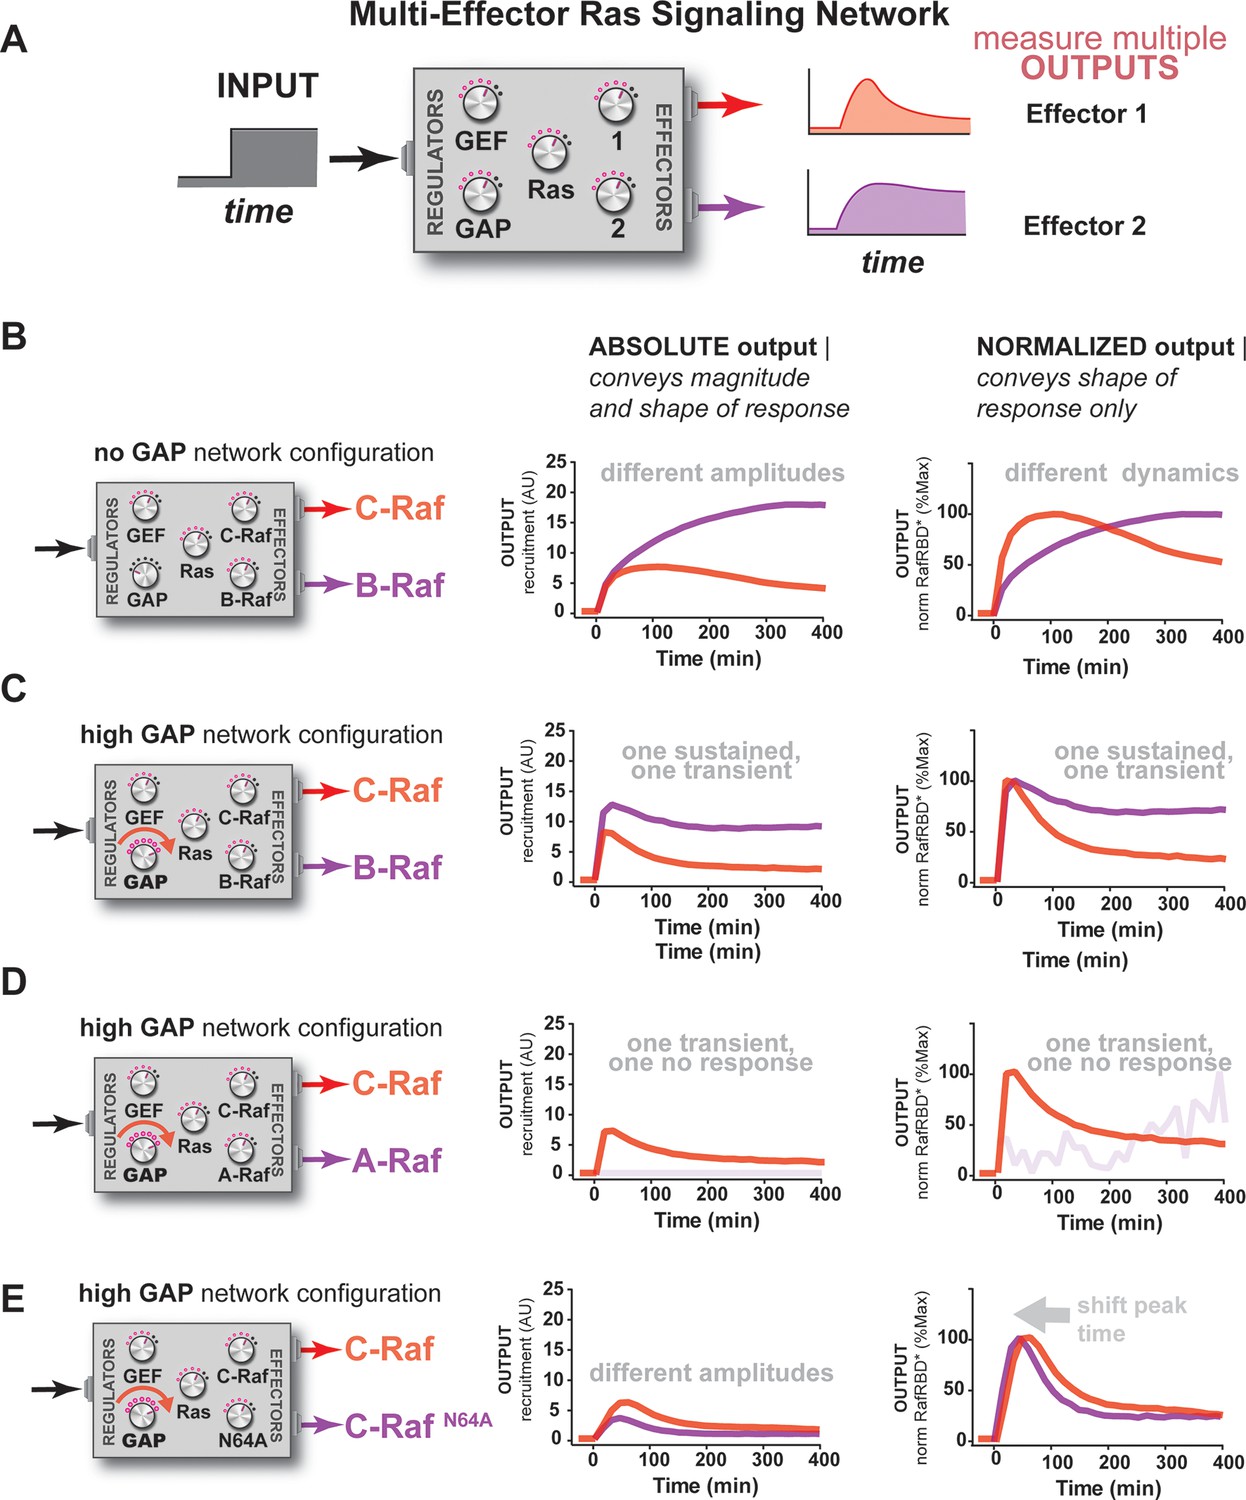
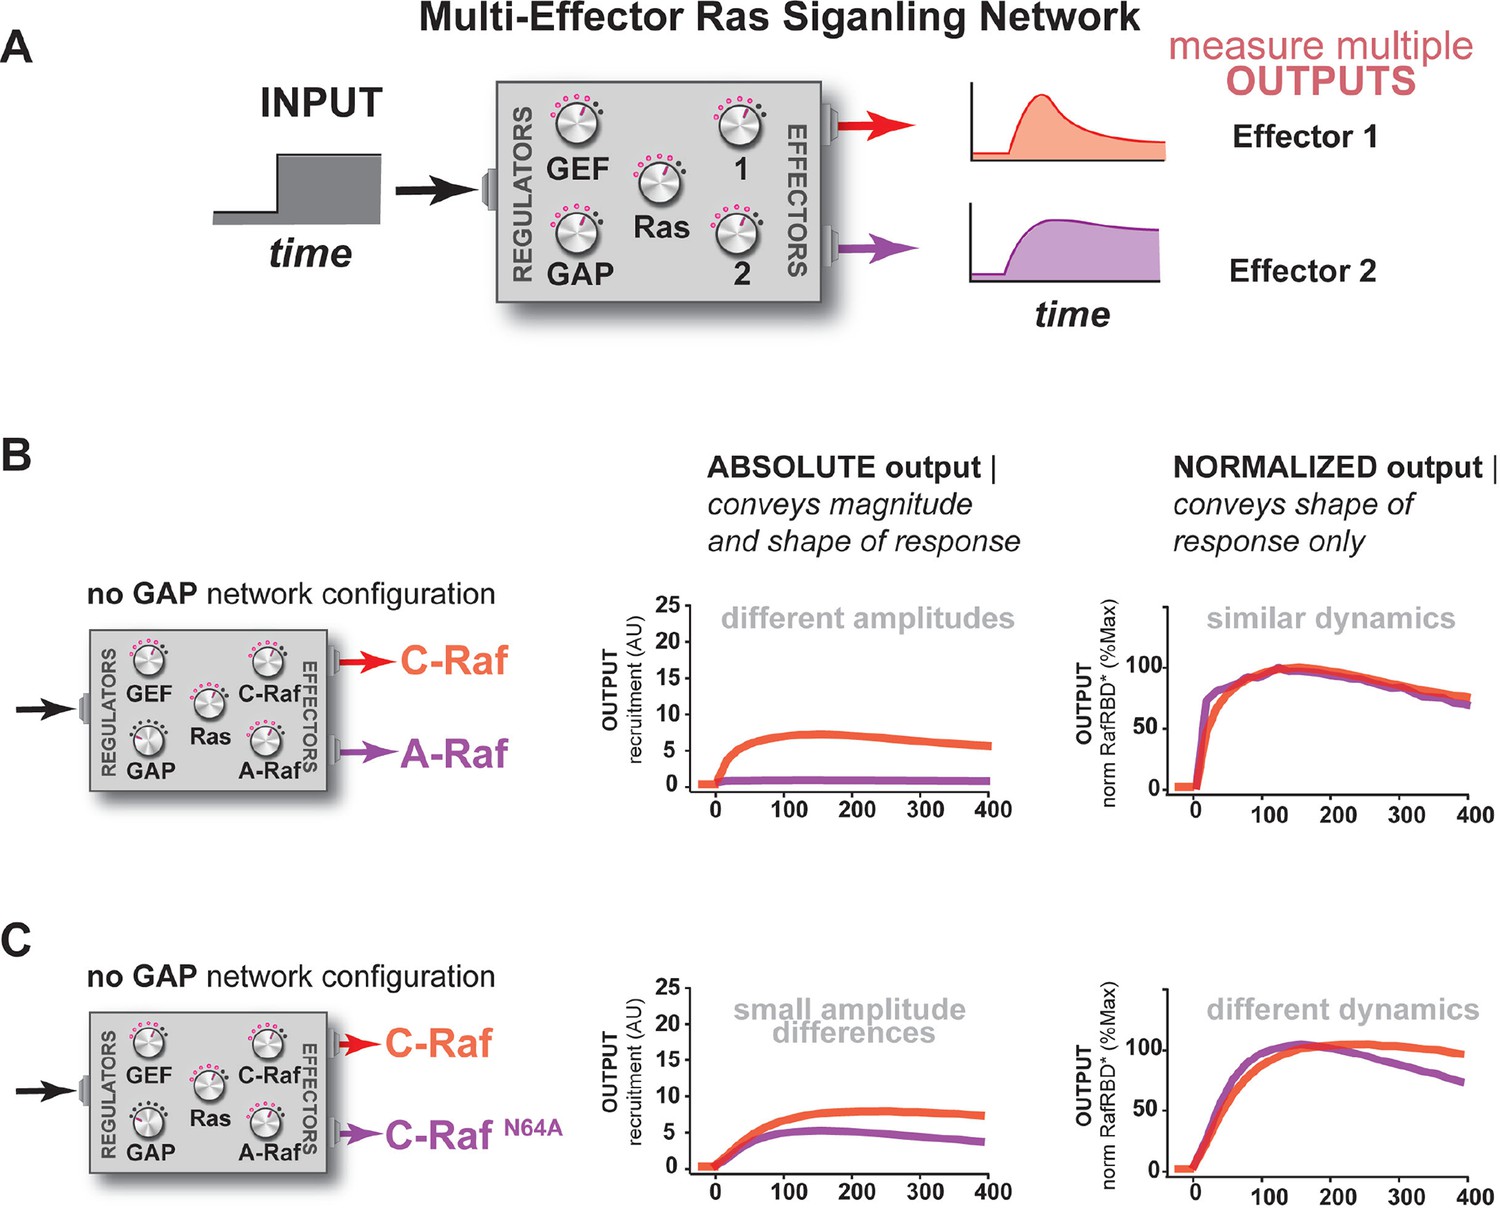
Unique interpretation of Ras•GTP signals by different effectors in multi-effector networks encodes multiple distinct temporal outputs in the system response.
(A) Depiction of the experimental design: a fixed step-input is applied to a particular network configurations in which more than one effector molecule is, resulting in multiple simultaneous system outputs that are measured. (B) Absolute and normalized responses to step-input of C-Raf RBD and B-Raf RBD in the absence of any GAP activity. (C) as in (B) but with 1 μM NF1-GAP present in the signaling network. (D) Absolute and normalized responses to step-input of C-Raf RBD and A-Raf RBD with 1 μM NF1-GAP present in the signaling network. (E) Absolute and normalized responses to step-input of C-Raf RBD and the C-RafN64A mutant RBD with 1 μM NF1-GAP present in the signaling network. RBD, Ras-binding domain
Figure 6—figure supplement 1
Additional examples of how the unique interpretation of Ras•GTP signals by different effectors in multi-effector networks encodes multiple distinct temporal outputs in the system response.
(A) Depiction of the experimental design: a fixed step-input is applied to a particular network configurations in which more than one effector molecule is, resulting in multiple simultaneous system outputs that are measured. (B) Absolute and normalized responses to step-input of C-Raf RBD and A-Raf RBD in the absence of any GAP activity. (C) Absolute and normalized responses to step-input of C-Raf RBD and C-RafN64A RBD in the absence of any GAP activity. RBD, Ras-binding domain
Figure 6—figure supplement 2
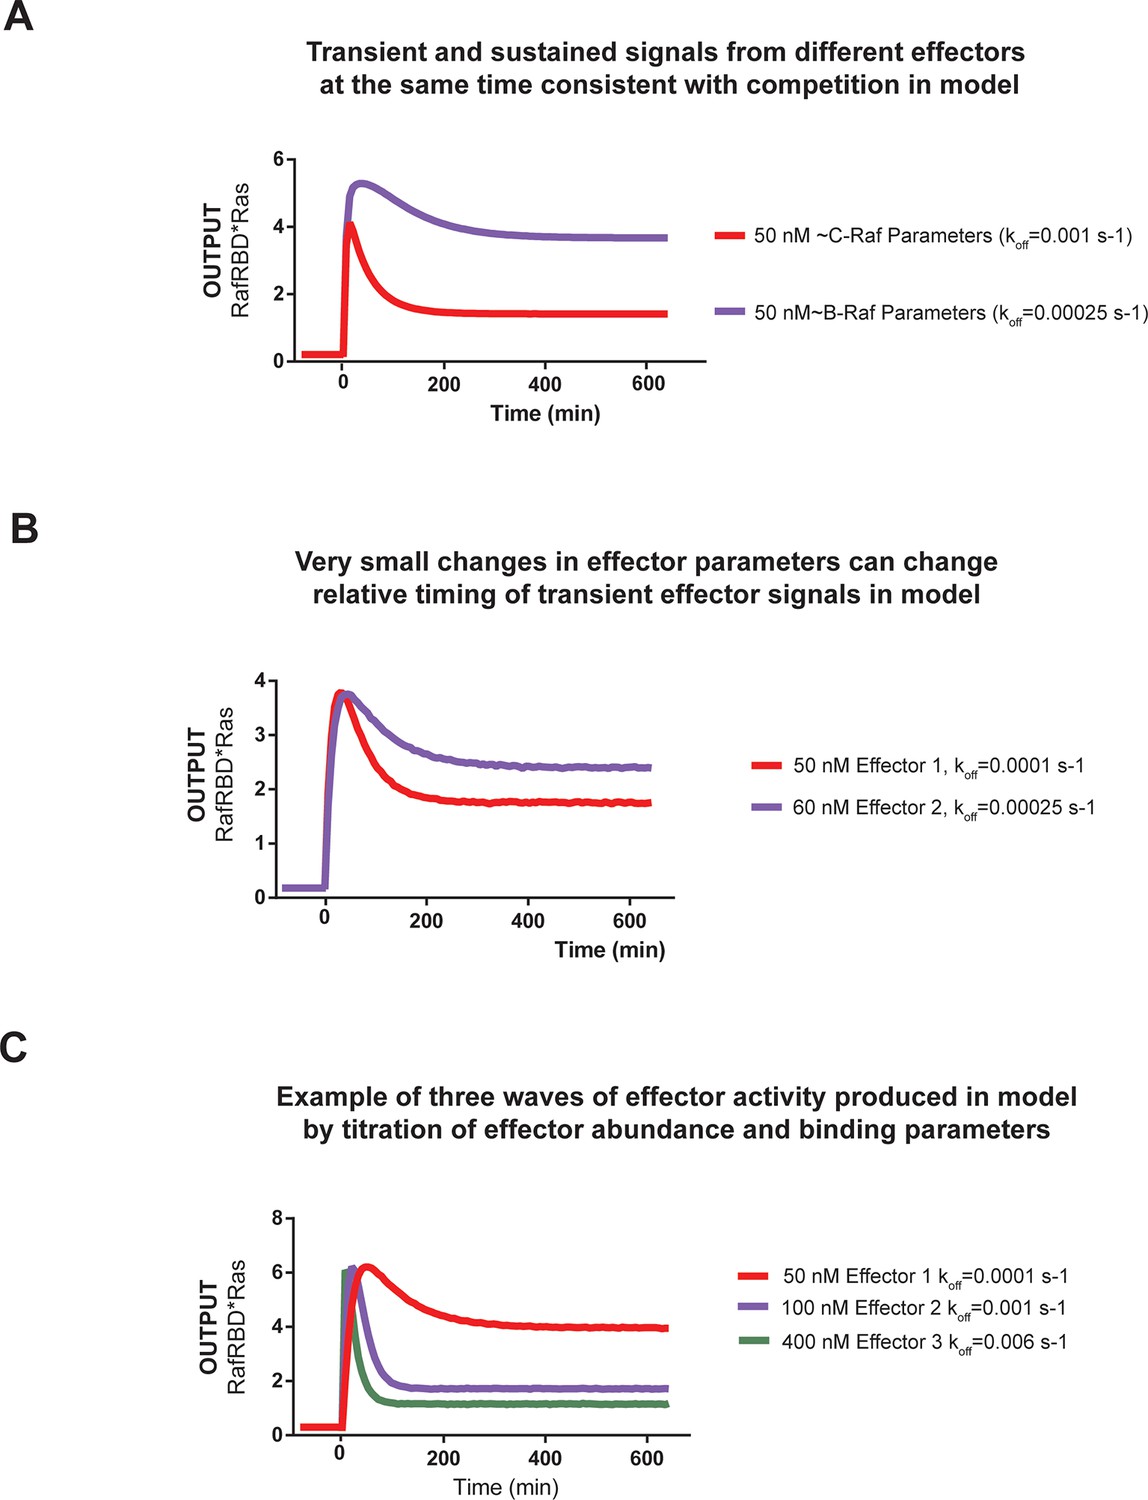
Kinetic modeling and simulations show that competition between effectors allows multiple temporal responses to be encoded in the system output.
(A) Output of Kintek simulation using a three-state GTPase model with competition between GAP and effectors as described in the main-text 'Materials and methods', in which two effectors (one c-Raf like (koff = 0.001 s-1), one B-Raf like (koff = 0.00025 s-1) are present in the system at 50 nM. Other initial conditions were 50 nM effector, 1 μM GEF, 1 μM GAP, and 'infinite' nucleotide (100000 nM). This simulation recovers the observation that B-Raf can respond in a sustained way while C-Raf can respond in a transient way. (B) Output of Kintek simulation using a three-state GTPase model with competition between GAP and effectors as described in the main-text Materials and methods, in which two effectors have very similar concentrations and parameters (as indicated on the figure). Other initial conditions were 50 nM effector, 1 μM GEF, 1 μM GAP, and 'infinite' nucleotide (100000 nM). This simulation recovers the observation that small parameter differences between effector can alter the timing and duration of transient signaling outputs. (C) Output of Kintek simulation using a three-state GTPase model with competition between GAP and effectors as described in the main-text 'Materials and methods', in which three effectors with different parameters and concentrations (as indicated in the figure) are present in the system. Other initial conditions were 50 nM effector, 1 μM GEF, 1 μM GAP, and 'infinite' nucleotide (100000 nM). This simulation shows that a complex sequence of effector outputs can be produced (3 THEN 2 THEN 1) in response to a step input simply by titration of levels and altering effector parameters. GAP, GTPase-activating protein; GEF, guanine exchange factor.
Figure 7 with 1 supplement
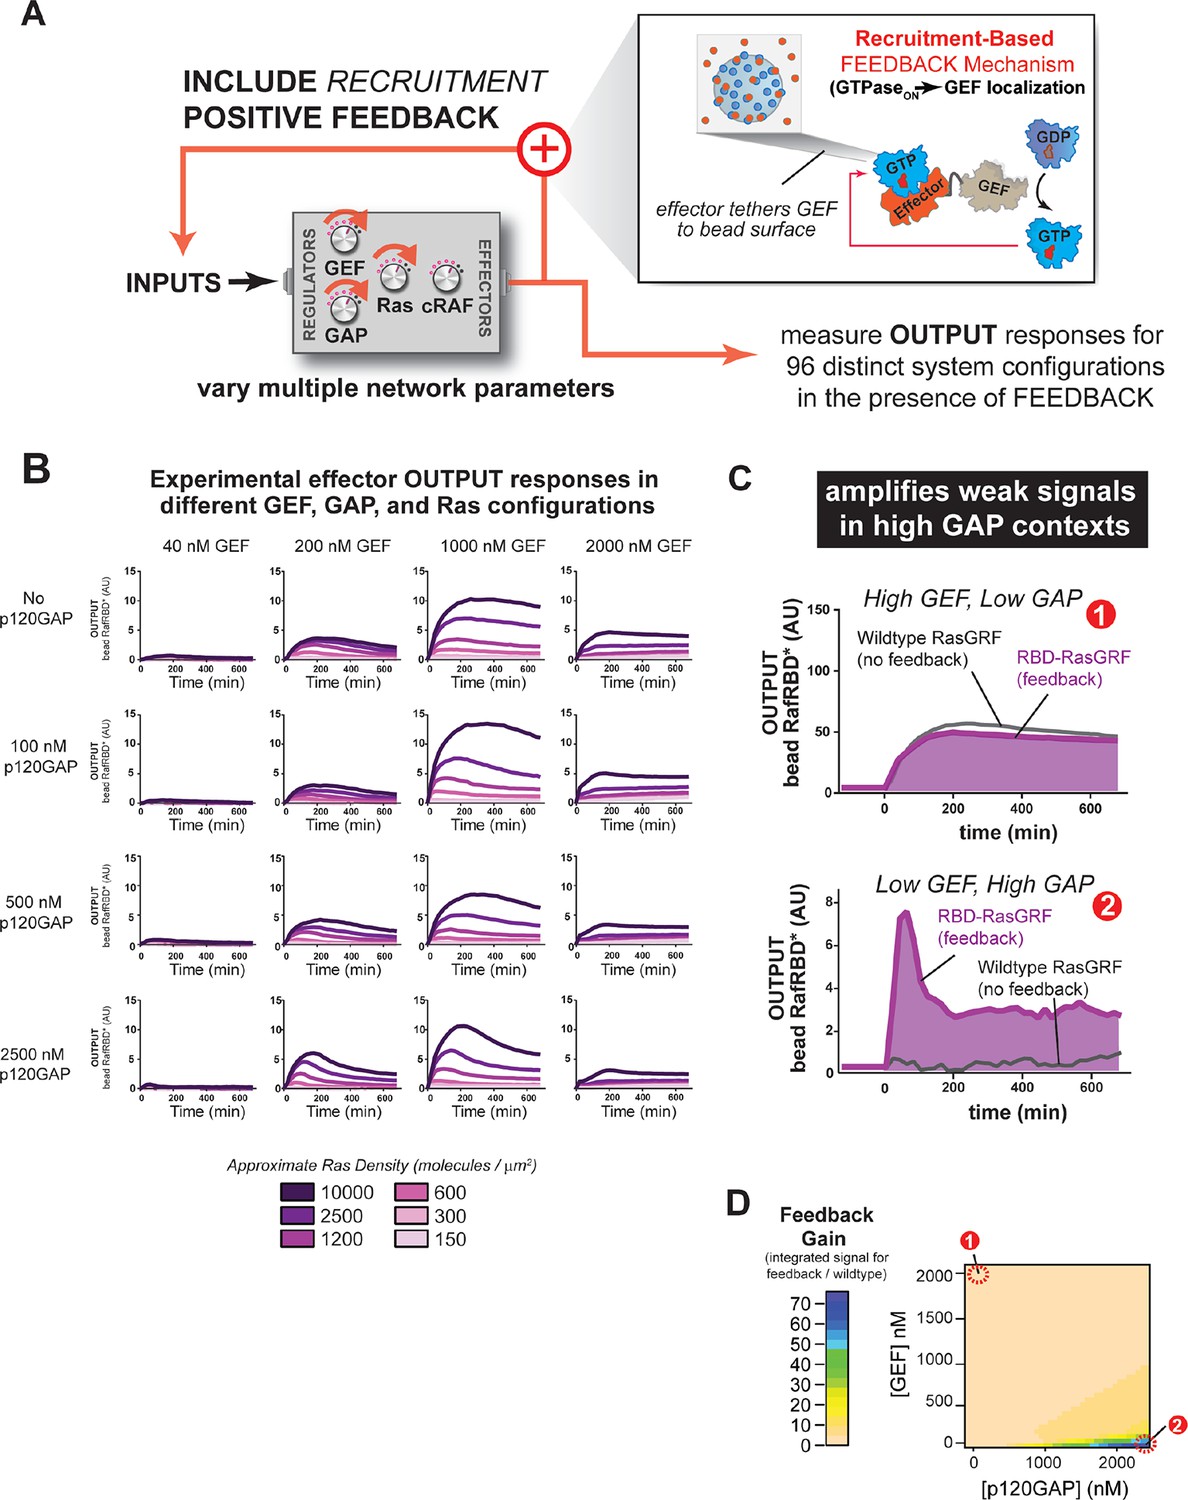
Introducing recruitment-based positive feedback into the Ras signaling network alters output dynamics and amplifies weak signals in high-GAP contexts.
(A) Illustration of Ras system that now includes recruitment-based positive feedback and the synthetic GEF (RasGRF-RBD) that was used to implement the feedback. (B) Experimentally determined absolute effector OUTPUT responses across 96 different system configurations. Each graph corresponds to a particular GEF/GAP configuration, and each of the curves within that plot corresponds to a different Ras density as indicated by the color of the curve. (C) Examples of output responses for systems under equivalent network configurations (Position 1 of Figure 7D) that do (purple line) or do not (grey line) contain recruitment-based feedback. (D) Phase diagram depicting the gain provided by recruitment-based feedback (defined as fold-increase in integrated signaling output) in different network configurations. GAP, GTPase-activating protein; GEF, guanine exchange factor; RBD, Ras-binding domain
Figure 7—figure supplement 1
Normalized (to maximum output) responses of p120GAP/ RasGRF-RBD feedback /RafRBD/Ras signaling system under a variety of network configurations.
Normalized (to the maximum output value of the response) signaling responses for different network GEF/GAP/Ras density configurations. The recruitment-based positive feedback GEF RasGRF-RBD was used as the activating GEF in these experiments. The p120GAP catalytic domain was used as the GAP in these experiments. 50 nM cRaf-RBD was used as the effector in these experiments. The response for differing densities of Ras in each GEF/GAP configuration is shown by different color lines in each plot, with estimated densities indicated in the key. GAP, GTPase-activating protein; GEF, guanine exchange factor; RBD, Ras-binding domain.
Figure 8 with 1 supplement
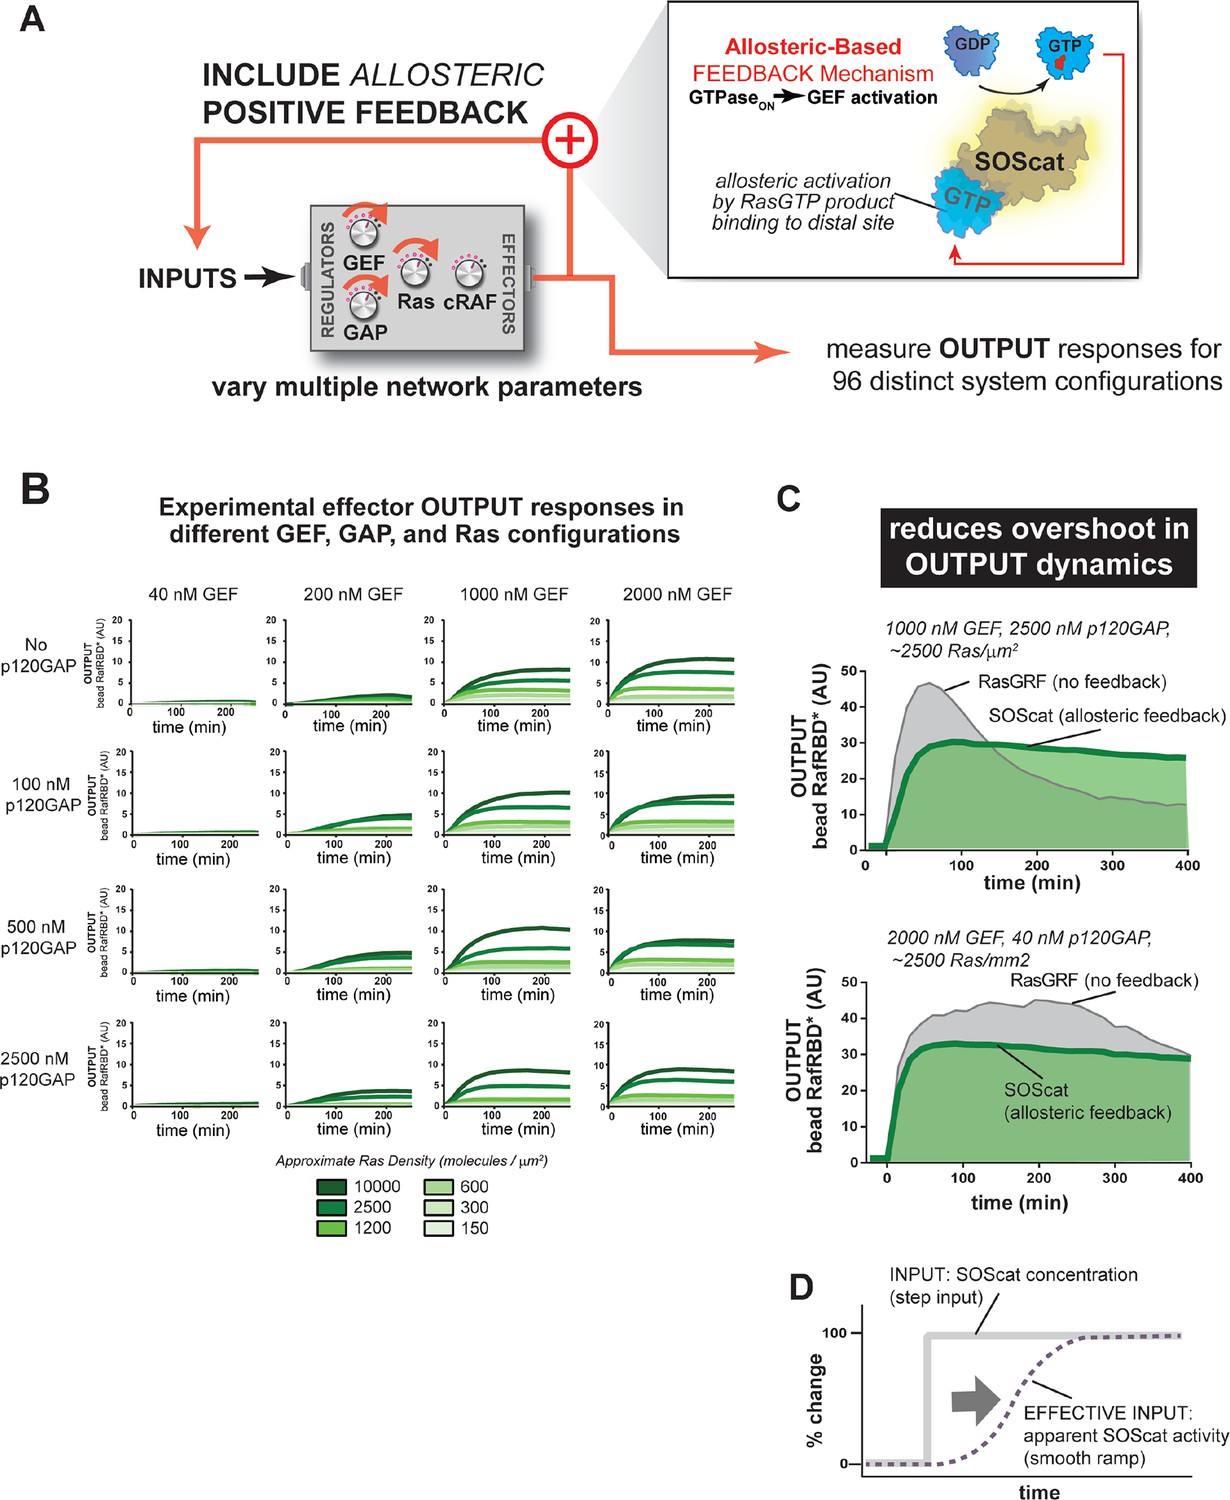
Introducing allosteric-based positive feedback into the Ras signaling network reduces transient overshoot and smooths the OUTPUT dynamics.
(A) Illustration of Ras system that now includes allosteric-based positive feedback and the naturally occurring GEF (SOScat) that was used to implement the feedback. (B) Experimentally determined absolute effector OUTPUT responses across 96 different system configurations. Each graph corresponds to a particular GEF/GAP configuration, and each of the curves within that plot corresponds to a different Ras density as indicated by the color of the curve. (C) Examples of output responses for systems under equivalent network configurations (high GEF, high GAP) that do (green line) or do not (grey line) contain allosteric feedback. (D) Schematic depiction of how an OFF->ON feedback mechanisms converts a step input in SOScat levels into a ramp input in SOScat activity. GAP, GTPase-activating protein; GEF, guanine exchange factor
Figure 8—figure supplement 1
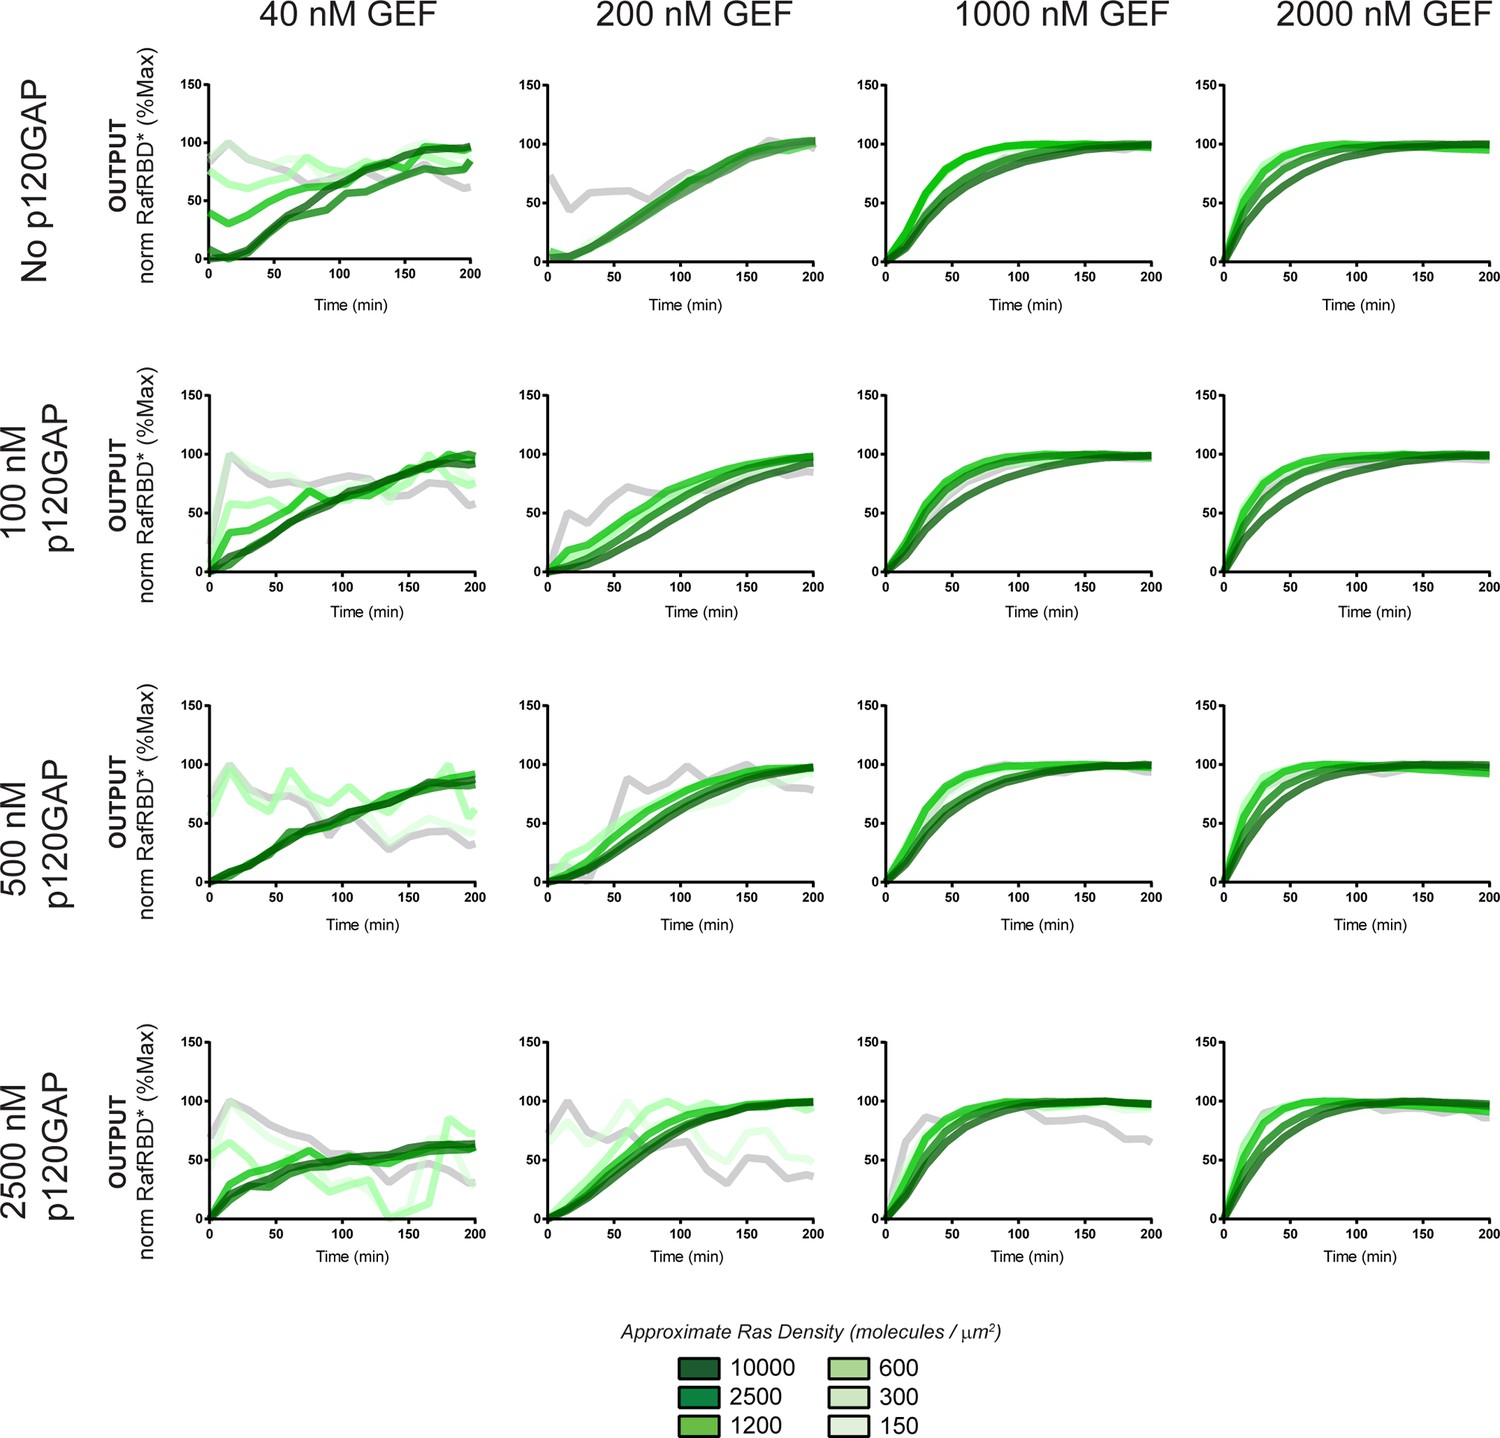
Normalized (to maximum output) responses of p120GAP/ SOScat feedback /RafRBD/Ras signaling system under a variety of network configurations.
Normalized (to the maximum output value of the response) signaling responses for different network GEF/GAP/Ras density configurations. The allosteric-based positive feedback GEF SOScat was used as the activating GEF in these experiments. The p120GAP catalytic domain was used as the GAP in these experiments. 50 nM cRaf-RBD was used as the effector in these experiments. The response for differing densities of Ras in each GEF/GAP configuration is shown by different color lines in each plot, with estimated densities indicated in the key. GAP, GTPase-activating protein; GEF, guanine exchange factor; RBD, Ras-binding domain
Figure 9
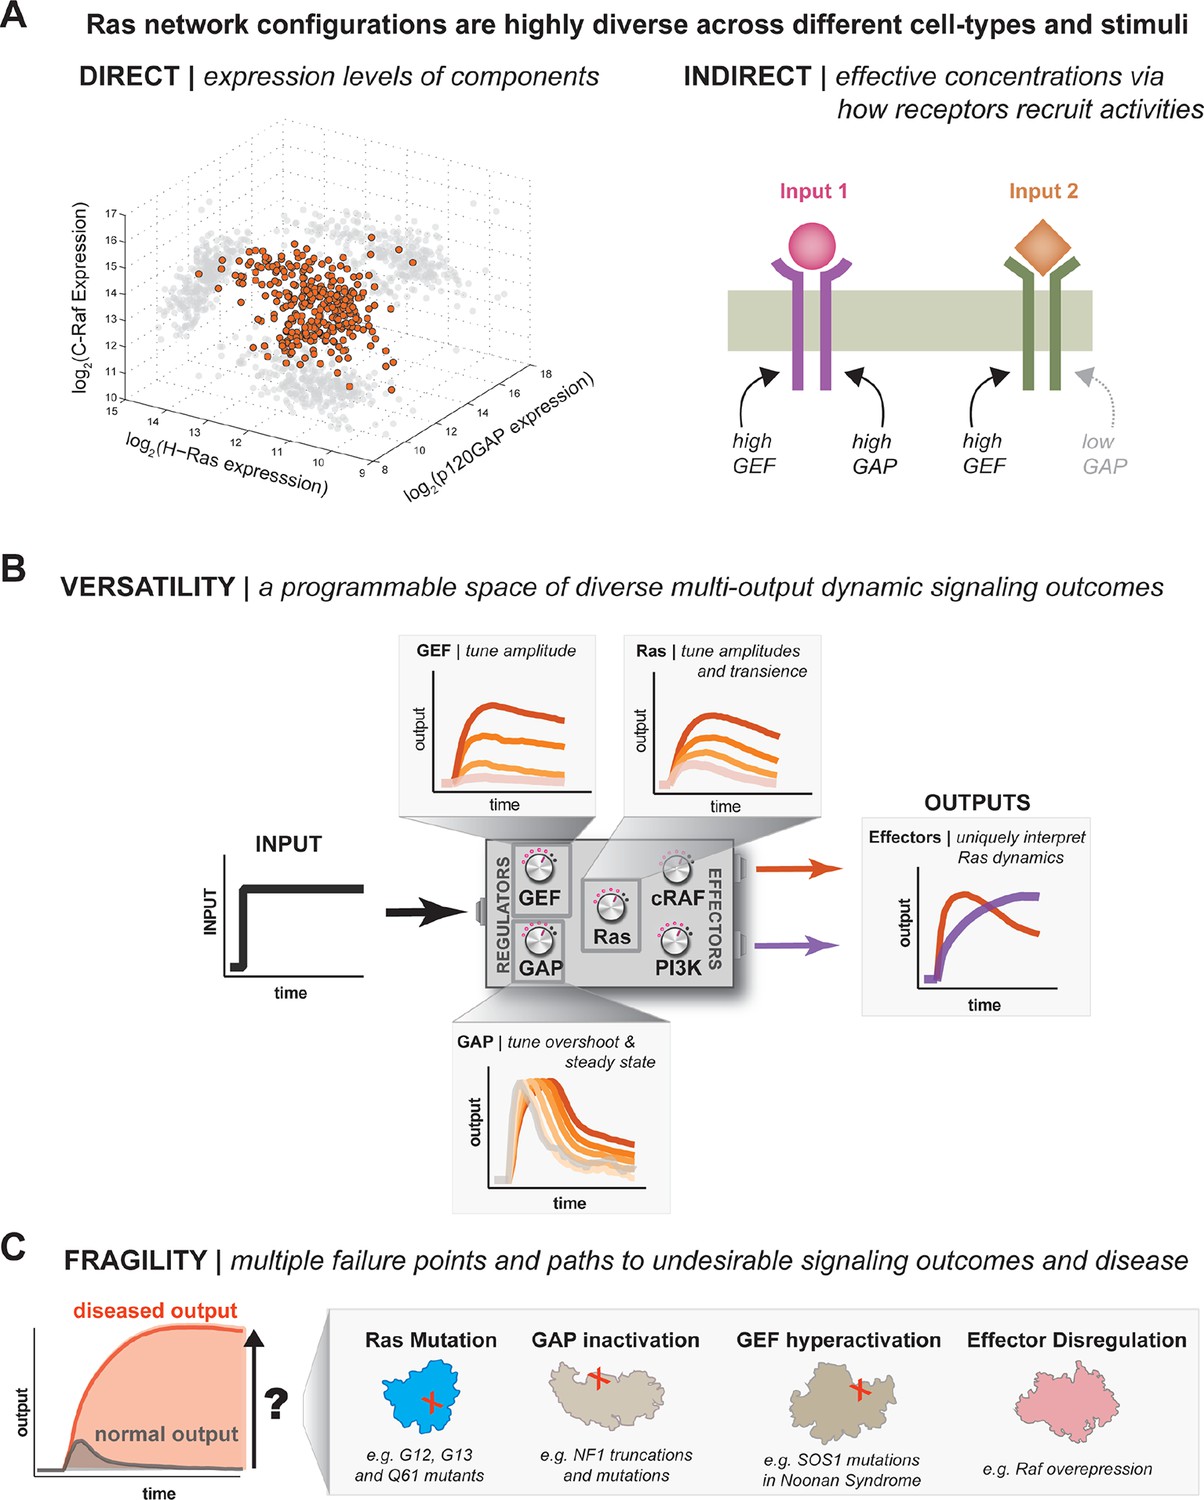
One system, many behaviors: versatility and fragility in the space of Ras GTPase signal processing behaviors.
(A) Illustration of direct and indirect diversity that exists in Ras network configurations. In the direct case, the distribution of p120GAP, H-Ras, and Raf gene expression levels across a variety of human cell types are shown, synthesized from Genevestigator data (see associated Figure 9–source data 1). Each orange point corresponds to a cell type and its position in the space indicates its associated expression level in each coordinate. A 'shadow' of each point is projected onto each two-dimensional sub-plane to further clarify the distribution. In the indirect case, a schematic of two receptors that both activate Ras are indicated. One receptor results in strong recruitment of both GEF and GAP, while another only strongly recruits GEF. (B) Illustration depicting the versatility of Ras GTPase signaling systems. A simple step-input can be processed into a variety of different dynamic outputs depending on 1416 the network configuration. The way in which each network component shapes signaling is illustrated. (C) Illustration depicting the fragility of Ras GTPase signaling systems. Given a particular signaling output and a higher level disease output, there exist many paths by which the network configuration can change to produce the diseased output. GAP, GTPase-activating protein; GEF, guanine exchange factor.
-
Figure 9—source data 1
Relative gene expression level data from a variety of human tissue and cell types that was used to produce the plot in Figure 8A.
This table contains the relative expression-level data that was used to prepare the plot in Figure 9A. These data were obtained from Genevestigator as outlined in the main-text 'Materials and methods'.
- https://doi.org/10.7554/eLife.12435.024
Videos
Video 1
Response of wild type and G12V Ras systems in GAP-free network context.
The effector output (red) from a representative bead loaded with wild-type Ras (blue) or G12V Ras (green) is shown. 2 μM RasGRF was provided as an activating input. Time-steps are separated by 15 min. Associated with data in main-text Figure 3B.
Video 2
Response of wild type and G12V Ras systems in high-GAP network context.
The effector output (red) from a representative bead loaded with wild-type Ras (blue) or G12V Ras (green) is shown. 2 μM RasGRF was provided as an activating input and the system contained 1 μM NF1-GAP. Time-steps are separated by 15 min. Associated with data in main-text Figure 3C.
Tables
Table 1
List of plasmids used this study. A description of each construct used in this study, the bacterial antibiotic resistance associated with that plasmid, and a pSC reference index to facilitate any plasmid requests.
| Description | Bacteria Marker | ||||
|---|---|---|---|---|---|
| pSC | 353 | pMal-H.s.SOS1cat-StrepII | amp | ||
| pSC | 354 | pMal-H.s.p120GAP(RASA)-StrepII | amp | ||
| pSC | 369 | pMalStrep-RasGRF(MusGRF1cat ) | amp | ||
| pSC | 427 | pSNAP-Mal-cRaf-RBD-StrepII | amp | ||
| pSC | 451 | pSNAP_Mal_H-Ras_2xHis(6xHis-linker-10xHis) | amp | ||
| pSC | 465 | pMalStrep-RasGRF-30xGAGS-RBD | amp | ||
| pSC | 485 | pMalStrep-NF1 Ras GAP | amp | ||
| pSC | 486 | pSNAP-Mal-H-rasG12v-2xHis | amp | ||
| pSC | 488 | pSNAP-Mal-RafRBD(N64A)-StrepII | amp | ||
| pSC | 490 | pSNAP-Mal-H-RasG12C-2xHis | amp | ||
| pSC | 492 | pSNAP-Mal-H-RasQ61L-2xHis | amp | ||
| pSC | 501 | pSNAP-Mal-ARafRBD-StrepII | amp | ||
| pSC | 502 | pSNAP-Mal-BRafRBD-StrepII | amp | ||
Download links
A two-part list of links to download the article, or parts of the article, in various formats.
Downloads (link to download the article as PDF)
Open citations (links to open the citations from this article in various online reference manager services)
Cite this article (links to download the citations from this article in formats compatible with various reference manager tools)
Mapping the functional versatility and fragility of Ras GTPase signaling circuits through in vitro network reconstitution
eLife 5:e12435.
https://doi.org/10.7554/eLife.12435


