AMPylation matches BiP activity to client protein load in the endoplasmic reticulum
- University of Cambridge, United Kingdom
- MRC Mitochondrial Biology Unit, United Kingdom
Figures
Figure 1
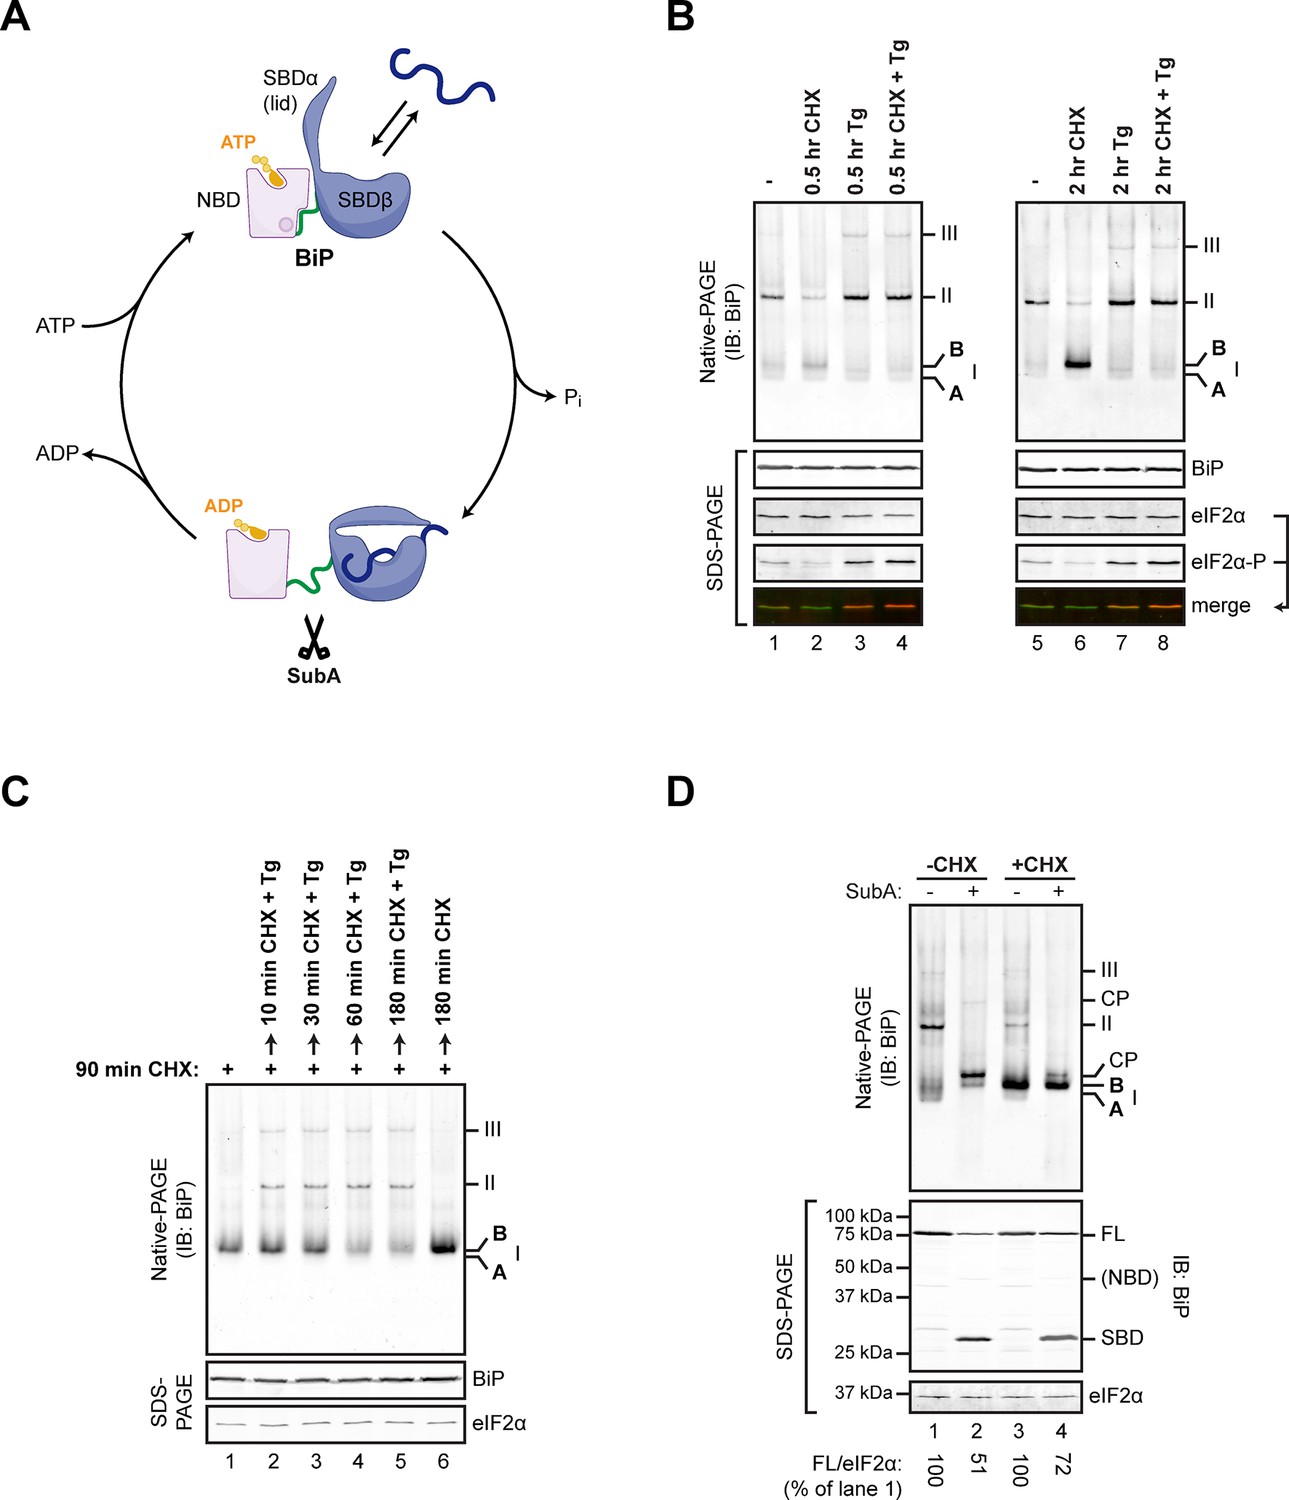
Native gel electrophoresis tracks activity state-dependent changes in BiP’s quaternary structure.
(A) Schematic representation of BiP’s domain organization in the ATP- and ADP-bound states. BiP consists of an N-terminal nucleotide binding domain (NBD, pink) and a C-terminal substrate binding domain (SBD, blue) connected by a hydrophobic interdomain linker peptide (green). The SBD is composed of a two-layered β-sandwich subdomain (SBDβ) containing the substrate binding crevice and a helical lid structure (SBDα). In the ATP-bound conformation the NBD and SBD form extensive contacts, which involves the linker region, and the SBD is in the open conformation (SBDα extended) allowing for interactions with substrates (dark blue) at high association and dissociation rates. Upon ATP hydrolysis to ADP the inter-subunit contacts are lost leading to exposure of the linker, packing of SBDα against SBDβ, and strong reduction of substrate interaction kinetics. Cleavage of BiP by the linker-specific protease SubA (scissors) is favored in the ADP-bound state. (B) Immunoblot of endogenous BiP resolved by native gel electrophoresis. Where indicated the CHO-K1 cells were exposed to cycloheximide (CHX; 100 µg/mL) or thapsigargin (Tg; 0.5 µM) for the indicated time. The major species visible on the native gel are numbered by order of descending mobility (I-III) and the monomeric ‘B’ form induced by CHX treatment and the ‘A’ form detectable in untreated cells are marked. Immunoblots of the same samples resolved by SDS-PAGE report on total BiP and total eIF2α (which also serves as a loading control) and phosphorylated eIF2α to reveal the impact of thapsigargin action. Note the emergence of the ‘B’ form in CHX-treated cells, which is blocked by thapsigargin. (C) BiP immunoblot, as in “A”. Cells were first exposed to cycloheximide to build a pool of the ‘B’ form of BiP and then challenged with thapsigargin (in the continued presence of cycloheximide). Note the disappearance of the ‘B’ form of BiP and the emergence of BiP oligomers in the thapsigargin-treated cells. (D) BiP immunoblot of lysates from untreated (-CHX) and cycloheximide-treated (+CHX) cells. Where indicated the lysates were exposed to the SubA protease that cleaves BiP’s interdomain linker in vitro, before loading onto the native gel. The cleavage products detected by the antiserum used on the native gel are noted (CP, upper panel), as are the full-length BiP (FL) and its substrate binding domain (SBD) on the SDS-PAGE gel below (the nucleotide binding domain is very weakly reactive with the antiserum). eIF2α serves as a loading control. Note the resistance of the ‘B’ form of BiP to cleavage by SubA.
Figure 2 with 1 supplement
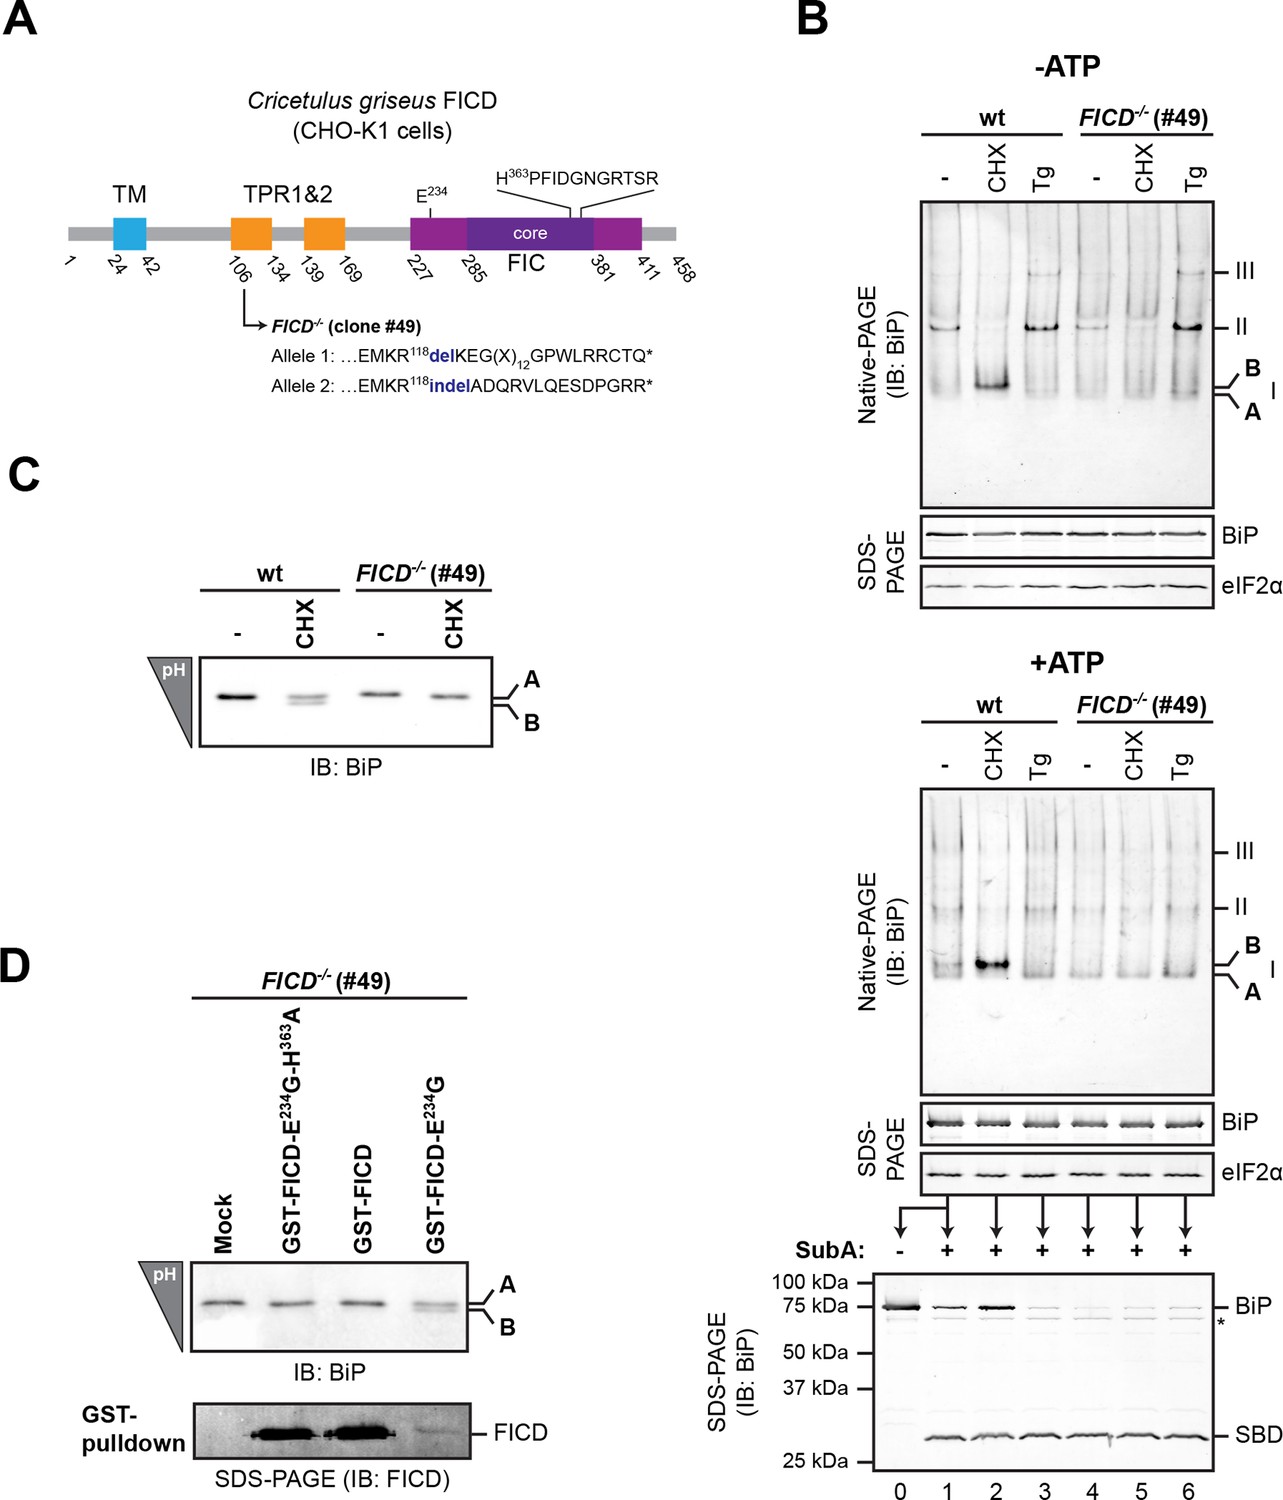
FICD deletion abolishes BiP modification in cultured cells.
(A) Schematic illustration of the hamster FICD protein. The transmembrane region (TM), the two tetratricopeptide repeats (TPR) as well as the FIC-domain (purple) with its core sub-domain (dark purple) and the catalytic loop sequence are shown. Numbers represent amino acid positions. The amino acid sequence surrounding the mutations introduced into the CHO-K1 FICD-/- clone (#49) by CRISPR-Cas9-mediated genome editing are noted. Both alleles result in premature termination of translation deleting the active site (*). (B) Immunoblots of endogenous BiP from wildtype (wt) or FICD-/- CHO-K1 cell lysates from which ATP was either depleted by incubation with hexokinase and glucose (-ATP, top panel) or to which ATP (1 mM) had been added (+ATP, bottom panel), resolved by native-PAGE. Where indicated the cells were exposed to cycloheximide (CHX, 100 µg/ml) or thapsigargin (Tg, 0.5 µM) for 3 hr before lysis. The major species visible on the native gels are numbered by order of descending mobility (I-III) and the monomeric ‘B’ form induced by CHX treatment and the ‘A’ form, prominent in ATP-replete lysates of untreated cells, are marked. Immunoblots of the same samples resolved by SDS-PAGE report on total BiP loaded and on eIF2α as a loading control. The ATP-supplemented lysates (3 µg/µl protein) were in addition exposed to SubA (30 ng/µl) for 10 min at room temperature prior to separation by SDS-PAGE and immunodetection of BiP. The intact protein and the substrate binding domain (SBD), which are detected by the antibodies against a C-terminal epitope of BiP, are indicated. The asterisk marks a band of unknown identity. Note that neither CHX-dependent conversion of endogenous BiP into the monomeric ‘B’ form nor the CHX-mediated resistance of BiP towards proteolytic cleavage by SubA, were observed in FICD-/- cells. (C) Immunoblot of endogenous BiP from wildtype and FICD-/- CHO-K1 cell lysates resolved on an isoelectric focusing (IEF) gel. Where indicated the cells have been exposed to CHX (100 µg/ml) for 3 hr before lysis. Note that the more acidic (‘B’) form of BiP associated with CHX treatment was absent in FICD-/- cells. (D) IEF immunoblot of endogenous BiP from CHO-K1 FICD-/- cells transfected with plasmids encoding wildtype GST-FICD, the constitutively active GST-FICDE234G or the inactive GST-FICDE234G-H363A mutant. Mock transfected cells were analyzed as a control. The cells were treated with CHX (100 µg/ml) for 3 hr before lysis. A pulldown with GSH-Sepharose beads was performed with the same lysates to analyze expression levels of the plasmid-encoded GST-FICD fusion proteins. Note that formation of the acidic (‘B’) form of BiP was restored by expression of catalytically active GST-FICDE234G protein (despite its comparatively low expression level) but neither by expression of the catalytically inactive GST-FICDE234G-H363A mutant nor the regulated wildtype enzyme.
Figure 2—figure supplement 1
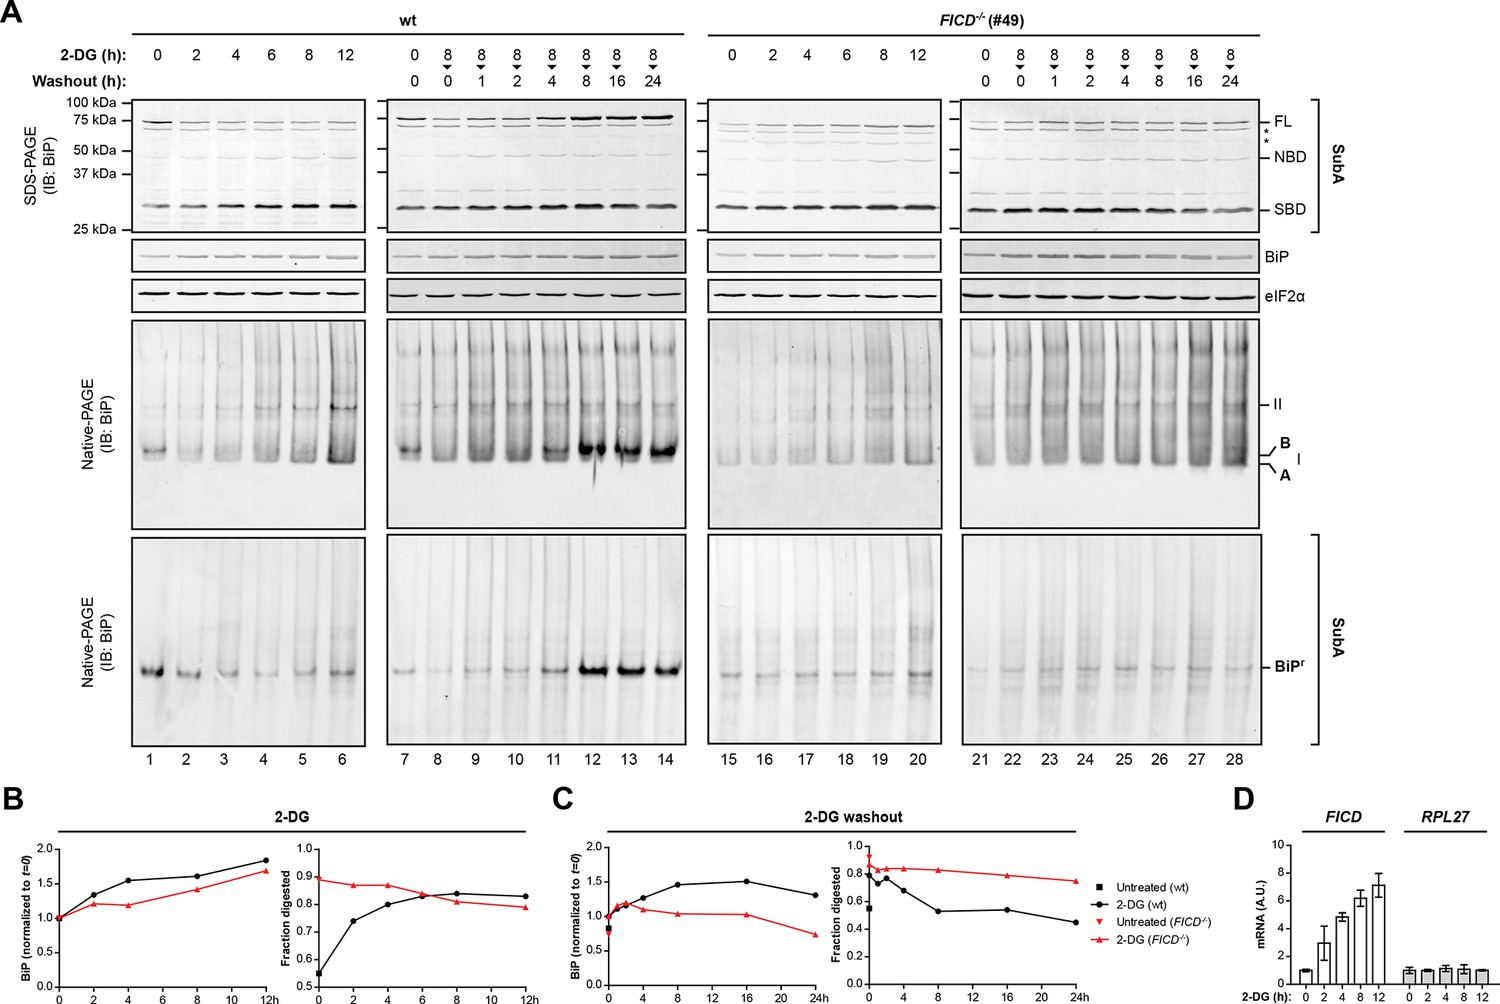
Time-dependent changes in BiP abundance, BiP ‘B’ form and the fraction of BiP resistant to cleavage by SubA in cells exposed to the reversible ER stress-inducing agent 2-deoxy-D-glucose (2-DG).
(A) Immunoblots of BiP from lysates of untreated cells or cells exposed to 2-deoxy-D-glucose (2-DG, 3 mM). Where indicated, 2-DG was washed out before lysis (in the presence of ATP). The samples in the top panels were exposed to SubA before denaturing SDS-PAGE. The migration of the undigested BiP (FL), the nucleotide binding domain (NBD) and substrate binding domain (SBD) are indicated. The total content of BiP in the sample (before digestion with SubA) and the eIF2α signal (provided as a loading control) are also shown. Asterisks mark non-specific bands. Immunoblots of BiP from the same samples resolved by native-PAGE before and after cleavage with SubA are shown below. BiPr denotes SubA-resistant BiP detected on native gels and the positions of the monomeric A and FICD-dependent ‘B’ form, and BiP oligomers (II) are indicated. (B) Trace of time-dependent changes in total BiP abundance from the samples in “A” [normalized to the signal in the untreated (t=0) sample of each genotype] and in the fraction of BiP digested by SubA from the samples exposed to 2-DG. The fraction digested, was derived from the top panels in “A”. (C) As in “B” but for cells exposed to 2-DG for 8 hr followed by washout. (D) Plot of time-dependent changes in the abundance of FICD and RPL27 (60S ribosomal protein L27, a reference gene) mRNA normalized to PPIA (cyclophilin A) mRNA internal control in wildtype cells exposed to 2-DG. The observations made in the key time points of this detailed experiment have been reproduced independently twice. Note the progressive increase in the fraction of BiP susceptible to cleavage by SubA, observed in the wildtype cells following exposure to 2-DG and the correlated disappearance of the ‘B’ form on native-PAGE gels and the correlated re-emergence of ‘B’ form and SubA-resistant BiP during the 2-DG washout; neither of which are evident in the FICD-/- cells.
Figure 3 with 1 supplement
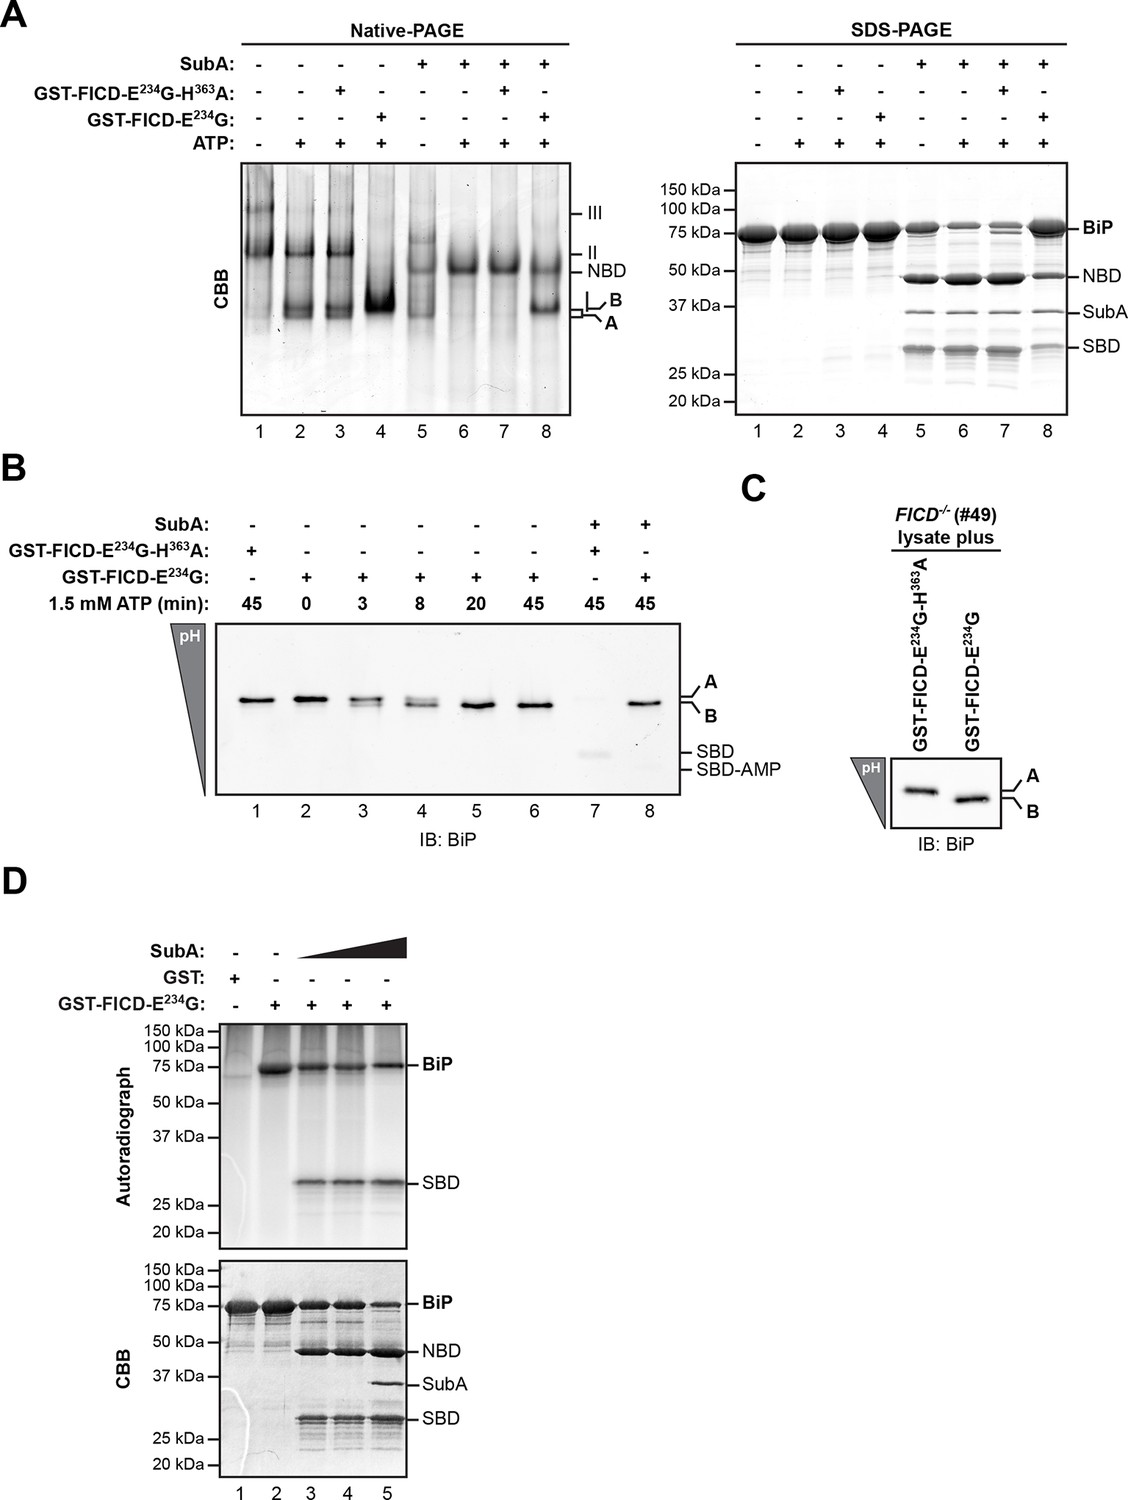
AMPylation of purified BiP in vitro recapitulates features of BiP modified in vivo.
(A) Coomassie (CBB)-stained native-PAGE gel (left panel) or SDS-PAGE gel (right panel) of recombinant BiP purified from bacteria (10 µM) exposed to ATP (1.5 mM) in the absence or presence of recombinant active GST-FICDE234G or inactive GST-FICDE234G-H363A (0.5 µM) purified from E. coli (45 min at 30°C). The interdomain linker-specific protease SubA (30 ng/µl) was added afterwards for 10 min where indicated. The major species on the native gel are numbered by order of descending mobility (I-III) and the monomeric ‘A’ and ‘B’ forms of BiP are indicated. Full-length BiP, the nucleotide binding domain (NBD, also resolved on the native gel) and the substrate binding domain (SBD) are annotated on the SDS-PAGE gel. Note the quantitative AMPylation-dependent conversion of BiP into the monomeric ‘B’ form on native gels and the increased resistance of modified BiP to cleavage by SubA. Also note that upon incubation with ATP unmodified BiP forms a second slower migrating monomeric species similar to the ‘B’ form, which likely reflects an alternative (e.g. ATP-bound) conformation. (B) Immunoblot of an IEF gel of purified hamster BiP19-654 (15 µM) after in vitro AMPylation with GST-FICDE234G or as a control with inactive GST-FICDE234G-H363A (both at 0.75 µM) in presence of ATP (1.5 mM) for the indicated times at 30°C followed by treatment with or without SubA (30 ng/µl) for 10 min. The two forms of full-length BiP (‘A’ and the more acidic ‘B’ form) as well as faint signals that likely represent the unmodified and modified SBD are indicated. (C) Immunoblot of endogenous BiP from lysates of cycloheximide-treated CHO-K1 FICD-/- cells resolved by IEF-PAGE following exposure in vitro to purified active or inactive FICD (as in "B" above). Note the conversion of all the detectable BiP to an acidic form in the sample exposed to active FICD. (D) Autoradiograph and Coomassie stain of an SDS-PAGE gel of BiP exposed in vitro to active GST-FICDE234G coupled to GSH-Sepharose beads (or GST alone as a control) in the presence of α-32P-ATP as a substrate. After the AMPylation reaction the samples were treated further with increasing concentrations of SubA (0.03 ng/µl, 0.1 ng/µl and 20 ng/µl, lanes 3-5) where indicated. Note the confinement of the radiolabel to the SBD fragment of cleaved BiP.
Figure 3—figure supplement 1
Comparison of the differential susceptibility of unmodified and AMPylated BiP to cleavage by SubA in vitro.
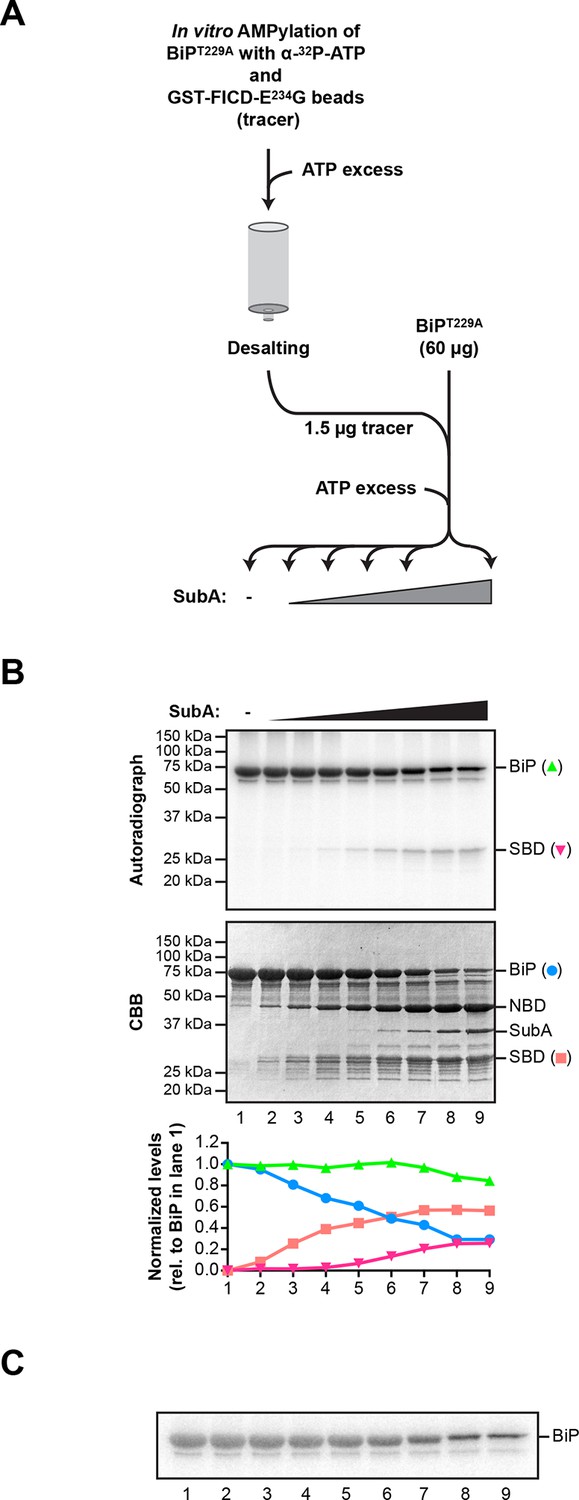
(A) Schema of the experimental design. ATP hydrolysis-deficient BiPT229A protein was AMPylated in presence of radioactive α-32P-ATP with catalytically active GST-FICDE234G coupled to GSH-Sepharose beads. The enzyme-containing beads were removed by centrifugation and excess of non-radioactive ATP was added to the supernatant to competitively displace non-covalently bound α-32P-ATP from BiPT229A. Unbound nucleotides were then removed by passing the sample through a desalting column. Trace amounts (1.5 µg) of the recovered 32P-labeled AMPylated BiPT229A protein were added to excess of unmodified BiPT229A protein (60 µg; a mass ratio of 40:1) and the combined sample was supplemented with ATP and treated for 30 min with increasing concentrations of the SubA protease (0.08 to 120 ng/µl) before denaturing SDS-PAGE, Coomassie staining and autoradiography. (B) Autoradiograph and Coomassie stain (CBB) of an SDS-PAGE gel of BiP from samples described above. In the bottom panel, the Coomassie stain and radioactive signals of the full-length BiP and the substrate binding domain (SBD) were quantified and normalized to the values in lane 1, which were set arbitrarily to 1 for full-length BiP and to 0 for the SBD (graph). The Coomassie stain signal reports of the fate of unmodified BiPT229A, whereas the radioactive signals report exclusively on the modified BiPT229A in the combined sample. NBD denotes the nucleotide binding domain. (C) A shorter exposure (1 hr versus 8 hr) of the autoradiograph shown in “B”, above. It reveals the substantial conservation of the radioactive signal emanating from intact BiP across the time course (the green plot in “B” above), which is obscured by changes in the band width introduced by the progressive digestion of the unlabeled (and unmodified) intact BiP in the sample.
Figure 4 with 3 supplements
FICD-mediated incorporation of a single AMP molecule onto the substrate binding domain of BiP in vitro.
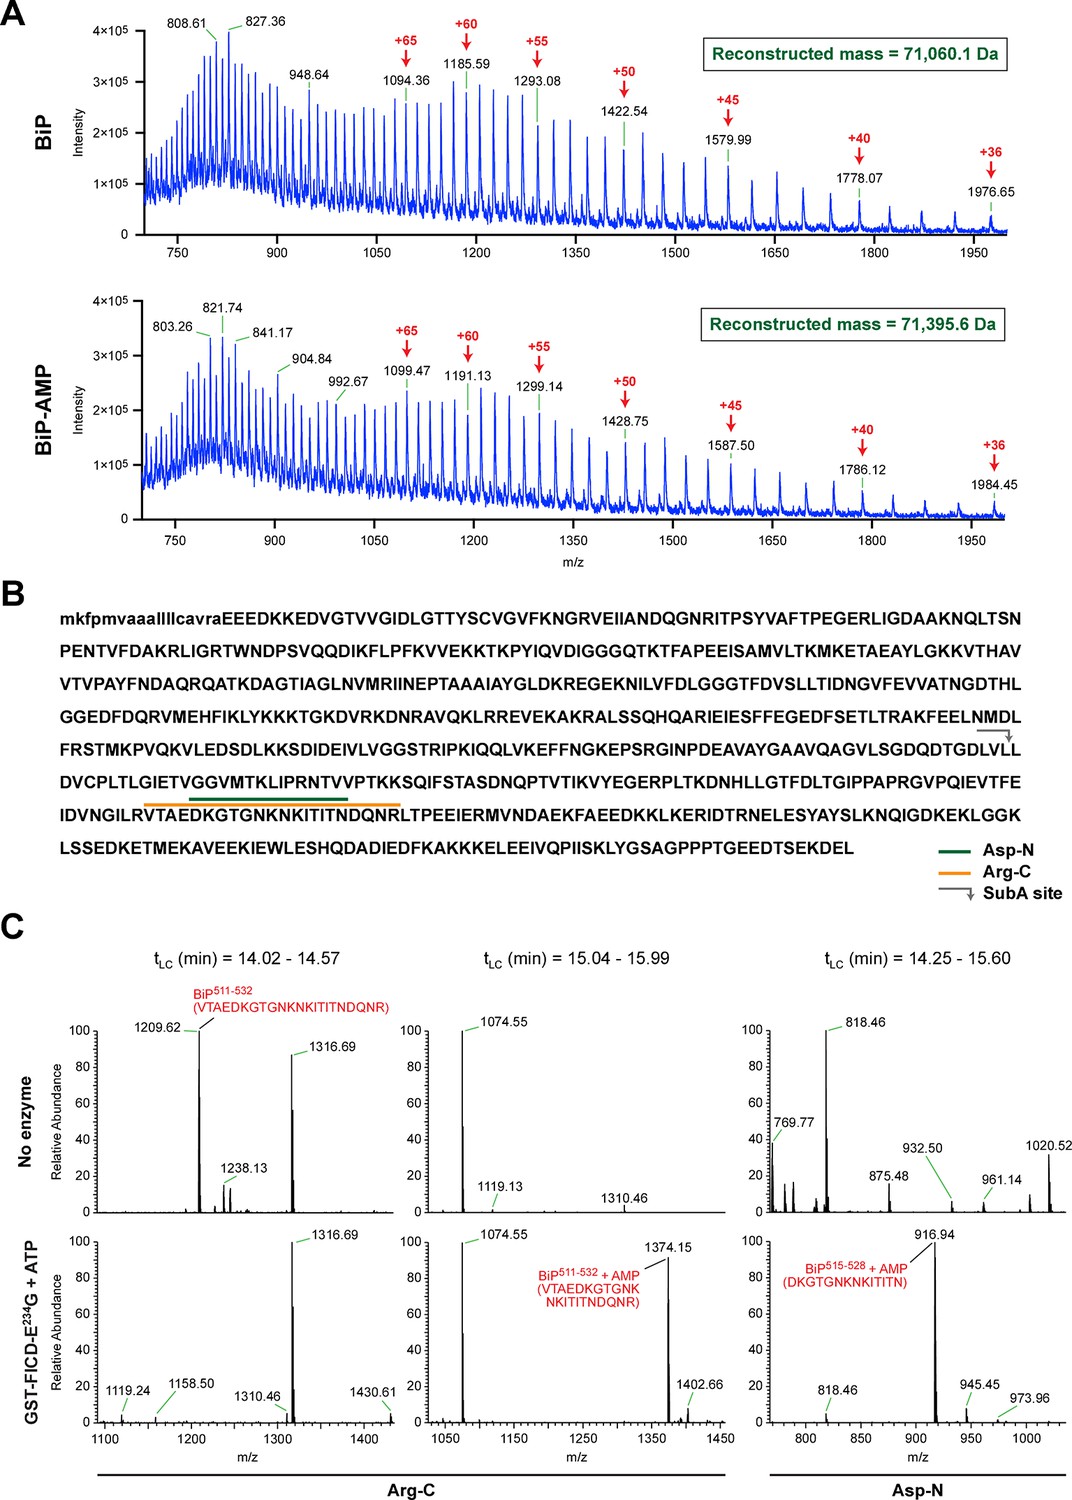
(A) Electrospray mass spectra of bacterially expressed hamster BiP (27-654, with a His6-tag) after reverse-phase HPLC purification. The spectra contain protein ions with between 36 and 100 associated protons (the number of protons are indicated for the major species). The inset shows the data reconstructed onto a true mass scale. The sample in top panel is of unmodified BiP and that in bottom panel of BiP that had been modified in vitro with GST-FICDE234G and ATP. (B) Amino acid sequence of Chinese hamster BiP (with the cleaved signal peptide in lower case letters). The SubA cleavage site (after L416) is marked by the grey arrow and the predicted Arg-C and Asp-N AMPylated proteolytic cleavage fragments are delineated by the colour coded horizontal lines above the protein sequence. (C) LC-MS spectra of peptides derived from recombinant BiP digested with Arg-C or Asp-N before (“No enzyme”) and after in vitro modification with GST-FICDE234G and ATP. The m/z ratio of the signals is displayed in the abscissa and their relative intensity in the ordinate. The interval of the liquid chromatogram at which the peptides in question eluted is depicted above each paired sample [tLC (min)]. Note the absence of any signal corresponding to the doubly-charged non-AMPylated 511-532 Arg-C fragment in the spectrum derived from BiP after exposure to GST-FICDE234G and ATP (left-most lower panel) and the absence of signals corresponding to the doubly-charged AMP modified peptides in the spectra derived from the Arg-C or Asp-N digests of BiP that had not been exposed to GST-FICDE234G and ATP (central and rightmost upper panels).
Figure 4—figure supplement 1
Chromatographic profile and reconstructed mass spectrum of unmodified BiP and BiP modified in vitro with FICD and ATP.
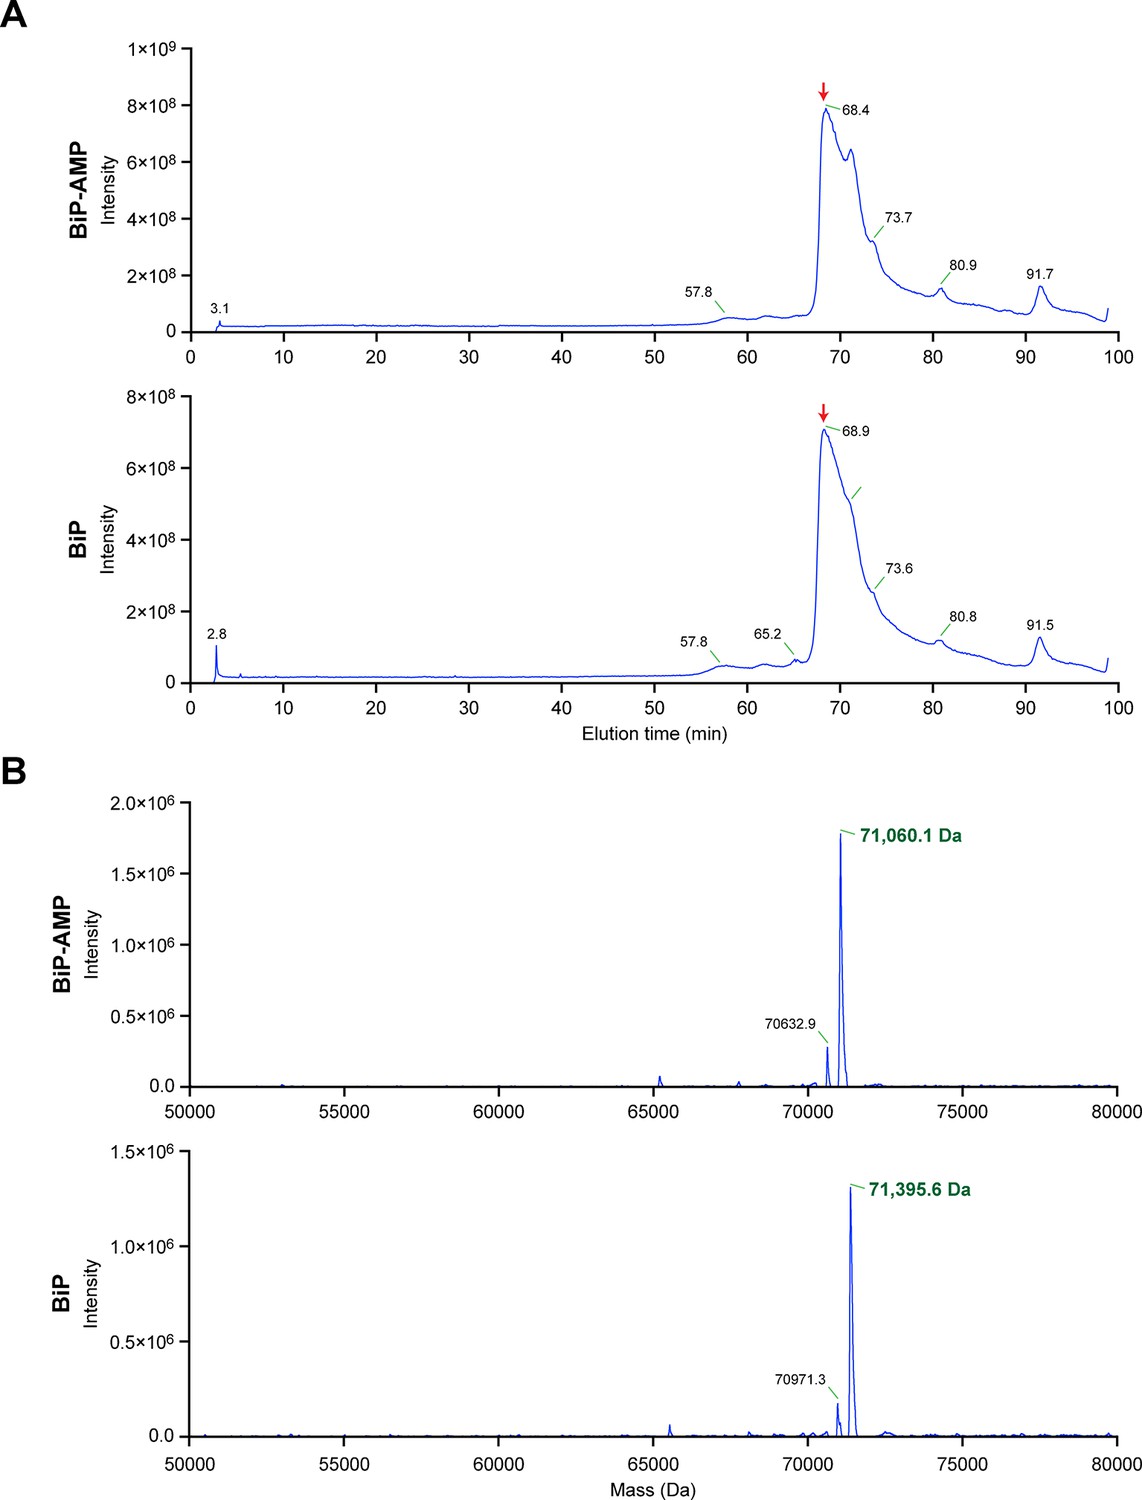
(A) Total ion current chromatograms from the reverse-phase separation of unmodified and AMPylated BiP, respectively. The peak regions denoted by the red arrow were used to generate the mass spectra shown in “B”. (B) Electrospray ionization mass measurements of intact unmodified and modified BiP, after reconstruction onto a true mass scale. These data were derived from the ion current chromatograms presented in Figure 4A. Note the homogeneity of the peak corresponding to modified BiP, consistent with quantitative modification of BiP by a single AMP molecule. The ions eluting as a shoulder after the main peaks shown in “A” comprise singly charged non-proteinaceous species.
Figure 4—figure supplement 2
Modification of BiP with a single AMP molecule in vivo.
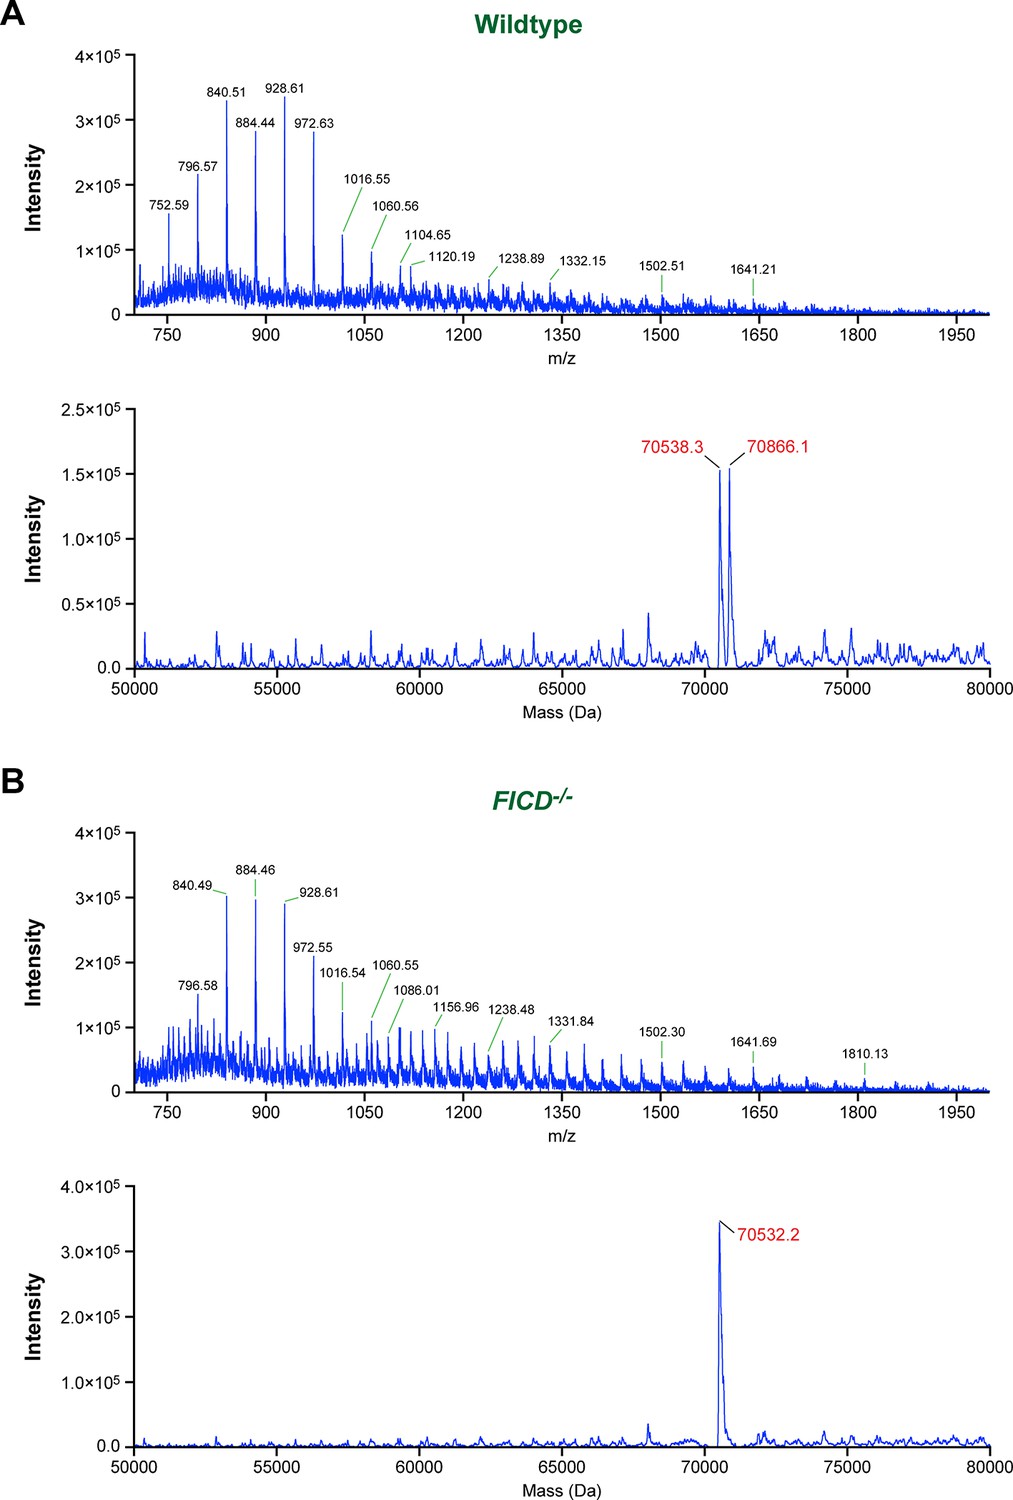
(A) Electrospray ionization mass spectrum of endogenous BiP eluted from a reverse-phase HPLC column after immunoaffinity purification from wildtype CHO-K1 lysates. The cells were treated with cycloheximide (100 µg/ml) for 3 hr before lysis to enhance BiP modification. The spectrum in the upper panel contains peaks for multiply charged protein ions (with between 36 and 100 associated protons), which were used to reconstruct the molecular masses of BiP (lower panel). Note that only two major peaks (70,538.3 Da and 70,866.1 Da) were obtained. The difference (327.8 Da) between these reconstructed masses is consistent with the attachment of a single AMP moiety per BiP molecule in vivo. (B) Experiment as in “A” with BiP isolated from cycloheximide-treated CHO-K1 FICD-/- cells. Only a single molecular mass was reconstructed (70,532.2 Da), consistent with the inability of the mutant cells to AMPylate BiP. Note that in both experiments the masses of non-AMPylated BiP were slightly larger (59.7 Da and 53.6 Da, respectively) than that predicted of mature endogenous BiP (70,478.6 Da), which may be explained by another quantitative (likely irreversible) post-translational modification of BiP (e.g. acetylation of a lysine residue).
Figure 4—figure supplement 3

Evidence for the absence of modification of Ser365 or Thr366 in mono-AMPylated BiP.
(A). Amino acid sequence of Chinese hamster BiP (with the cleaved signal peptide in lower case letters) with Ser365 and Thr366 highlighted in red. The SubA cleavage site is marked by the grey arrow and the predicted proteolytic cleavage fragments generated by the four endoproteases are delineated by the color coded horizontal lines above the protein sequence. (B) LC-MS spectra of peptides derived from the indicated digests of recombinant BiP before (“No enzyme”) and after in vitro modification (that went to completion, see Figure 3B) with GST-FICDE234G and ATP. The m/z ratio of the signals is displayed in the abscissa and their relative intensity in the ordinate. The sequence of the peptide encompassing unmodified Ser365 or Thr366 is indicated. Note the contrast between the abundance of signal corresponding to the mass of the unmodified peptides encompassing Ser365 or Thr366 in the samples of AMPylated BiP (lower panel in each of the four pairs) and the absence of the peptide corresponding in mass to the non-AMPylated 511-532 Arg-C fragment in the spectrum from the same sample of AMPylated BiP (Figure 4C, left-most lower panel).
Figure 5
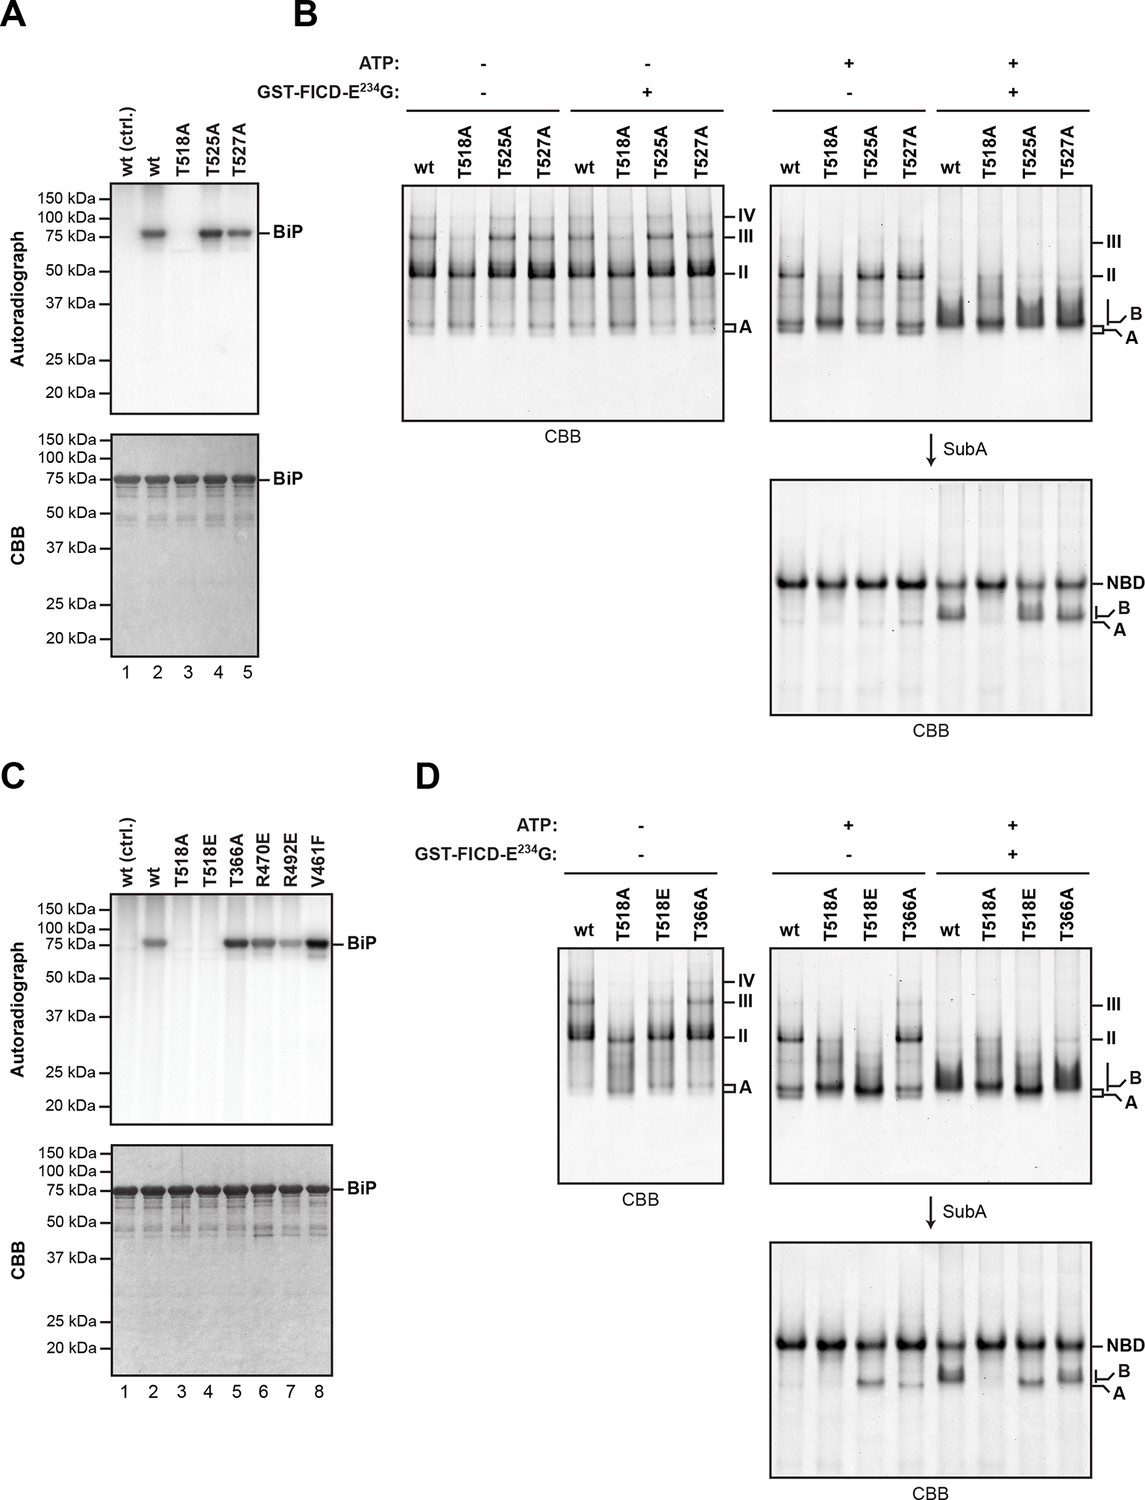
Mutation of threonine 518 in the substrate binding domain of BiP abolishes its AMPylation in vitro.
(A) Autoradiograph and Coomassie (CBB) stain of an SDS-PAGE gel of recombinant bacterially-expressed wildtype (wt) BiP and the indicated mutants exposed in vitro to active GST-FICDE234G coupled to GSH-Sepharose beads (lanes 2-5) or GST alone as a control (lane 1) in the presence of α-32P-ATP as a substrate. (B) Coomassie-stained native gel of wildtype BiP and the indicated mutants (all at 20 µM), following exposure to ATP (1.5 mM), GST-FICDE234G (0.8 µM), both or neither (for 45 min at 30°C). Where indicated the samples were afterwards exposed to SubA (30 ng/µl, 10 min at room temperature). (C) As in “A” above, with a different set of mutant BiP proteins. (D) As in “B” above, with a different set of mutant BiP proteins. Note that both the T518E and T518A mutations (in panel “B” above) affect the mobility of the ‘A’ form of BiP and forestall further changes in mobility by FICD, but only the T518E mutation mimics enzyme-mediated AMPylation by promoting a ‘B’ form-like state partially resistant to cleavage by SubA.
Figure 6 with 2 supplements
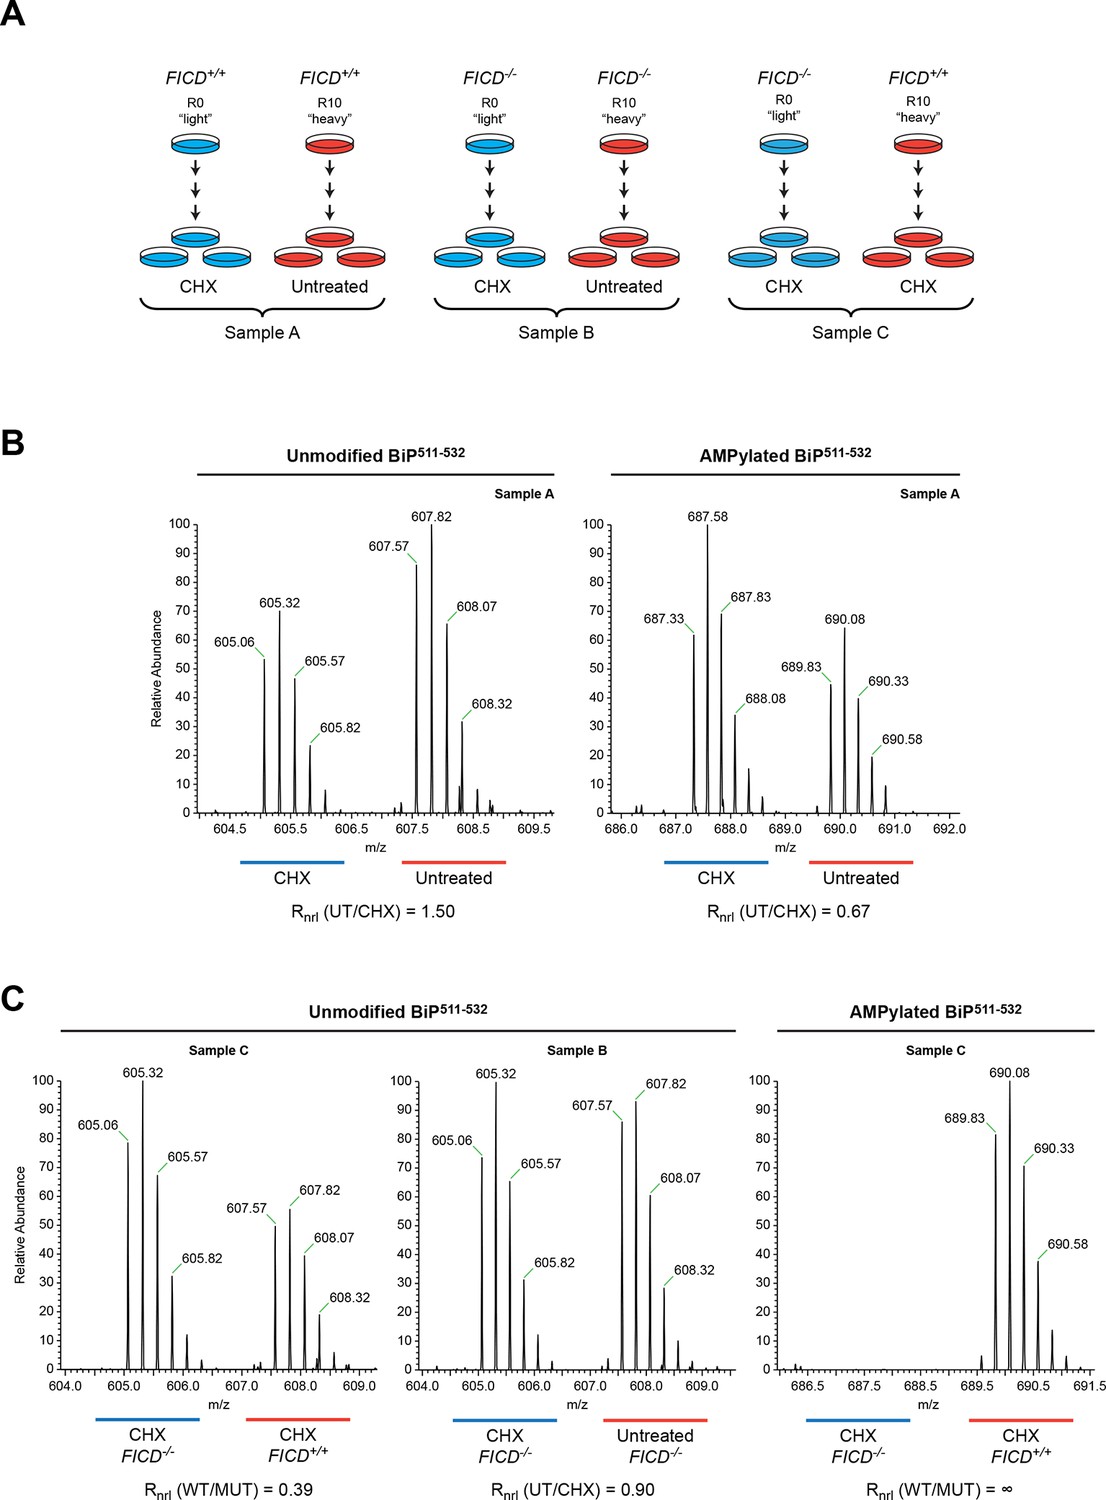
Reciprocal loss of unmodified and gain of AMPylated BiP511-532 purified from CHO-K1 cells treated with cycloheximide.
(A) Schema of the design of the SILAC experiment to quantify relative changes in abundance unmodified and AMPylated BiP peptides from untreated and cycloheximide (CHX)-treated wildtype and FICD-/- mutant CHO-K1 cells. (B) LC-MS spectra of unmodified and modified quadruply-charged BiP511-532 peptides from a SILAC experiment where untreated "heavy" and cycloheximide-treated "light" samples from wildtype CHO-K1 cells were digested by Arg-C. The raw peptide abundance measurements were normalized to the recovery of a doubly-charged reference peptide, BiP61-74, from the same SILAC samples (Figure 6—figure supplement 1) to arrive at the normalized ratio of the signal in the paired samples (Rnrl). Note that unmodified BiP511-532 is depleted and AMPylated BiP511-532 is reciprocally enriched in cycloheximide-treated wildtype cells. (C) Analysis as in “B” (above) applied to the indicated paired SILAC samples. Note that unmodified BiP511-532 is depleted by cycloheximide treatment only in wildtype cells and AMPylated BiP511-532 is only detected in wildtype cells. These observations were reproduced in a second independent SILAC experiment.
Figure 6—figure supplement 1
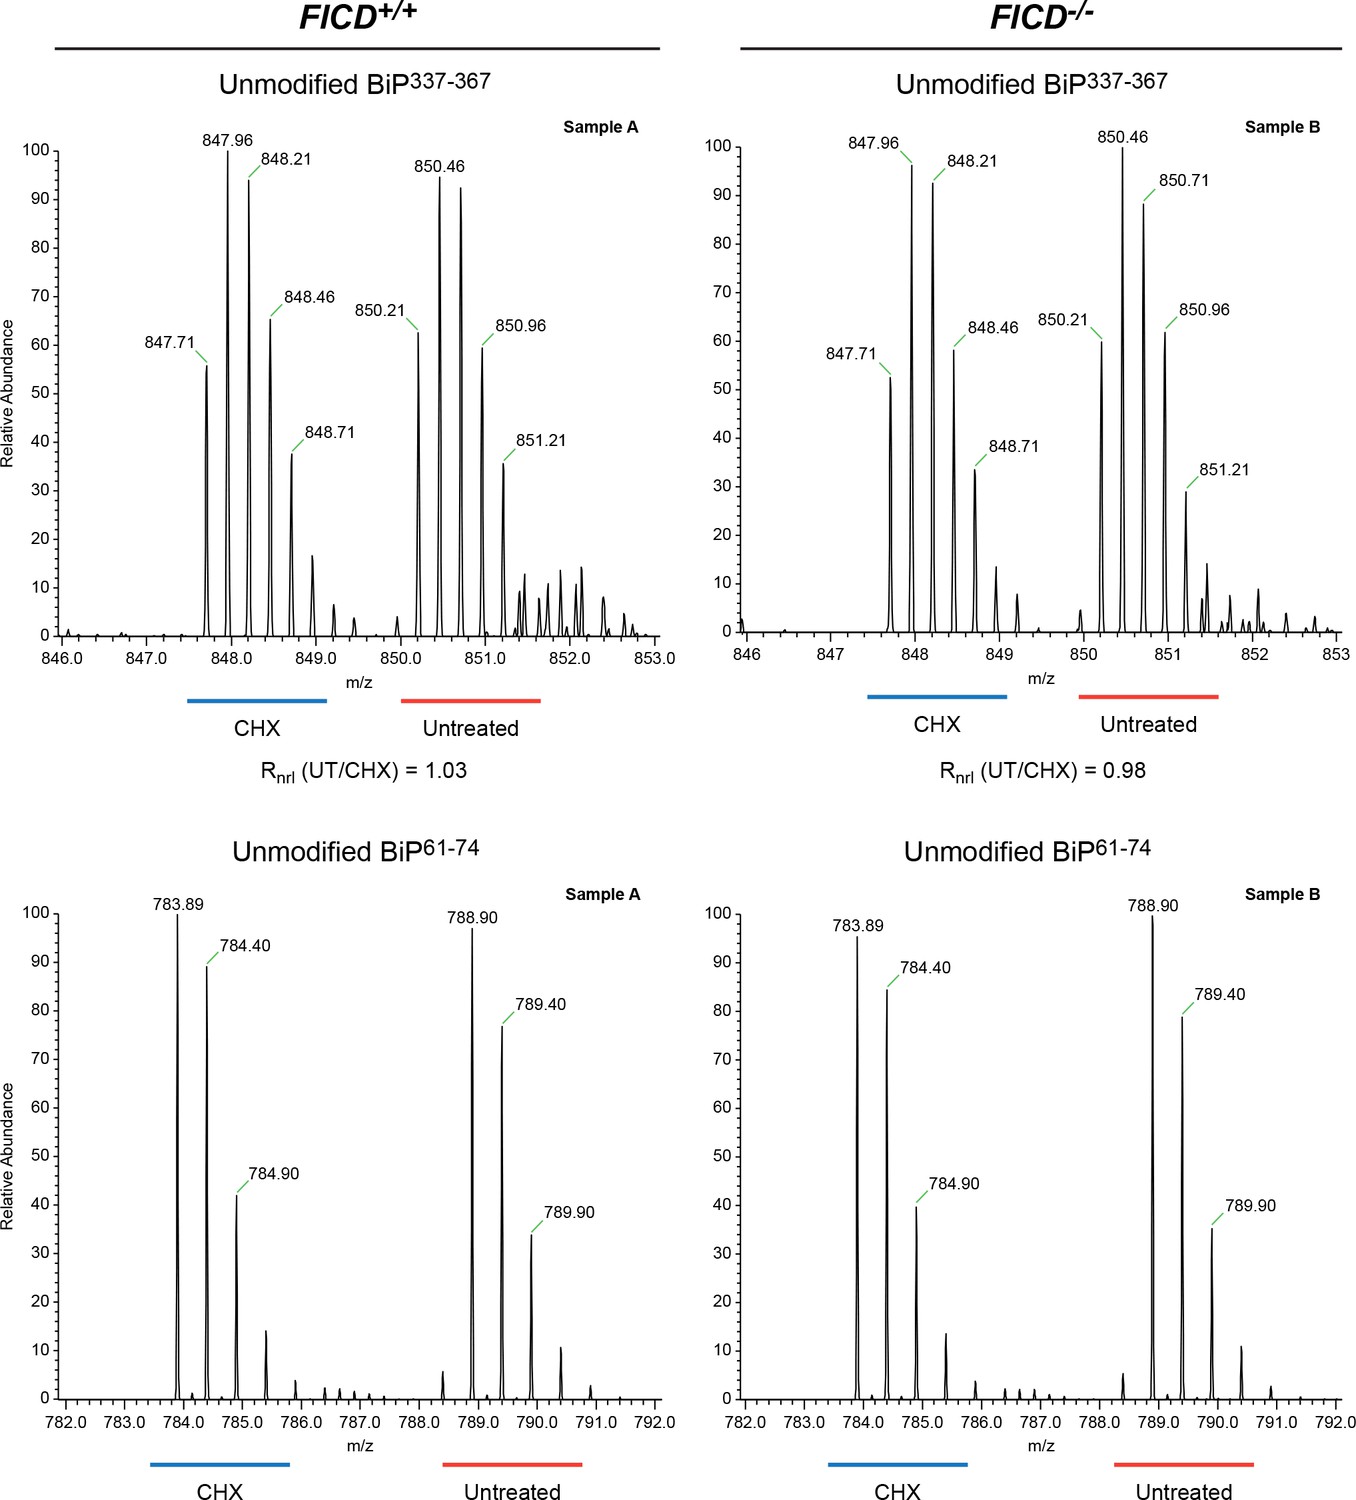
No change detected in abundance of unmodified BiP337-367 purified from CHO-K1 cells treated with cycloheximide.
Shown are LC-MS spectra of unmodified quadruply-charged BiP337-367 peptides from a SILAC experiment in which untreated “heavy” and cycloheximide-treated “light” samples from wildtype cells or FICD-/- cells were digested by Arg-C. The spectrum of a doubly-charged reference peptide, BiP61-74, from the same SILAC samples is provided for normalization. Note the absence of change in abundance of peptides encompassing Thr366 in the SILAC sample digested with Arg-C. These observations were reproduced in a second independent SILAC experiment.
Figure 6—figure supplement 2

Fragmentation spectra of unmodified and AMPylated BiP Arg-C peptide 511-532 pinpoints AMPylation to Thr518.
(A) High energy collision dissociation (HCD) fragmentation spectra of unmodified and AMPylated BiP511-532 peptides obtained from Arg-C digests of endogenous BiP (‘1’, upper panels) immunopurified from cycloheximide-treated wildtype CHO-K1 cells grown in medium containing “light” arginine (R0 from SILAC sample A in Figure 6A) and unmodified or in vitro AMPylated recombinant BiP (‘2’, lower panels) purified from bacteria. The most informative BiP511-532 b and y ions encompassing threonine residues Thr512, Thr525 and Thr527 are indicated (dotted lines). Note that the signal from unmodified fragment y16, which includes Thr518 (red), is detectable in spectra of unmodified BiP511-532 but is absent in spectra of AMPylated BiP511-532 (close-up view). (B) The amino acid sequences of the b and y ions identified in BiP511-532 fragmentation spectra of unmodified and AMPylated endogenous BiP (‘1’) or purified recombinant BiP (‘2’) as shown in “A” are listed below the sequence of the intact BiP511-532 peptide. Threonine residues Thr512, Thr525 and Thr527 are indicated in green. Fragment ions highlighted in “A” are marked in blue. Note the selective absence of fragment ions spanning Thr518 (red) from spectra of AMPylated BiP511-532.
Figure 7 with 2 supplements
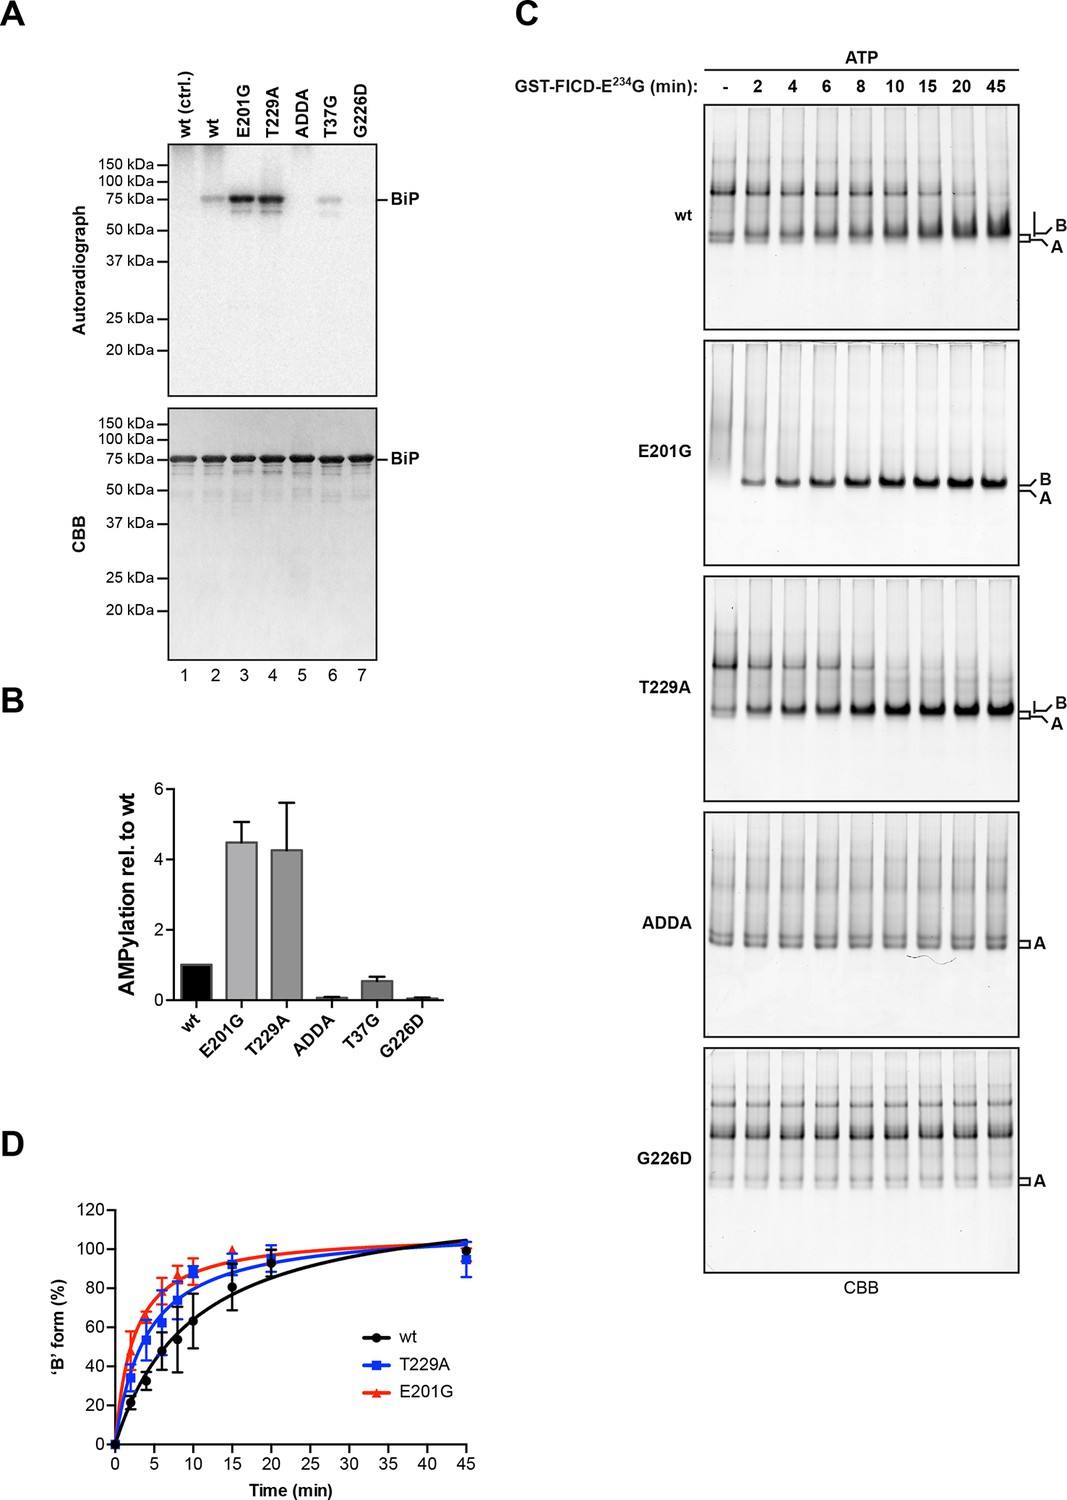
AMPylation of BiP is sensitive to its conformational state.
(A) Autoradiograph and Coomassie (CBB) stain of an SDS-PAGE gel of wildtype (wt) BiP and the indicated mutants exposed in vitro to active GST-FICDE234G coupled to GSH-Sepharose beads (lanes 2-5) or GST alone as a control (lane 1) in the presence of α-32P-ATP as a substrate. (B) Bar graph of densitometric quantification of radiolabeled BiP proteins from in vitro AMPylation reactions as in “A”. The radioactive signals were normalized to the amount of loaded protein (CBB signal) and the values for wildtype BiP protein were arbitrarily set to 1. Mean values ± SD of three independent experiments are shown. (C) Coomassie-stained native gels of the indicated BiP mutants (all at 20 µM) following exposure to bacterially expressed GST-FICDE234G (0.8 µM) in presence of 1.5 mM ATP for the indicated time. Note the reduced ability of BiPE201G to form discrete oligomers in presence of ATP, which may be due to altered substrate interaction characteristics. Also note the sharpness of the bands of modified BiPE201G and BiPT229A, which suggest a high degree conformational uniformity and strongly reduced substrate interactions. (D) Plot of time-dependent accumulation of the ‘B’ form of BiP from experiments as shown in “C”. Initial values were set to 0% and end-point values were set to 100% for each of the BiP versions, respectively. Mean values ± SD of three independent experiments are shown. Non-linear regression analysis was performed to determine t1/2max values, which were 9.9 min, 4.0 min and 2.3 min for wildtype BiP, BiPT229A and BiPE201G, respectively.
Figure 7—figure supplement 1
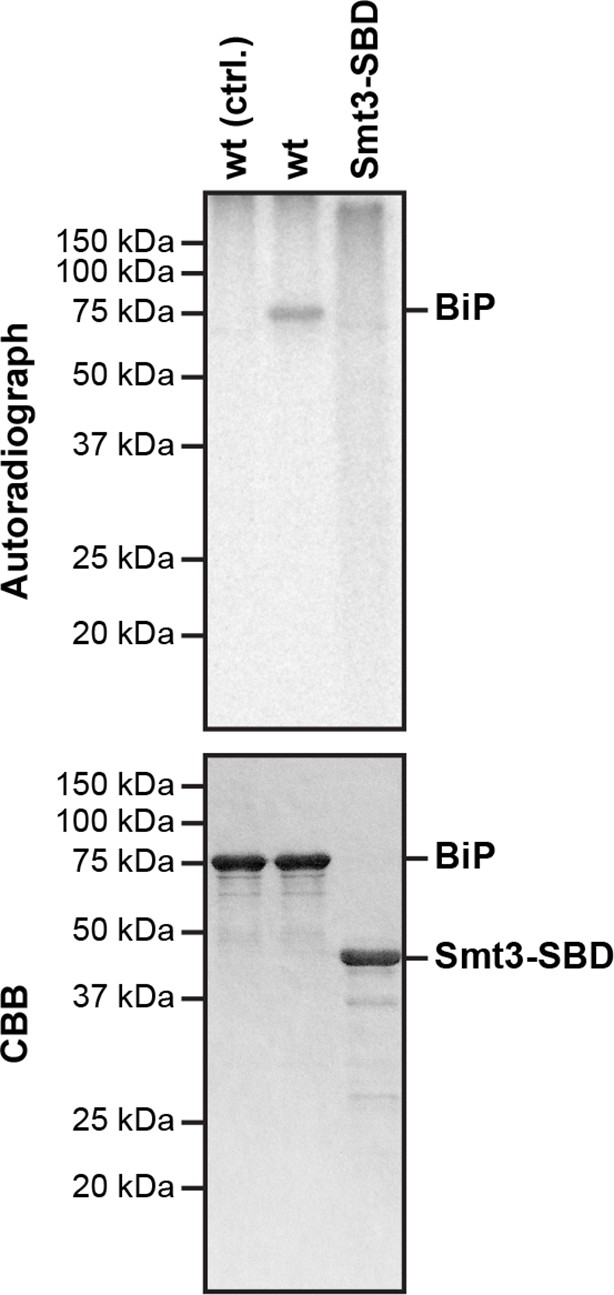
The isolated BiP substrate binding domain is not measurably AMPylated by FICD in vitro.
Autoradiograph and Coomassie (CBB) stain of an SDS-PAGE gel of wildtype BiP and a fusion of the isolated substrate binding domain (SBD) to Smt3 (Smt3-SBD) following exposure in vitro to active GST-FICDE243G coupled to GSH-Sepharose beads (lanes 2-3) or GST alone as a control, (lane 1) in the presence of α-32P-ATP as a substrate.
Figure 7—figure supplement 2
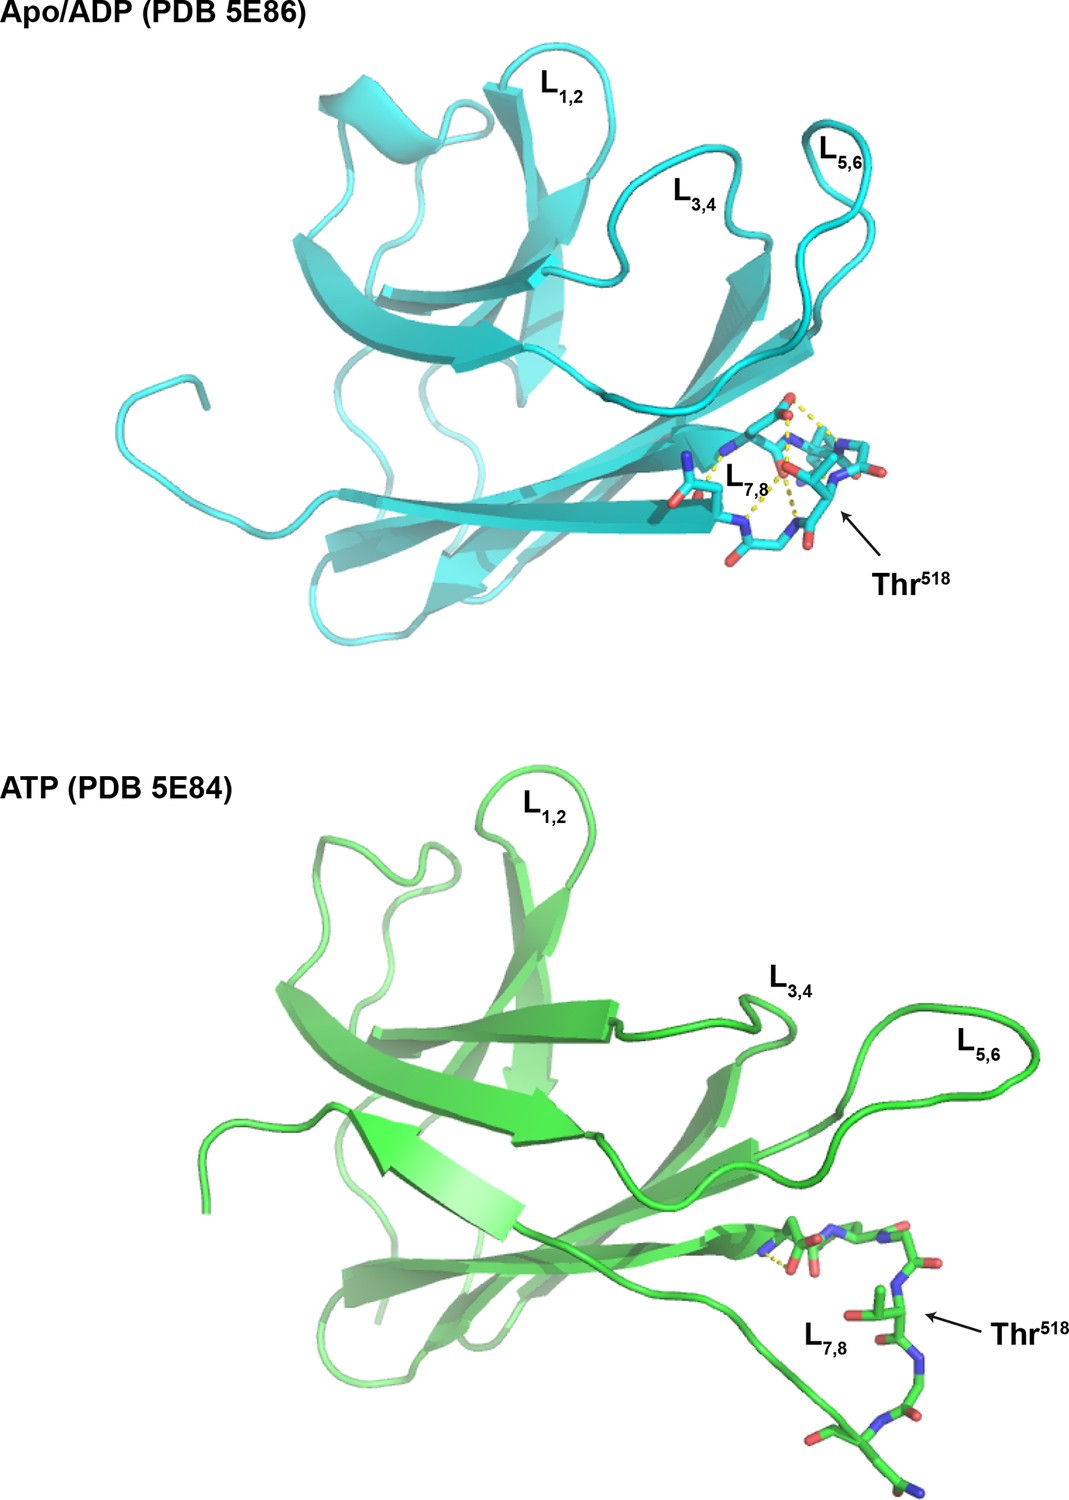
Loop 7,8 of the BiP substrate binding domain is destabilized in the ATP-bound conformation.
The structure of the substrate binding domain (SBD) of human BiP in the apo/ADP state (PDB 5E86) and ATP state (PDB 5E84) rendered in cartoon form with the loop encompassing Thr518 (L7,8) in stick diagram. L1,2 and L3,4 delimiting the peptide binding grove, the flanking L5,6 and Thr518 are indicated for orientation. Note that the web of polar interactions stabilizing L7,8 in the ADP state (T518 side chain to N520 amine; T518 side chain to D515 side chain; D515 amine to N520 carboxylate; D515 carboxylate to G519 amine; D515 carboxylate to T518 amine and D515 side chain to G517 carboxylate) is disrupted in the ATP state; disruption that would be maintained by AMPylation of Thr518.
Figure 8
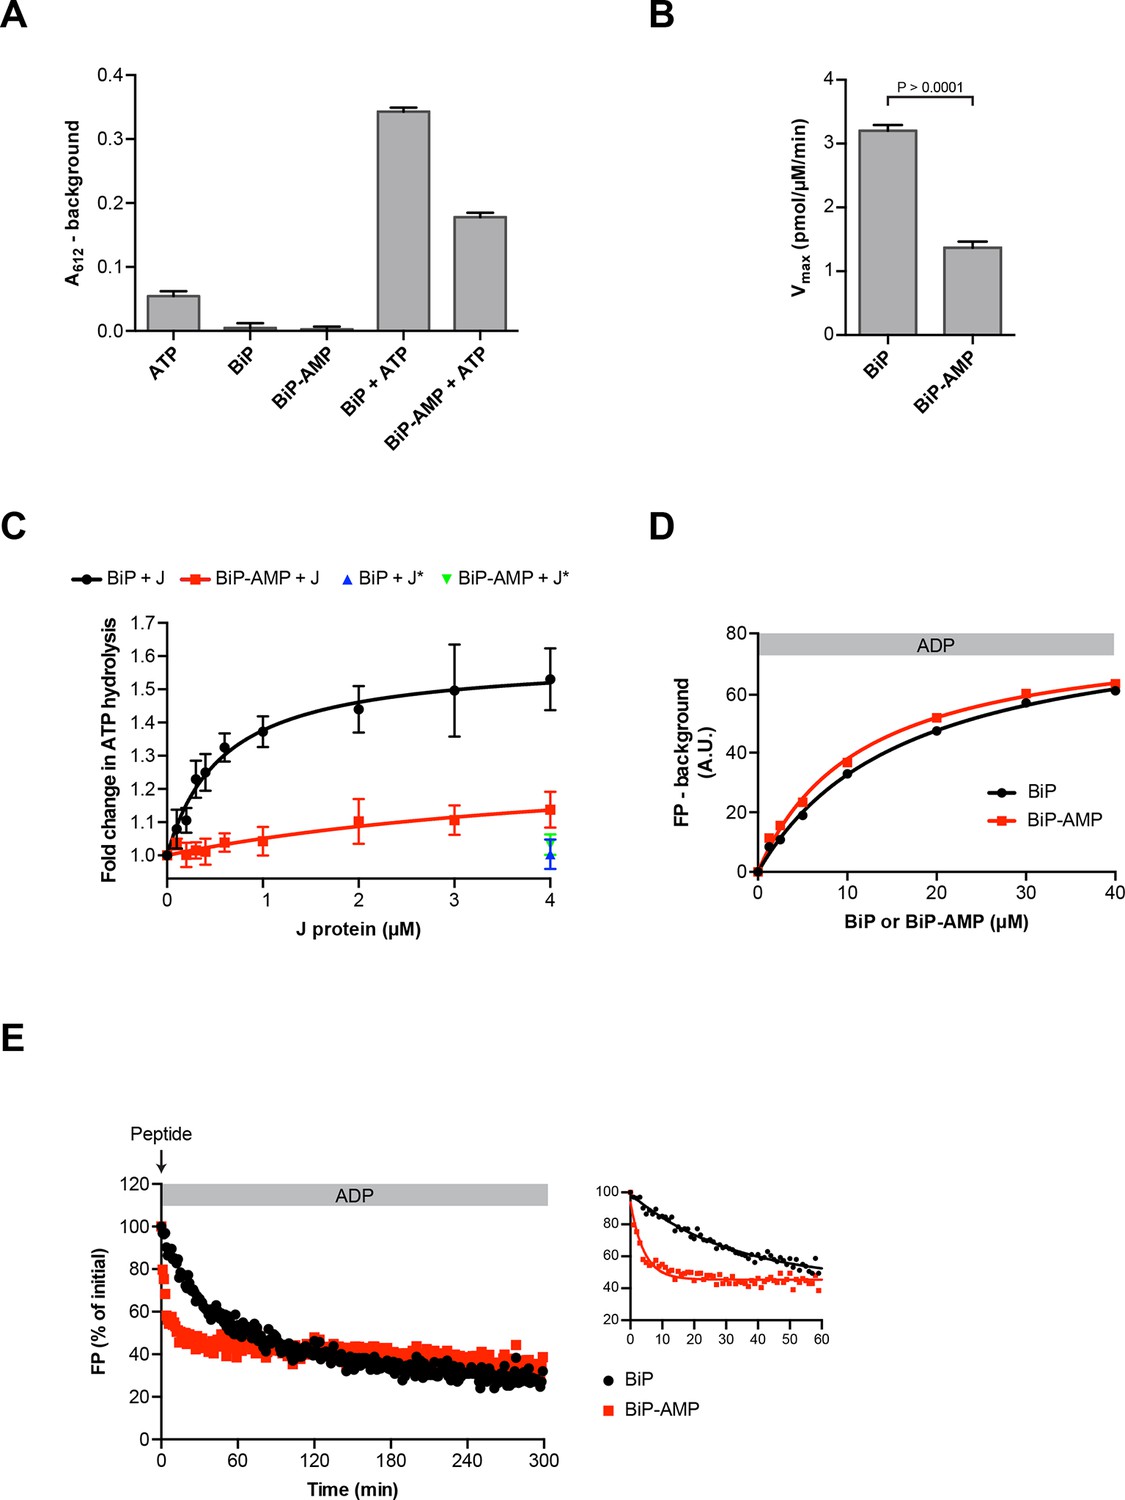
Functional consequences of BiP AMPylation in vitro.
(A) Bar diagram of ATP hydrolysis by BiP and BiP AMPylated to completion (BiP-AMP), as reflected in phosphate release (detected colorimetrically). Samples containing either purified BiP or BiP-AMP (both at 5 µM) were incubated with 3 mM ATP for 1 hr at 30°C and free orthophosphate generated by ATP hydrolysis was measured. Samples lacking BiP or ATP report on the assay background. Bar graph shows mean absorbance values ± SD at 612 nm (A612) of the complex between free orthophosphate and the malachite green dye after background subtraction of three repeats (n = 3). (B) Bar diagram of Vmax values for basal ATPase activities of unmodified and AMPylated BiP, derived from experiments as in “A”. Mean values ± SD are shown (n = 3). (C) Measurement of J protein-stimulated ATPase activity of unmodified and AMPylated BiP. Samples of purified BiP or BiP-AMP (both at 1.5 µM) were incubated in presence of 2 mM ATP with isolated J-domain of ERdj6 (J) at the indicated concentrations for 3 hr at 30°C and released orthophosphate was detected as in “A”. The control reactions contained 4 µM of non-functional ERdj6H422Q J-domain (carrying a mutation in the critical HPD motif; J*) instead of the wildtype J-domain. Shown is the J protein-dependent change in ATP hydrolysis rate of BiP and BiP-AMP relative to their basal ATP hydrolysis rates in absence of J protein (set to 1) of four experiments (values ± SD, n = 4). (D) Plot of concentration-dependent steady-state binding of substrate peptide by unmodified or AMPylated BiP. Fluorescence polarization (FP) of 1 µM lucifer yellow-labeled BiP substrate peptide (HTFPAVLGSC) was measured after incubation with purified BiP or BiP-AMP at the indicated concentrations for 24 hr at 30°C in presence of 1 mM ADP. Mean values of a representative experiment performed in triplicates are shown. (E) Plot of time-dependent release of fluorescently-labeled substrate peptide from unmodified or AMPylated BiP, following injection of 400-fold excess of unlabeled substrate peptide. Fluorescence polarization (FP) signal of lucifer yellow-labeled substrate peptide (1 µM) bound to BiP or BiP-AMP (both at 40 µM) in presence of 1 mM ADP (as in “D”) was measured after addition of 400-fold excess of unlabeled substrate peptide (0.4 mM) at t = 0. The initial values (after background subtraction) were set to 100% and non-linear regression analysis was performed on the first 60 min of peptide competition (inset). Mean values of a representative experiment performed in triplicates are plotted on the graph. The mean dissociation rate constants (koff) ± SD for BiP = 0.037 ± 0.006 min-1 and BiP-AMP = 0.212 ± 0.021 min-1 as well as the mean half-lives (t1/2) ± SD for BiP = 19.3 ± 2.9 min and BiP-AMP = 3.3 ± 0.3 min were calculated based on three independent experiments.
-
Figure 8—source data 1
Data from three independent repeats (each performed in triplicates) of the experiment presented in Figure 8E are shown.
The insert on top of each graph shows the absolute fluorescence polarization (FP) signals in arbitrary units (A.U.) of a reference sample containing only free fluorescent substrate peptide, which were used to create normalized FP traces of samples containing BiP + peptide. The initial values (after reference signal subtraction) were set to 100%. The fit to a single phase decay curve (tabulated here) was better than to a two phase model. The fit values from the three experiments were used to calculate the average values for “koff” and the half-lives. Experiment 3 is shown in Figure 8E.
- https://doi.org/10.7554/eLife.12621.020
Figure 9 with 1 supplement
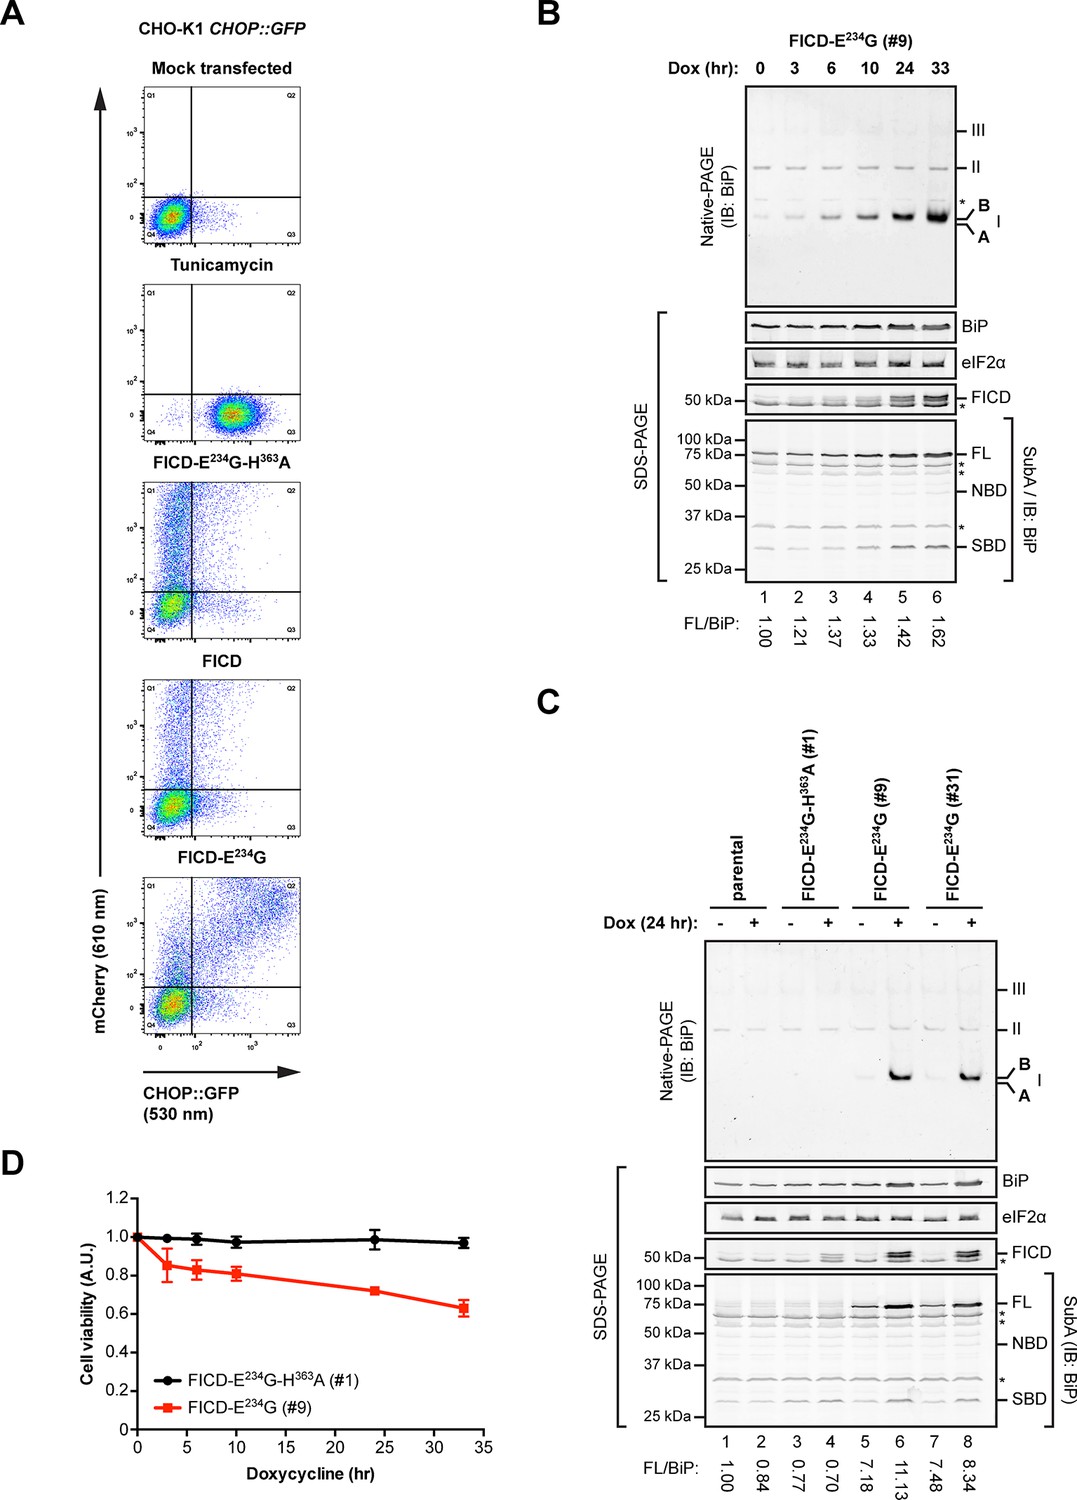
Overexpression of active FICDE234G activates the UPR.
(A) Flow cytometry analysis of CHO-K1 CHOP::GFP UPR reporter cells transiently transfected with plasmids encoding wildtype FICD, the constitutively active FICDE234G or the inactive FICDE234G-H363A mutant alongside an mCherry transfection marker. Mock transfected cells that were treated with the UPR-inducing compound tunicamycin (2.5 µg/ml) for 16 hr before the analysis were included as controls. Note the accumulation of CHOP::GFP-positive (and mCherry-negative) cells in Q3 in the untransfected tunicamycin-treated samples and enhanced UPR reporter activation in cells transfected with plasmid encoding active FICDE234G and a co-expressed mCherry marker (reflected in the large number of double-positive cells in Q2). (B) Native gel immunoblot of endogenous BiP from lysates (supplemented with 1 mM ATP) of Flp-In T-REx 293 cells that carry a stable transgene encoding a doxycycline-inducible form of the active FICDE234G mutant. The cells were treated for the indicated time with doxycycline (Dox) prior to lysis. The major species visible on the native gel are numbered by order of descending mobility (I-III) and the monomeric ‘B’ and ‘A’ forms are marked. Immunoblots of the same samples resolved by SDS-PAGE report on FICDE234G expression, total BiP loaded and on eIF2α as a loading control. In addition, samples of the lysates were treated with SubA (30 ng/µl) for 10 min at room temperature before separation of proteins by SDS-PAGE and immunoblotting. Full-length BiP (FL), the nucleotide binding domain (NBD) and the substrate binding domain (SBD) are indicated. The ratios between the quantified signals of full-length BiP and total BiP (following cleavage by SubA) were normalized to the value observed in lane 1 (arbitrarily to 1) and are indicated below. The asterisks mark bands of unknown identity. Note the correlation between FICDE234G expression, the appearance of the monomeric ‘B’ form of BiP on the native gel as well as the increasing resistance of BiP towards cleavage by SubA. (C) Analysis of Flp-In T-REx 293 cells upon doxycycline-induced expression of inactive FICDE234G-H363A or active FICDE234G as in “B” above. (D) Proliferation assay with Flp-In T-REx 293 cells upon doxycycline-induced expression of inactive FICDE234G-H363A or active FICDE234G for the indicated times. Shown are mean values ± SD relative to uninduced cells (set to 1) of three independent experiments (n = 3).
Figure 9—figure supplement 1
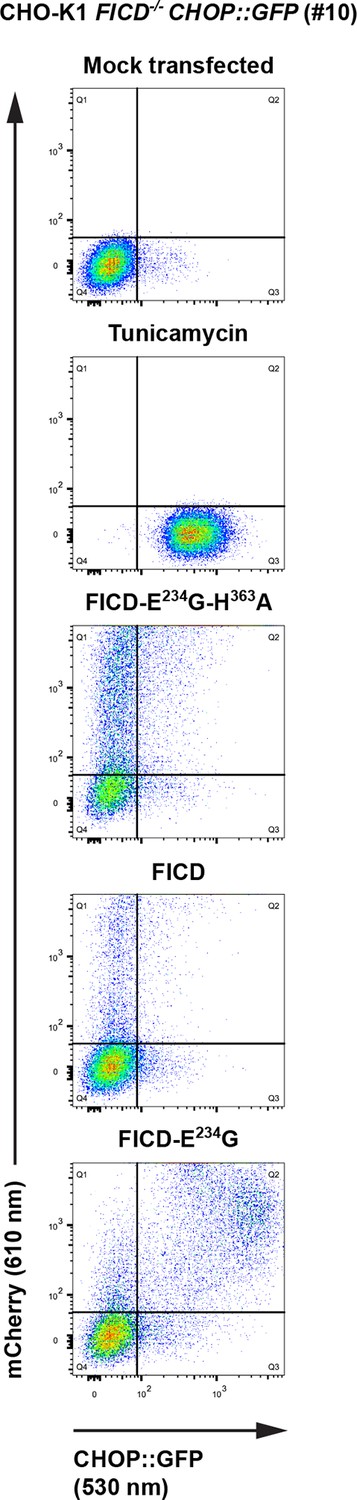
Overexpression of active FICDE234G induces UPR in FICD-/- cells.
Flow cytometry analysis of CHO-K1 FICD-/- CHOP::GFP UPR reporter cells transiently transfected with plasmids encoding wildtype FICD, the constitutively active FICDE234G or the inactive FICDE234G-H363A mutant as in Figure 9A.
Figure 10 with 2 supplements
Over-chaperoning in FICD-deficient cells delays UPR signaling.
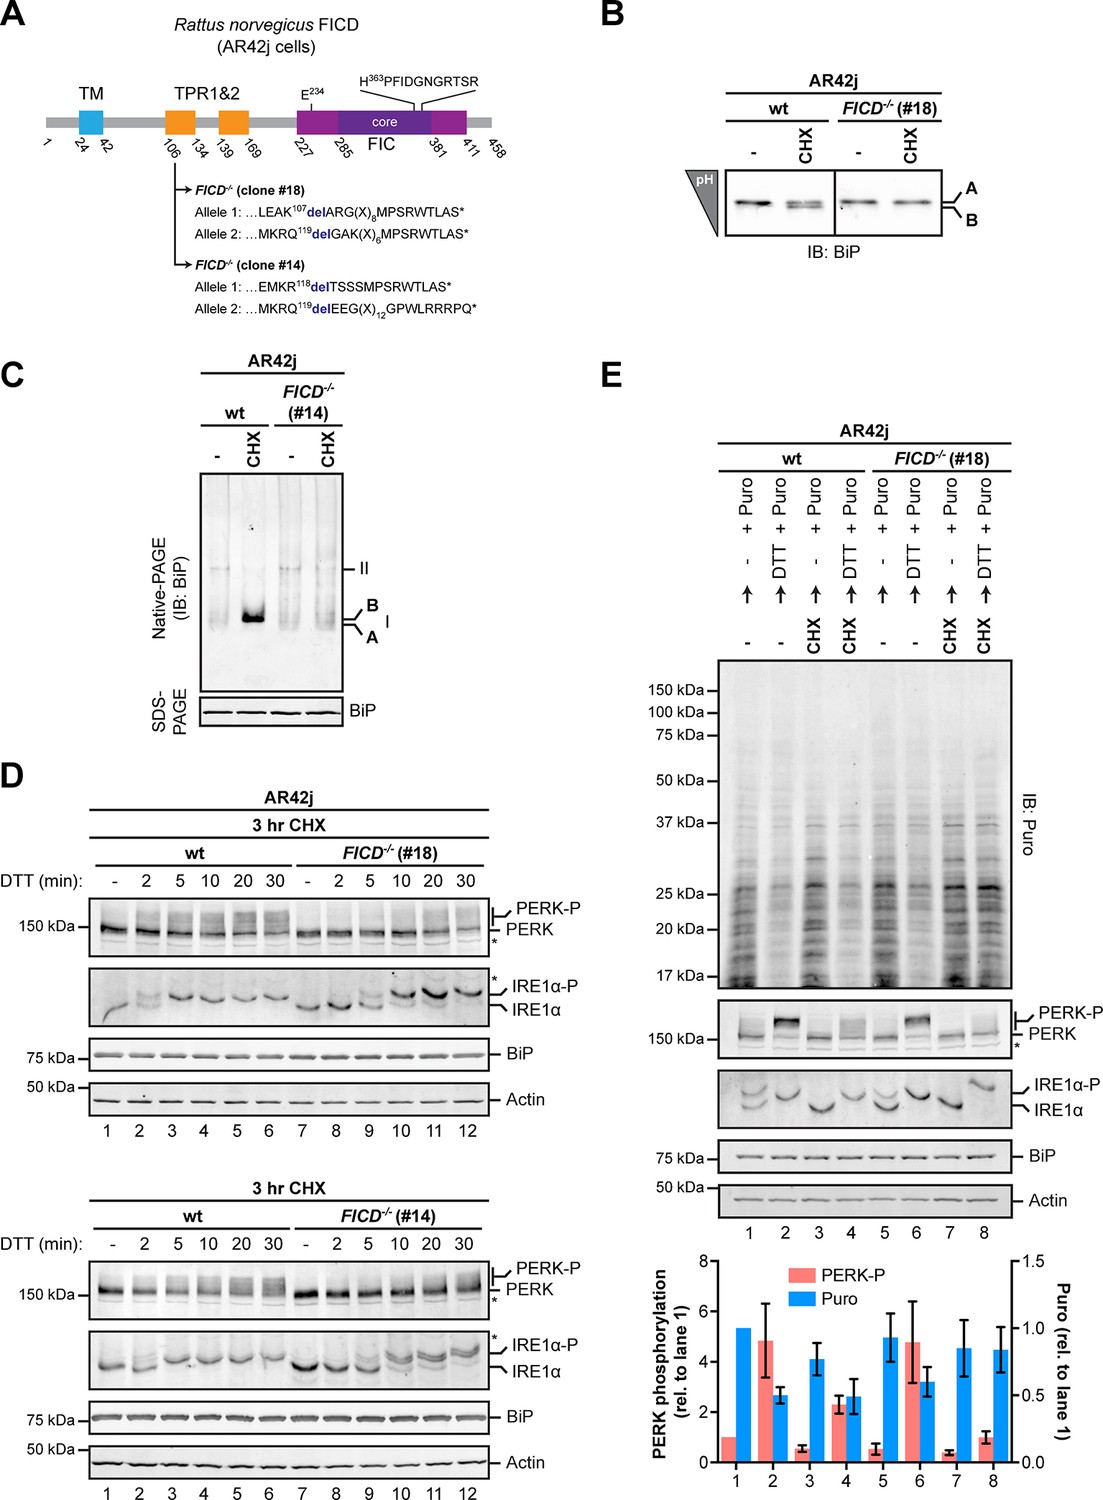
(A) Schematic illustration of the rat FICD protein. Protein domains are highlighted and the mutations introduced by CRISPR-Cas9-mediated genome editing are presented as in Figure 2A. (B) Isoelectric focusing (IEF) followed by immunoblot of endogenous BiP from wildtype (wt) and FICD-/- AR42j cell lysates. (C) Native gel immunoblots of endogenous BiP from ATP-depleted wildtype and FICD-/-AR42j cell lysates (D) Endogenous PERK, IRE1α, BiP and actin immunoblots of an SDS-PAGE gel on which lysates of wildtype and FICD-/- AR42j cells were resolved. The cells were pre-exposed to cycloheximide (CHX, 100 µg/ml) for 3 hr followed by treatment with 1 mM DTT for the indicated times. Slower migrating phosphorylated PERK is marked (PERK-P). To detect phosphorylated IRE1α (IRE1α-P) samples of the same lysates were resolved on a Phos-tag gel. Actin served as a loading control. Asterisks mark bands of unknown identity. Note the delayed phosphorylation (activation) of PERK and IRE1α in the two FICD-/- clones. The experiment was performed four times with comparable results. (E) Immunoblots of puromycinylated proteins, PERK, IRE1α, BiP and actin from wildtype and FICD-/- AR42j cells. Where indicated, the cells were pre-treated with CHX (100 µg/ml) for 3 hr followed by washout and exposure to puromycin (Puro, 10 µg/ml) in presence or absence of the reducing agent DTT (1 mM) for 30 min. Puromycin incorporation into nascent chains (reporting on protein synthesis rates), and PERK-P signals expressed relative to lane 1 (arbitrarily set to 1) are plotted in the bar graph below (mean values ± SD of three independent experiments, n = 3). The asterisk indicates a band of unknown identity. Note persistent protein synthesis in FICD-/- cells that were exposed to DTT after CHX pre-treatment (lane 8). Also note the lower basal levels of phosphorylated forms of IRE1α and PERK in untreated FICD-/- cells.
-
Figure 10—source data 1
Data from three independent repeats used for quantification shown in the graph in Figure 10E.
- https://doi.org/10.7554/eLife.12621.024
-
Figure 10—source data 2
Source file of the flow cytometry data used to generate the plot in Figure 10—figure supplement 2D.
- https://doi.org/10.7554/eLife.12621.025
Figure 10—figure supplement 1
Undetectable FICD protein in AR42j FICD-/- cell lysates.
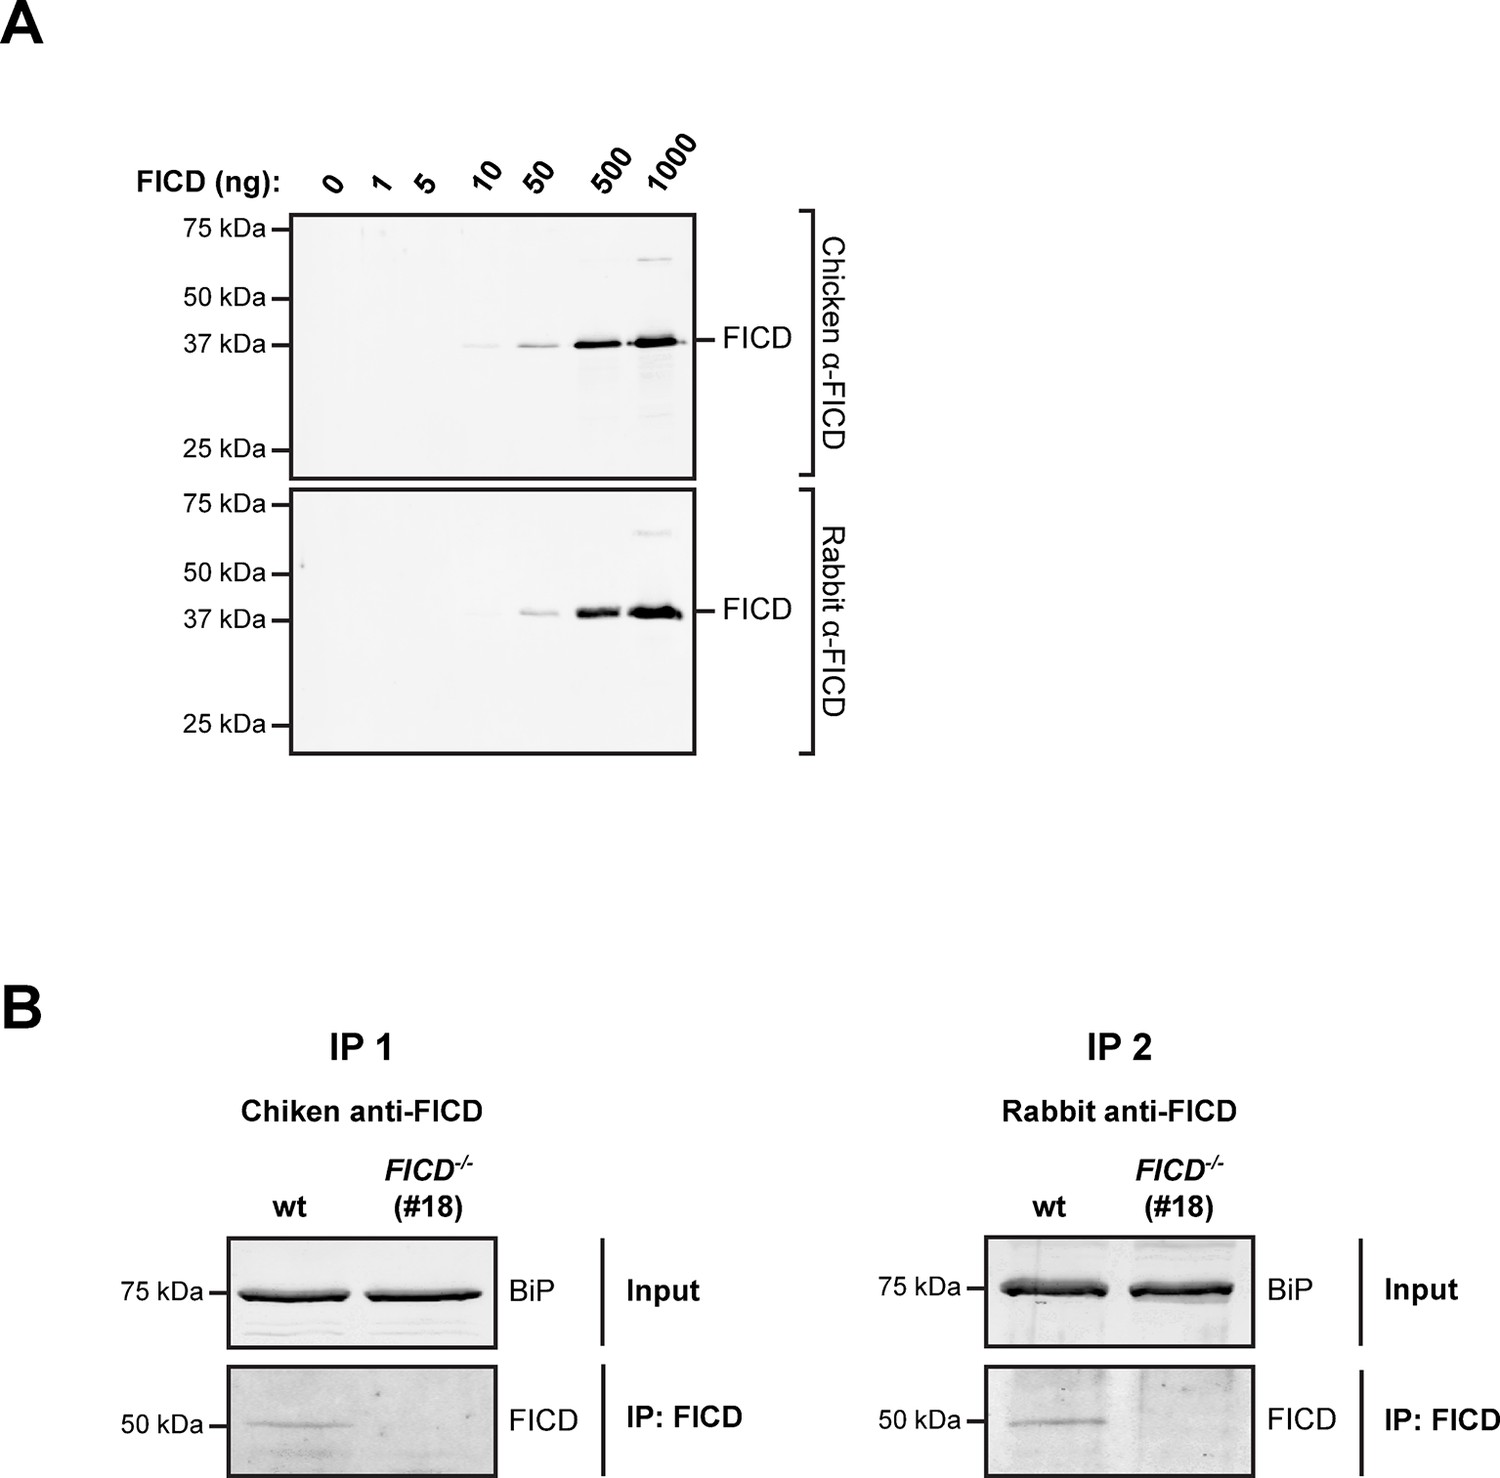
(A) Immunoblot analysis of the sensitivity of anti-FICD antibodies. Indicated amounts of purified bacterially-expressed mouse FICD104-458 were applied to SDS-PAGE gels followed by immunoblotting with chicken anti-FICD antibodies (1:1000) and commercial rabbit anti-FICD antibodies (1:1000). Note: the detection limit of 10 ng antigen and our inability to detect FICD by direct immunoblot of lysate of ~5 µL packed cell volume, imply a concentration in the ER of less than 1 µM. (B) FICD from lysates of wildtype (wt) and FICD-/- AR42j cells was immunopurified with chicken anti-FICD antibodies (IP 1) or rabbit anti-FICD antibodies (IP 2). The recovered proteins were resolved on SDS-PAGE gels and FICD was detected by immunoblotting with rabbit anti-FICD antibodies (IP 1) or with chicken anti-FICD antibodies (IP 2). Note that no FICD signal was detected in the samples from FICD-/- cell lysates.
Figure 10—figure supplement 2
Absence of FICD does not measurably affect the induction kinetics of the transcriptional response to unfolded protein stress.
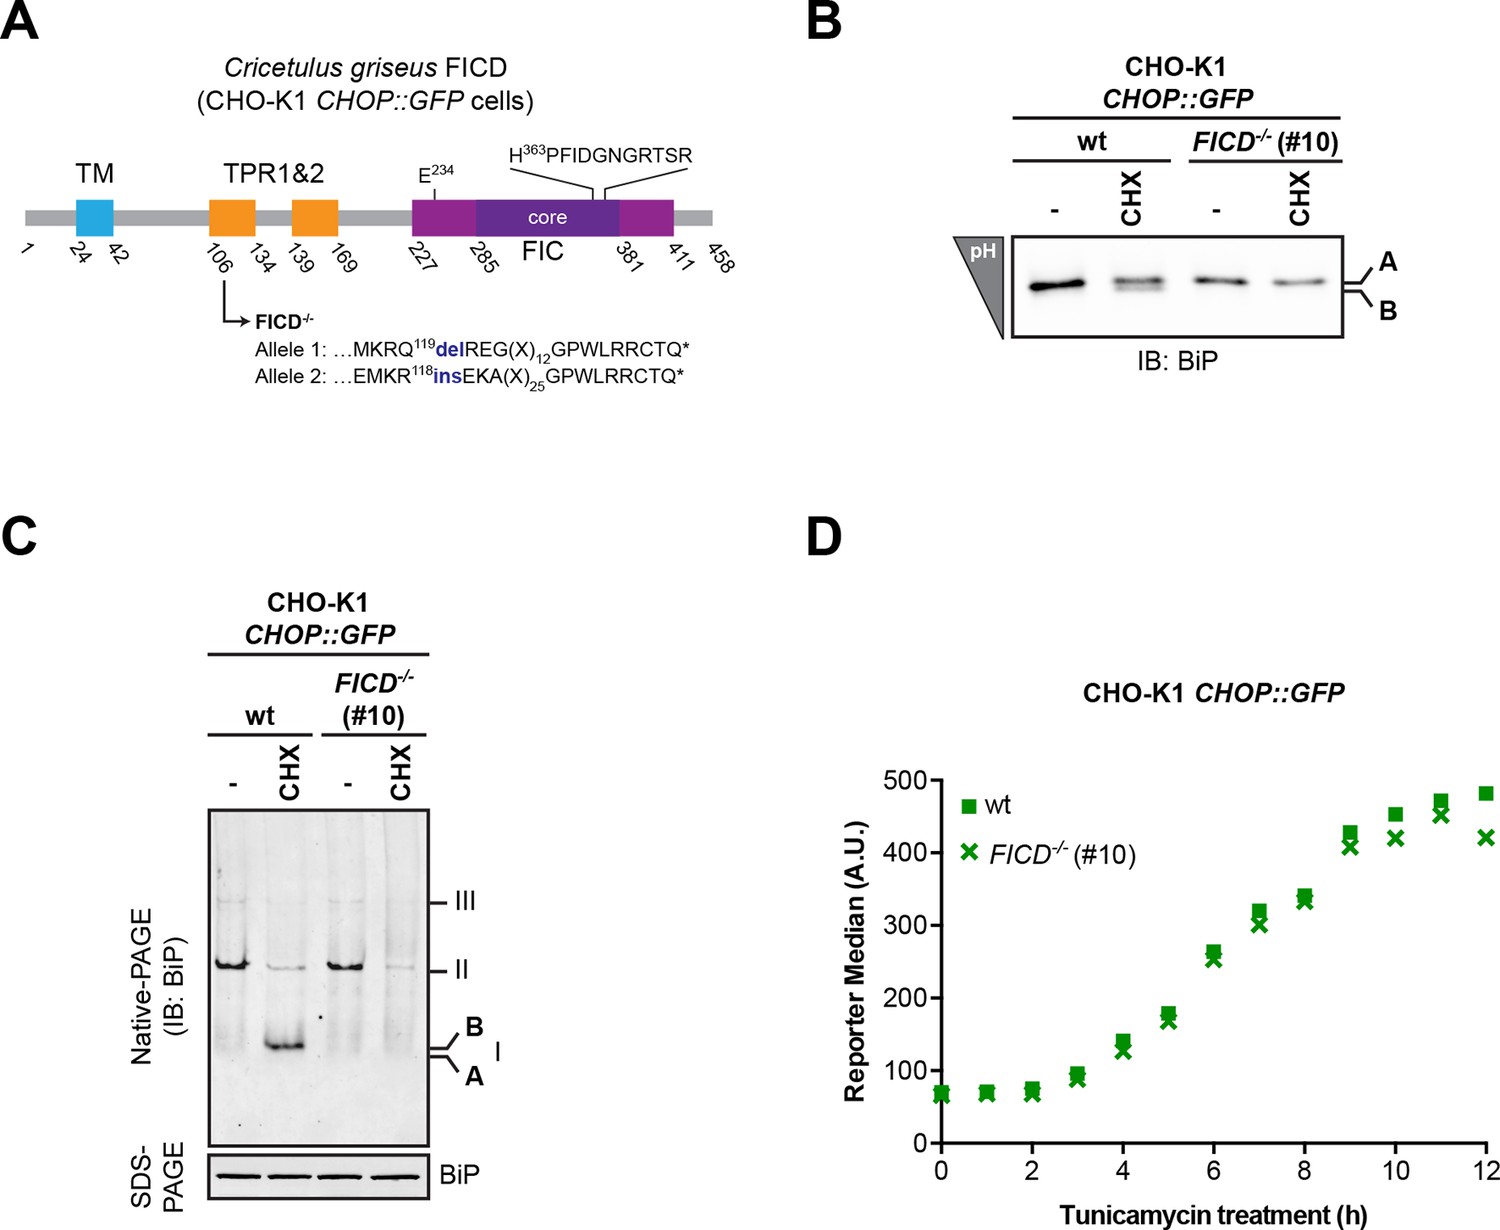
(A) Schematic illustration of the hamster FICD protein. Protein domains are highlighted and the mutations introduced by CRISPR-Cas9-mediated genome editing into CHO-K1 CHOP::GFP UPR reporter cell line are presented (as in Figure 2A). (B–C) Confirmation of the mutant phenotype by isoelectric focusing (IEF) and native gel electrophoresis followed by immunodetection of endogenous BiP (as in Figure 2B-C). (D) Flow cytometry analysis of the CHOP::GFP UPR reporter gene activity in wildtype and CHO-K1 FICD-/- CHOP::GFP UPR reporter cells upon exposure to tunicamycin (2.5 µg/ml) for the indicated time.
Figure 11
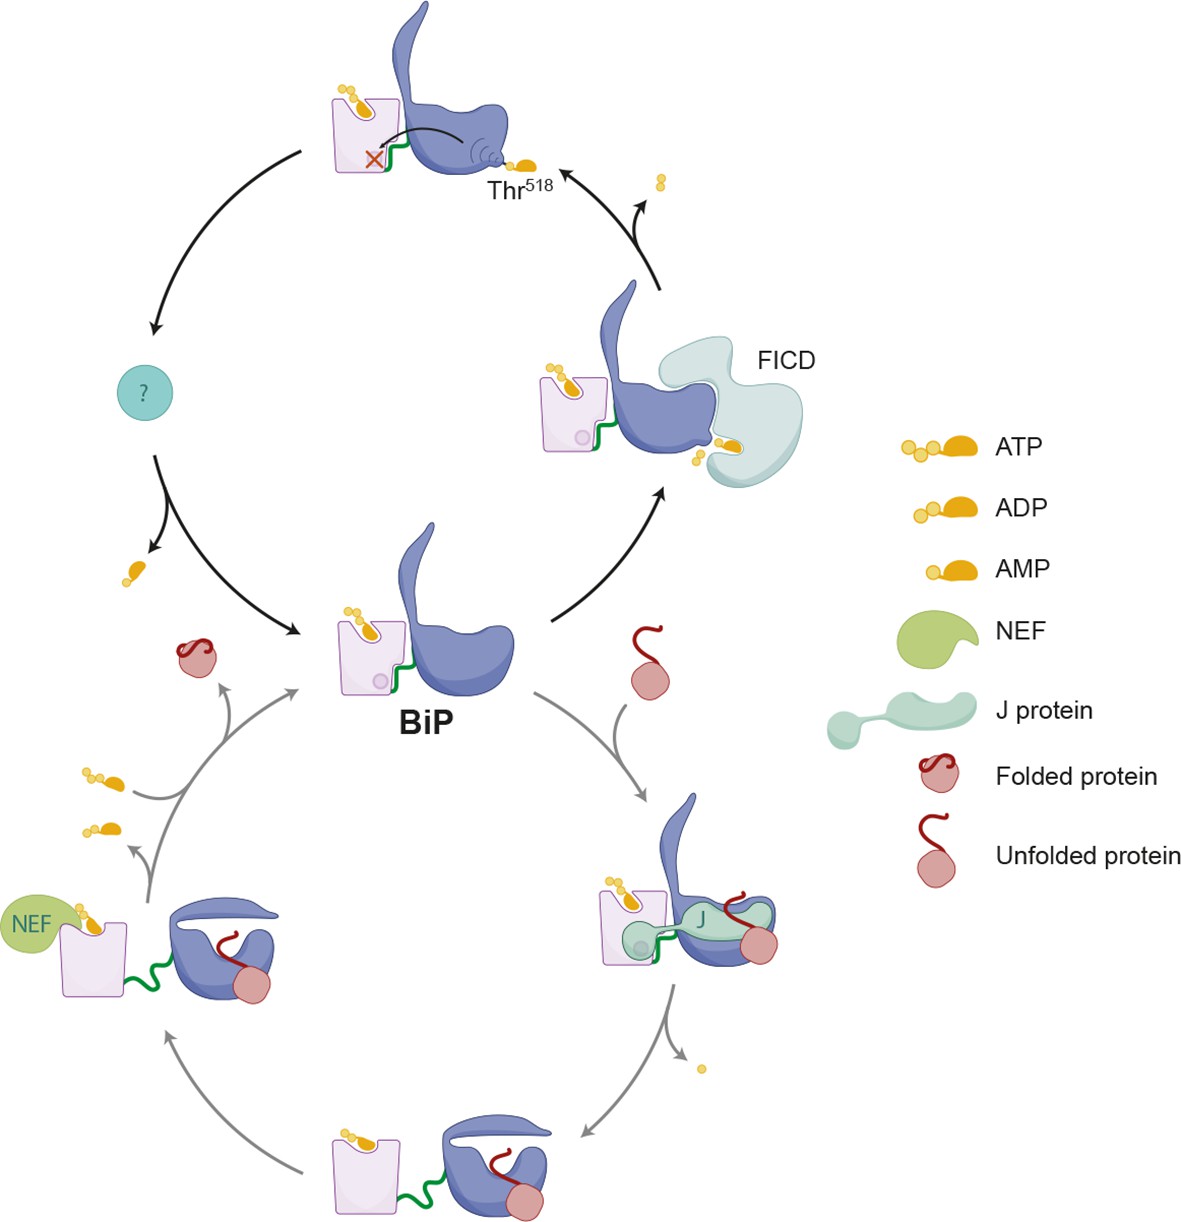
Schema depicting the hypothesized relationship between AMPylation and the BiP chaperone cycle.
FICD-mediated AMPylation on Thr518 allosterically traps BiP in a low substrate-affinity ATP-like state that is refractory to J protein-mediated stimulation of its ATPase activity. Removal of the modification by a phosphodiesterase allows BiP to re-join the chaperone cycle (depicted in the lower portion of the cartoon).
Additional files
-
Supplementary File 1
List of plasmids used.
- https://doi.org/10.7554/eLife.12621.029
Download links
A two-part list of links to download the article, or parts of the article, in various formats.
Downloads (link to download the article as PDF)
Open citations (links to open the citations from this article in various online reference manager services)
Cite this article (links to download the citations from this article in formats compatible with various reference manager tools)
AMPylation matches BiP activity to client protein load in the endoplasmic reticulum
eLife 4:e12621.
https://doi.org/10.7554/eLife.12621


