Systematic substrate identification indicates a central role for the metalloprotease ADAM10 in axon targeting and synapse function
- Technische Universität München, Germany
- Deutsches Zentrum für Neurodegenerative Erkrankungen, Germany
- Ludwig-Maximilians-Universität München, Germany
- Uniklinik RWTH Aachen, Germany
- Christian-Albrechts Universität zu Kiel, Germany
- Karlsruhe Institute of Technology, Germany
- Helmholtz Zentrum München, Germany
- Leibniz Institute for Neurobiology, Germany
- Heidelberg University, Germany
- Zentrum für Molekulare Neurobiologie, Germany
- Munich Cluster for Systems Neurology, Germany
Figures
Figure 1
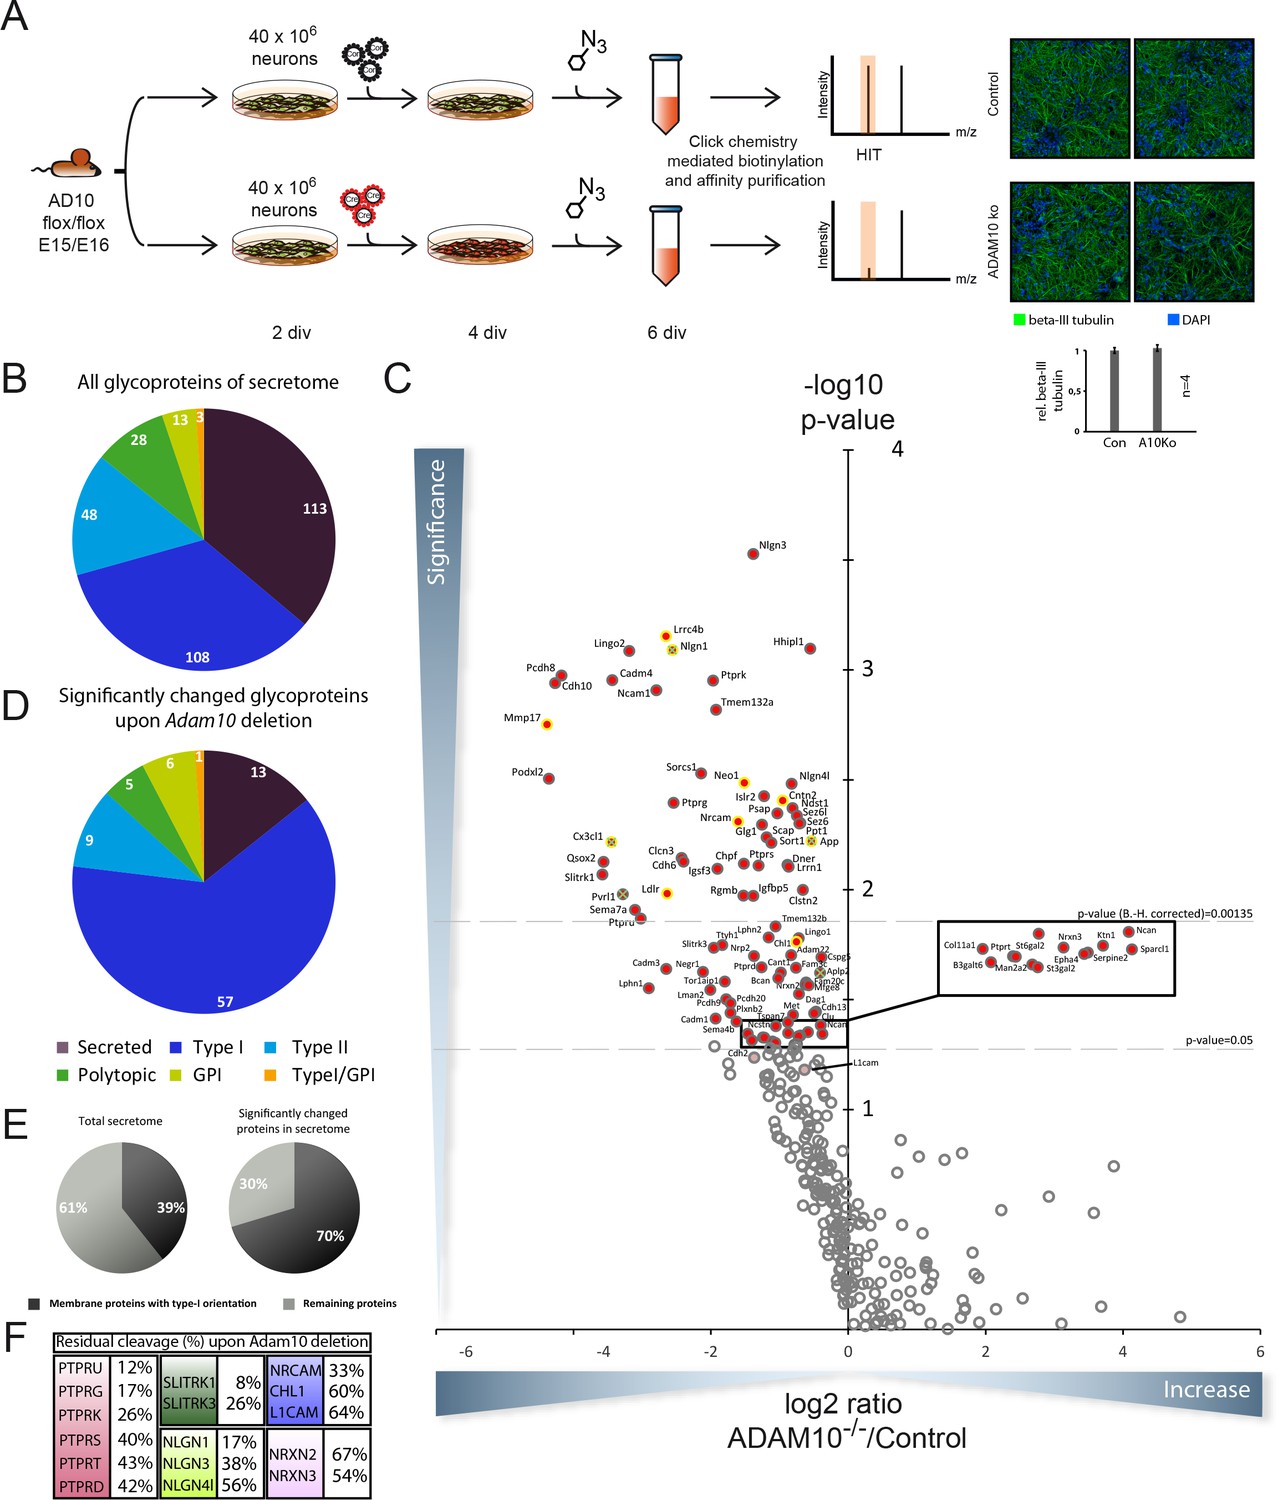
Identification of candidate ADAM10 substrates in conditional ADAM10-/- neurons.
(A) Workflow for the identification of ADAM10 substrates in the secretome of primary cortical neurons comprising plating of neurons, lentiviral transduction, metabolic glycan labeling, purification and protein identification and quantification via mass spectrometry. Staining of primary cortical neurons for the neuron specific marker beta III tubulin and the nuclear stain DAPI followed by quantification of beta III tubulin staining supports that neuronal differentiation was unaffected by deletion of ADAM10. (B) Topology of all glycoproteins in the secretome. (C) Volcano plot of the quantitative comparison between the secretomes of wild type (wt) and Adam10 knockout neurons of all in at least 4 out of 5 experiments identified glycoproteins in the secretome of Adam10-/- and wt neurons. The p-value is depicted as negative decadic logarithm while the fold-change (Adam10-/-/wt) is depicted as log2 value. Significantly changed protein: p≤0,05 (-log10≥1,3). Substrates that are significantly reduced are marked red. Proteins which were validated with immunoblot have a yellow ring. Proteins which have been formerly described in literature as ADAM10 substrates are marked with a green cross. Hits whose p-values survived correction for multiple hypothesis testing yielded a p-value of at least 0.00135 as new significance niveau. (D) Topology of all significantly changed proteins in the secretome between Adam10-/- and wt neurons. (E) Percentage of all membrane proteins with type-I topology in the total secretome and among the significantly changed proteins upon Adam10 knockout. (F) Remaining shedding after Adam10 deletion in percent for members of selected protein families like the Neurexin (NRXN), Neuroligin (NLGN), receptor tyrosine phosphatase (PTPR), Slit and receptor tyrosine kinase domain (SLITRK) and the L1 family.
Figure 2
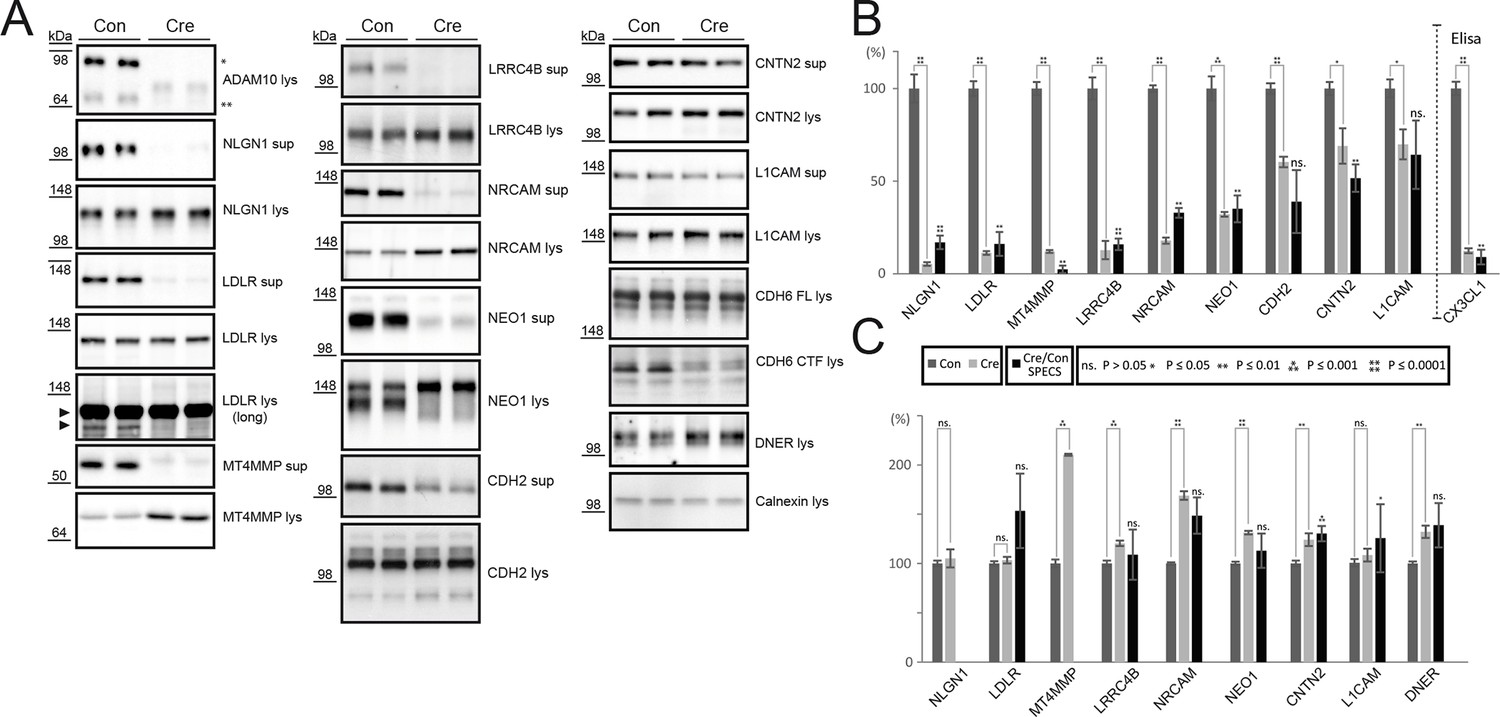
Validation of ADAM10 substrates by immunoblot or ELISA.
(A) Western blots of supernatants (sup, conditioned for 48 hrs) and cell lysates (lys) of neurons expressing endogenous levels of ADAM10 (Con) or no active ADAM10 upon Cre-induced (Cre) ADAM10 knockout. ADAM10 blot shows absent expression of ADAM10 in Cre-transduced neurons. Immunoblots are representative examples from n = 6 experiments. (B) Quantification of all biological replicates of representative Western blots in A and comparison to the quantified relative intensity values of remaining shedding in the SPECS experiment: Depicted is the mean of substrate ectodomain levels detected by immunblots of the supernatant under control (CON) and Adam10 knockout condition by Cre infection (Cre) and the corresponding standard error of the mean (SEM) of 6 biological replicates and p-value calculated with a two-tailed, unpaired t-test. Additionally, we depicted the quantified reduction of ectodomain shedding including SEM and p-value of the SPECS experiment. For CX3CL1 a sandwich ELISA was used to quantify the shedding products in the supernatant. (C) Quantification of the mean change in the cell lysate upon ADAM10 deletion of 6 biological replicates including the standard error of the mean and comparison to the SPECS quantified changes in the cellular glycoproteome of 5 biological replicates. For proteins that were also detected in the proteomic analysis of the cellular membrane proteins (Figure 3), the proteomic (SPECS) data are also indicated in the graph.
Figure 3
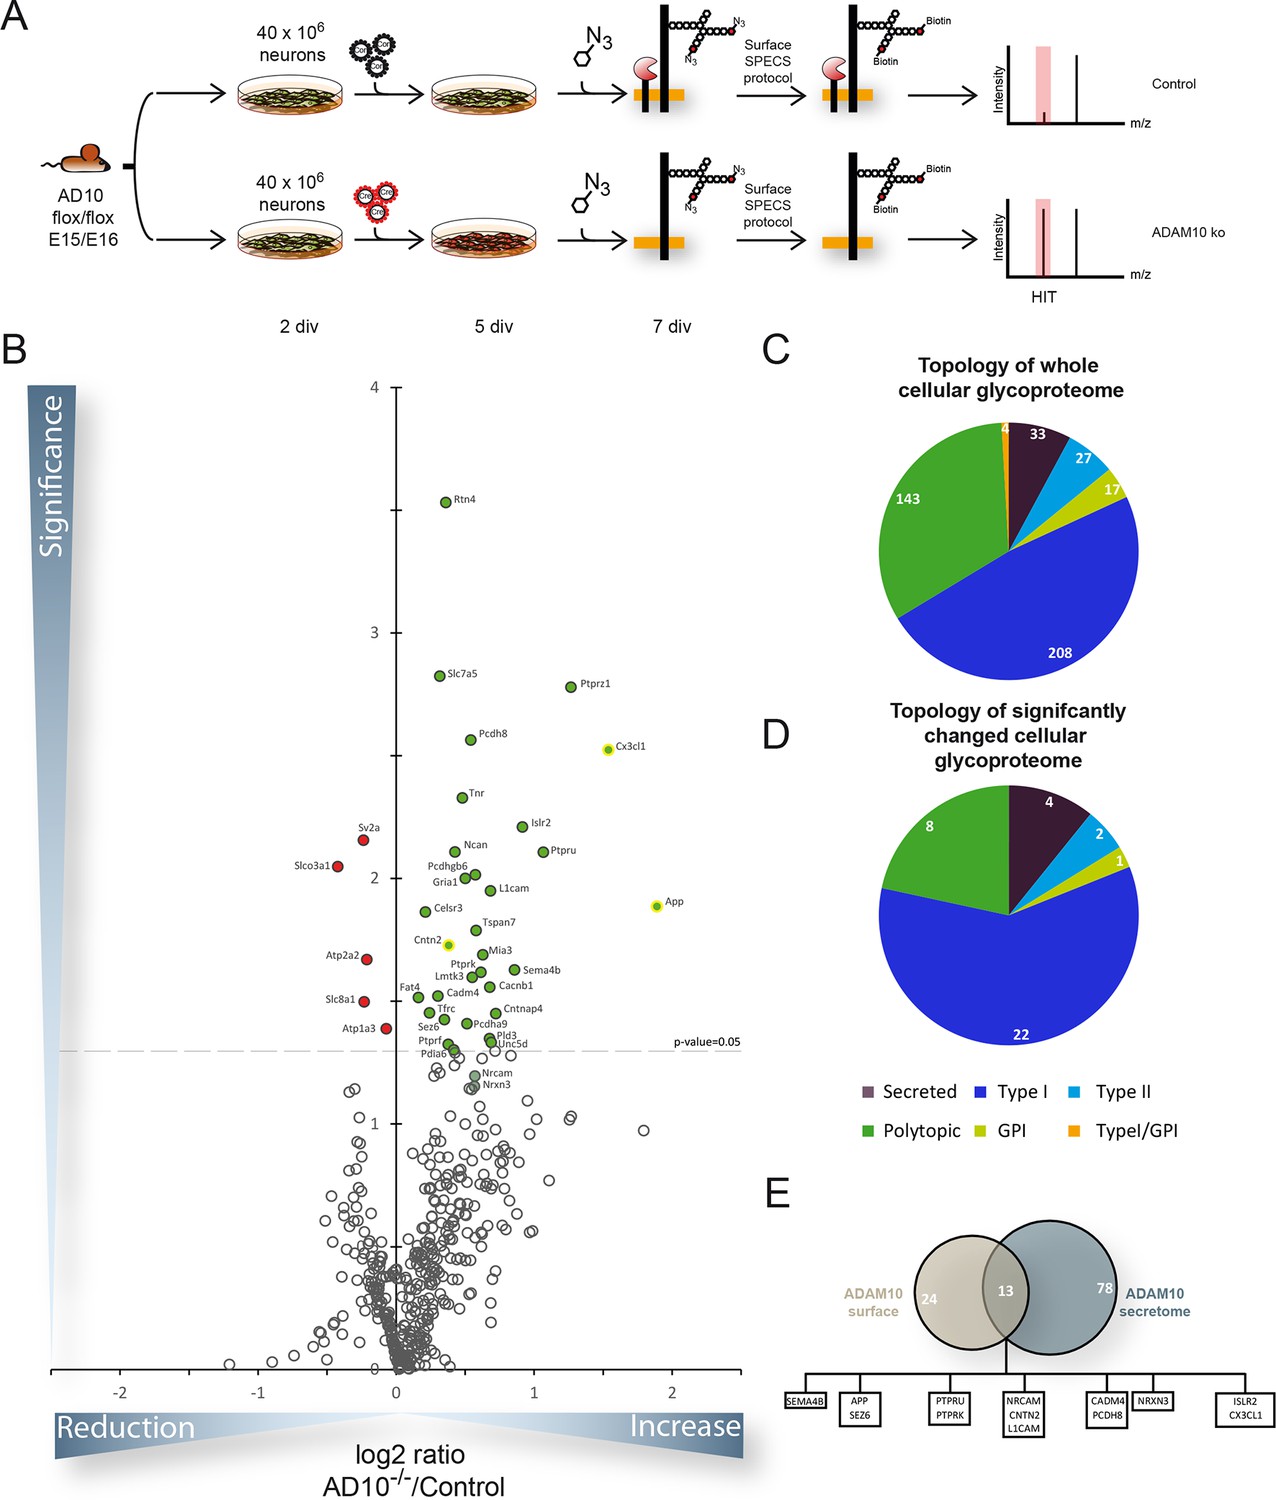
Quantitative analysis of glycoproteins in the neuronal cell lysate of conditional Adam10-/- neurons.
(A) Workflow for the identification of alterations in the cellular glycoproteome upon Adam10 deletion in primary cortical neurons comprising plating, lentiviral infection, metabolic glycan labeling, biotinylation of glycoproteins on intact neurons and affinity purification protocol and finally measurement via mass spectrometry. (B) Volcano plot of the quantitative comparison between the cellular glycoproteomes of wild type (wt) and Adam10 knockout neurons of all glycoproteins identified in 4 out of 4 experiments in the cellular glycoproteome of Adam10-/- and wt neurons. The p-value is depicted as negative decadic logarithm while the fold-change (Adam10-/-/wt) is depicted as log2 value. Significantly changed protein: p≤0.05 (-log10≥1.3). Additionally, we corrected for multiple hypothesis testing with Benjamini Hochberg correction which gave a significance cut-off of p≤0.02. Substrates that are significantly reduced are marked red. Proteins which were validated with immunoblot have a yellow ring. (C) Topology of all in four experiments identified glycoproteins in the cellular glycoproteome of Adam10-/- and wildtype neurons. (D) Topology of identified glycoproteins with significantly increased protein levels in Adam10-/- compared to wt neurons. (E) Overlap between proteins significantly reduced in the secretome and proteins significantly increased in the cellular glycoproteome.
Figure 4

Analysis of proteolytic cross talk of ADAM10 and BACE1 for selected substrates.
(A) Representative Western blots of 48 hr conditioned supernatants and cell lysates of ADAM10 fl/fl neurons treated with or without C3 to inhibit BACE1 and infected with a control virus (Con) or Cre recombinase virus (Cre) to delete Adam10. A representative ADAM10 blot shows abolished expression of immature and mature ADAM10. (B) Quantification of the mean reduction in ectodomain shedding in the conditioned medium (sup: supernatant), the respective standard error of the mean (SEM) and the significance of six biological replicates calculated with a two-tailed heteroscedastic t-test. A10: ADAM10. (C) Quantification of the mean increase of selected substrates in the cellular glycoproteome (lys: lysate), the respective standard error of the mean (SEM) and the significance of 6 biological replicates calculated with a two-tailed heteroscedastic t-test. (D) Brain membrane immunoblots from Adam10fl/fl and CamkII-Cre Adam10fl/fl mice which have lost ADAM10 expression in excitatory neurons, but not in other neurons and non-neuronal cells.
Figure 5
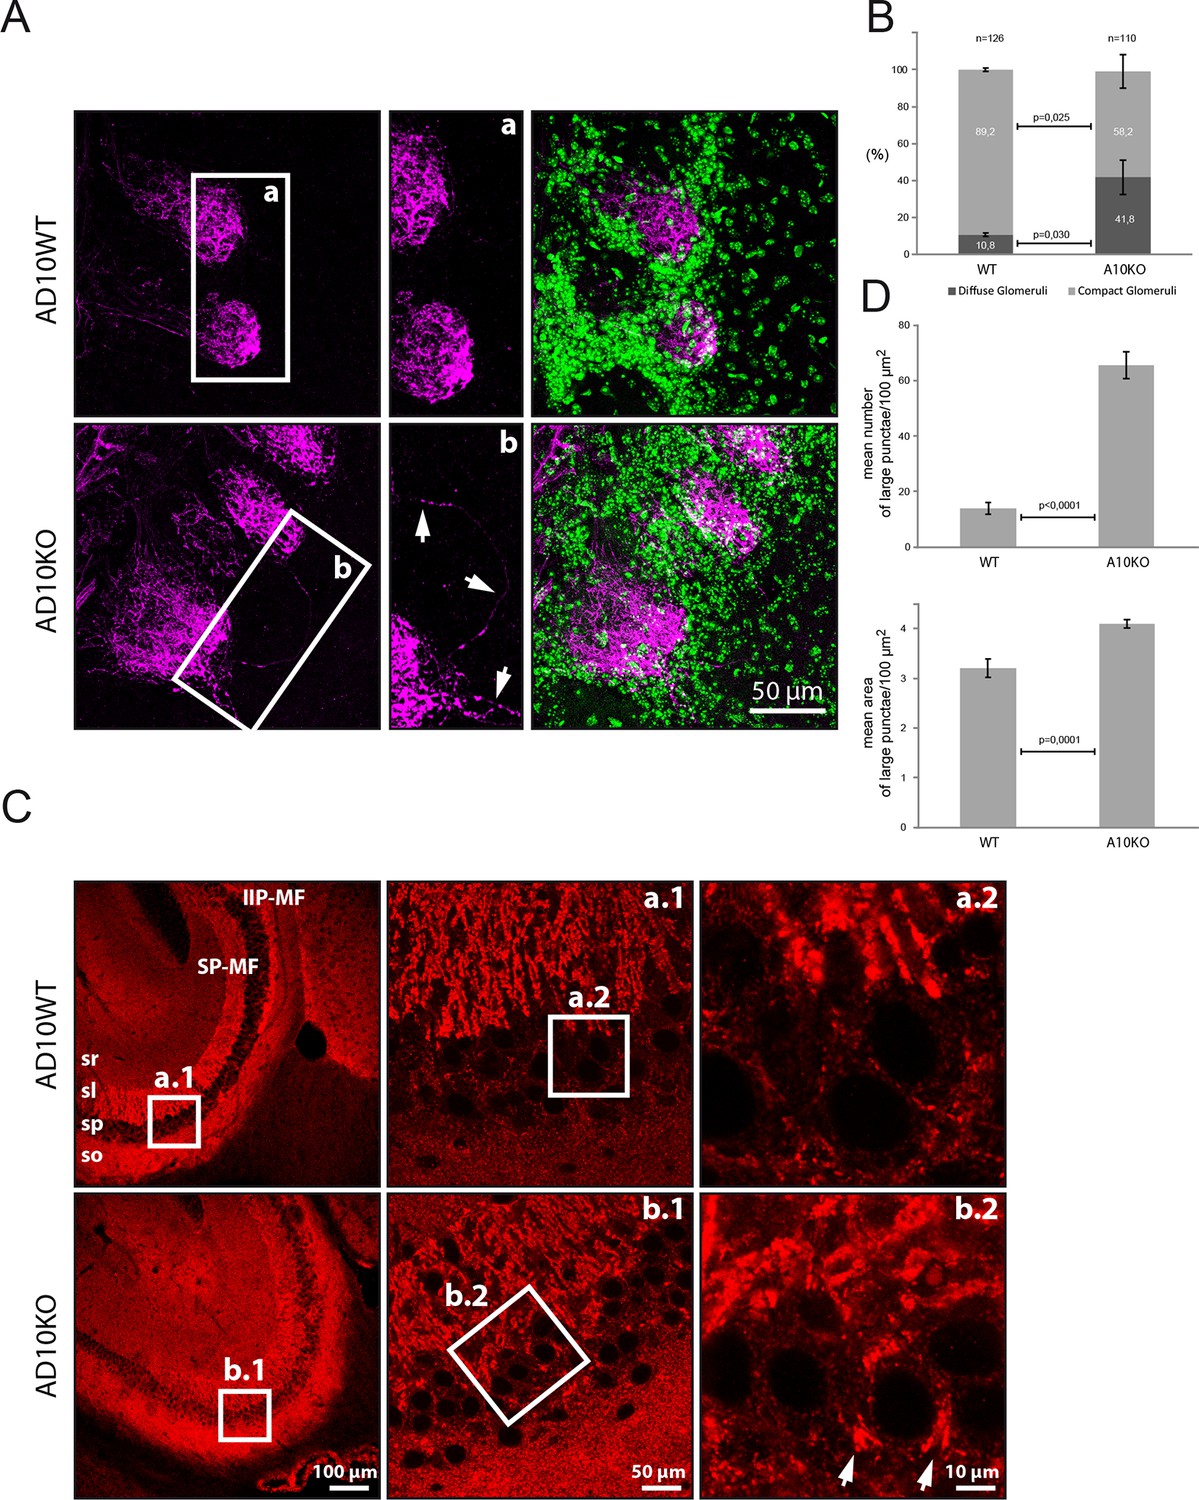
Axon targeting and synaptic alterations in ADAM10 deficient mice
(A) Olfactory nerve axons in adult ADAM10-deficient mice. Confocal microscopy picture of olfactory bulb frontal sections stained for the detection of the olfactory nerve axons labeled with the plant lectin DBA conjugated to biotin (in magenta). Cell nuclei labeled with DAPI appear in green. In wild-type mice (upper panel), olfactory nerve terminals generally project to only one olfactory glomerulus (AD10-fl/fl). In contrast, in ADAM10-deficient mice (AD10-fl/fl+CamkII-Cre) (lower panel), some olfactory axons terminate in two glomeruli or pass through the glomerular layer and terminate in the external plexiform layer. In addition, the arborizations of some olfactory axons extend outside a particular olfactory glomerulus. (B) Quantification of olfactory glomeruli morphology in adult ADAM10-deficient mice. In wild-type mice the majority (~90%) of glomeruli stained with the lectin DBA display a compact defined morphology. In ADAM10-deficient mice (AD10-fl/fl+CamkII-Cre), significantly less glomeruli are compact and many glomeruli appear more diffuse. (C) Mossy fiber organization in adult ADAM10-deficient mice. Sagittal sections stained for the presence of synaptophysin (red). Confocal microscopy showing the distribution of mossy fiber terminals in the CA3 subfield of the hippocampus. In wild-type mice (AD10-fl/fl) (upper panel) the mossy fibers are organized in the infra-inter (IIP-MF) and supra (SP-MF) pyramidal bundles both terminating in large synaptic boutons on pyramidal cell dendrites in the stratum lucidum (sl) of the CA3. CA3 can be clearly distinguished from the stratum pyramidale (sp) containing the pyramidal cell bodies and small synatophysin positive inhibitory synapses. In ADAM10-deficient mice (AD10-fl/fl+CamkII-Cre) (lower panel), mossy fiber terminals are also detected throughout the sp surrounding the pyramidal cell soma. (D) Quantitative comparison of mossy fiber terminals in the stratum lucidum with respect to number and size between adult wild type and ADAM10-deficient mice. Large synaptophysin-labeled puncta indicative for mossy fiber synaptic boutons are significantly more frequent in the stratum lucidum of ADAM10-deficient mice (AD10-fl/fl+CamkII-Cre).
Figure 6
Synaptic alterations in ADAM10 deficient mice are not rescued by APPsα overexpression
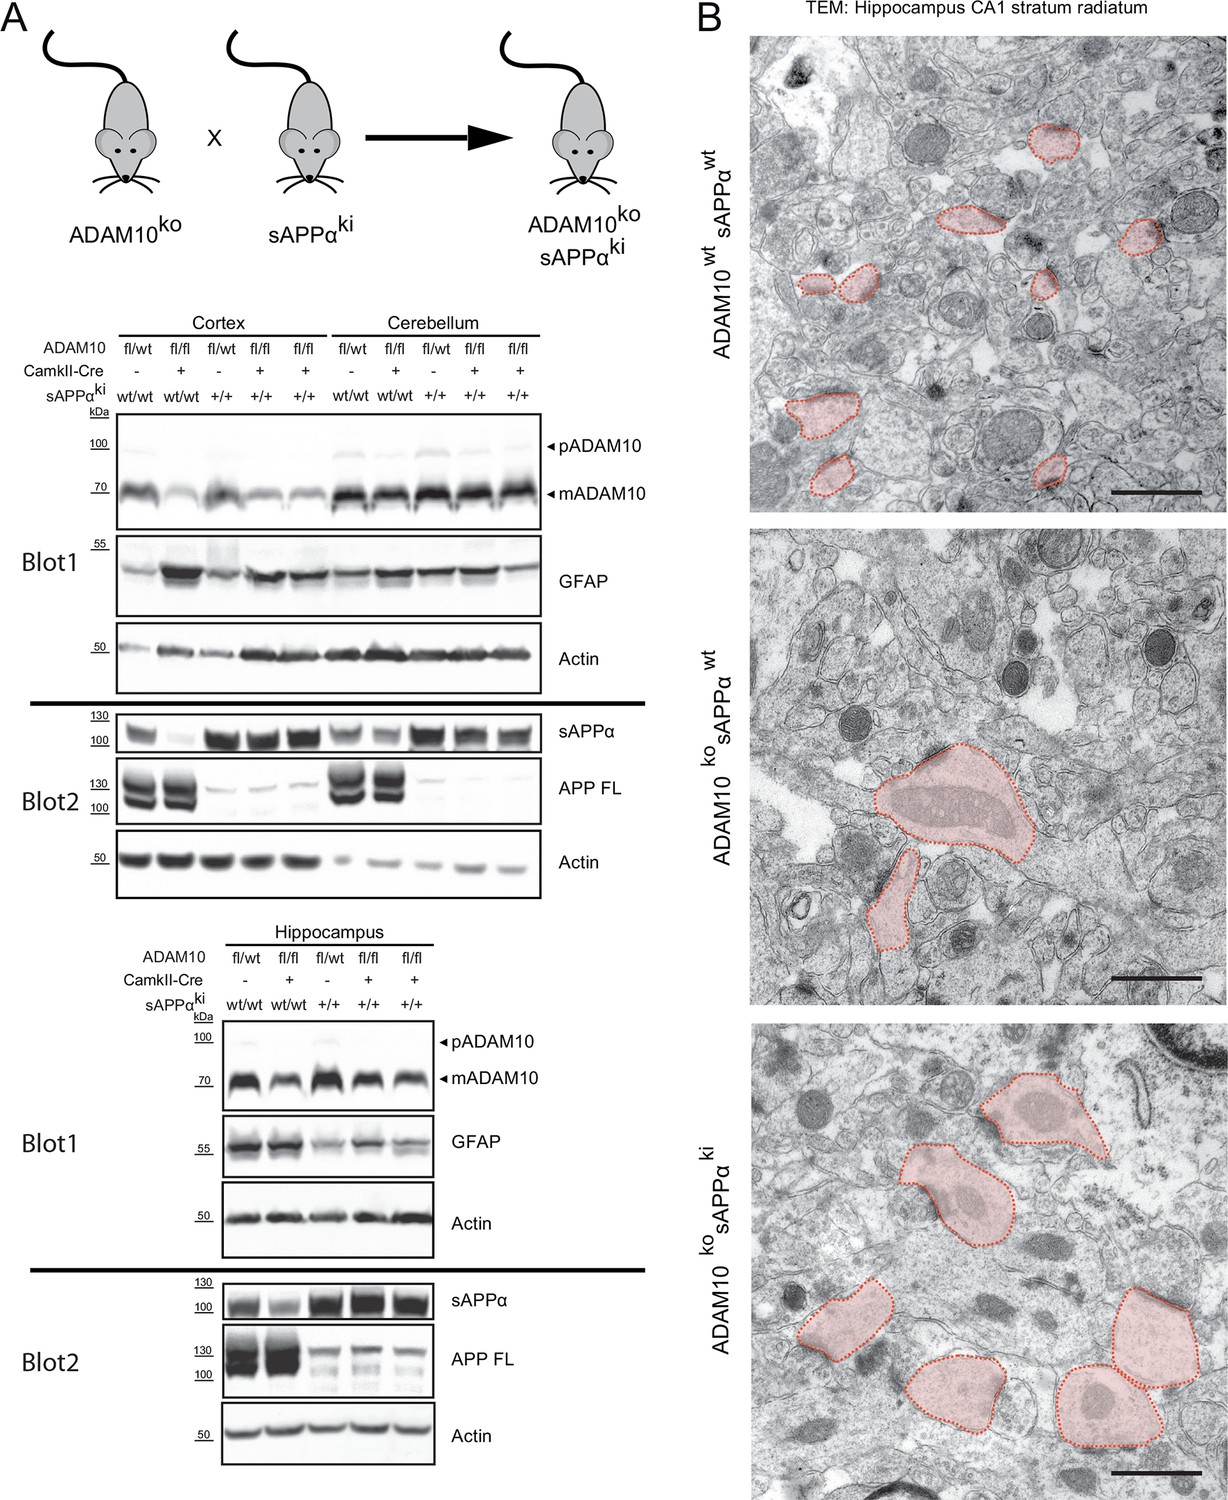
(A) Mice deficient for ADAM10 in adult brain (ADAM10-fl/fl+CamkII-Cre) and transgenic for a sAPPα knockin into the APP locus (ADAM10ko sAPPki) thus expressing only sAPPα, were generated by crossing sAPPα knockin mice (sAPPki) and ADAM10-fl/fl+CamkII-Cre knockout mice (ADAM10ko) for two generations. Immunoblot analysis of extracts from cortex, cerebellum and hippocampus from 21 days old mice revealed that ADAM10-expression was clearly reduced in cortex and hippocampus of conditional ADAM10 knockout mice (A10fl/fl, CamkII-Cre pos.). No reduction of ADAM10 was observed in cerebellum since this tissue was not targeted by the CamkII-Cre driver. The proform (pADAM10: 100 kDa) and the mature form (mADAM10: 70kDa) of ADAM10 are depicted. Expression of sAPPα (105 kDa) was detectable in sAPPα transgenic mice (sAPPki +) but absent in wild type mice. Full length APP (APPfl) (105 kDa) expression was lost in sAPPα knockin mice but is present in wild type mice. As reported (Prox et al., 2013) GFAP (45 kDa) expression in cortex of 21 days old brains was increased in the ADAM10 knockout mice (ADAM10 ko). This pathology was not reversed upon sAPPα expression (sAPPki +), hinting to an ongoing astrogliosis. (B) High resolution electron micrographs of spines in the hippocampal CA1 stratum radiatum from 21 days old mice. Conditional ADAM10 deficiency (ADAM10ko) leads to enlarged and stubby spines (light red shaded). The presence of sAPPα (sAPPki) in ADAM10 knockout mice is not sufficient to rescue the alterations in spine morphology. In wildtype hippocampus spines are characterized as tiny spine heads with no organelles. Scale bars: 1 µm.
Figure 7
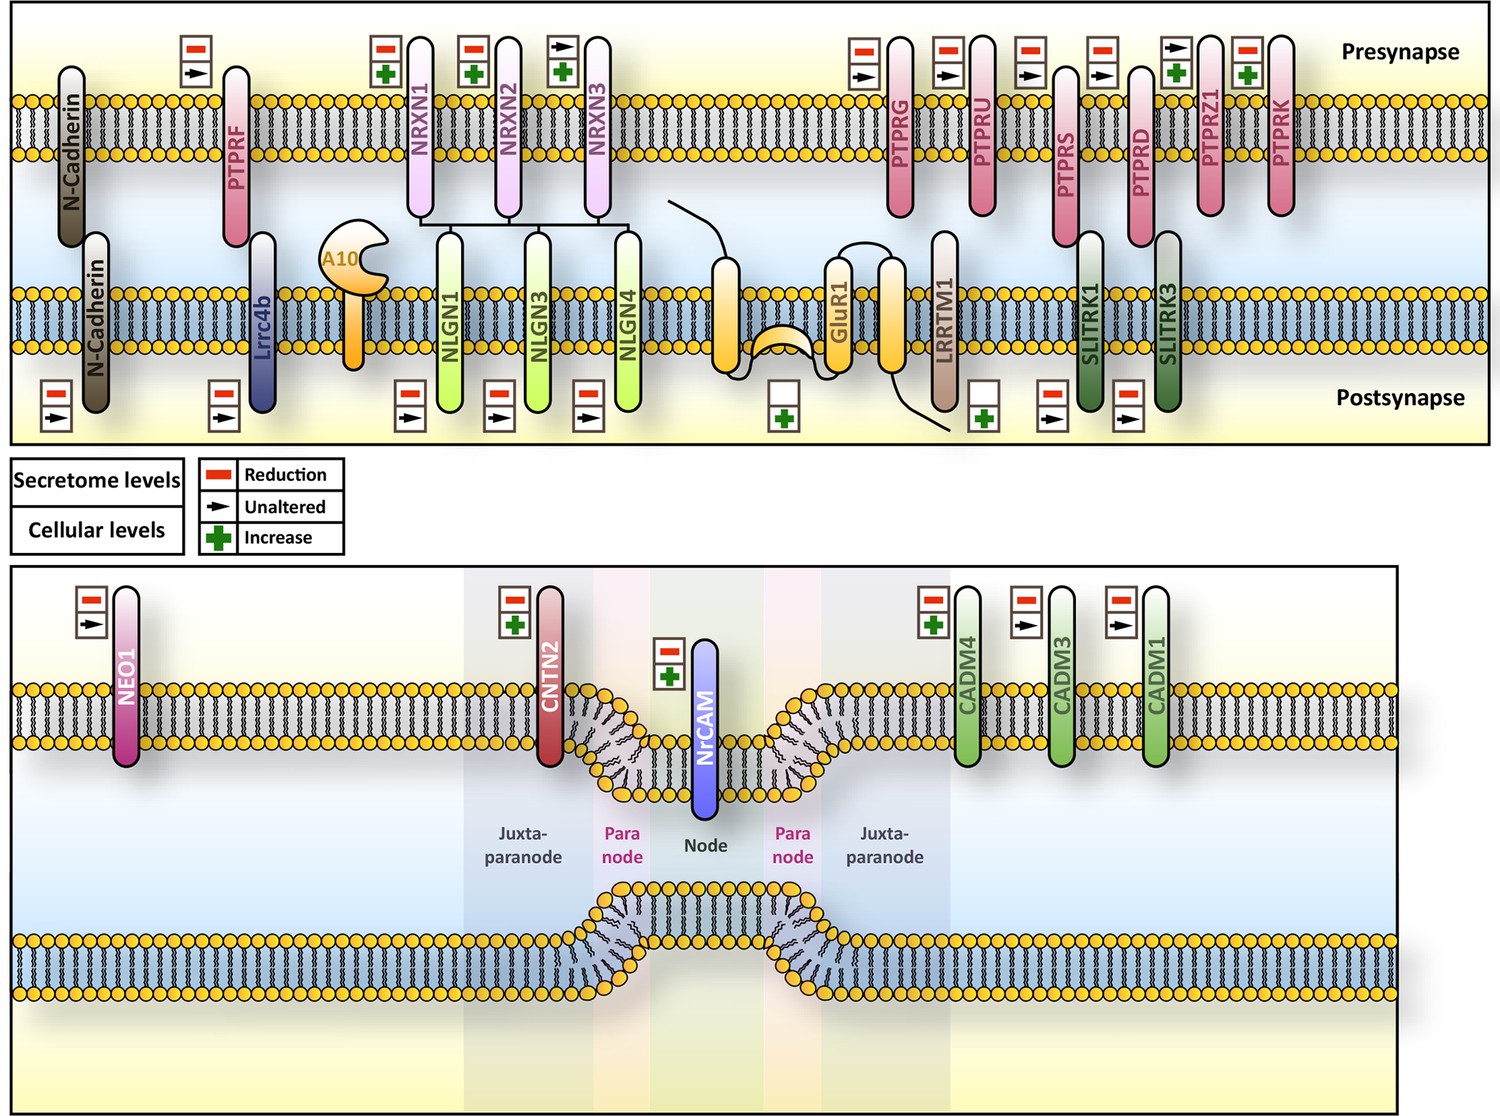
Overview of subcellular localization and interaction partners of ADAM10 substrates.
Overview of the subcellular localization and interaction partners of selected substrates of ADAM10 and their respective behavior in terms of ectodomain shedding and cellular amount upon Adam10 deletion. Upper symbol refers to ectodomain shedding while lower symbol indicates the cellular levels of the protein.
Tables
Table 1
Proteins that are significantly reduced in the secretome upon Cre recombinase induced deletion of ADAM10. The table contains the 42 most reduced proteins upon ADAM10 deletion. Indicated are the names of the proteins, the gene name, number of unique peptides, topology, the mean of the ratio between neurons devoid of ADAM10 and neurons expressing endogenous levels of ADAM10 of 5 biological replicates and the p-value calculated with a two-sided, heteroscedastic t-test based on the intensity ratios for the control and the ADAM10 deletion condition. Protein names of previously published ADAM10 substrates are highlighted in italic bold. (MEAN) Mean value of all 5 biological replicates, (SEM) Standard error of the mean. (Peptides) Number of peptides identified for every protein. Gene symbols of proteins validated with immunoblot are marked bold.
| Protein Name | Gene Symbol | Peptides | Topology | MEAN (A10KO/CON) | TTEST |
|---|---|---|---|---|---|
| Matrix metalloproteinase-17 | Mmp17 | 3 | GPI | 0,05 | 1,77E-03 |
| Podocalyxin-like protein 2 | Podxl2 | 3 | Type-I | 0,05 | 3,13E-03 |
| Cadherin-10 | Cdh10 | 4 | Type-I | 0,05 | 1,15E-03 |
| Protocadherin-8 | Pcdh8 | 16 | Type-I | 0,06 | 1,06E-03 |
| SLIT and NTRK-like protein 1 | Slitrk1 | 4 | Type-I | 0,08 | 8,52E-03 |
| Sulfhydryl oxidase 2 | Qsox2 | 3 | Type-I | 0,08 | 7,47E-03 |
| Fractalkine | Cx3cl1 | 2 | Type-I | 0,09 | 6,08E-03 |
| Cell adhesion molecule 4 | Cadm4 | 5 | Type-I | 0,09 | 1,11E-03 |
| Poliovirus receptor-related protein 1 | Pvrl1 | 3 | Type-I | 0,10 | 1,05E-02 |
| Leucine-rich repeat and immunoglobulin-like domain-containing nogo | Lingo2 | 2 | Type-I | 0,11 | 8,21E-04 |
| Semaphorin-7A | Sema7a | 8 | GPI | 0,12 | 1,24E-02 |
| Receptor-type tyrosine-protein phosphatase U | Ptpru | 6 | Type-I | 0,12 | 1,35E-02 |
| Latrophilin-1 | Lphn1 | 7 | Type-I | 0,13 | 2,81E-02 |
| Neural cell adhesion molecule 1 | Ncam1 | 16 | Type-I/GPI | 0,14 | 1,24E-03 |
| Leucine-rich repeat-containing protein 4B | Lrrc4b | 16 | Type-I | 0,16 | 7,03E-04 |
| Cell adhesion molecule 3 | Cadm3 | 5 | Type-I | 0,16 | 2,30E-02 |
| Low-density lipoprotein receptor | Ldlr | 13 | Type-I | 0,16 | 1,04E-02 |
| Neuroligin-1 | Nlgn1 | 5 | Type-I | 0,17 | 8,12E-04 |
| Receptor-type tyrosine-protein phosphatase gamma | Ptprg | 4 | Type-I | 0,17 | 4,03E-03 |
| H(+)/Cl(-) exchange transporter 3 | Clcn3 | 2 | Polytopic | 0,19 | 7,17E-03 |
| Cadherin-6 | Cdh6 | 5 | Type-I | 0,19 | 7,46E-03 |
| VPS10 domain-containing receptor SorCS1 | Sorcs1 | 3 | Type-I | 0,23 | 2,96E-03 |
| Neuronal growth regulator 1 | Negr1 | 3 | GPI | 0,23 | 2,37E-02 |
| Vesicular integral-membrane protein VIP36 | Lman2 | 3 | Type-I | 0,25 | 2,86E-02 |
| Receptor-type tyrosine-protein phosphatase kappa | Ptprk | 12 | Type-I | 0,26 | 1,12E-03 |
| SLIT and NTRK-like protein 3 | Slitrk3 | 3 | Type-I | 0,26 | 1,84E-02 |
| Cell adhesion molecule 1 | Cadm1 | 6 | Type-I | 0,26 | 3,85E-02 |
| Transmembrane protein 132A | Tmem132a | 2 | Type-I | 0,26 | 1,52E-03 |
| Immunoglobulin superfamily member 3 | Igsf3 | 25 | Type-I | 0,27 | 8,04E-03 |
| Protein tweety homolog 1 | Ttyh1 | 5 | Type-I | 0,28 | 1,79E-02 |
| Torsin-1A-interacting protein 1 | Tor1aip1 | 5 | Polytopic | 0,29 | 2,62E-02 |
| Protocadherin 9 | Pcdh9 | 2 | Type-II | 0,29 | 3,15E-02 |
| Protocadherin-20 | Pcdh20 | 2 | Type-I | 0,30 | 3,28E-02 |
| Plexin-B2 | Plxnb2 | 4 | Type-I | 0,30 | 3,64E-02 |
| Semaphorin-4B | Sema4b | 4 | Type-I | 0,32 | 3,98E-02 |
| Neuronal cell adhesion molecule | Nrcam | 4 | Type-I | 0,33 | 4,91E-03 |
| RGM domain family member B | Rgmb | 3 | Type-I | 0,35 | 1,06E-02 |
| Chondroitin sulfate synthase 2 | Chpf | 2 | Type-I | 0,35 | 7,63E-03 |
| Neogenin | Neo1 | 27 | Type-I | 0,35 | 3,27E-03 |
| Collagen alpha-1(XI) chain | Col11a1 | 4 | GPI | 0,36 | 4,53E-02 |
| Beta-1,3-galactosyltransferase 6 | B3galt6 | 2 | Type-II | 0,38 | 4,85E-02 |
| Neuroligin-3 | Nlgn3 | 28 | Type-I | 0,38 | 2,97E-04 |
Table 2
Proteins that are significantly changed in the cellular glycoproteome upon Cre recombinase induced deletion of ADAM10. The table contains all significantly changed proteins upon ADAM10 deletion. Indicated are the names of the proteins, the gene name, number of unique peptides, the mean of the ratio between neurons devoid of ADAM10 and neurons expressing endogenous levels of ADAM10 of 4 biological replicates and the p-value calculated with a two-sided, heteroscedastic t-test based on the relative label-free quantification ratios (LFQ) for the control and the ADAM10 deletion condition. Gene Symbols of previously published ADAM10 substrates are highlighted in bold. (MEAN) Average change between A10 deleted (A10KO) and Control (CON) cells of 4 biological replicates, (SEM) Standard error of the mean. (Peptides) Number of Peptides identified for every protein.
| Protein Name | Gene Symbol | Peptides | Topology | MEAN (A10KO/CON) | TTEST |
|---|---|---|---|---|---|
| Isoform APP695 of Amyloid beta A4 protein | App | 15 | Type I | 3,71 | 1,30E-02 |
| Fractalkine | Cx3cl1 | 6 | Type I | 2,91 | 3,00E-03 |
| Protein Ptprz1 | Ptprz1 | 25 | Type I | 2,41 | 1,66E-03 |
| Receptor-type tyrosine-protein phosphatase U | Ptpru | 7 | Type I | 2,10 | 7,82E-03 |
| Immunoglobulin superfamily containing leucine-rich repeat protein 2 | Islr2 | 16 | Type I | 1,89 | 6,18E-03 |
| Semaphorin-4B | Sema4b | 4 | Type I | 1,81 | 2,36E-02 |
| Contactin-associated protein-like 4 | Cntnap4 | 17 | Type I | 1,65 | 3,55E-02 |
| Fibronectin leucine rich transmembrane protein 3 | Flrt3 | 16 | Type I | 1,64 | 5,05E-02 |
| Netrin receptor UNC5D | Unc5d | 5 | Type I | 1,61 | 4,66E-02 |
| Neural cell adhesion molecule L1 | L1cam | 33 | Type I | 1,61 | 1,12E-02 |
| Voltage-dependent L-type calcium channel subunit beta-1 | Cacnb1 | 9 | Type I | 1,60 | 2,78E-02 |
| Phospholipase D3 | Pld3 | 3 | Type II | 1,60 | 4,49E-02 |
| Melanoma inhibitory activity protein 3 | Mia3 | 23 | Type I | 1,55 | 2,04E-02 |
| Receptor-type tyrosine-protein phosphatase kappa | Ptprk | 12 | Type I | 1,53 | 2,41E-02 |
| Tetraspanin-7 | Tspan7 | 5 | Polytopic | 1,49 | 1,63E-02 |
| Protein Pcdhgb6 | Pcdhgb6 | 9 | Type I | 1,49 | 9,66E-03 |
| Serine/threonine-protein kinase LMTK3 | Lmtk3 | 19 | Type I | 1,47 | 2,53E-02 |
| Protocadherin-8 | Pcdh8 | 32 | Type I | 1,46 | 2,73E-03 |
| Protein Pcdha9 | Pcdha9 | 12 | Type I | 1,43 | 3,90E-02 |
| Glutamate receptor 1 | Gria1 | 21 | Type I | 1,42 | 1,00E-02 |
| Tenascin-R | Tnr | 17 | Secreted | 1,40 | 4,69E-03 |
| Neurocan core protein | Ncan | 6 | Secreted | 1,35 | 7,81E-03 |
| Protein disulfide-isomerase A6 | Pdia6 | 7 | Secreted | 1,34 | 5,00E-02 |
| Contactin-2 | Cntn2 | 18 | GPI | 1,30 | 1,87E-02 |
| Receptor-type tyrosine-protein phosphatase F (Fragment) | Ptprf | 19 | Type I | 1,30 | 4,74E-02 |
| Reticulon-4 | Rtn4 | 39 | Polytopic | 1,28 | 2,94E-04 |
| Isoform 2 of Seizure protein 6 | Sez6 | 6 | Type I | 1,27 | 3,76E-02 |
| Large neutral amino acids transporter small subunit 1 | Slc7a5 | 9 | Polytopic | 1,25 | 1,50E-03 |
| Cell adhesion molecule 4 | Cadm4 | 10 | Type I | 1,23 | 3,02E-02 |
| Transferrin receptor protein 1 | Tfrc | 22 | Type II | 1,18 | 3,52E-02 |
| Cadherin EGF LAG seven-pass G-type receptor 3 | Celsr3 | 35 | Type I | 1,16 | 1,37E-02 |
| Protocadherin Fat 4 | Fat4 | 48 | Type I | 1,12 | 3,05E-02 |
| Sodium/potassium-transporting ATPase subunit alpha-3 | Atp1a3 | 62 | Polytopic | 0,95 | 4,09E-02 |
| Sarcoplasmic/endoplasmic reticulum calcium ATPase 2 | Atp2a2 | 52 | Polytopic | 0,86 | 2,14E-02 |
| Slc8a1 protein | Slc8a1 | 24 | Polytopic | 0,85 | 3,18E-02 |
| Synaptic vesicle glycoprotein 2A | Sv2a | 15 | Polytopic | 0,85 | 6,99E-03 |
| Solute carrier organic anion transporter family member 3A1 | Slco3a1 | 4 | Polytopic | 0,75 | 8,95E-03 |
Additional files
-
Supplementary file 1
A10 knockout quantified secretome data set.
- https://doi.org/10.7554/eLife.12748.012
-
Supplementary file 2
A10 knockout surfaceome dataset.
- https://doi.org/10.7554/eLife.12748.013
-
Supplementary file 3
MaxQuant output files (protein groups and peptides) for the neuronal secretome and the neuronal surface proteome.
- https://doi.org/10.7554/eLife.12748.014
Download links
A two-part list of links to download the article, or parts of the article, in various formats.
Downloads (link to download the article as PDF)
Open citations (links to open the citations from this article in various online reference manager services)
Cite this article (links to download the citations from this article in formats compatible with various reference manager tools)
Systematic substrate identification indicates a central role for the metalloprotease ADAM10 in axon targeting and synapse function
eLife 5:e12748.
https://doi.org/10.7554/eLife.12748


