Protein flexibility is required for vesicle tethering at the Golgi
- Stanford University School of Medicine, United States
- Stanford University, United States
Figures
Figure 1
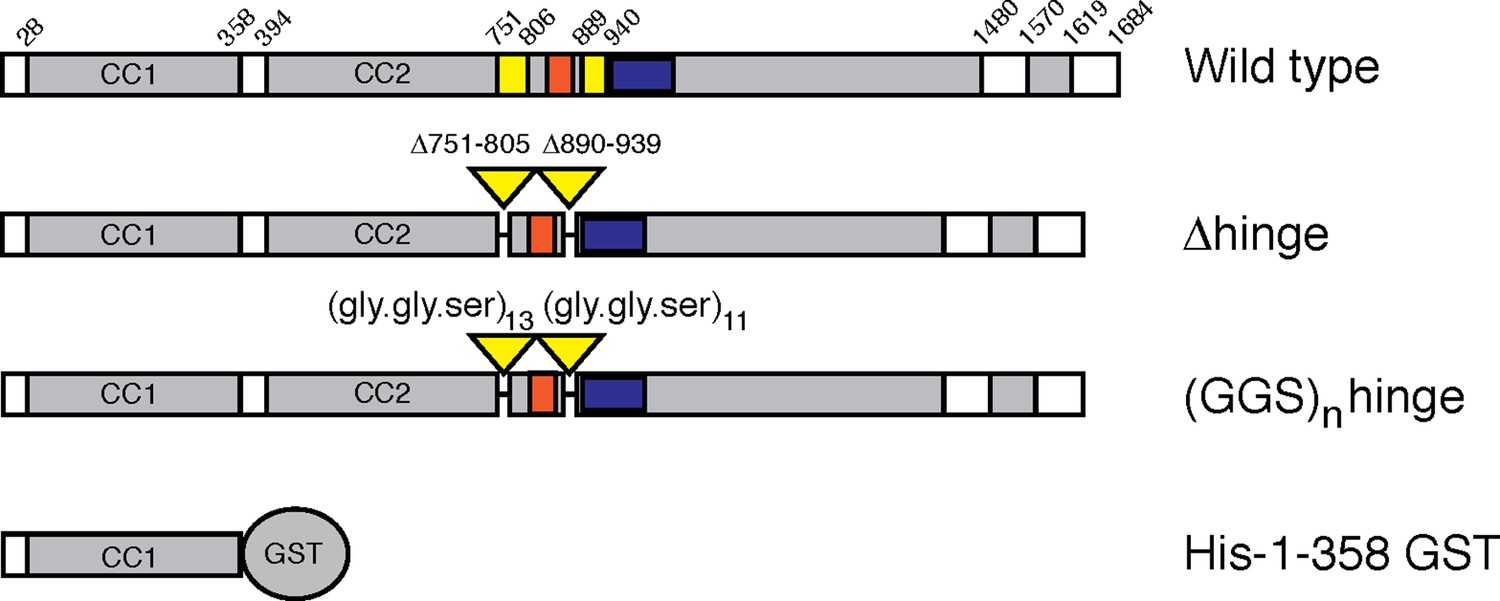
GCC185 rescue constructs tested.
Top, Wild type; second row, △hinge mutant (residues 751– 805 and 890–939 deleted); third row, (GSS)n hinge mutant with residues 751–805 and 890–939 (yellow bars) replaced with 13 and 11 repeats of Gly-Gly-Ser, respectively; proteins had either N-terminal Myc tags or GFP followed by a FLAG tag. Fourth row, His-1–358-GST used for vesicle capture. Orange and blue bars reflect a Rab9 GTPase or AP-1 binding site, respectively, as reported previously (Brown et al., 2011).
Figure 2
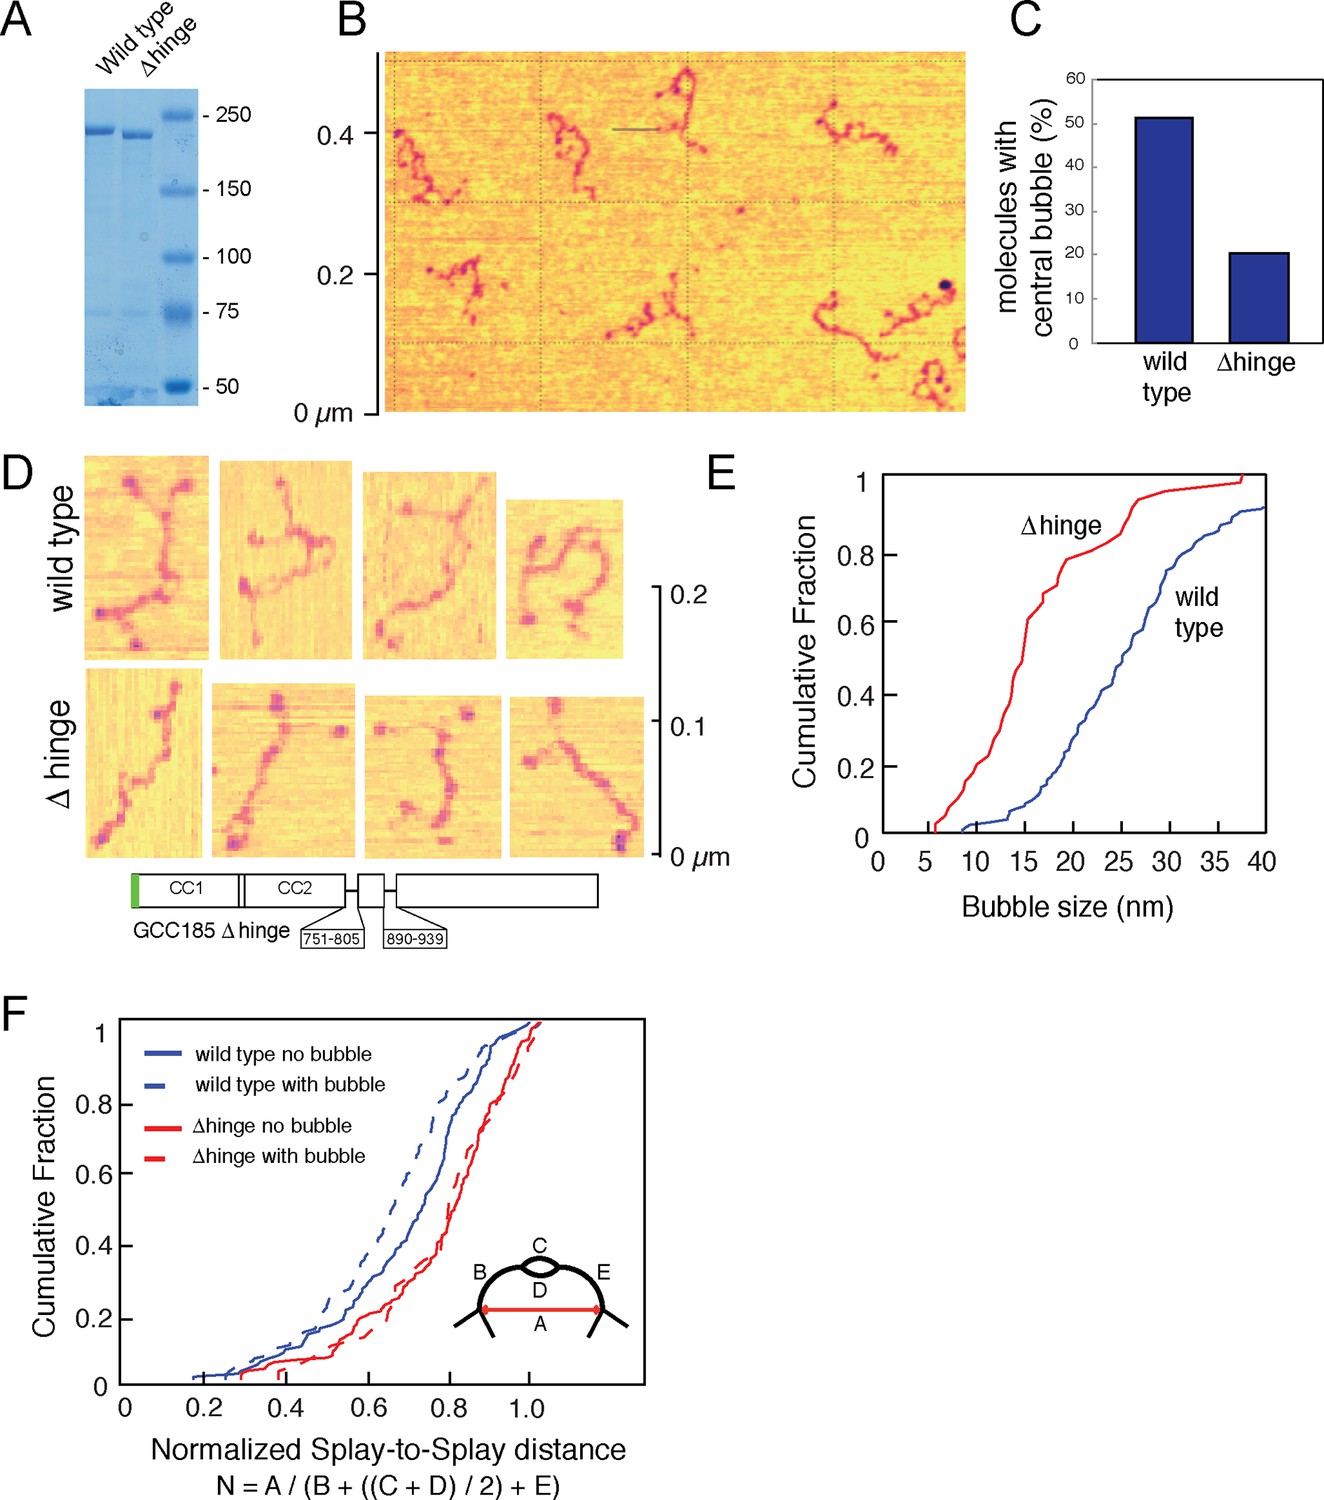
Atomic Force Microscopy reveals the splayed and flexible structure of GCC185.
(A) Coomassie stained SDS-PAGE of indicated, purified proteins. (B) GFP-FLAG-GCC185 on mica and imaged in air from a 1.2 μm X 1.2 μm scan; Z range, 2.5 nm. (C) Frequency of bubbles in GCC185 and Δhinge molecules. (D) GFP-FLAG-GCC185 (top) and Δhinge mutant (bottom) molecules. E,F, Comparison of bubble size (E) and normalized splay-to-splay distance (F) of indicated molecules. Bubble size = (X4 + X5)/2 (see Figure 3); Normalized distance is indicated by the formula below and inset in f. Data in E,F were from 262 wild type and 204 Δhinge molecules (diagrammed below D). All the molecules measured were pooled from at least 3 independent experiments.
Figure 3 with 4 supplements
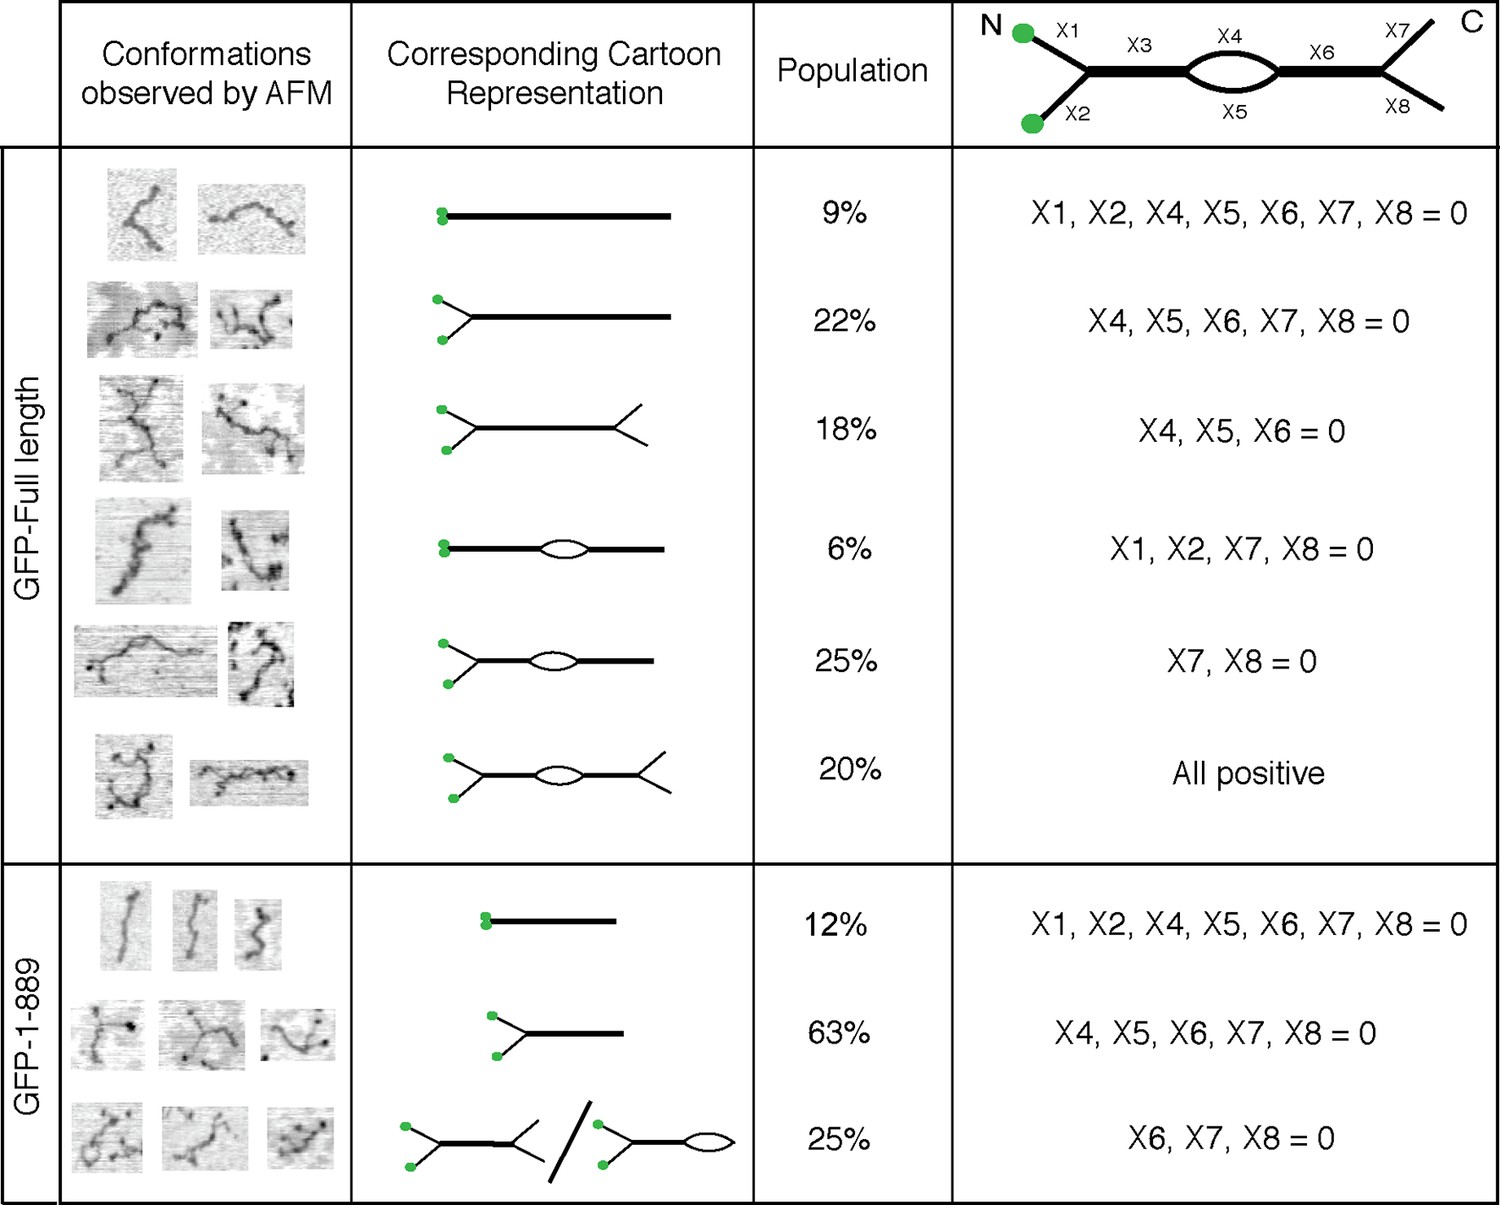
Conformations of GCC185’s full length and N-terminal half.
Column 1, Examples of different conformations seen for indicated GCC185 molecules visualized by AFM; Column 2, cartoon representations; Column 3, Relative abundance of each conformation. Total objects counted, full length, 262; residues 1–889, 350. Column 4, Segmentation of GCC185 for length and feature analyses. Data were pooled from at least 3 independent experiments.
Figure 3—figure supplement 1
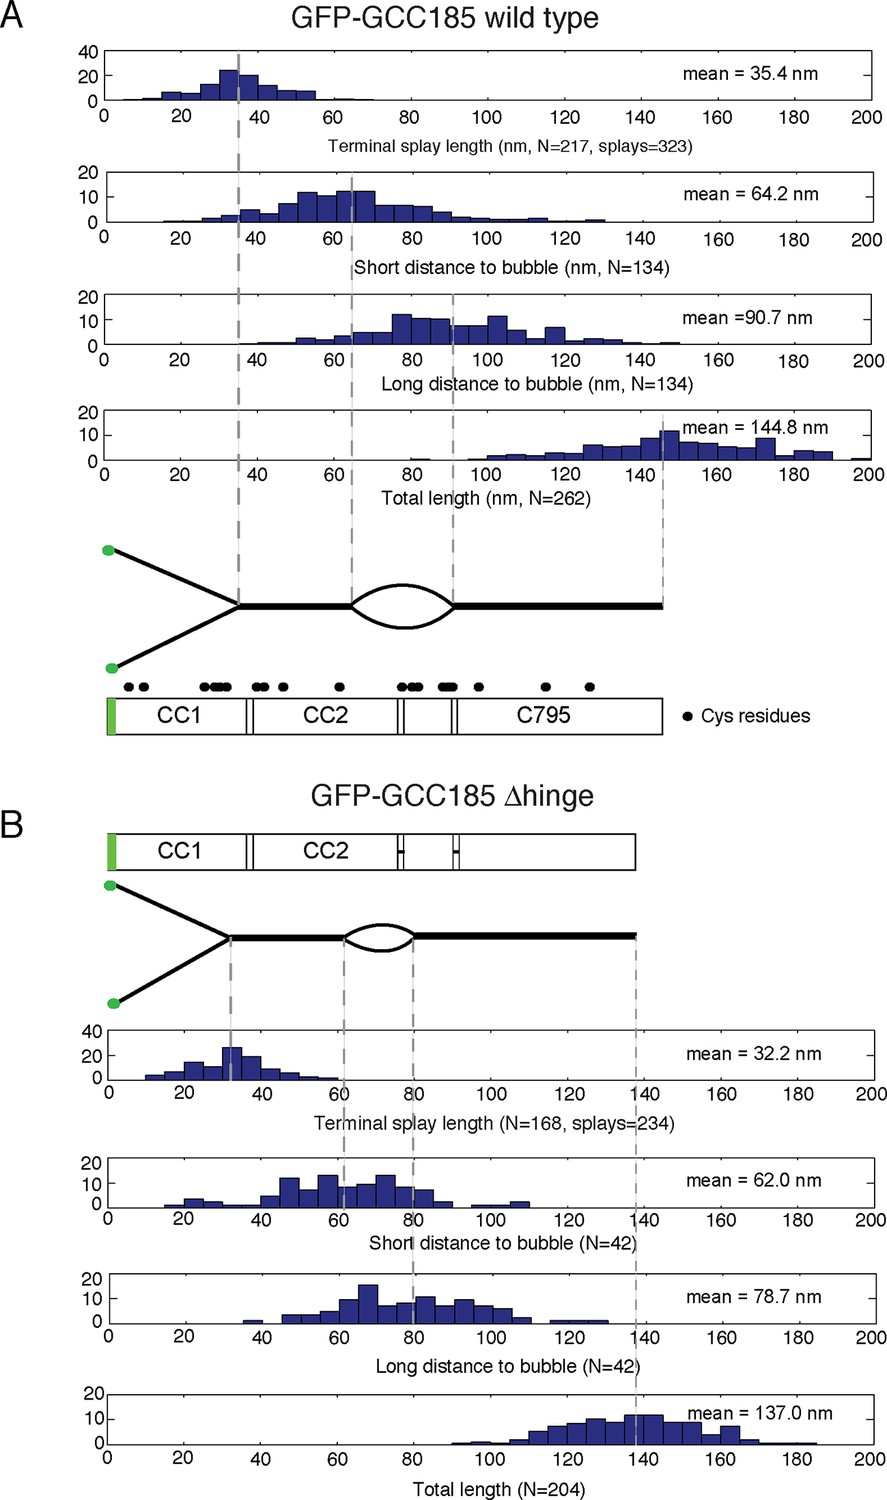
Map of the structural features of GCC185 wild type and △hinge mutant.
Distribution histograms of the experimentally measured lengths from the N-terminus to the end of the N-terminal splays, short and long distances from globular ends to the bubble and the total length of (A) wild type GCC185 and (B) △hinge mutant. Below, correctly scaled cartoon representations and schematic diagrams illustrate the position of each structural feature along the molecule based on the corresponding mean values (dashed lines). Filled circles, cysteine residues.
Figure 3—figure supplement 2
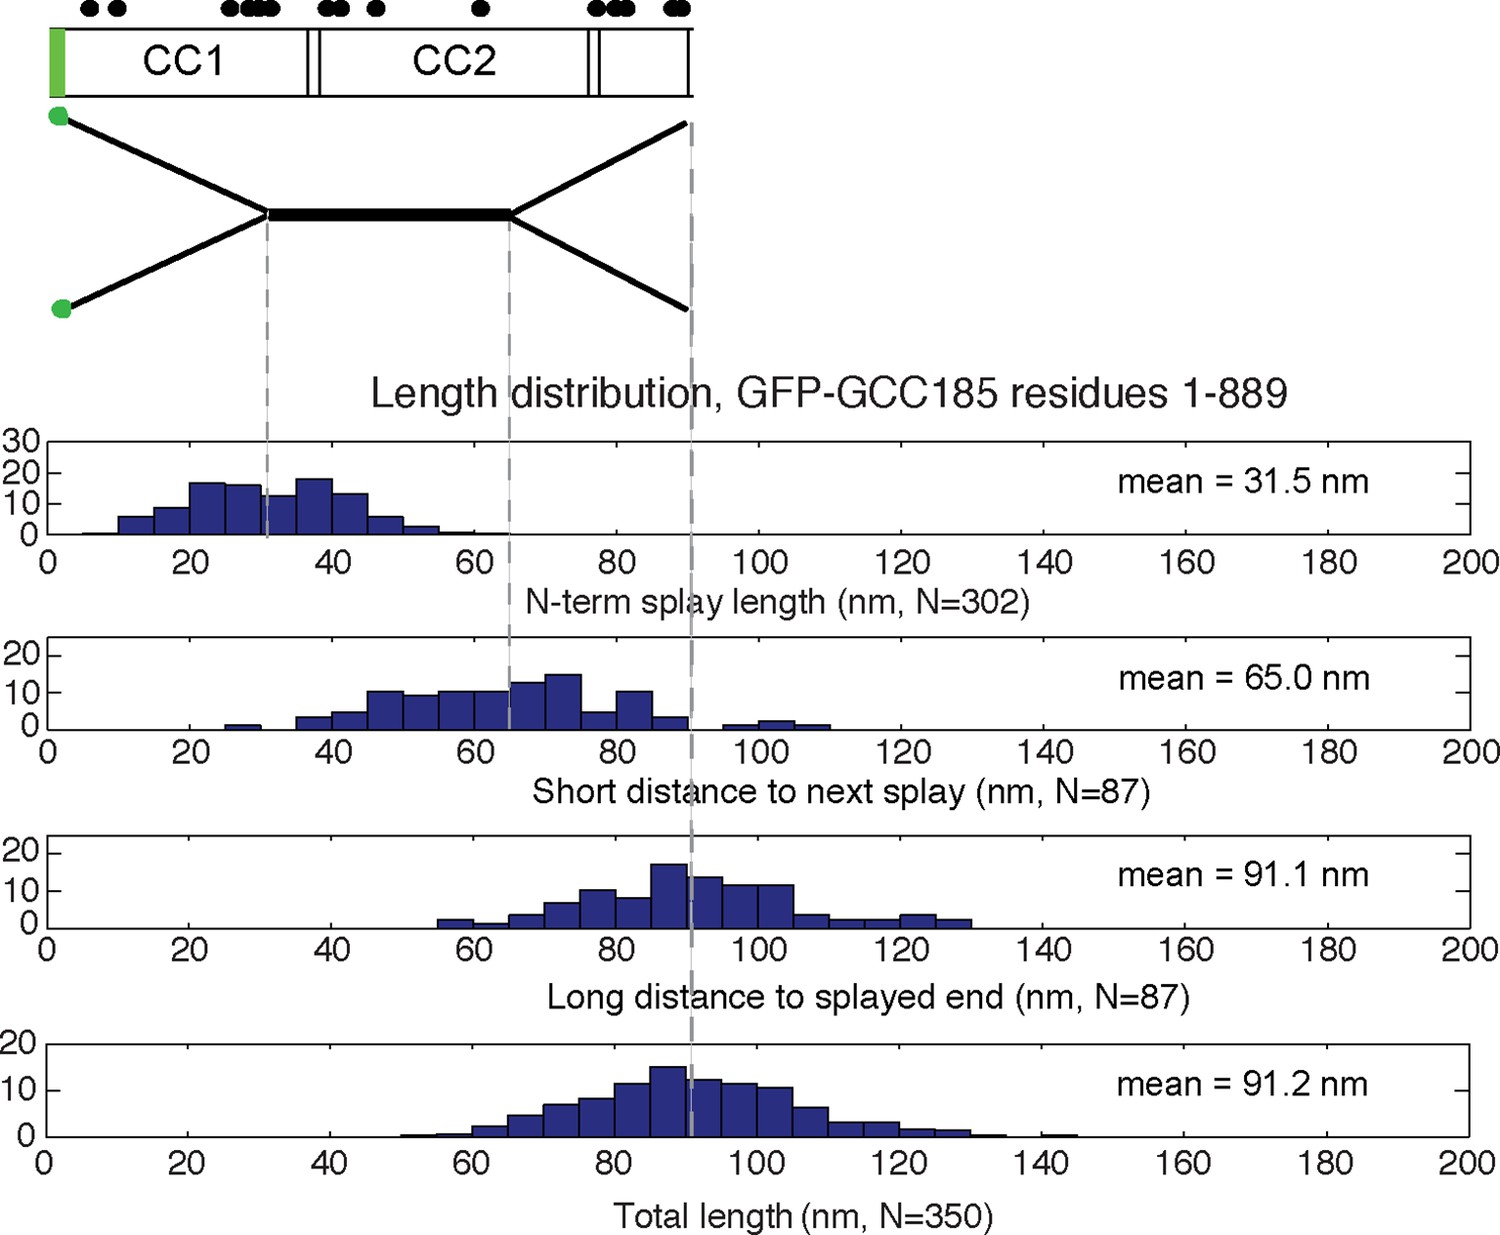
Map of the structural features of GCC185 1-889.
Distribution histograms for N-terminal 1-889 construct as in Figure 3—figure supplement 1.
Figure 3—figure supplement 3
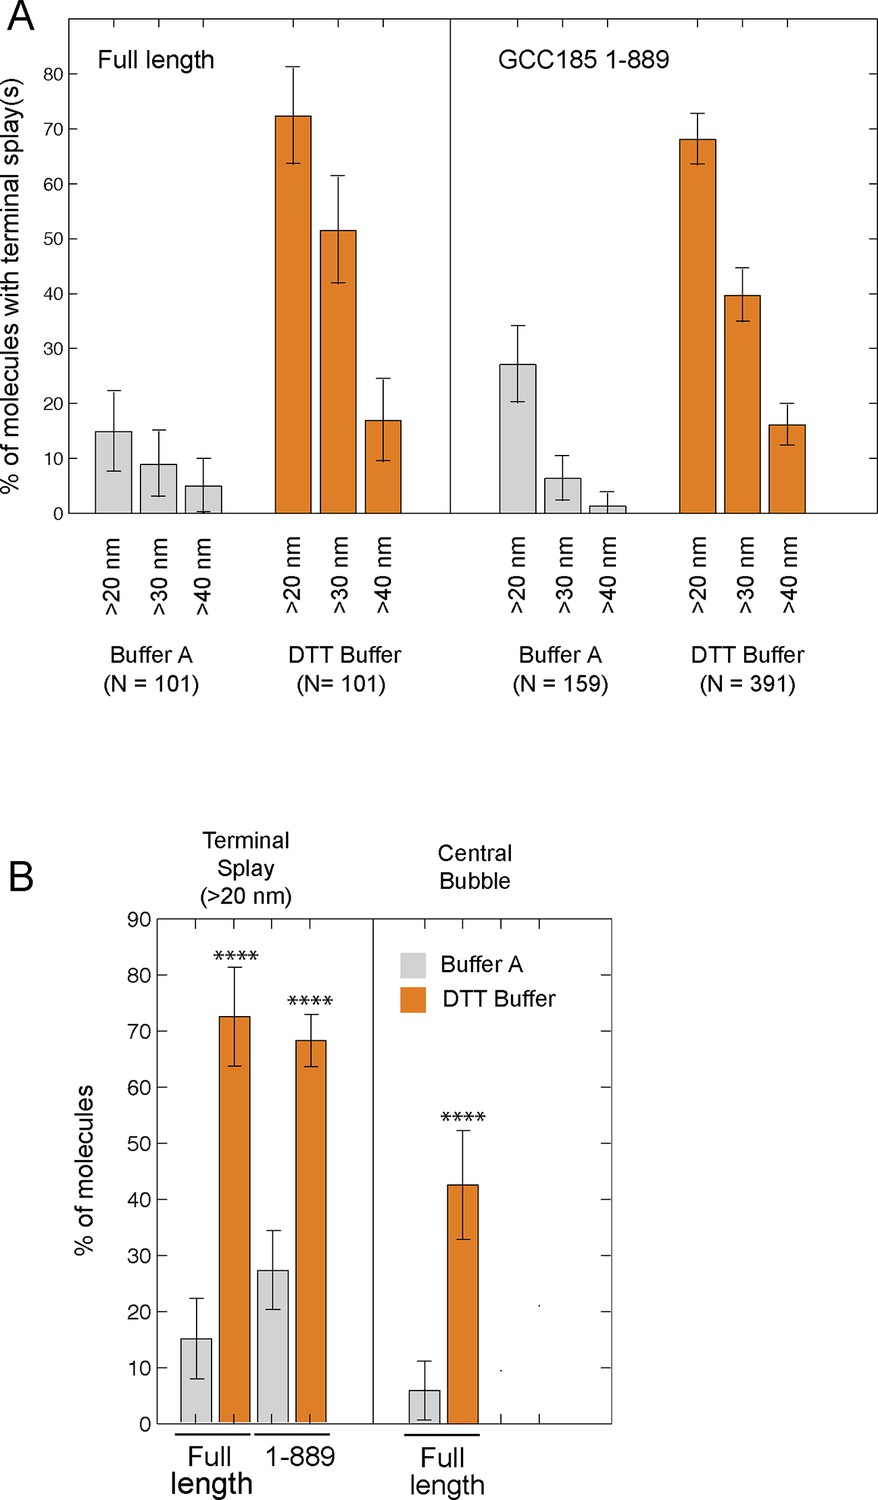
Initial comparison of the frequency of N-terminal splays and central bubbles in GCC185 or GCC185 1-889 purified in buffer A (50 mM Tris, 250 mM NaCl, 10% glycerol) ± 0.5mM DTT.
Data were from 4 experiments, error bars represent S.D. Data from panel A are summarized in panel B; N = 101 for bubbles in B. P values (≤ 0.0001) were obtained by unpaired, two-tailed t test.
Figure 3—figure supplement 4
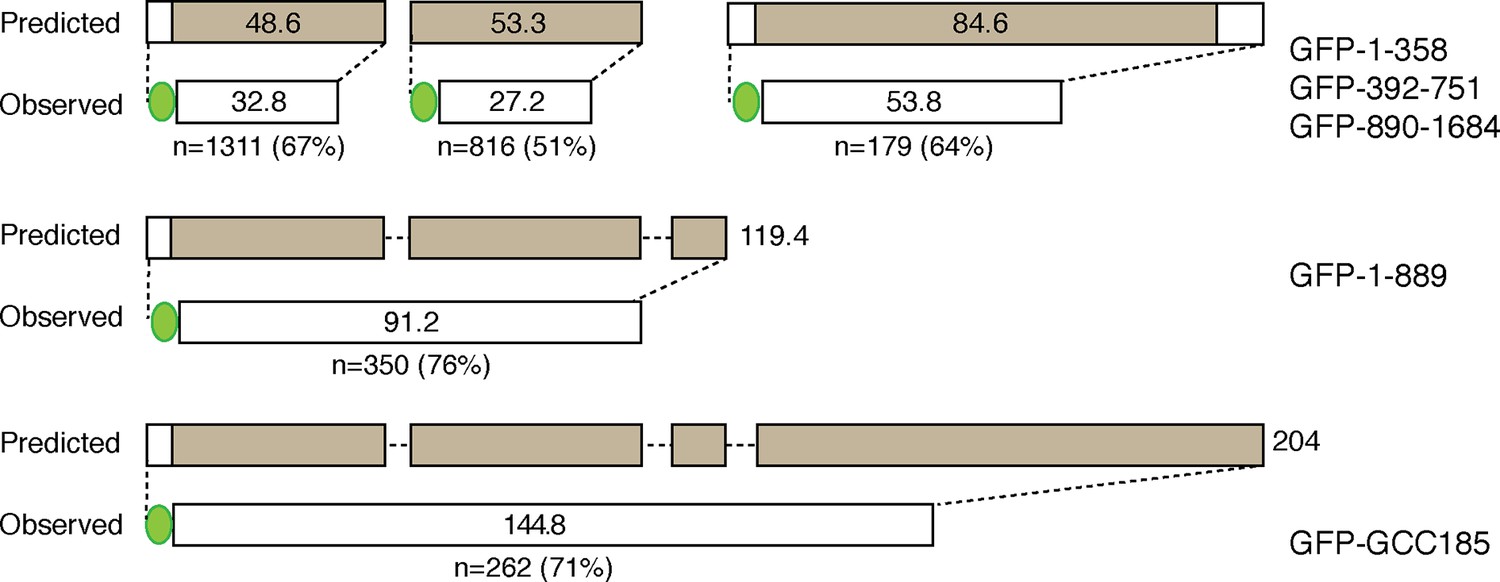
Diagram showing actual fragment lengths compared with predicted lengths of the indicated constructs.
GFP is indicated as a green sphere, and GCC185 coiled coil regions are indicated in brown. Values within the bars indicate expected or measured, mean lengths in nm; shown below are values for the numbers of molecules measured and the overall percentage difference between the measured lengths and predicted lengths for each fragment. The sum of the lengths measured for N- and C-terminal halves equals the length measured for the full length protein. The full length molecule is predicted to be > 204nm in length.
Figure 4

Antibody-labeling confirms the location of the central bubble.
(A) Location of HA-tag after residue 805 in GFP-FLAG-GCC185. (B) Topographic AFM micrographs showing GFP-FLAG-GCC185 labeled with anti-HA antibody. Bar, 100 nm. (C) 3-D heat map of the height of a representative molecule with antibody bound. Rainbow scale, Z- range. (D) Relative bubble and antibody positions assessed by measuring the length from GFP to the beginning (left), center (middle) or the other end (right) of the bubble/antibody length as function of total length. Cumulative fraction plots of relative positions represent measurements of 43 antibody-labeled molecules (green) and 134 bubble-containing molecules (blue). Antibody-labeled molecules were imaged from 2 independent experiments.
Figure 5
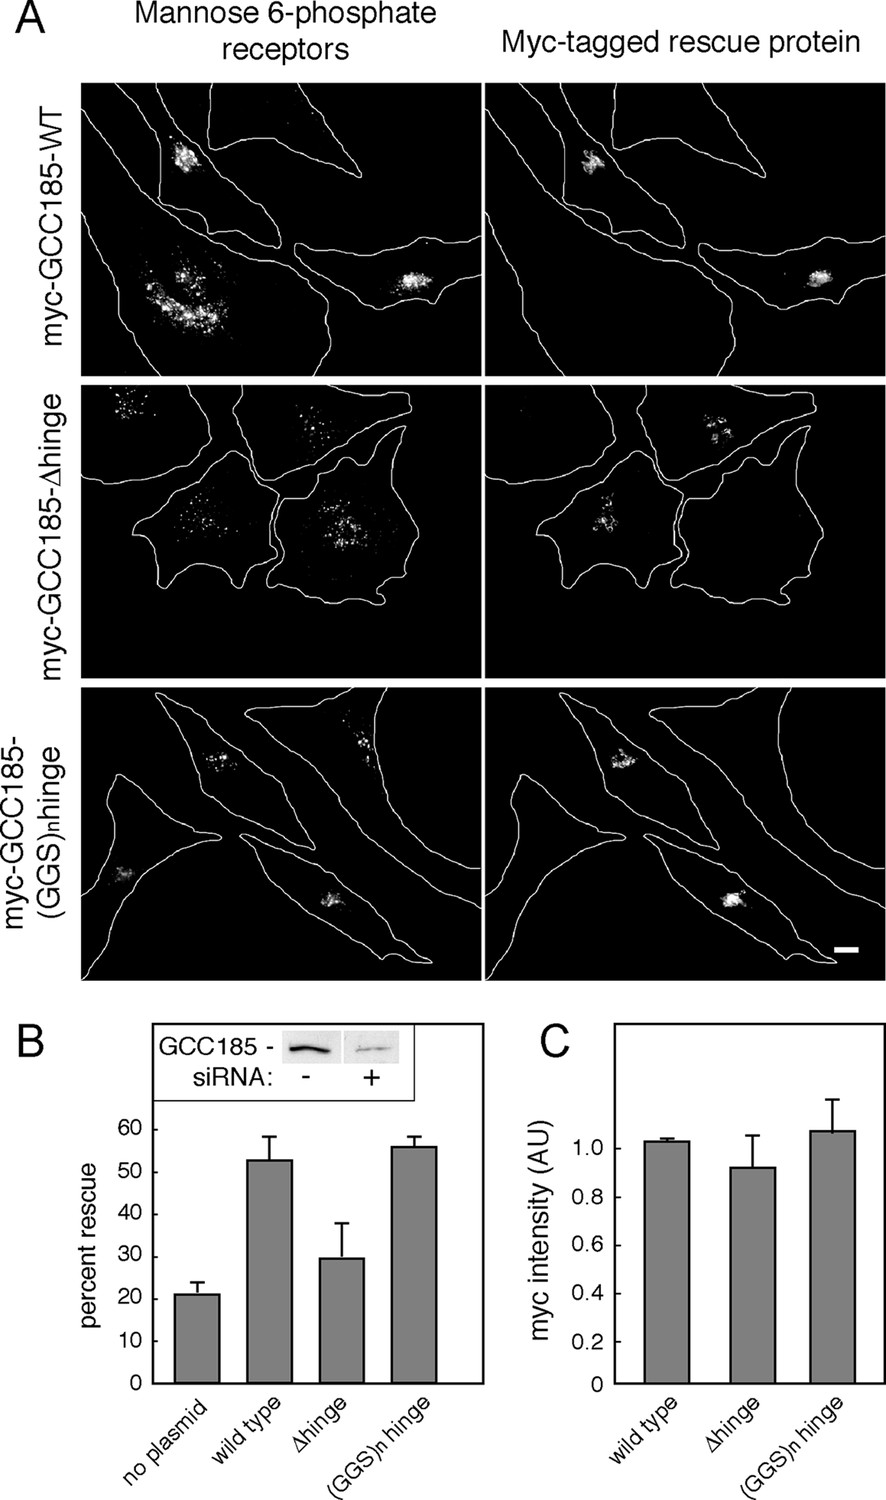
GCC185’s flexible hinge region is required for receptor trafficking to the Golgi.
(A) Left column, cation independent mannose 6-phosphate receptor localization detected using 2G11 mouse antibodies. Right column, expression of the indicated rescue constructs detected using chicken anti-Myc antibodies. Cell outlines are indicated. Scale bar, 10 μm. (B) inset, immunoblot of GCC185 ± siRNA treatment; Quantitation of rescue experiments (p<0.05 by one-way ANOVA). (C) Quantitation of Myc-tagged rescue protein levels using CellProfiler analysis of cells scored from light micrographs. Data in (B) and (C) represent the mean of three independent experiments; > 60 cells were counted for each condition in each experiment. Error bars represent standard deviation.
Figure 6
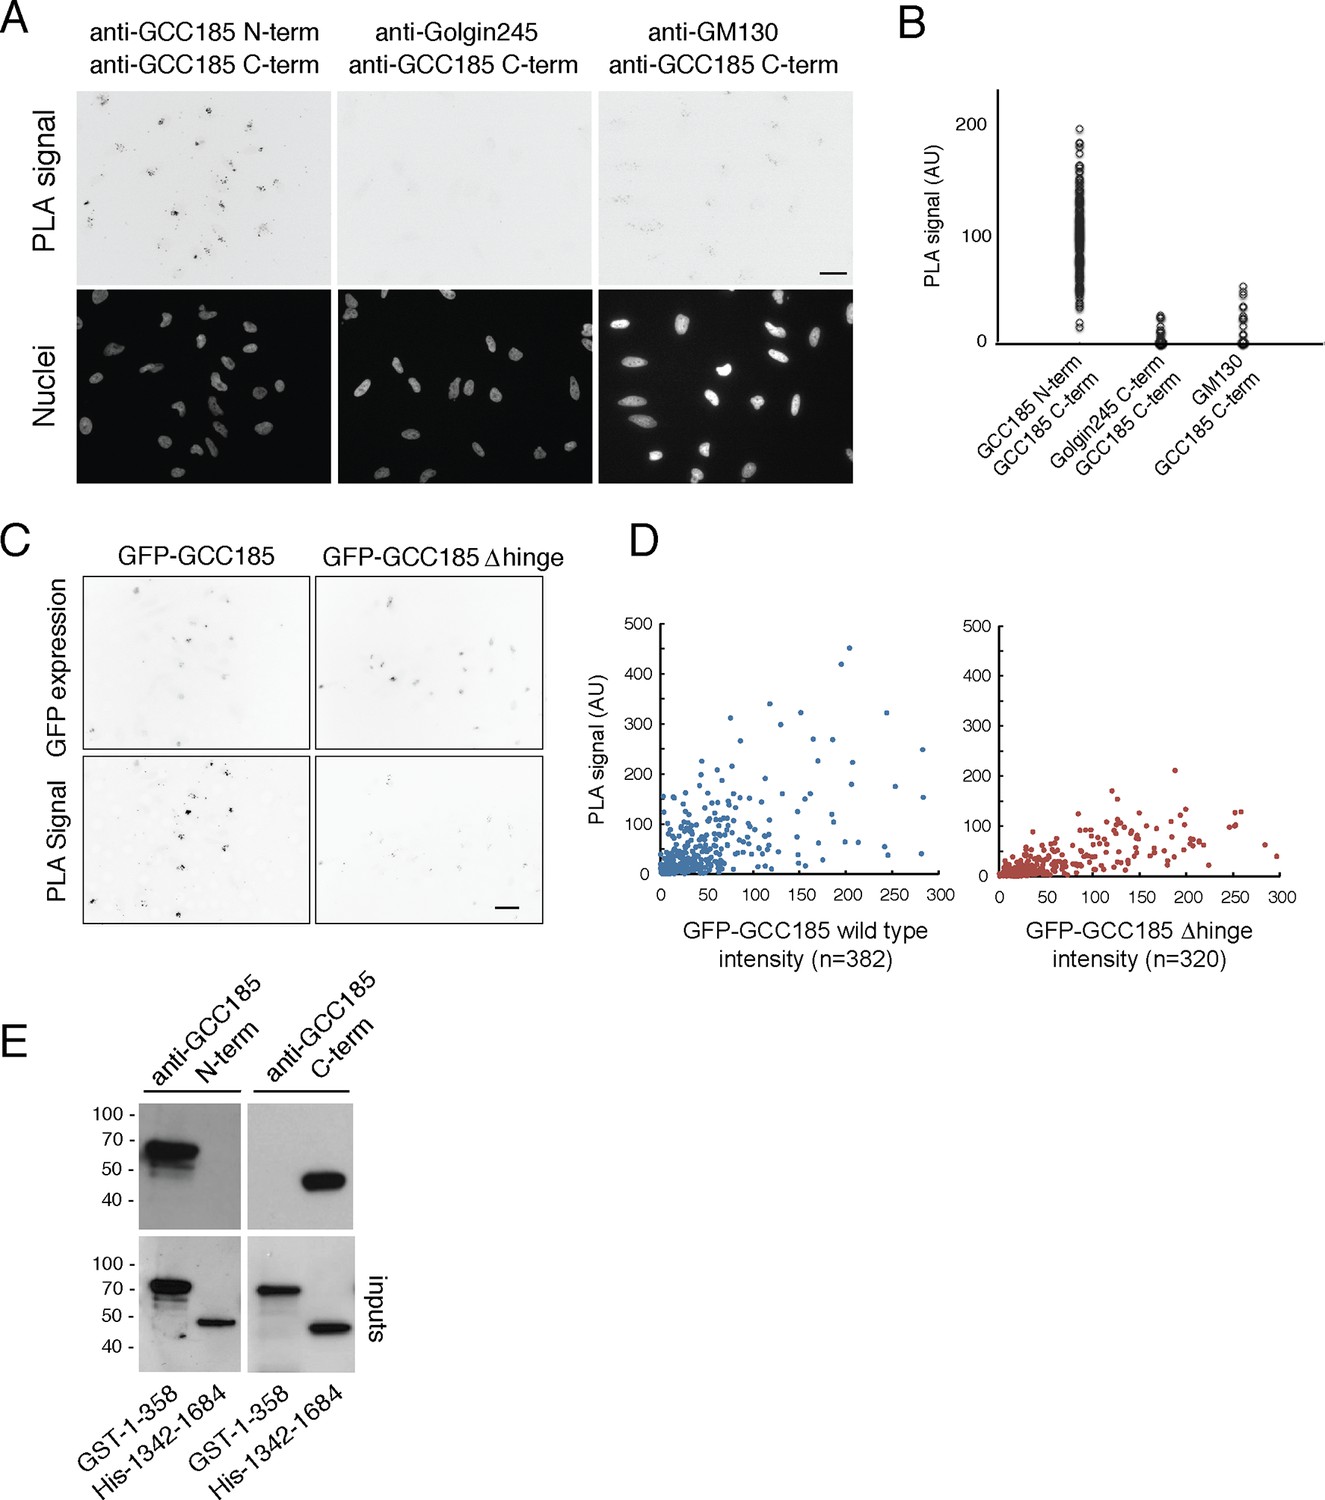
Proximity of GCC185 N- and C-termini on the Golgi requires putative hinge sequences.
(A) Top: Proximity ligation in HeLa cells using indicated antibodies; nuclear staining is shown below. (B) Quantitation of proximity ligation using CellProfiler; N = 168, 94 or 46, left to right (p<0.0001 by two-tailed Student’s t-Test). (C) Bottom: Proximity ligation using mouse-anti-GFP and rabbit-anti-GCC185 C-terminus antibodies in GFP-GCC185 or GFP-GCC185-Δhinge-transfected HeLa cells. Top, GFP-GCC185 expression in the same cells. Bar, 20 μm. (D) Quantitation of proximity ligation versus GFP-protein expression levels using CellProfiler. More than 300 objects were measured for each condition (p<0.001 by two-tailed Student’s t-Test), pooled from two independent experiments. (E) Immunoblot test of antibody specificity using purified GCC185 domains. Upper panel: 10 ng GST-1–358 and His-1342–1684 were detected with (left) mouse anti-GCC185-N-term or (right) rabbit anti-GCC185-C-term antibodies. Lower panel: blots were re-probed using mouse anti-His (left) or rabbit anti-GST (right) antibodies to detect the corresponding antigens.
Figure 7
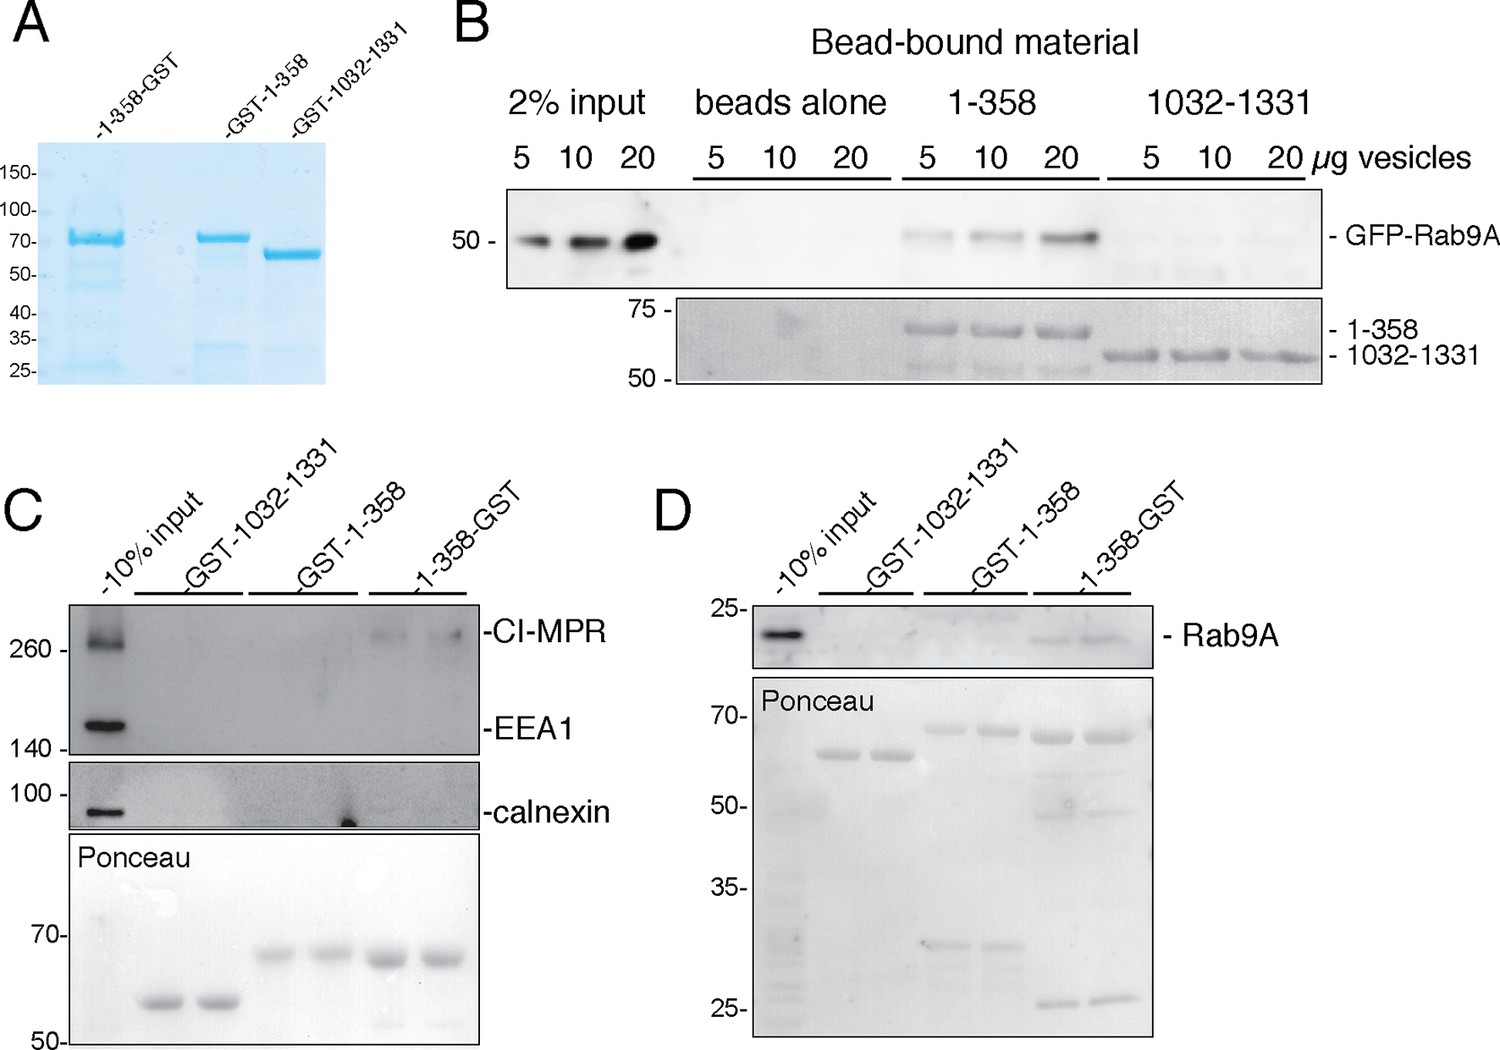
GCC185 N-terminal domain tethers cargo-containing vesicles.
(A) Coomassie blue stained SDS-PAGE of purified His-1–358-GST, GST-1–358 and GST-1032–1331. (B) Binding of GFP-Rab9-vesicles to the indicated, immobilized GCC185 constructs. Top panel, anti-GFP immunoblot; bottom panel, Ponceau S stain. (C,D) Binding of endogenous CI-MPR or Rab9-vesicles, respectively, to the indicated constructs as in B. Top panels, C, anti-CI-MPR, anti-EEA1 and anti-calnexin blots; (D) anti-Rab9A blot; (C,D) bottom panels, Ponceau S staining. Mobility of marker proteins is indicated at left in Kd. A representative example from at least 3 independent experiments (in duplicate) is shown for GFP-Rab9- and endogenous CI-MPR-vesicle capture; 2 independent experiments (in duplicate) were performed for endogenous Rab9-vesicle capture.
Figure 8
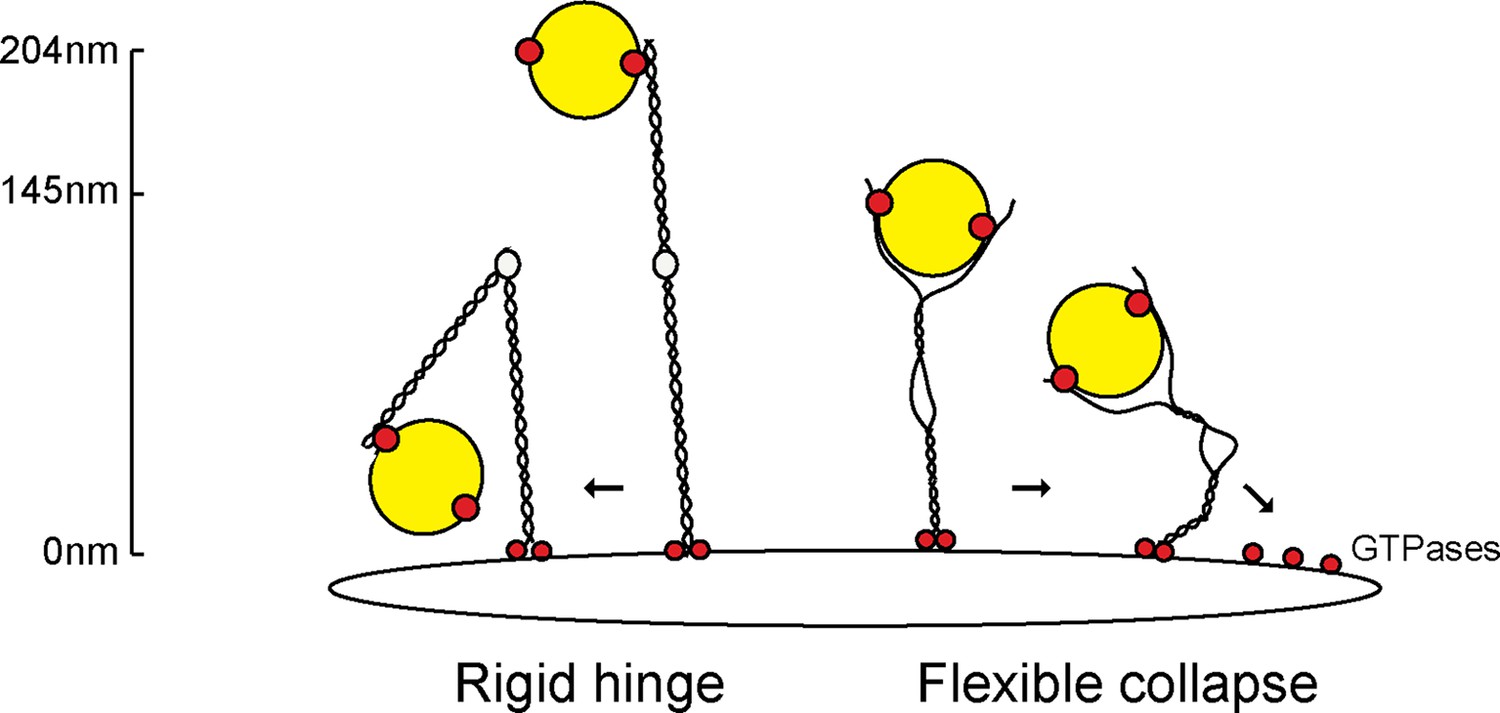
Collapse model for vesicle tethering at the TGN.
Previous models based on GMAP-210 have led to a model that tethers extend from the Golgi as highly rigid rods that may bend in the middle ('Rigid hinge'). Data presented here show that GCC185 is shorter than originally predicted (145 nm vs. >204 nm), has splayed ends that can capture vesicles, and an unusual central bubble and floppiness as detected by atomic force microscopy. These features lead us to propose a flexible collapse model whereby the tether may collapse onto the Golgi surface, possibly facilitated by Rab GTPases and other proteins that are localized there. Note that vesicles may also (or alternately) bind near the bubble, and engage both the AP1 and Rab9 binding sites there, in addition to GCC185’s N-terminal arms.
Additional files
-
Source code 1
Matlab script for afm image analysis.
- https://doi.org/10.7554/eLife.12790.015
Download links
A two-part list of links to download the article, or parts of the article, in various formats.
Downloads (link to download the article as PDF)
Open citations (links to open the citations from this article in various online reference manager services)
Cite this article (links to download the citations from this article in formats compatible with various reference manager tools)
Protein flexibility is required for vesicle tethering at the Golgi
eLife 4:e12790.
https://doi.org/10.7554/eLife.12790


