Estrogen receptor alpha somatic mutations Y537S and D538G confer breast cancer endocrine resistance by stabilizing the activating function-2 binding conformation
- University of Chicago, United States
- University of Illinois at Urbana-Champaign, United States
- The Scripps Research Institute, United States
- Memorial Sloan Kettering Cancer Center, United States
- University of Illinois Urbana-Champaign, United States
- Texas A&M University, United States
Figures
Figure 1 with 1 supplement

Binding of the SRC3 coactivator to WT, Y537S, or D538G ERα LBD in the absence or presence of E2 or TOT. LBD, ligand-binding domain.
https://doi.org/10.7554/eLife.12792.004
Figure 1—figure supplement 1
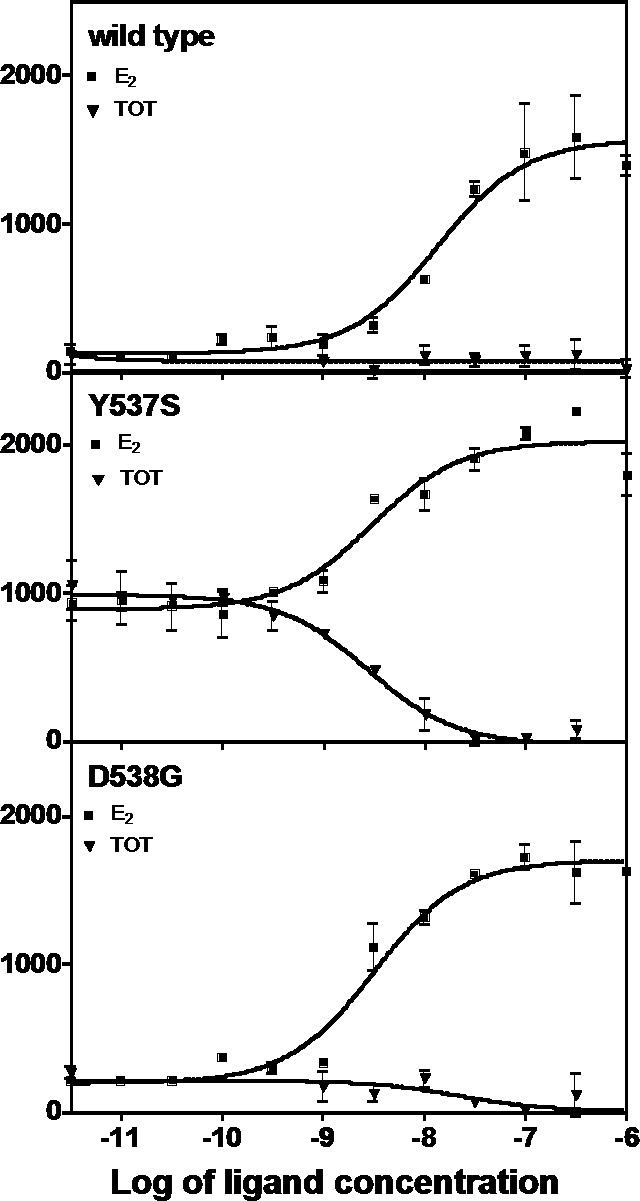
Binding of the SRC3 coactivator to WT, Y537S, or D538G mutant ERα LBD with increasing concentrations of E2 or TOT.
https://doi.org/10.7554/eLife.12792.005
Figure 2

Determination of Kd values of estradiol (E2) binding to wild type, Y537S, and D538G LBDs, by a direct binding assay.
All slopes had an r2 of 0.95 or better; shown is a representative experiment. For details, see Methods. LBD, ligand-binding domain.
Figure 3
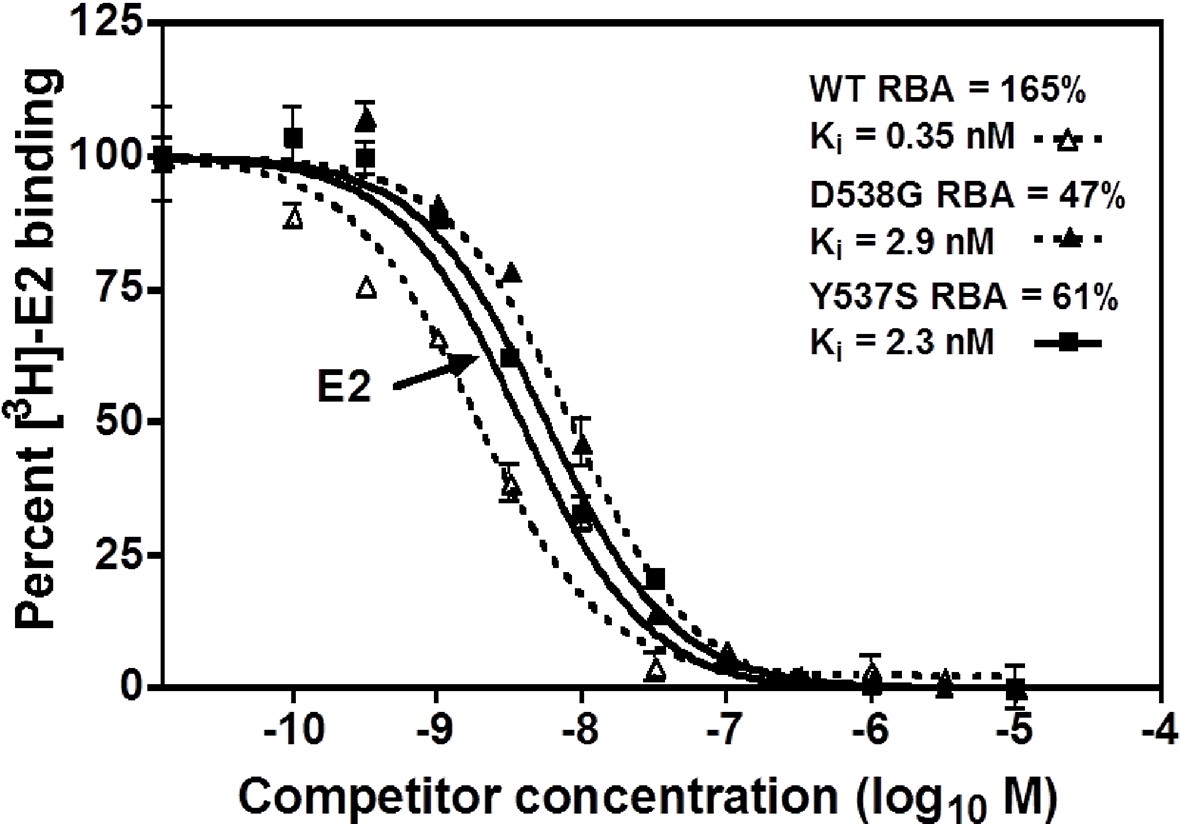
Relative binding affinity assay of wild type, Y537S, and D538G ligand-binding domains (LBDs), showing the TOT competition curves.
With all proteins, the E2 curve is set to 100% and is shown only once. For details, see Methods.
Figure 4 with 12 supplements
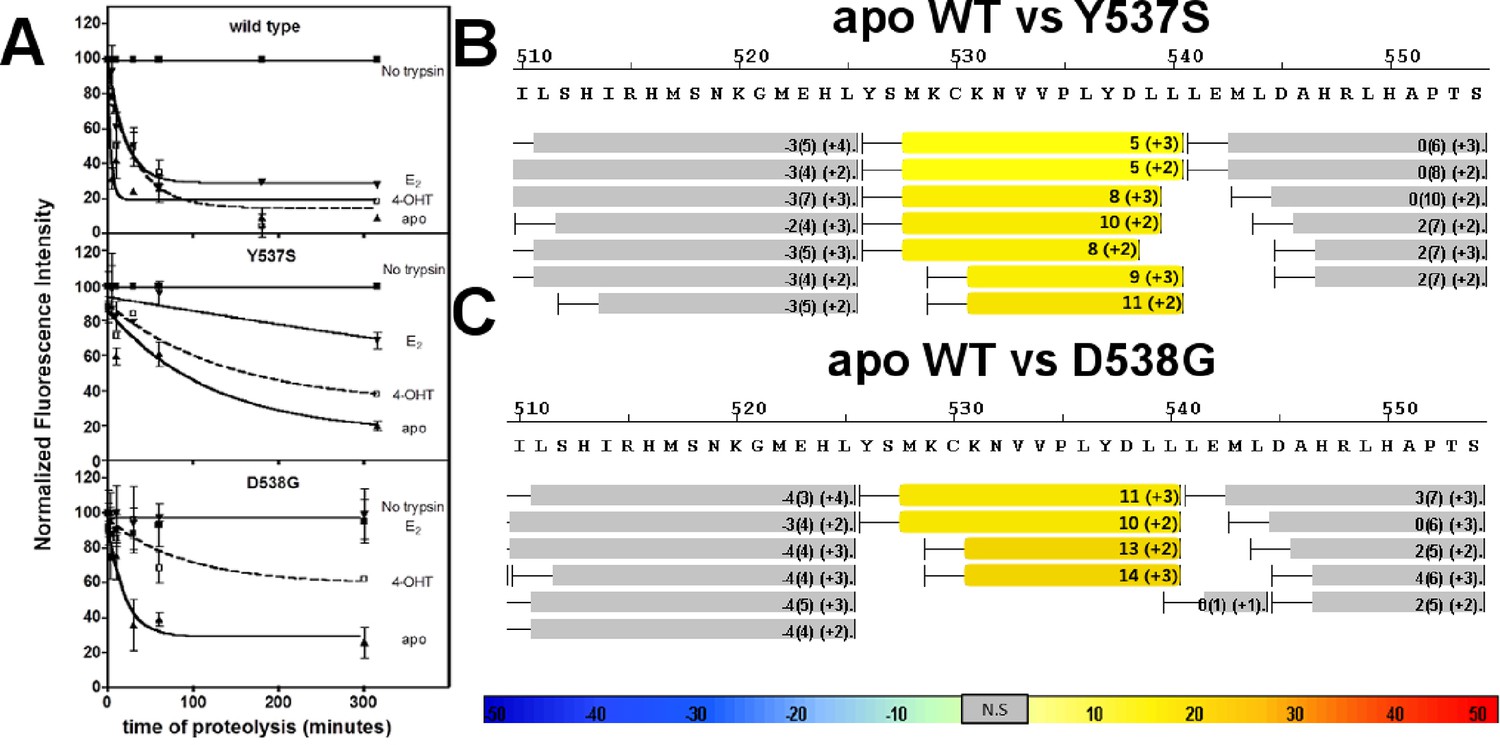
Conformational stability of WT and mutant ERα LBD H11-12 loop and H12.
(A) Proteolytic susceptibility of the WT, Y537S, and D538G ERα LBD mutants in the apo, E2-bound, and TOT-bound states. (B–C) Deuterium uptake plot for the C-terminus of H11 along with the H11-12 loop and H12 for the apo WT vs Y537S ERα LBD (B), apo WT vs D538G ERα LBD (C). All HDX MS data represent an average of three replicates and are color coded from red to blue with warm colors representing increased conformational dynamics (red being the highest D2O uptake) and cool colors representing decreased conformational dynamics (blue being the lowest D2O uptake). All regions colored were determined to be statistically significant based on a paired two-tailed Students t-test. A legend is provided at the bottom. Grey indicates no statistically significant change between the two apo states. HDX, hydrogen/deuterium exchange; LBD, ligand-binding domain.
Figure 4—figure supplement 1

Complete differential amide HDX MS map of WT ERα LBD binding to E2.
https://doi.org/10.7554/eLife.12792.010
Figure 4—figure supplement 2

Complete differential amide HDX MS map of Y537S ERα LBD mutant binding to E2.
https://doi.org/10.7554/eLife.12792.011
Figure 4—figure supplement 3
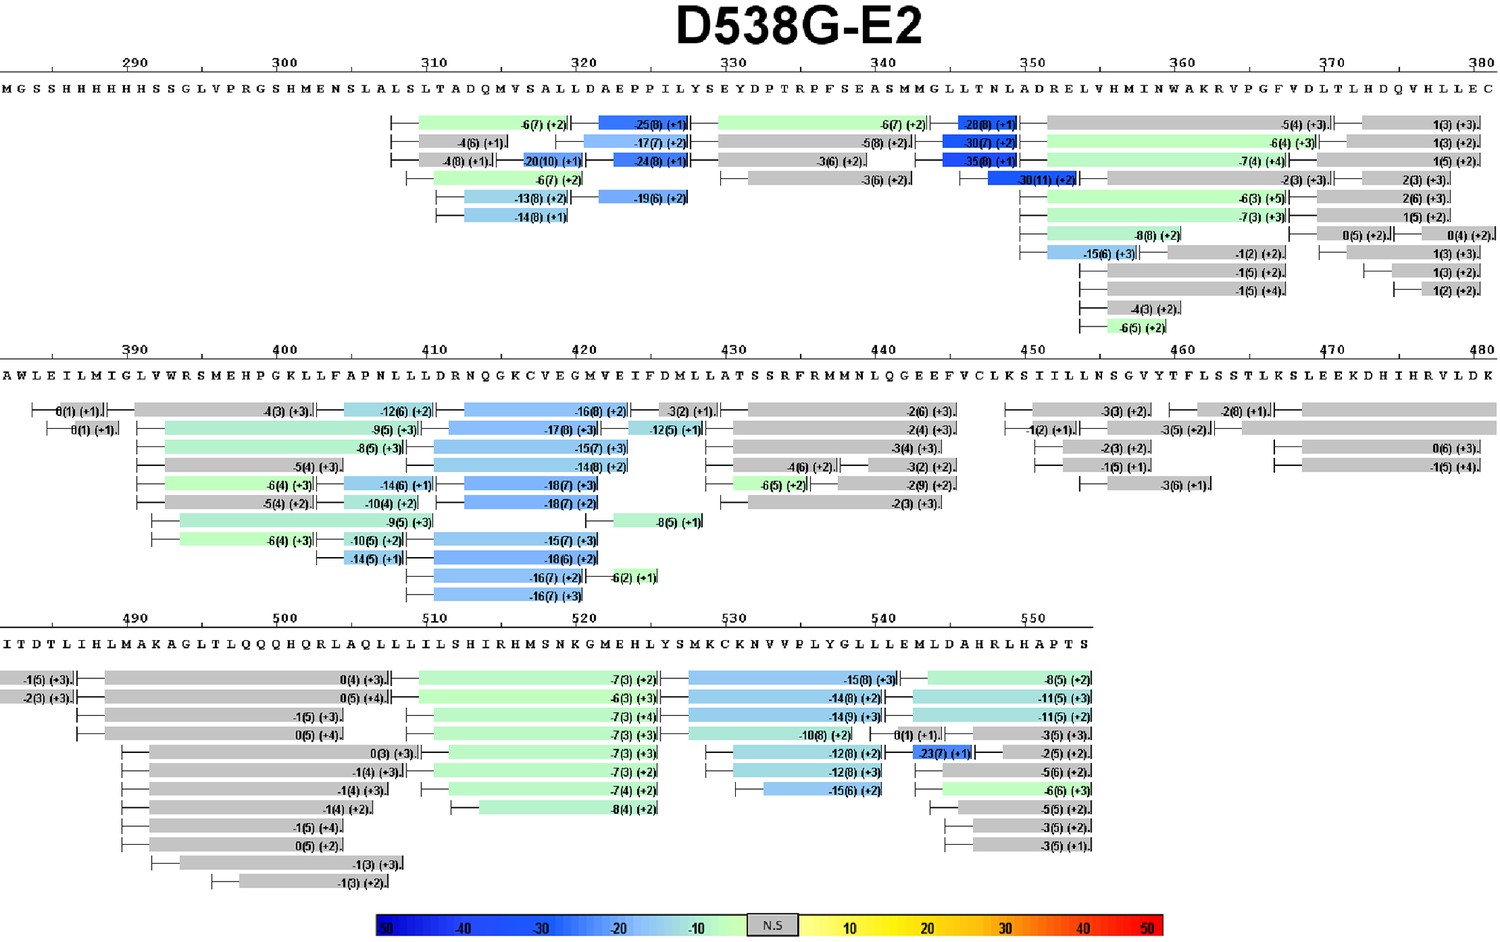
Complete differential amide HDX MS map of D538G ERα LBD mutant binding to E2.
https://doi.org/10.7554/eLife.12792.012
Figure 4—figure supplement 4
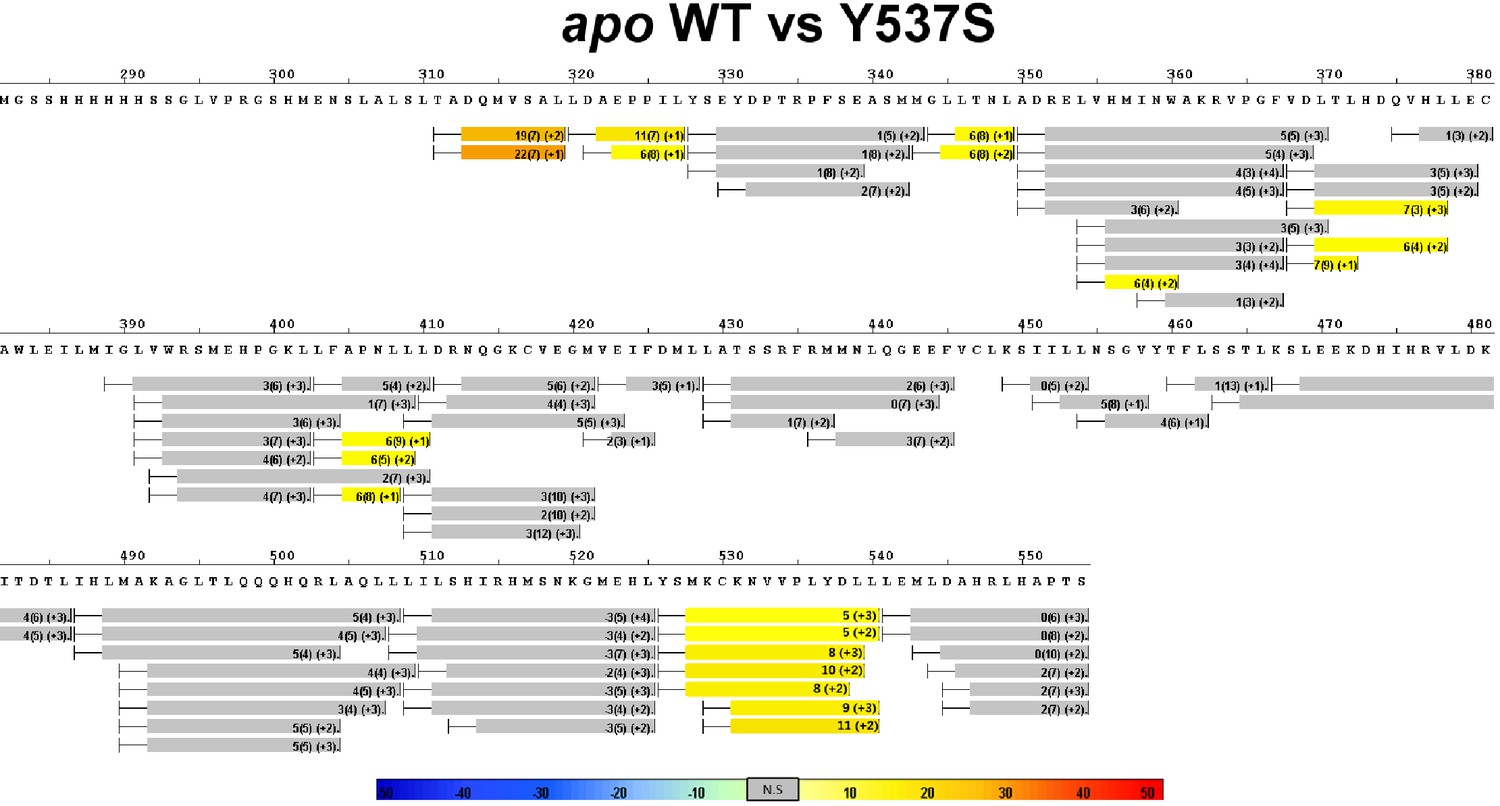
Complete differential HDX perturbation maps comparing the apo WT versus apo Y537S ERα LBD.
https://doi.org/10.7554/eLife.12792.013
Figure 4—figure supplement 5
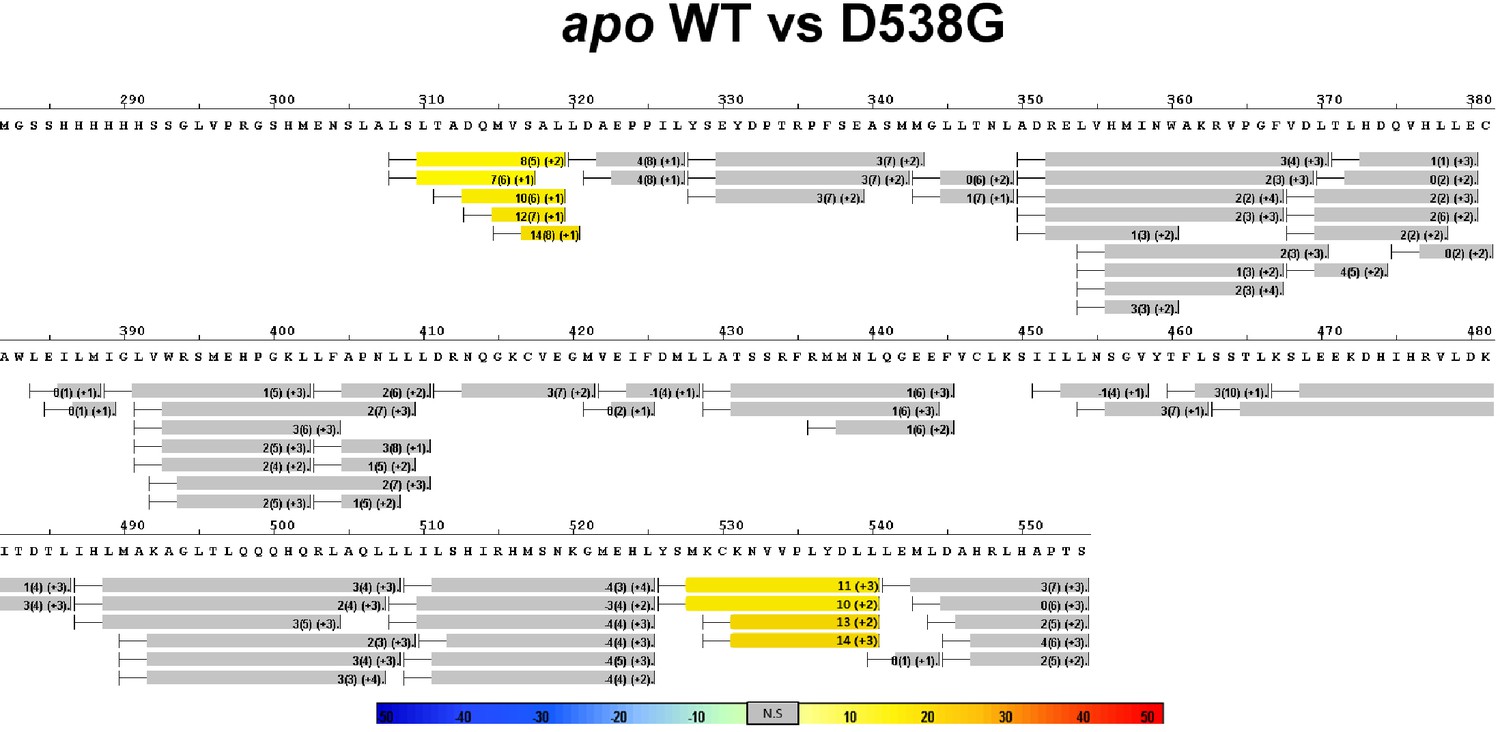
Complete differential HDX perturbation maps comparing the apo WT versus apo D538G ERα LBD.
https://doi.org/10.7554/eLife.12792.014
Figure 4—figure supplement 6
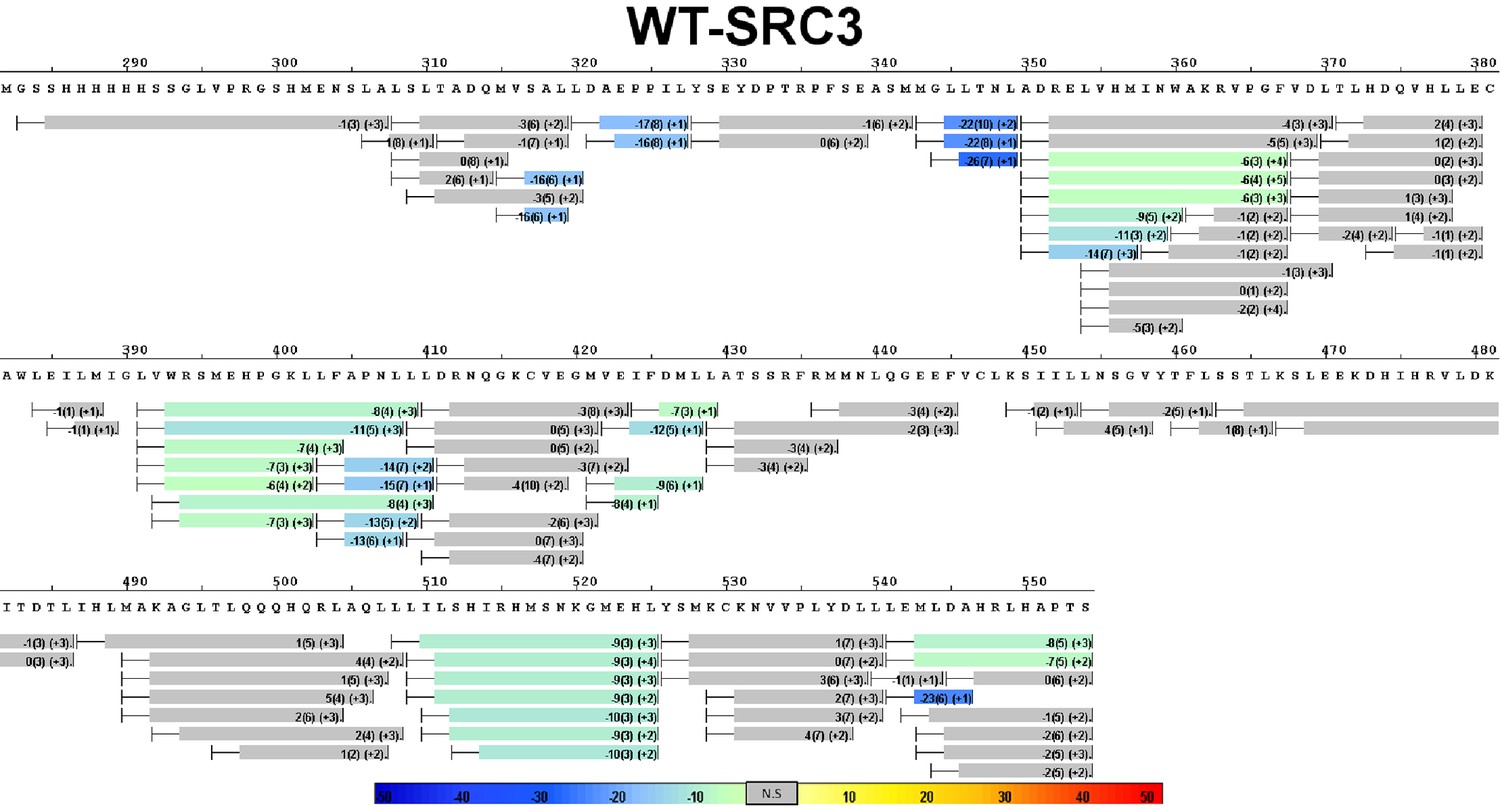
Complete differential HDX perturbation map of WT ERα LBD with SRC3-NRD.
https://doi.org/10.7554/eLife.12792.015
Figure 4—figure supplement 7
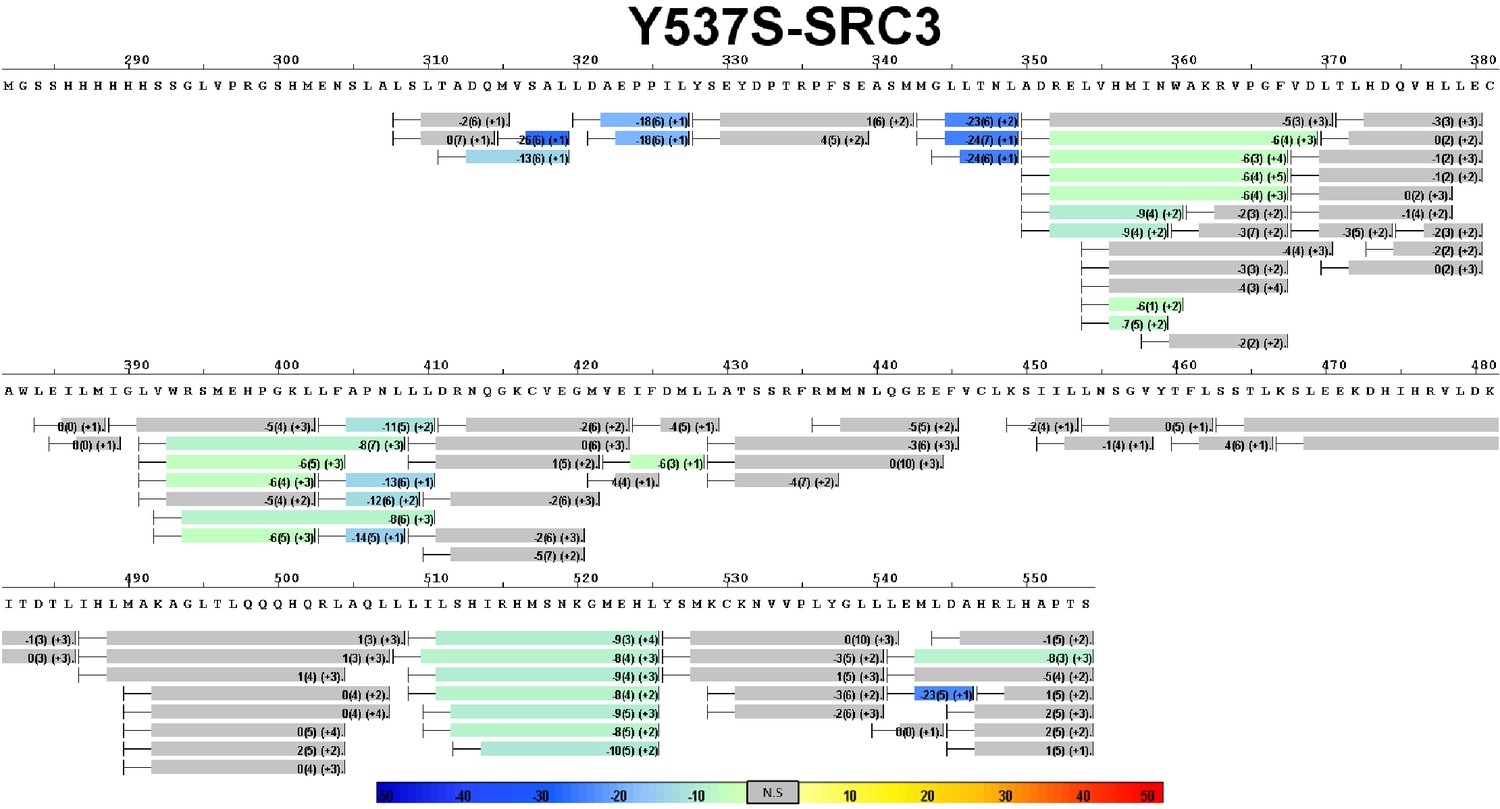
Complete differential HDX perturbation map of Y537S ERα LBD with SRC3-NRD.
https://doi.org/10.7554/eLife.12792.016
Figure 4—figure supplement 8
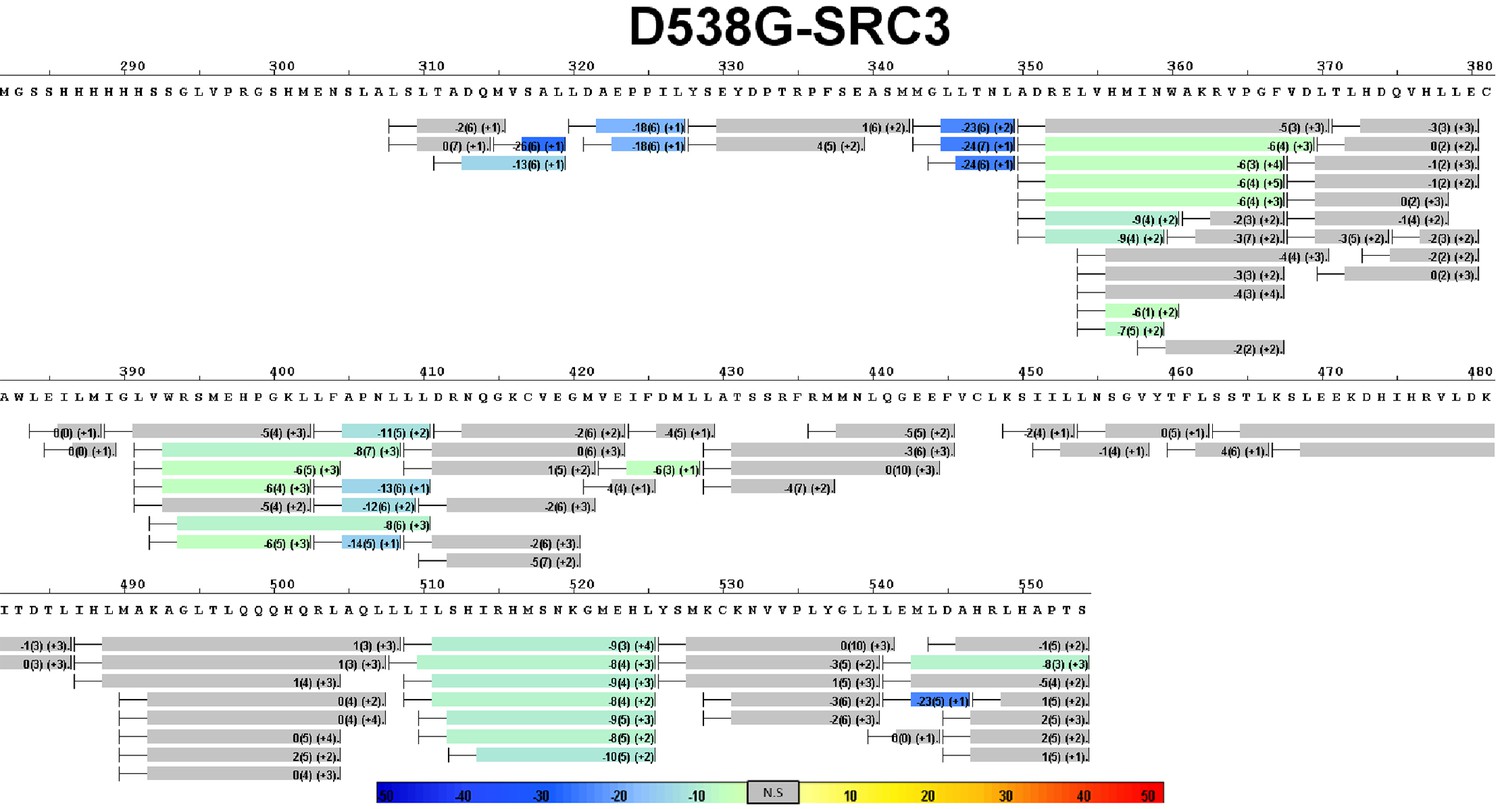
Complete differential HDX perturbation map of D538G ERα LBD with SRC3-NRD.
https://doi.org/10.7554/eLife.12792.017
Figure 4—figure supplement 9
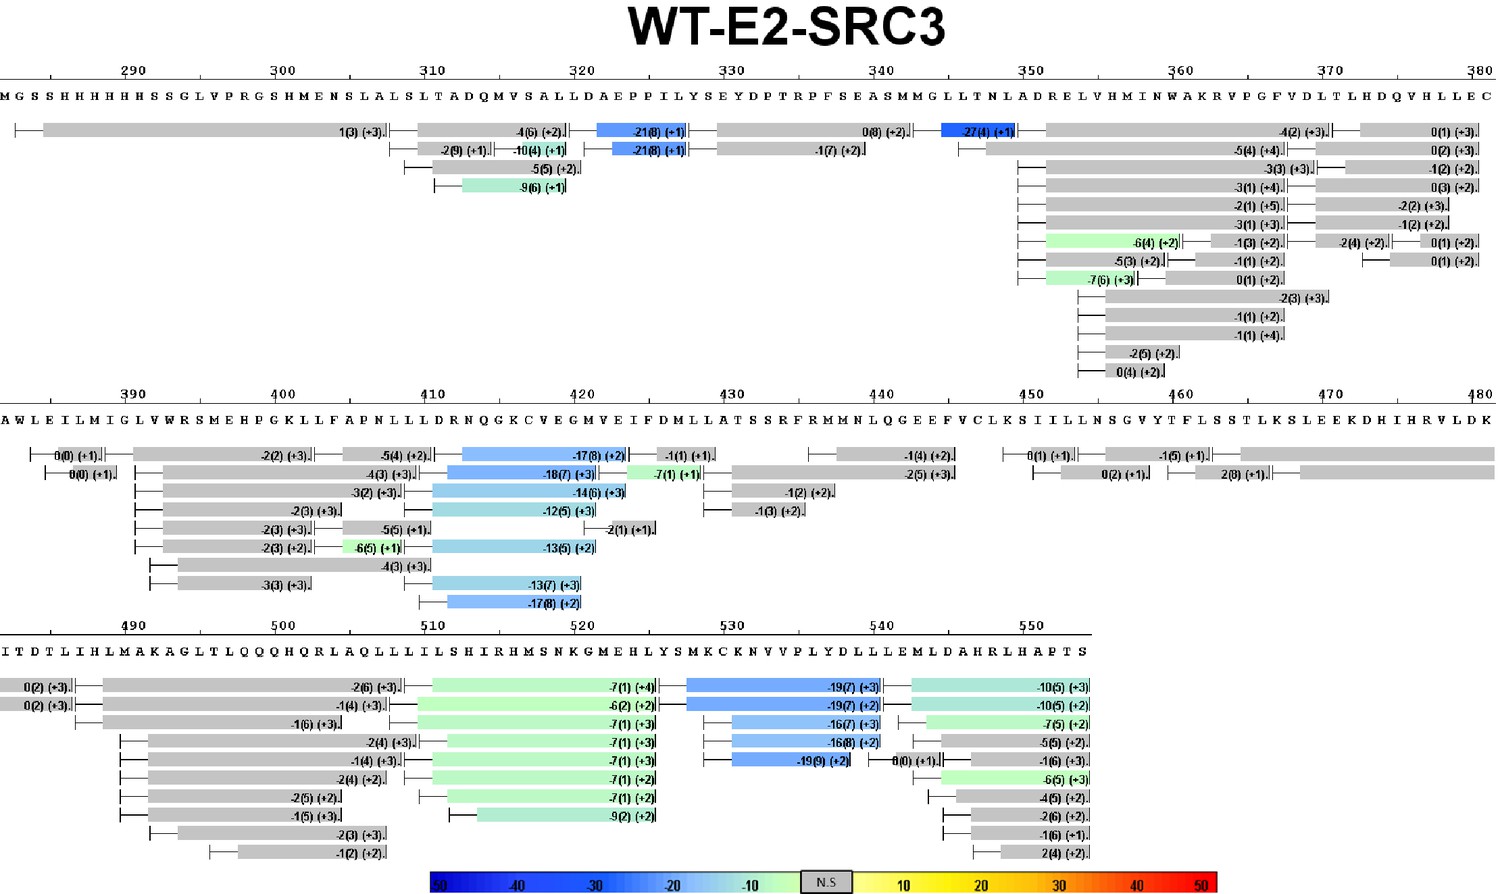
Complete differential HDX perturbation map of WT ERα LBD with E2 and SRC3-NRD.
https://doi.org/10.7554/eLife.12792.018
Figure 4—figure supplement 10
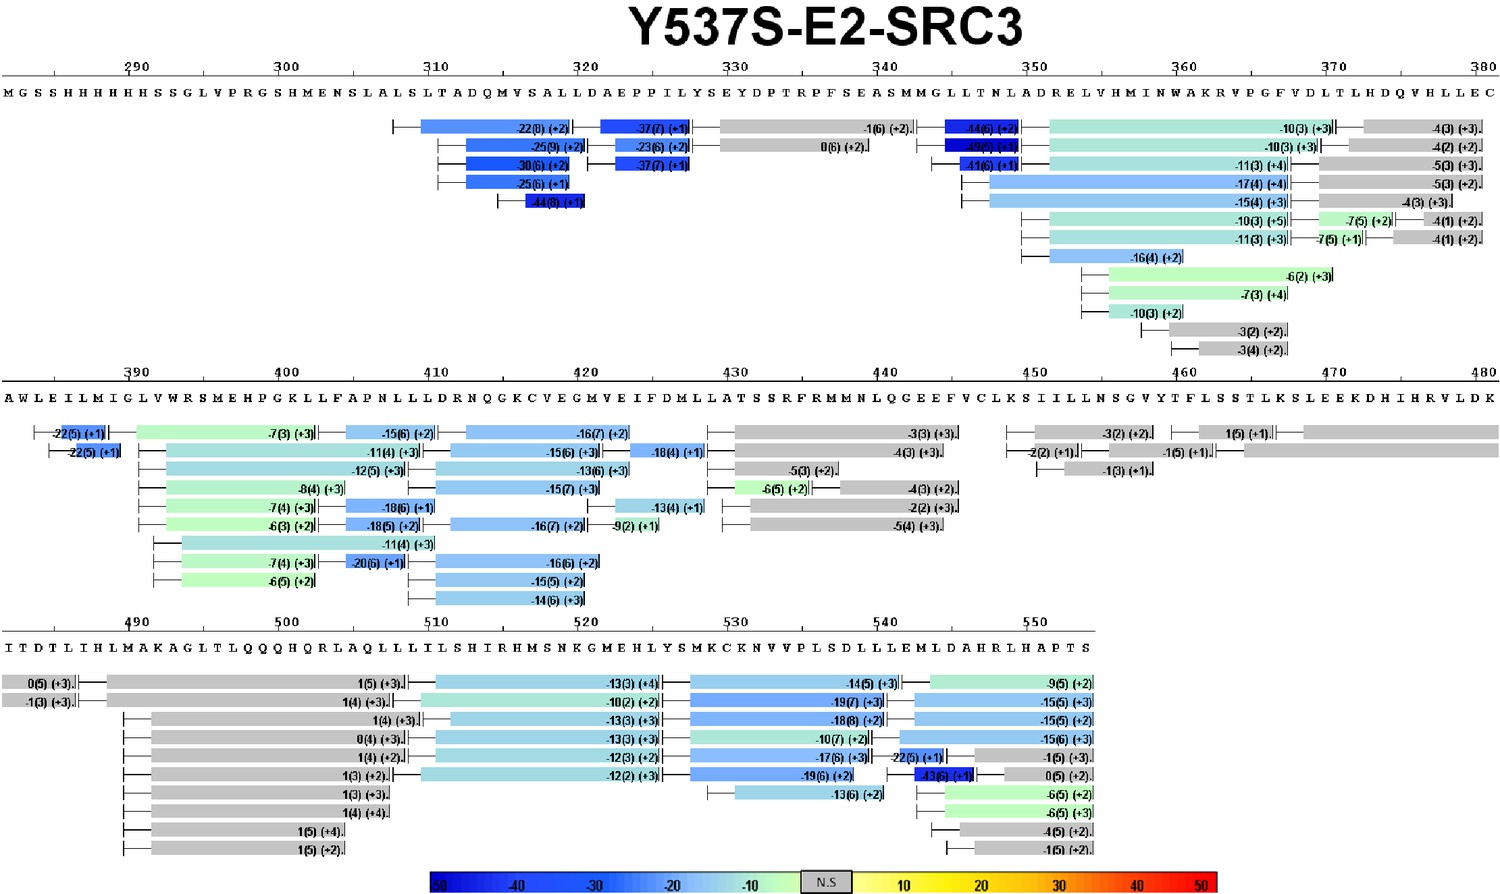
Complete differential HDX perturbation map of Y537S ERα LBD with E2 and SRC3-NRD.
https://doi.org/10.7554/eLife.12792.019
Figure 4—figure supplement 11
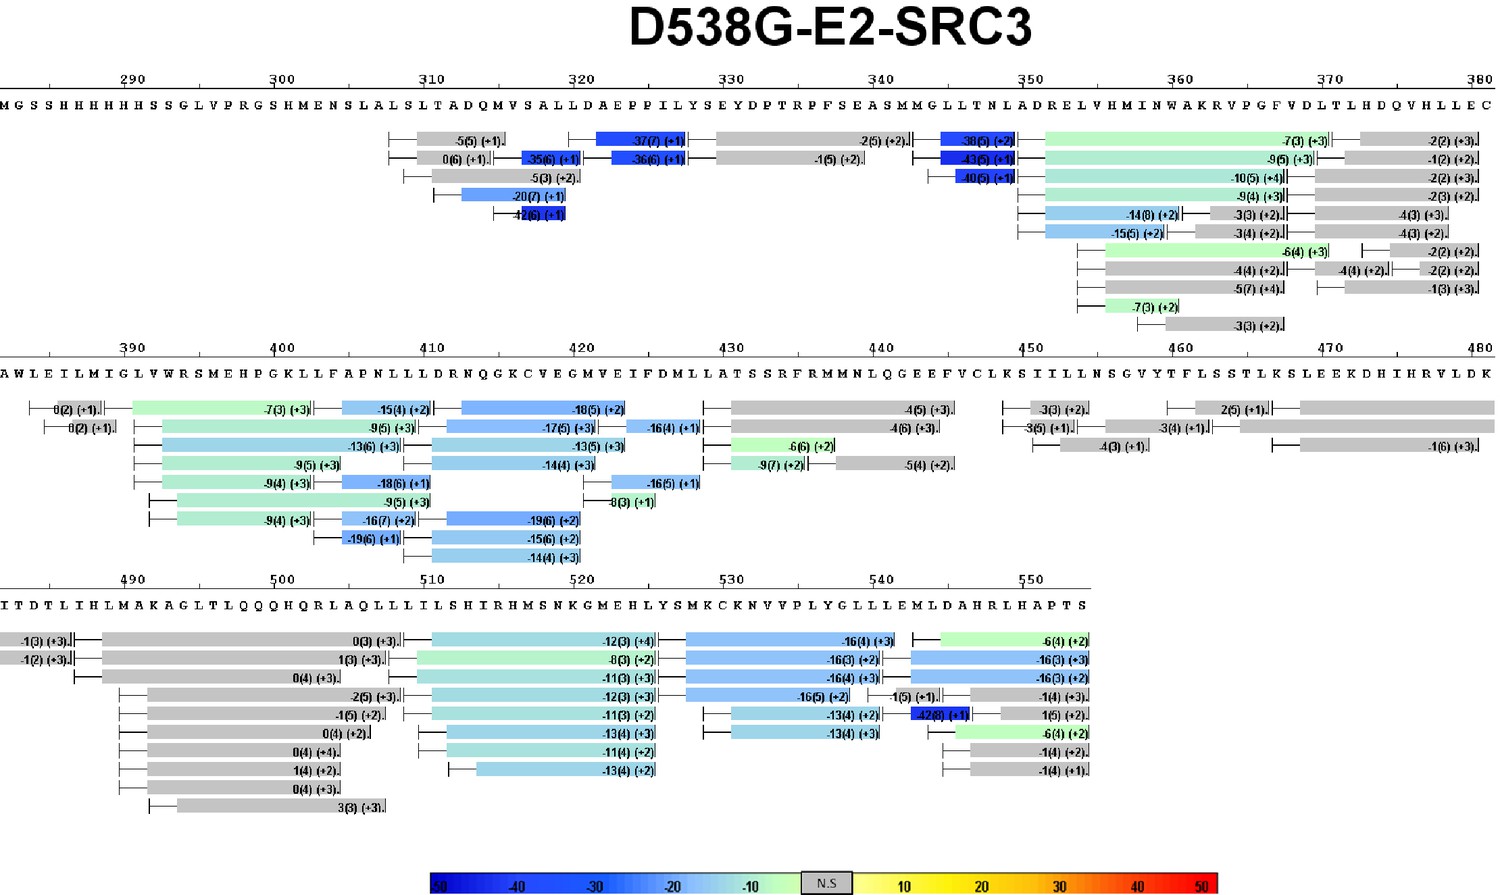
Complete differential HDX perturbation map of D538G ERα LBD with E2 and SRC3-NRD.
https://doi.org/10.7554/eLife.12792.020
Figure 4—figure supplement 12

apo Y537S x-ray crystal structure (Yellow) (PDB: 2B23) superimposed with WT-E2 complex structure (White) (PDB: 1GWR).
https://doi.org/10.7554/eLife.12792.021
Figure 5 with 3 supplements

Stabilized D538G agonist state.
Superposition stereo-view image of the residues comprising the H11-12 loop (531–537) of monomer A of the D538G-E2 (cyan) overlaid with monomer A of the WT-E2 structure (PDB: 1GWR). E2 is represented as green sticks. Coactivator peptide is shown as light-yellow ribbon.
Figure 5—figure supplement 1
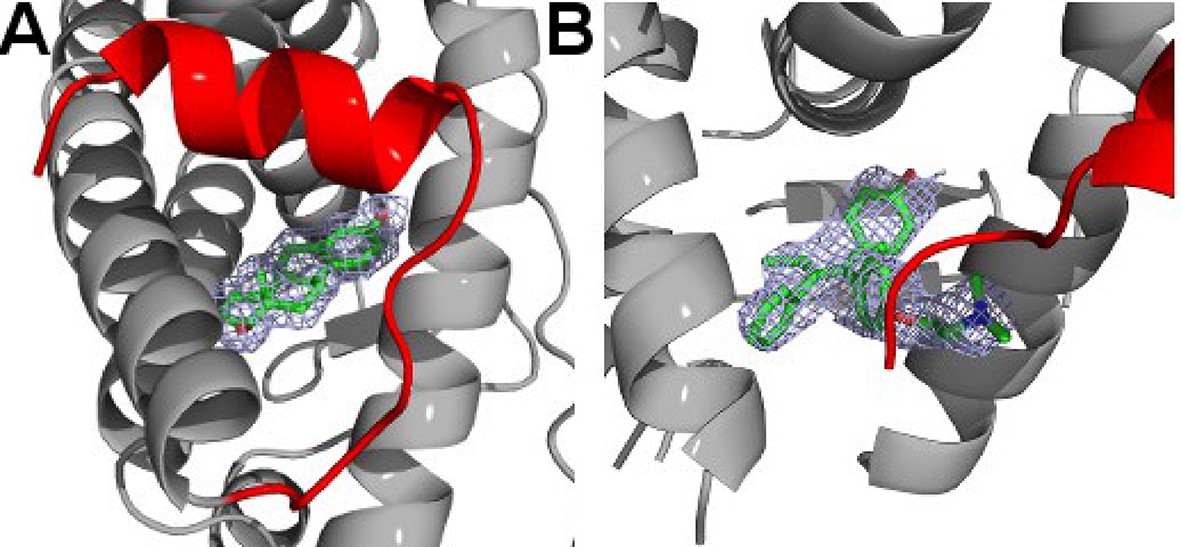
Simulated annealing composite omit maps for the E2 (A) and TOT (B)-bound D538G ERα LBD crystal structures contoured to 1.5σ.
E2 and TOT are shown as sticks, helix 12 is highlighted in red, and electron density is shown as a blue cage. LBD, ligand-binding domain.
Figure 5—figure supplement 2
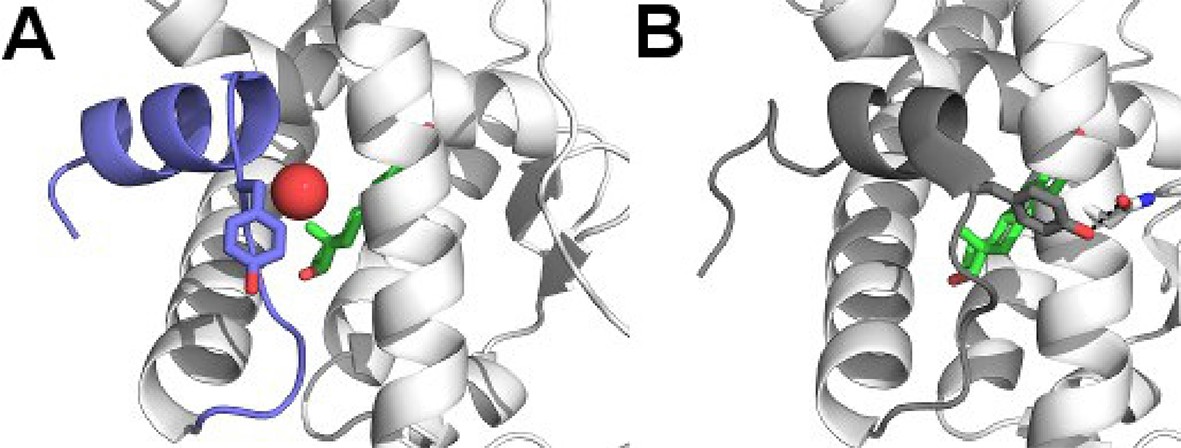
Y537 orientations for D538G and WT LBD.
(A) Y537 of the D538G-E2 structure rotates toward solvent and is replaced by a well ordered water molecule (sphere), location of the ligand-binding site is shown with estradiol as green sticks, H11-12 loop and H12 shown as dark-blue. (B) Y537 is buried toward Helix 3 in every WT structure, forming a hydrogen bond with N348 (PDB: 1GWR).
Figure 5—figure supplement 3

Density of an unidentified small molecule in the ligand-binding site of the apo D538G x-ray crystal structure.
https://doi.org/10.7554/eLife.12792.026
Figure 6
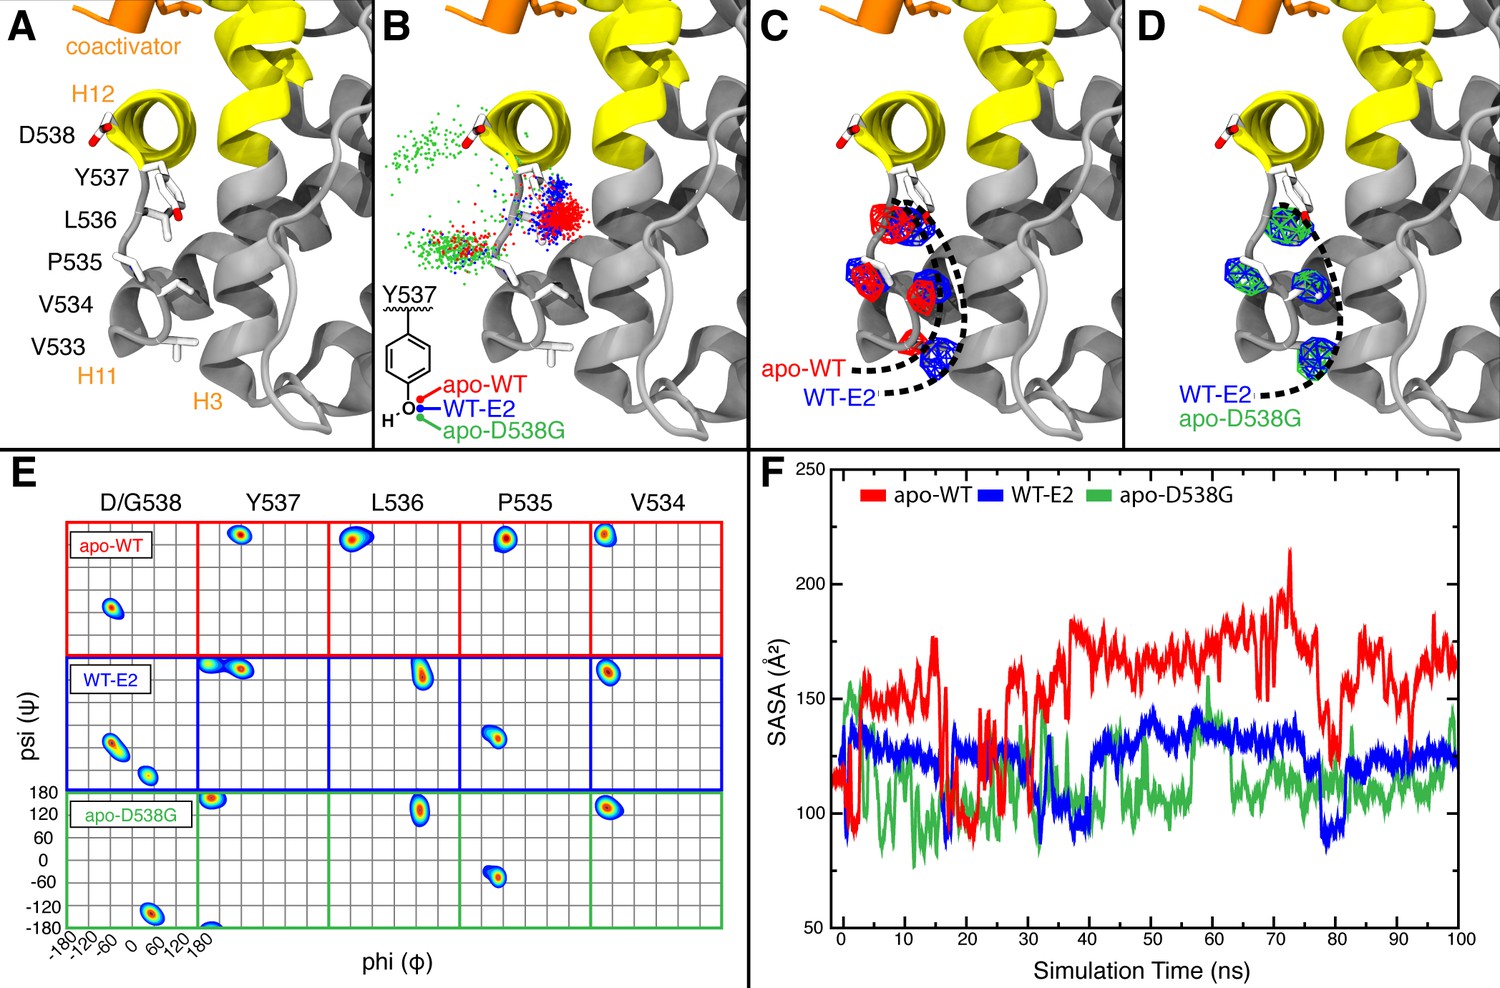
Visualization of H11-12 loop dynamics.
(A) H11-12 loop of WT ERα LBD-E2 complex. (B) Superimposing the position of the phenolic oxygen of Y537 at 0.1-ns intervals for apo WT (red), WT-E2 (blue), and apo D538G mutant (green). (C) Mapping the mass density isosurface (0.75, i.e., 25th percentile) of the hydrophobic side chains in the linker region (V533, V534, P535, and L536). (D) Side-chain packing of the apo D538G structure compared to WT-E2. (E) Ramachandran analysis of residues 534–538 for the apo WT, WT-E2, and apo D538G MD simulations. (F) Time series of the solvent accessible surface area (SASA) for hydrophobic loop residues (533–536). LBD, ligand binding domain.
Figure 7 with 6 supplements
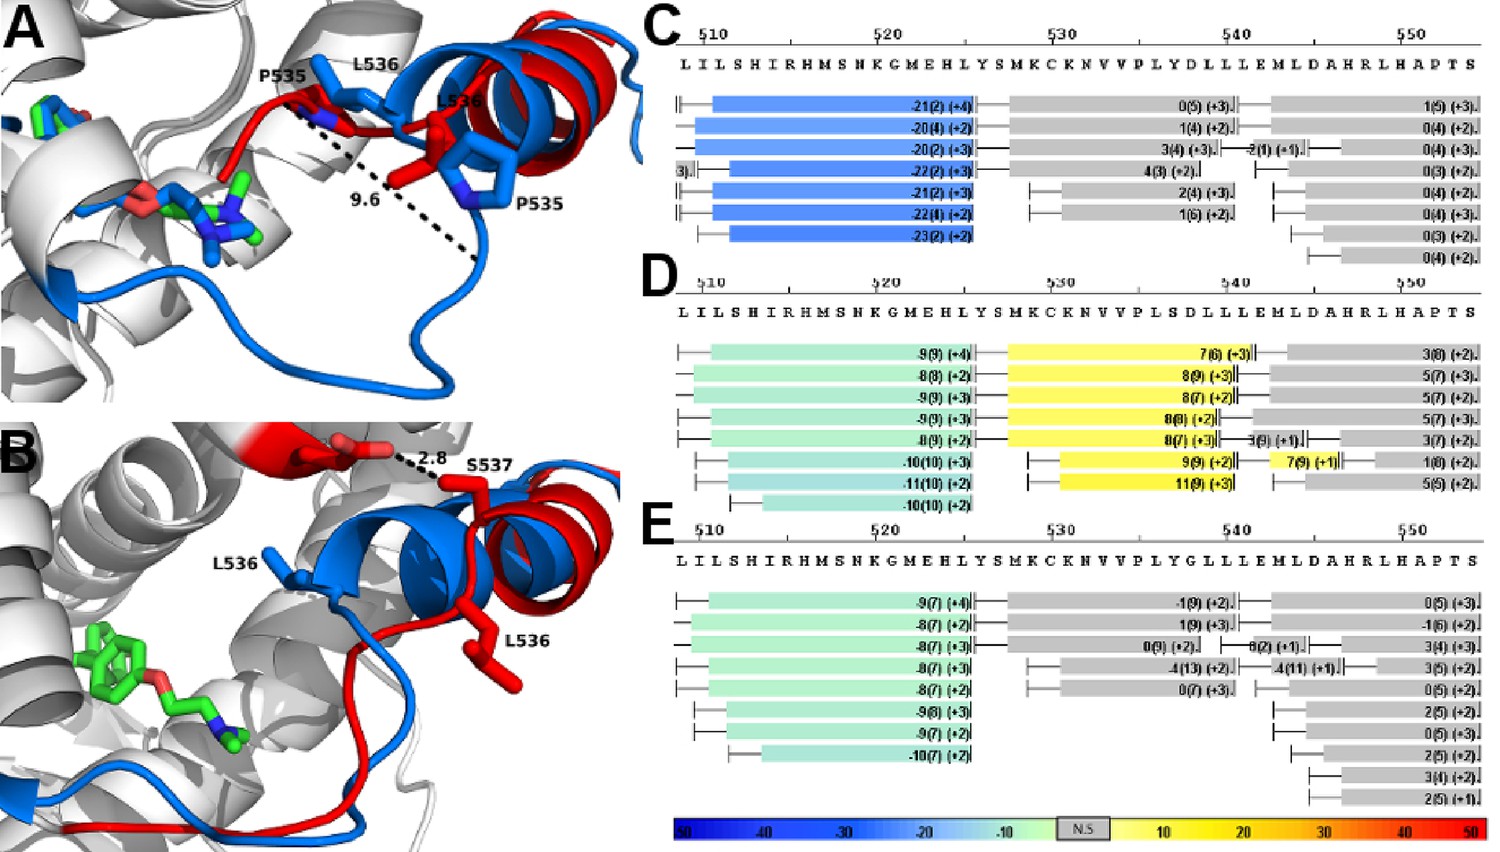
Alterations to the D538G and Y537S antagonist conformational states.
(A) Superposition of monomer A for the 538G-TOT structure with the WT (3ERT). TOT and residues 530–550 of the WT (blue) (PDB: 3ERT), TOT of D538G (green), residues 531–550 (red). (B) Predicted conformational alterations in H12 in the Y537S-TOT structure (red) compared to the WT-TOT (blue). (C) HDX-MS of the WT-TOT complex for H11 through H12 regions. (D) HDX-MS of Y537S-TOT complex for H11 through H12 regions. (E) HDX-MS of the D538G-TOT complex for H11 through H12 regions. HDX data is color coded as in 2C. See methods for more details on coloring scheme. HDX-MS, hydrogen/deuterium exchange mass spectrometry; LBD, ligand binding domain.
Figure 7—figure supplement 1
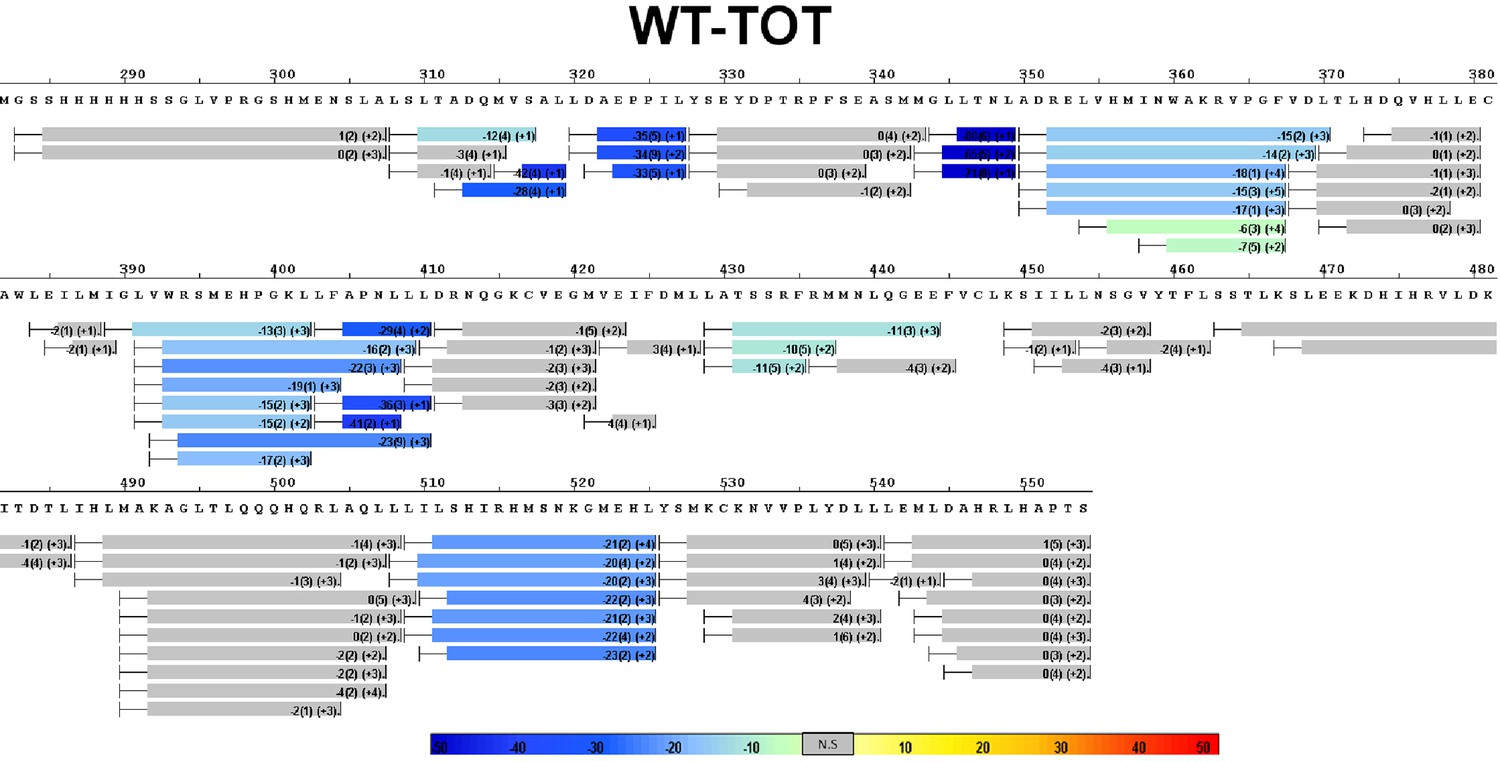
Complete differential amide HDX-MS map of WT ERα LBD binding to TOT.
https://doi.org/10.7554/eLife.12792.029
Figure 7—figure supplement 2
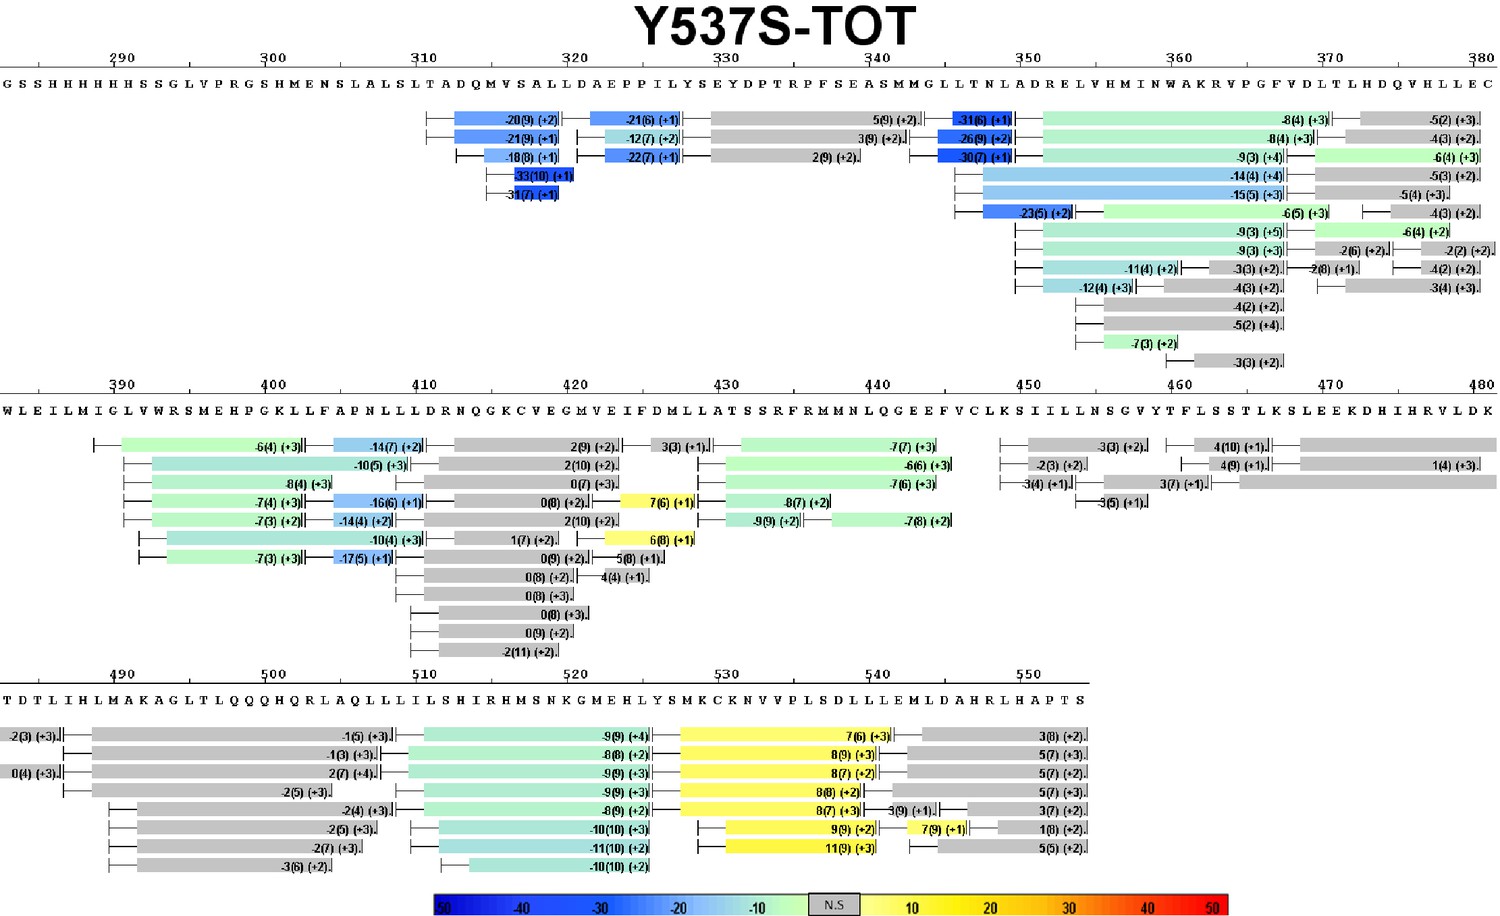
Complete differential amide HDX-MS map of Y537S ERα LBD mutant binding to TOT.
https://doi.org/10.7554/eLife.12792.030
Figure 7—figure supplement 3
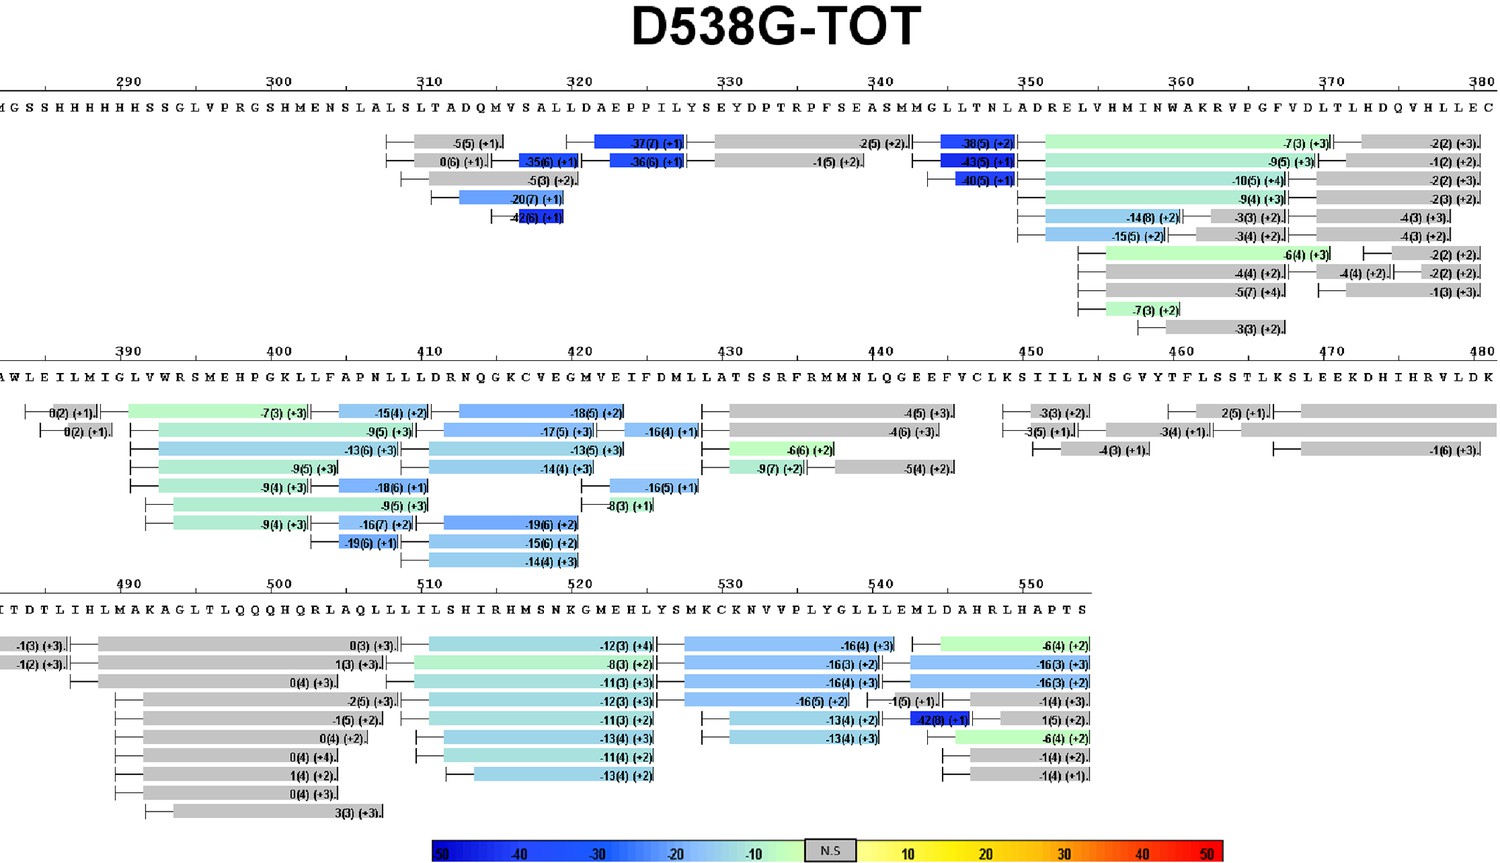
Complete differential amide HDX-MS map of D538G ERα LBD mutant binding to TOT.
https://doi.org/10.7554/eLife.12792.031
Figure 7—figure supplement 4
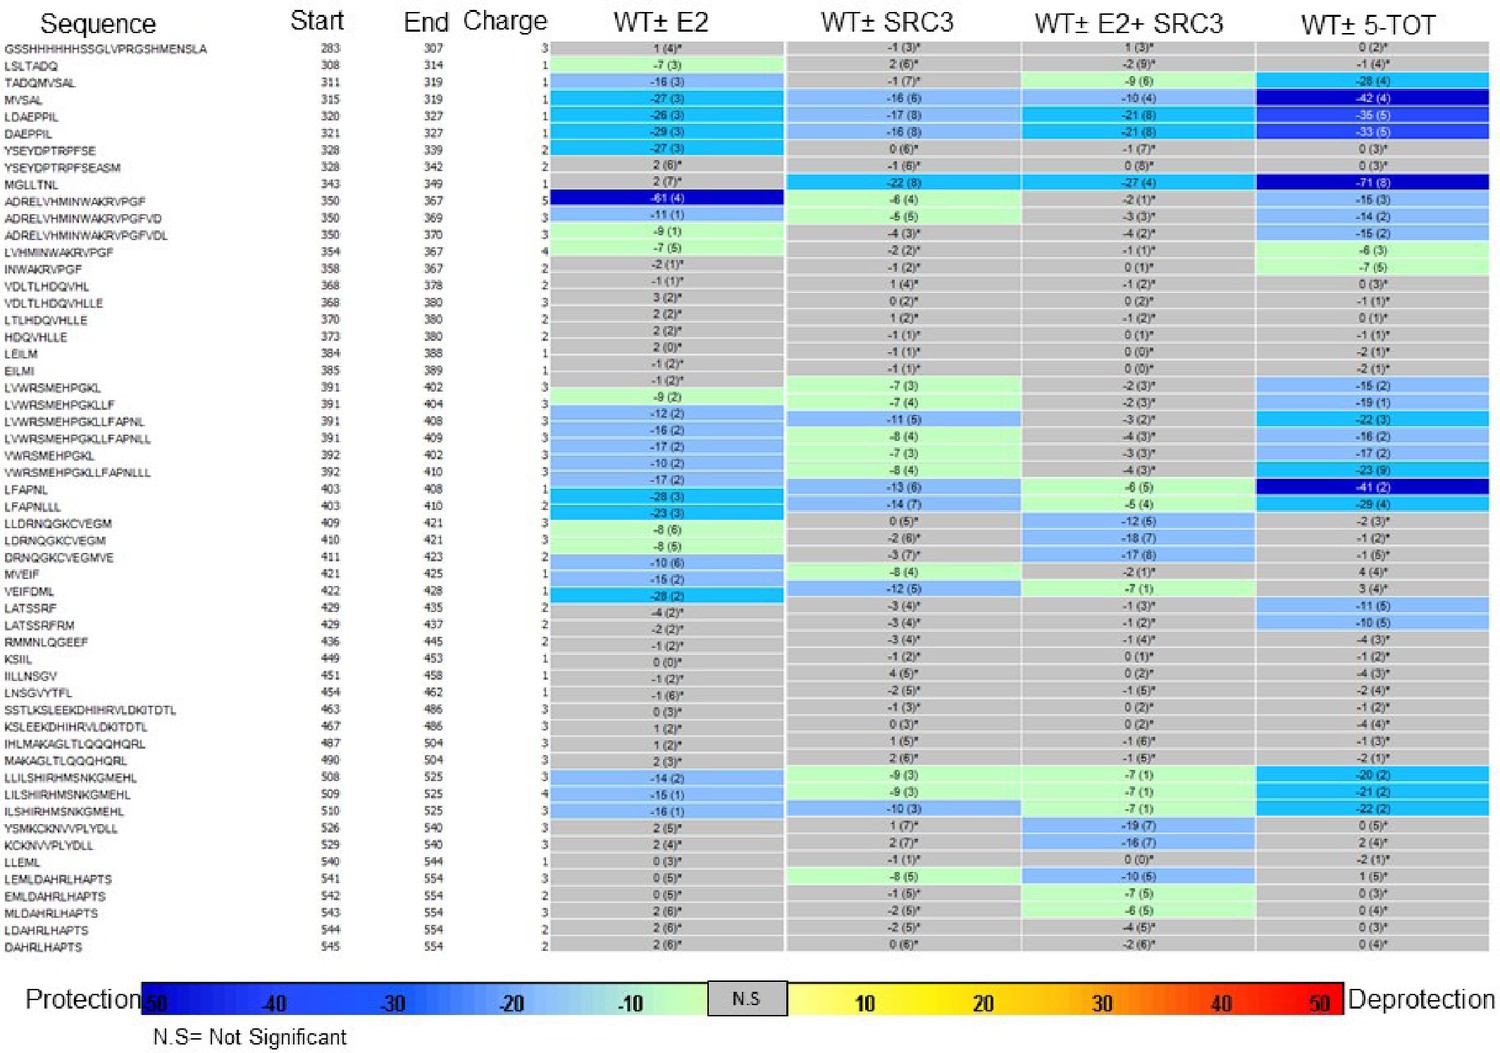
Experiment comparison view comparing the differential HDX behavior of apo WT ERα LBD in the presence of various ligands or coactivator.
https://doi.org/10.7554/eLife.12792.032
Figure 7—figure supplement 5
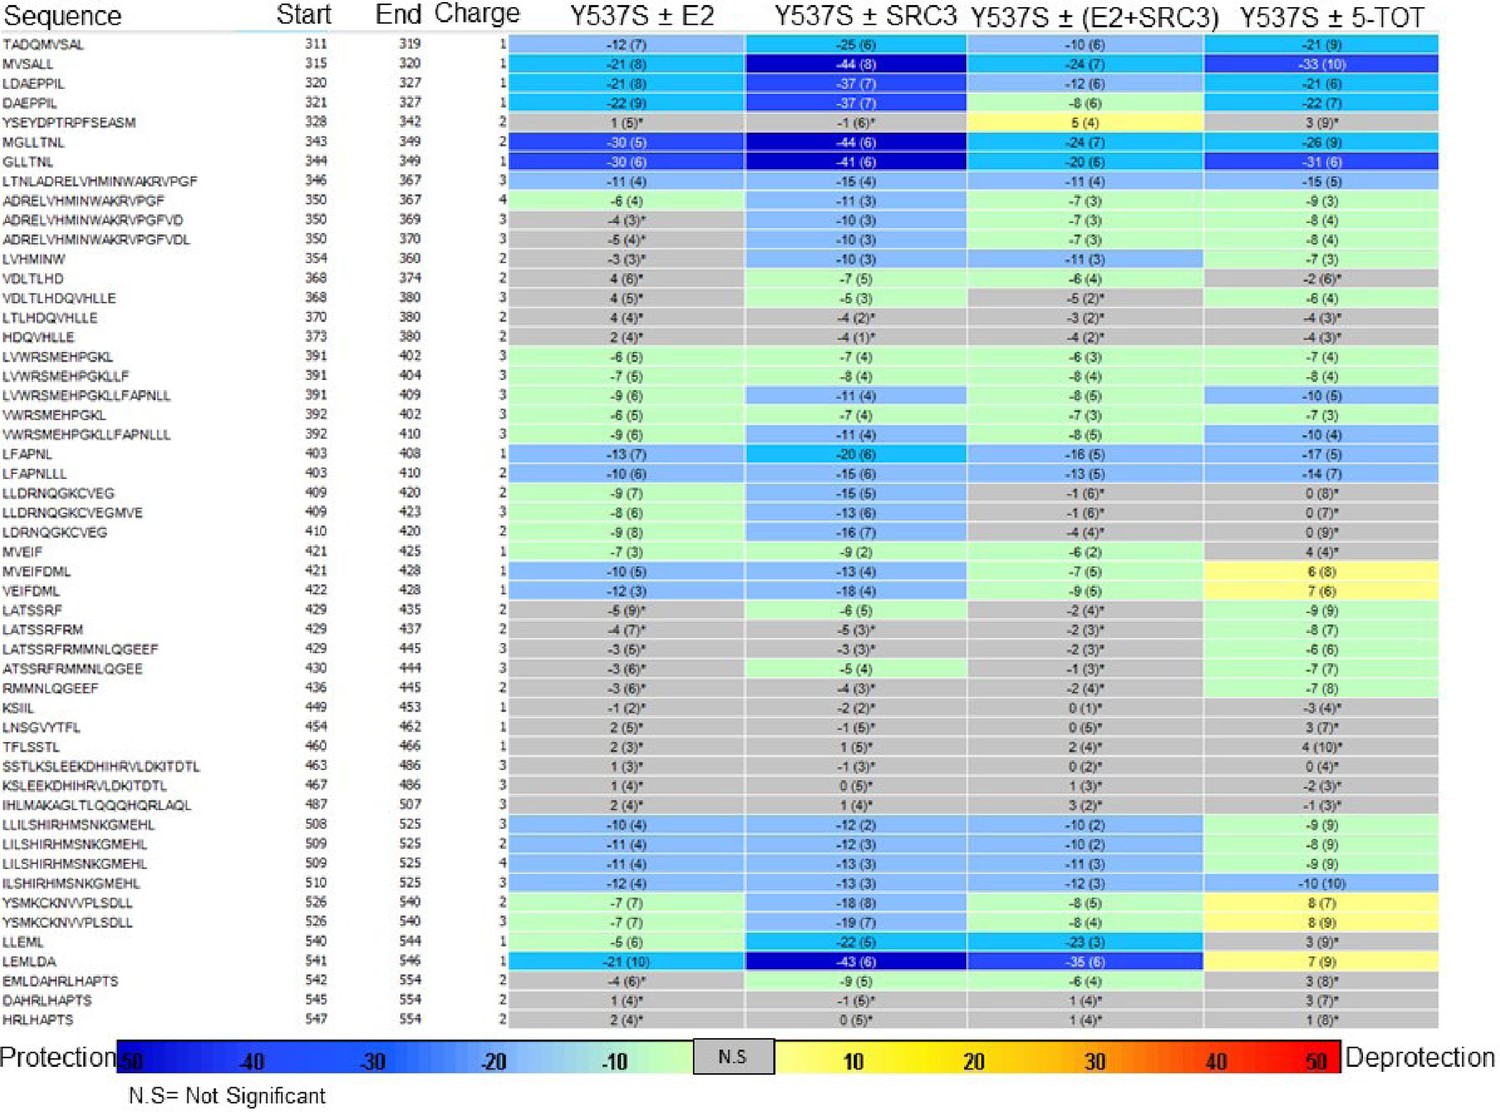
Experiment comparison view comparing the differential HDX behavior of apo Y537S ERα LBD in the presence of various ligands or coactivator.
https://doi.org/10.7554/eLife.12792.033
Figure 7—figure supplement 6
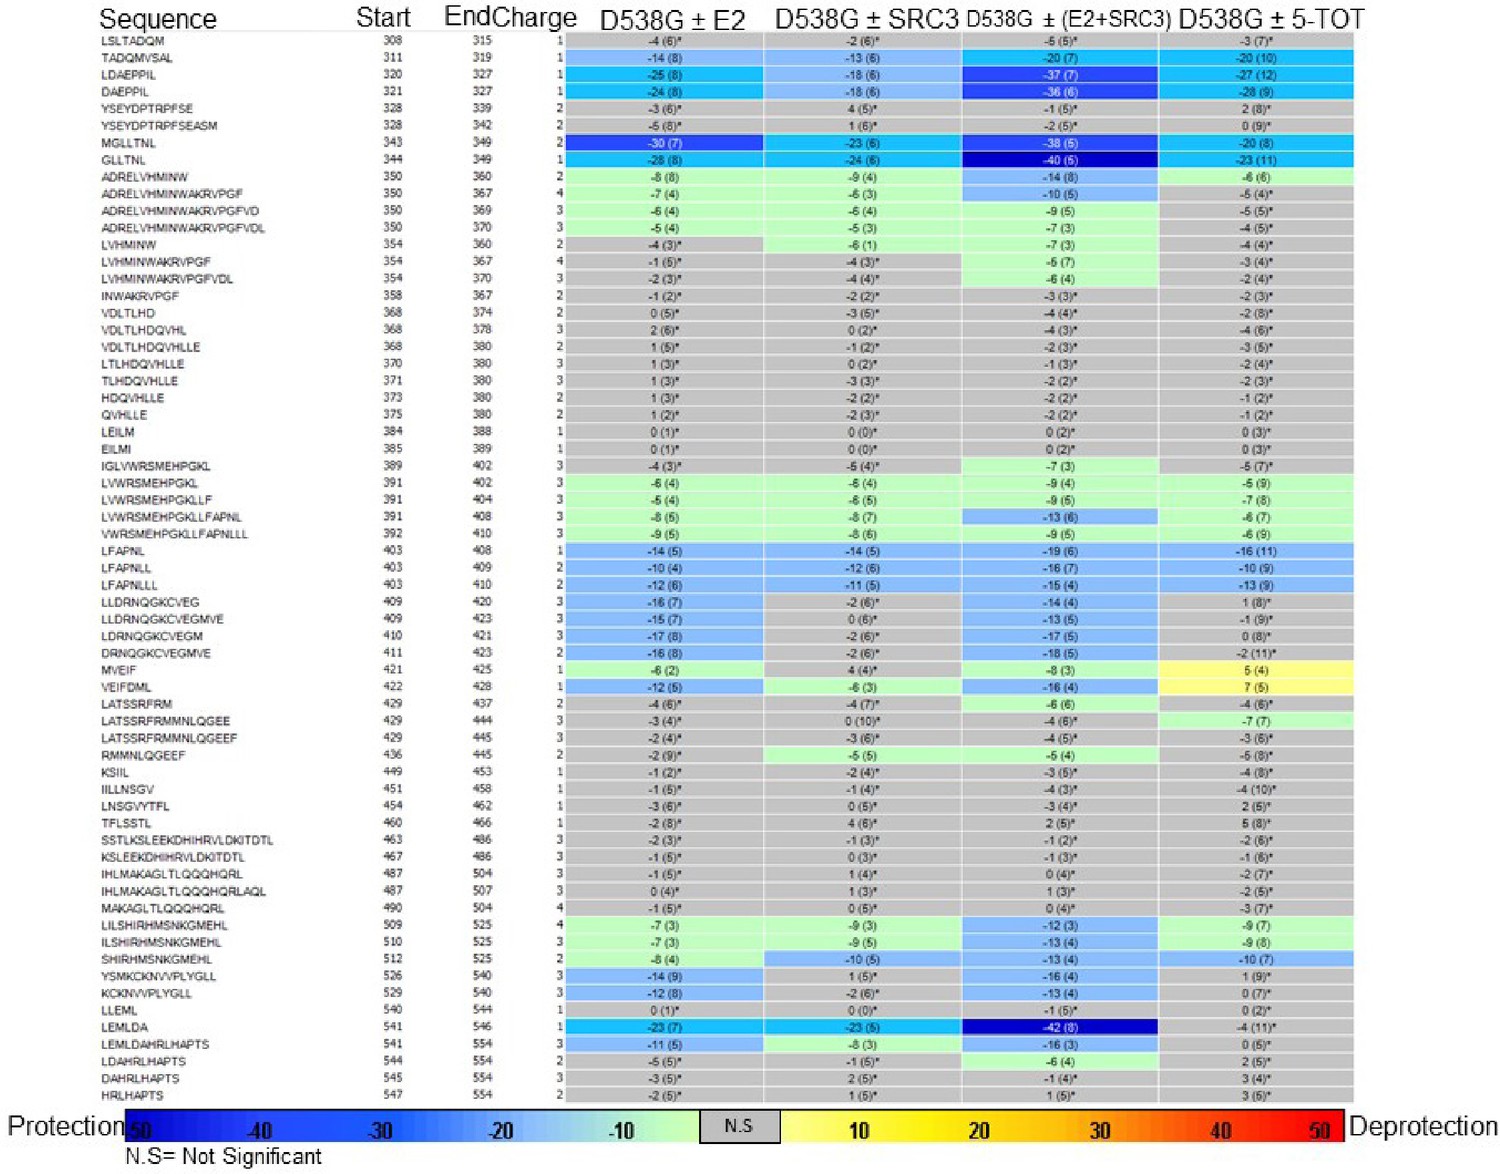
Experiment comparison view comparing the differential HDX behavior of apo D538G ERα LBD in the presence of various ligands or coactivator.
https://doi.org/10.7554/eLife.12792.034
Figure 8

Model of Aberrent ERα Mutant Activity.
Upon hormone binding (E2), WT ERα sheds heat-shock/chaperone proteins (HSP), forms head-to-head homodimers, and recruits coactivator (CoA) to become active. By contrast, Y537S or D538G ERα mutants adopt the active conformation in the absence of hormone to recruit CoA and achieve constitutive activity. Additionally, E2 binding may further increase mutant activity.
Tables
Table 1
SRC3 NRD and ligand recruitment affinities for the WT and mutant ERα LBDs. LBD, ligand-binding domain.
https://doi.org/10.7554/eLife.12792.003| SRC-3 NRD Kd (nM) | |
| WT apo | No Recruitment |
| Y537S apo | 13.6 ± 2.0 |
| D538G apo | 151 ± 20 |
| WT-E2 | 2.67 ± 0.5 |
| Y537S-E2 | 0.59 ± 0.1 |
| D538G-E2 | 3.65 ± 0.40 |
| E2 EC50 (nM) | |
| WT | 13.8 ± 0.9 |
| Y537S | 1.6 ± 1.2 |
| D538G | 2.2 ± 0.1 |
| TOT Ki (nM) | |
| WT | 1.82 ± 0.30 |
| Y537S | 6.7 ± 0.40 |
| D538G | 0.79 ± 0.04 |
Table 2
Ligand-binding affinities.
https://doi.org/10.7554/eLife.12792.007| Kd (nM) | |
| WT-E2 | 0.26 ± 0.13 |
| Y537S-E2 | 1.43 ± 0.55 |
| D537G-E2 | 1.30 ± 0.63 |
| Ki (nM) | |
| WT-TOT | 0.337 ± 0.018 |
| Y537S-TOT | 2.61 ± 0.60 |
| D538G-TOT | 3.42 ± 0.50 |
Table 3
Crystallographic data collection and refinement statistics.
https://doi.org/10.7554/eLife.12792.022| ERα LBD D538G Apo | ERα LBD D538G-E2 | ERα LBD D538G-4OHT | |
|---|---|---|---|
| Data collection | |||
| Space group | P21 | P21 | P212121 |
| a, b, c (Å) | 56.14, 82.66, 59.11 | 56.08, 84.18, 58.37 | 104.65, 104.65, 191.38 |
| α, β, γ (°) | 90.00, 111.05, 90.00 | 90.00, 108.83, 90.00 | 90.00, 90.00, 90.00 |
| Resolution range | 55.17-2.24 Å | 55.25-1.90 | 50.00-3.07 |
| Number of reflections | |||
| (all/unique) | 91,607/24,107 | 169,519/40,361 | 60,232/9,874 |
| I/σ (highest resolution) | 2.37 | 2.36 | 1.70 |
| Rmerge | 11.4 | 7.3 | 11.4 |
| Completeness (%) | 98.9 | 99.3 | 96.7 |
| Redundancy | 3.8 | 4.2 | 6.1 |
| Refinement | |||
| Rwork/Rfree | 19.8/24.9 | 17.9/21.4 | 21.6/28.3 |
| No. Residues/chain | |||
| ERα LBD D538G | 241 | 242 | 216 |
| GRIP peptide | 6 | 6 | 0 |
| Water | 16 | 44 | 2 |
| Ligand | 0 | 1 | 1 |
| RMSD | |||
| Bond lengths (Å) | 0.015 | 0.0170 | 0.0128 |
| Bond angles (°) | 1.76 | 1.5441 | 1.5356 |
| Chiral volume | 0.1117 | 0.1267 | 0.1036 |
| Ramachandran plot statistics | |||
| Preferred number (%) | 428 (96.40%) | 443 (98.88%) | 1,563 (95.42%) |
| Additional allowed (%) | 3.60 (3.6%) | 5 (1.12% ) | 75 (4.58%) |
| Outliers (%) | 0 | 0 | 0 |
Table 4
Protonation states of histidines for the structure used in MD simulations.
https://doi.org/10.7554/eLife.12792.036| HIS residue number | Monomer A | Monomer B |
|---|---|---|
| 356 | HSE | HSD |
| 373 | HSD | HSE |
| 377 | HSE | HSD |
| 398 | HSP | HSP |
| 474 | HSE | HSE |
| 476 | HSE | HSE |
| 488 | HSE | HSE |
| 501 | HSD | HSE |
| 513 | HSD | HSD |
| 516 | HSE | HSE |
| 524 | HSE | HSE |
| 547 | HSE | HSE |
Download links
A two-part list of links to download the article, or parts of the article, in various formats.
Downloads (link to download the article as PDF)
Open citations (links to open the citations from this article in various online reference manager services)
Cite this article (links to download the citations from this article in formats compatible with various reference manager tools)
Estrogen receptor alpha somatic mutations Y537S and D538G confer breast cancer endocrine resistance by stabilizing the activating function-2 binding conformation
eLife 5:e12792.
https://doi.org/10.7554/eLife.12792


