Degradation of Gadd45 mRNA by nonsense-mediated decay is essential for viability
- University of Utah, United States
Figures
Figure 1 with 4 supplements
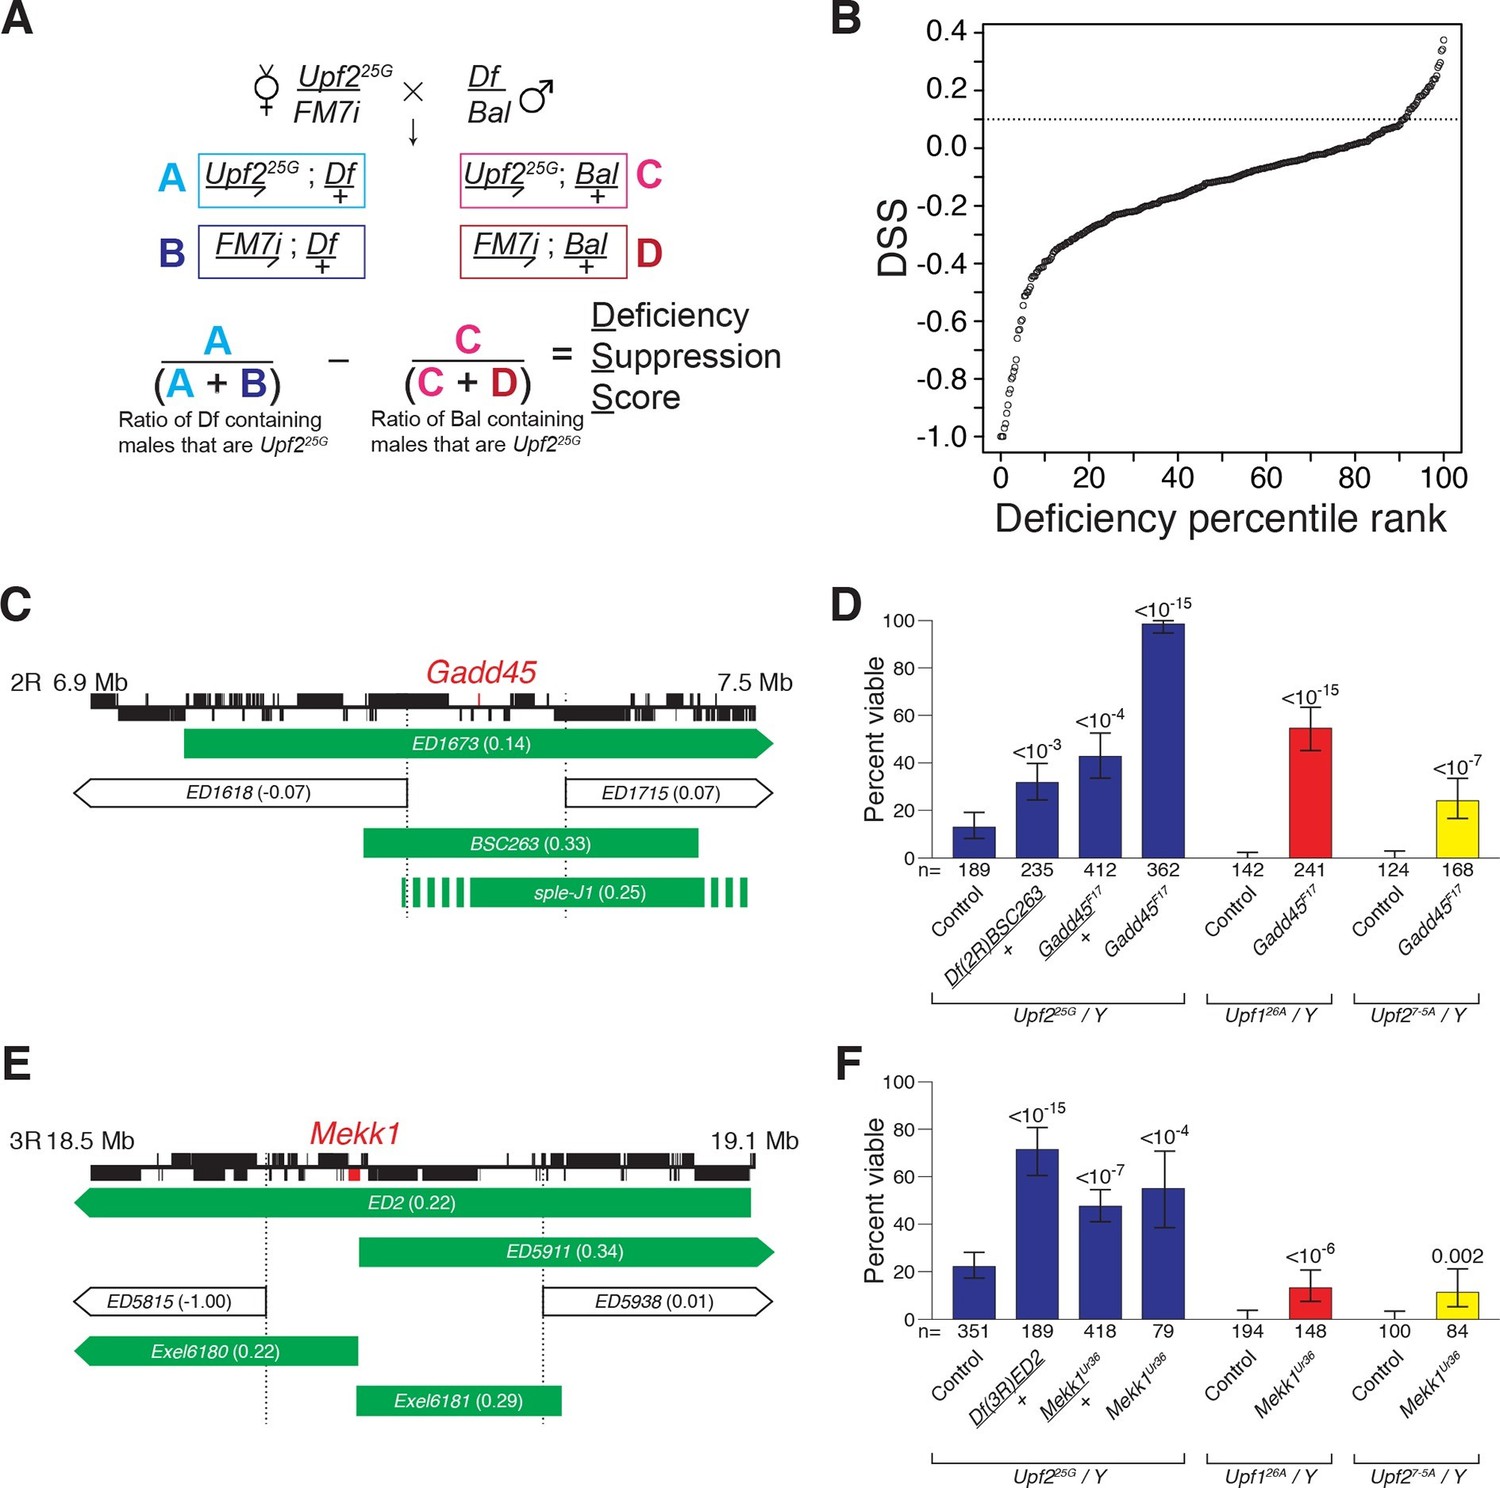
Drosophila suppressor screen identifies the Gadd45 pathway as the inducer of NMD-mutant lethality.
(A) Scheme to screen deficiencies for the suppression of Upf225G partial lethality. The Deficiency Suppression Score (DSS) represents the relative difference in Upf225G viability when crossed to a heterozygous deficiency (Df) compared to when crossed to a balancer (Bal) (See Methods). (B) DSS from 376 screened deficiencies ranked by score. A DSS greater than 0.1 (dotted line) indicates that deficiency suppresses Upf225G lethality. (C and E) Candidate suppressing regions uncovering Gadd45 (C) and Mekk1 (E). DSSs are shown in parenthesis. Dotted lines denote extent of regions deleted by suppressing deficiencies but not non-suppressing deficiencies. Filled blocks on chromosomes indicate predicted gene spans, Gadd45 pathway genes are indicated in red; suppressing deficiencies indicated in green, sple-J1 has undefined breakpoints located within hashed regions. (D and F) NMD mutant adult viability in combination with Gadd45F17 (D) or Mekk1Ur36 (F) mutants. Upf126A and Upf27-5A are null alleles (Frizzell et al., 2012; Metzstein and Krasnow, 2006). p-value compared to controls determined by the test of equal or given proportions indicated. Error bars represent 95% confidence interval of the binomial distribution. n equals total number of animals scored in each cross.
Figure 1—figure supplement 1

Reduced expression of specific loci, not overall mRNA abundance, produces NMD mutant suppression by deficiencies.
(A) Map of 376 autosomal DrosDel deficiencies with an isogenic background and molecularly defined breakpoints (Ryder et al., 2007) and eight other deficiencies used to further test candidate suppressing regions without overlapping DrosDel deficiencies. 39 total deficiencies suppress Upf225G lethality, shown in green. Regions deleted by any non-suppressing deficiencies were eliminated as candidate suppressing regions, removing false positives and reducing the size of the candidate intervals. The three candidate suppressing regions that are deleted only by suppressing deficiencies are indicated in black and labeled 1–3. (B) Each deficiency’s Deficiency Suppression Score (DSS) compared to percent increase in RNA abundance in Upf225G compared to wild-type from loci removed by that deficiency according to RNA-seq from Chapin et al. (2014). Trend line in red; statistics calculated using Pearson correlation test.
Figure 1—figure supplement 2
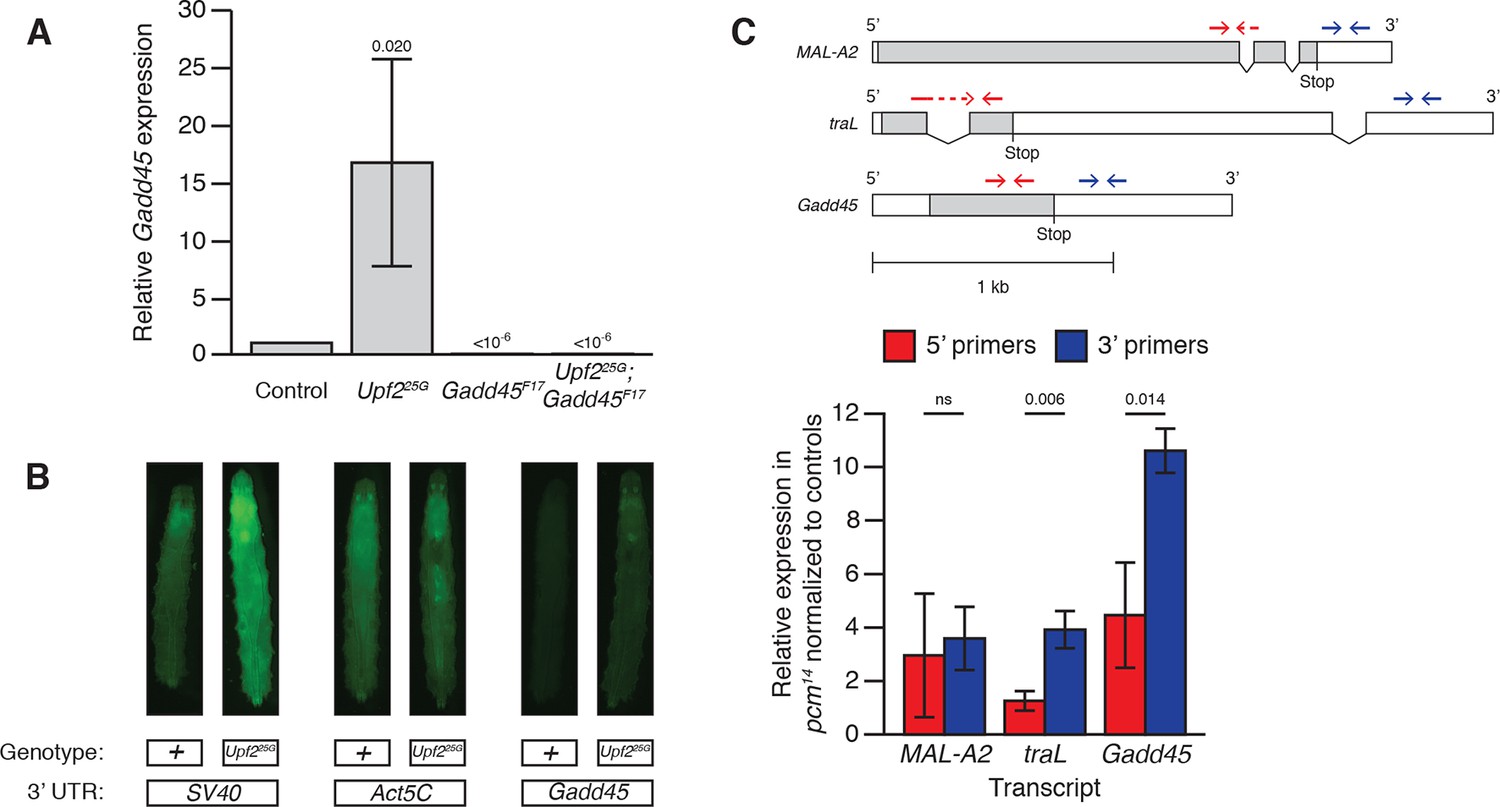
Drosophila Gadd45 is an endogenous direct NMD target.
(A) Gadd45 mRNA expression in adults of the given genotypes measured by qRT-PCR. Gadd45 mRNA expression is increased 16.7-fold in Upf225G mutants, and is eliminated by Gadd45F17 mutants. p-values display one-sided Student’s t-test of indicated condition compared to control. Error bars represent 2 SEM. (B) Fluorescence of GFP transgenes with SV40, Act5C, or Gadd45 3’ UTRs expressed by UAS driven by Actin:GAL4 in Upf2+ or Upf225G third instar larvae. SV40 and Gadd45 3’ UTR constructs show significantly increased fluorescence in Upf225G animals compared to Upf2+, indicating NMD-dependent post-transcriptional degradation of mRNAs containing these UTRs. The Act5C 3’ UTR construct has similar fluorescence in both backgrounds, indicating NMD does not regulate the post-transcriptional stability of this UTR. Micrographs show dorsal views with anterior at top. (C) MAL-A2, traL, and Gadd45 5’ and 3’ fragment mRNA expression measured by qRT-PCR in pcm14 null mutants (Waldron et al., 2015) normalized to controls. Transcript structures of a non-NMD-target, maltase A2 (MAL-A2); a known NMD-targeted transcript, the non-sex specific isoform of transformer (traL) (Rehwinkel, 2005; Metzstein and Krasnow, 2006); and the Gadd45 transcript (note Gadd45 has no introns). Open boxes indicate UTRs; grey boxes indicate coding regions. NMD targeting initiates endonucleolytic cleavage near the stop codon (Gatfield and Izaurralde, 2004), producing 5’ and 3’ fragments with unprotected ends, which are then subjected to degradation by cytoplasmic 3’-to-5’ and 5’-to-3’ exonucleases, respectively. qRT-PCR primer pairs 5’ (red) and 3’ (blue) to the cleavage site can be used to differentially measure the quantity of these fragments. The Drosophila 5’-to-3’ exonuclease is encoded by the XRN1 homologue pacman (pcm), and fragments 3’ to an endonucleolytic NMD cleavage accumulate in Drosophila cells with reduced XRN1 activity (Gatfield and Izaurralde, 2004). The MAL-A2 3’ primers show no difference in relative expression in pcm14 mutants compared to the 5’ primers, while tra and Gadd45 have relatively increased levels of a 3’ fragment in pcm14 mutants, revealing endonucleolytic cleavage has occurred between the primer pairs, probably near the stop codon, indicative of NMD-initiated degradation. p-value between indicated samples using a two-sided Student’s t-test are displayed. ns indicates a p-value greater than 0.05. Error bars represent 2 SEM.
Figure 1—figure supplement 3

F17 is a null allele of Gadd45.
(A) Gadd45F17 is an imprecise excision of the P-element P{EPg}HP20647, deleting a 894 bp region that includes the entire Gadd45 coding region. Gadd45E8 is a precise excision of the same P-element, leaving Gadd45 intact. Coding region in grey; untranslated regions in white. Arrowhead indicates direction of transcription. (B) Adult viability of control and Gadd45F17mutants. p = 0.4463 between Gadd45F17 and controls, using the test of equal or given proportions. Error bars represent 95% confidence interval of the binomial distribution. n equals total number of animals scored in each cross.
Figure 1—figure supplement 4
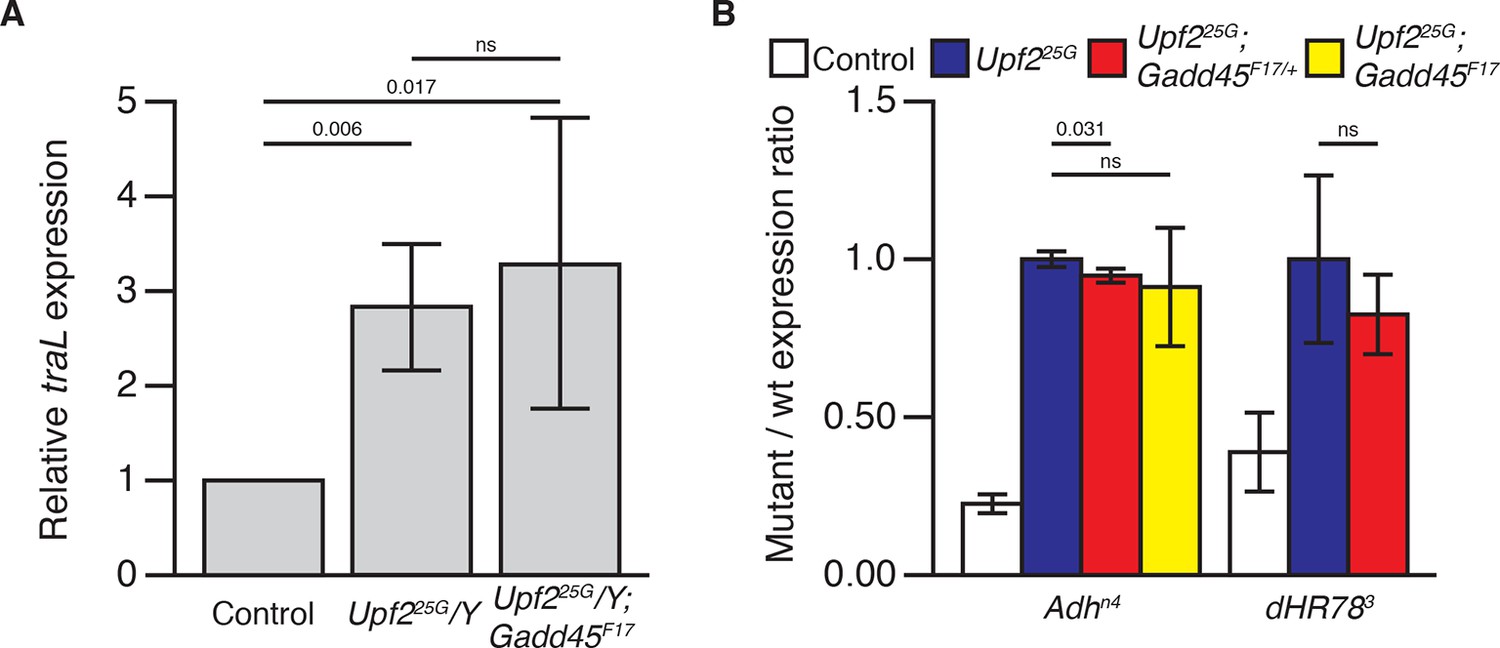
Loss of Gadd45 does not restore NMD activity in NMD mutants.
(A) Expression of the endogenous NMD target transcript traL (Rehwinkel, 2005; Metzstein and Krasnow, 2006) in control male, Upf225G/Y, and Upf225G/Y; Gadd45F17animals, measured by qRT-PCR. There is no significant difference in traL expression between Upf225G/Y and Upf225G/Y; Gadd45F17animals. p-values determined by one-sided Student’s t-test between indicated conditions are displayed. ns indicates a p-value greater than 0.05. (B) Relative abundance of PTC-containing Adhn4 (Chia et al., 1987) and dHR783 (Fisk and Thummel, 1998) allele mRNAs compared to wild-type allele mRNA abundance in animals heterozygous for Adhn4or dHR783in each indicated genotype (stabilization of dHR783 was not determined in Upf225G/Y; Gadd45F17 animals). Neither reduction nor elimination of Gadd45 restored destabilization of these alleles. p-values determined by two-sided Student’s t-test between indicated conditions are displayed. ns indicates a p-value greater than 0.05. Error represents 2 SEM.
Figure 2 with 1 supplement
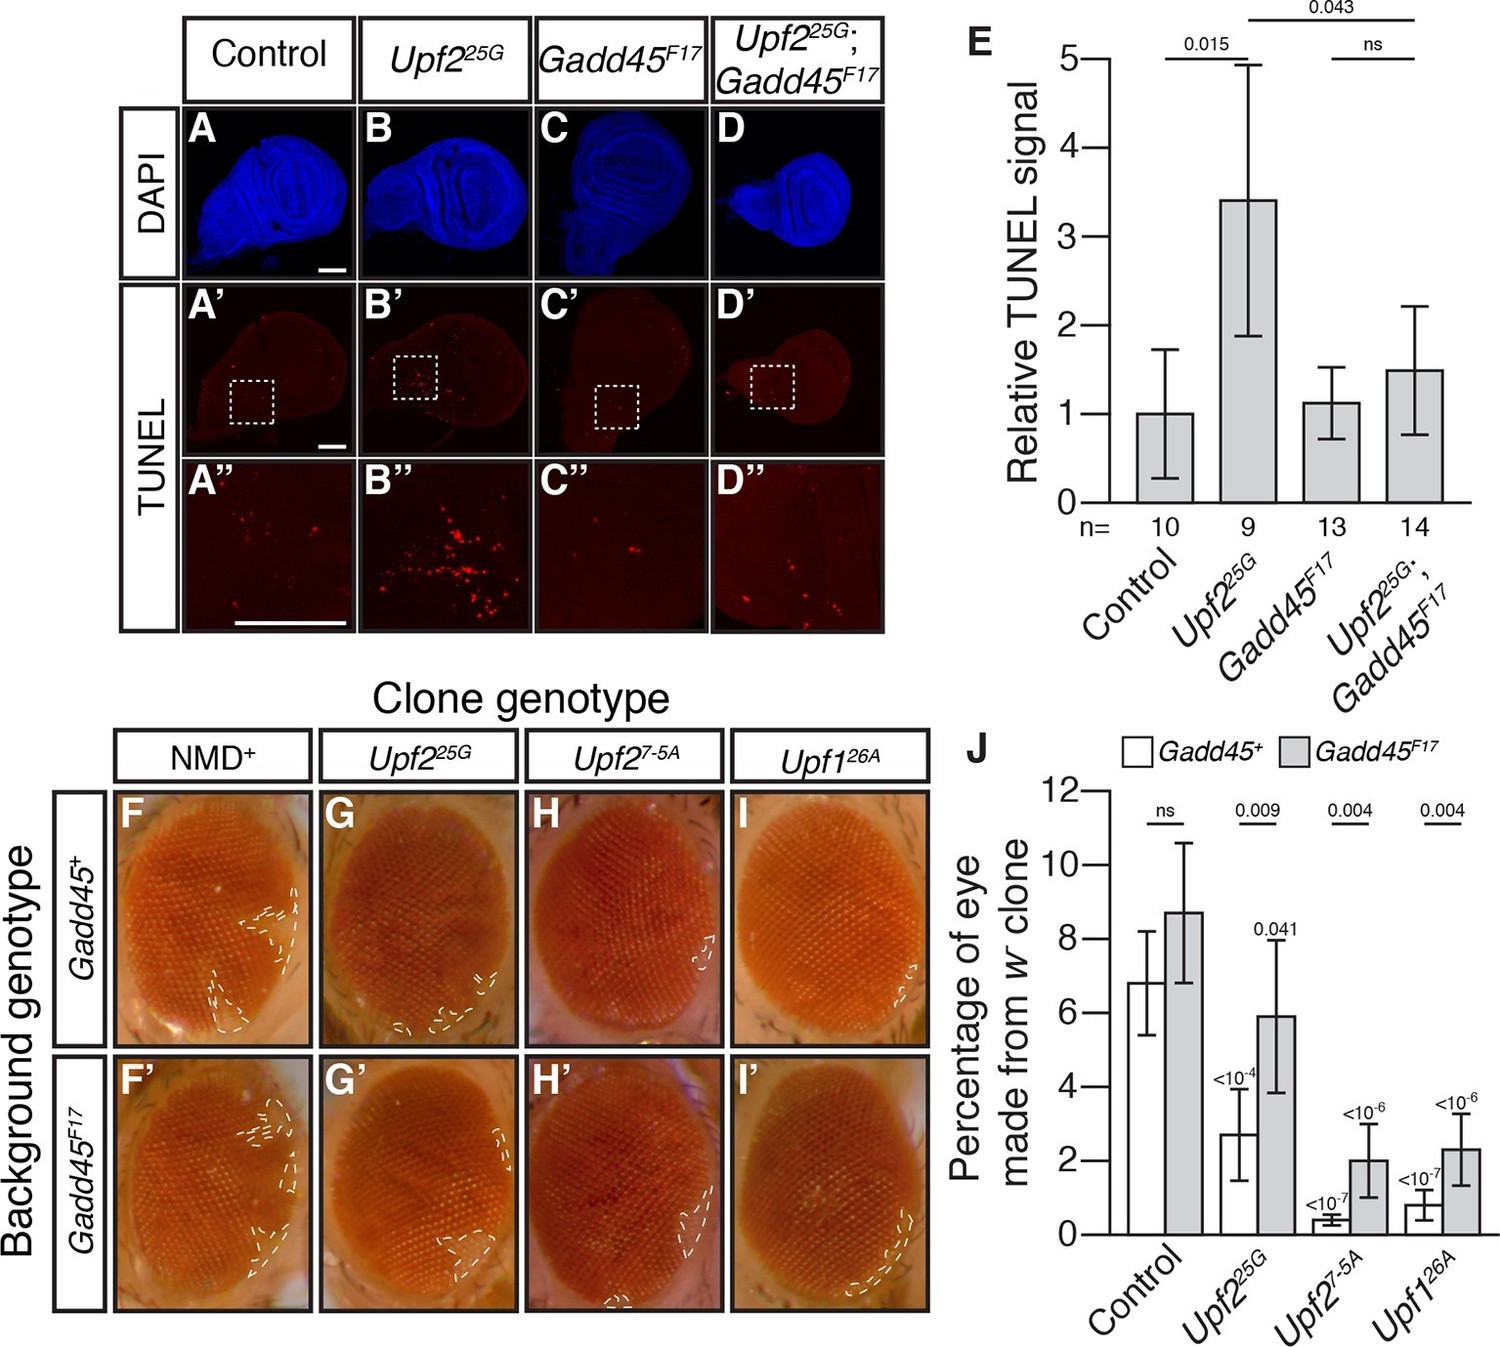
Loss of Gadd45 suppresses NMD-mutant cell death.
(A to D) DAPI (blue) and (A’to D’) TUNEL (red) staining in late 3rd instar larval wing discs from control (A); Upf225G (B); Gadd45F17 (C); and Upf225G; Gadd45F17 (D) animals. (A’’ to D’’) are 4x view of outlined section at the base of the blade of the wing disc from A’-D’, respectively. Scale bar represents 100 μm. (E) Relative TUNEL signal in control and mutant wing discs, normalized to control. p-value between indicated samples using a two-sided Student’s t-test are displayed. ns indicates a p-value greater than 0.05. Error bars represent 2 SEM. n equals total number of discs scored. (F to I) w- eye clones in Gadd45+ and Gadd45F17 backgrounds. Dashed lines indicate clone boundaries. (J) Quantification of the fraction of the eye composed of w- cells in control and mutant eyes. p-values indicate differences between Gadd45 mutant and control in the same NMD background (indicated by horizontal bars) or NMD mutant and control in the same Gadd45 background (indicated by value above each individual bar), using a two-sided Student’s t-test. ns indicates a p-value greater than 0.05. Error bars represent 2 SEM. n = 20 eyes for all conditions.
Figure 2—figure supplement 1
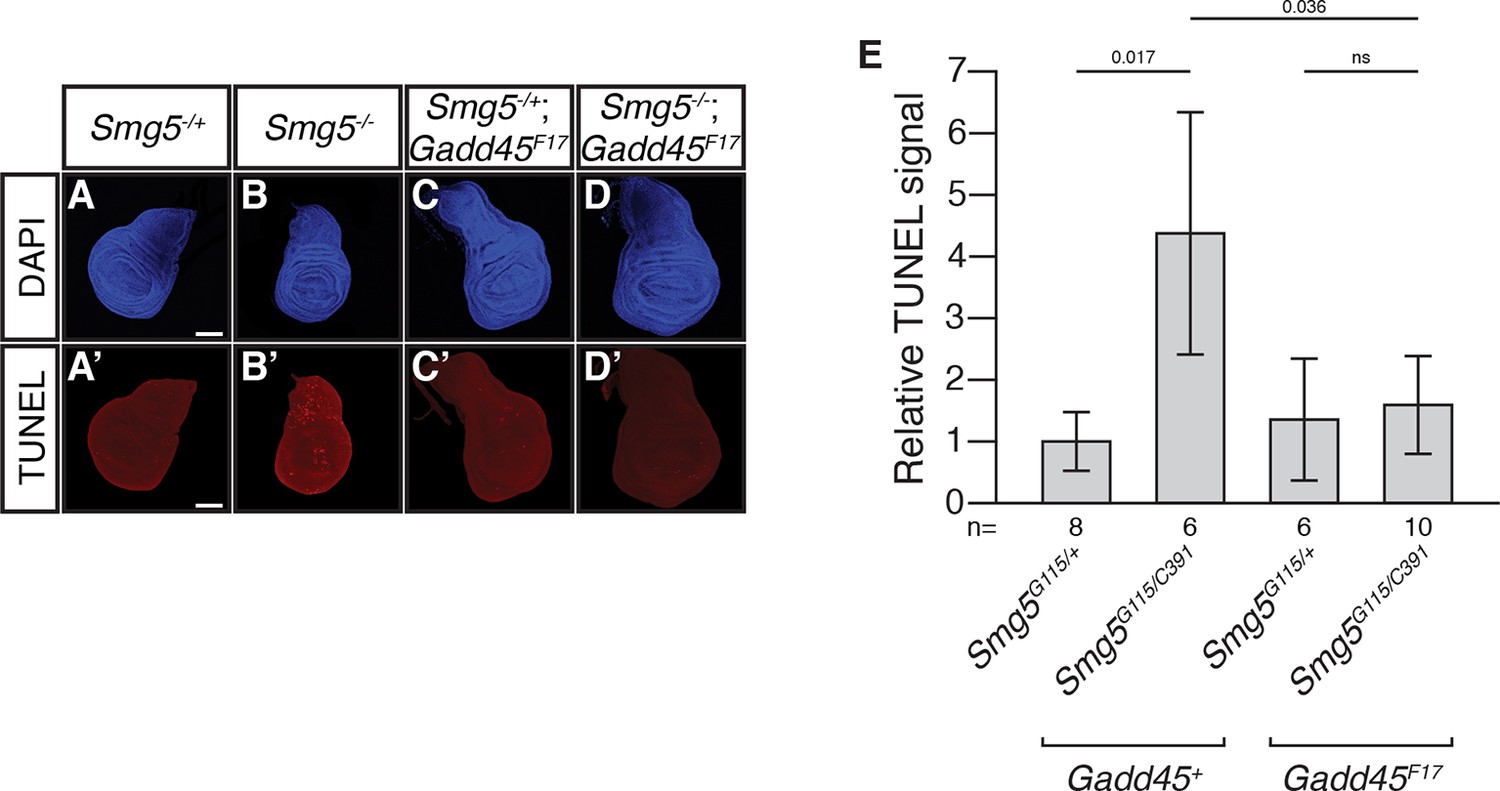
Loss of Gadd45 suppresses ectopic cell death in Smg5 mutant wing discs.
(A to D) DAPI (blue) and (A’ to D’) TUNEL (red) staining in late 3rd instar larval wing discs from Smg5G115/+ (A); Smg5G115/C391 (B); Smg5G115/+ Gadd45F17 (C); and Smg5G115/C391 Gadd45F17 (D) animals. Smg5G115 and Smg5C391 are null Smg5 alleles (J.O.N. and M.M.M., unpublished). Scale bar represents 100 μm. (E) Relative TUNEL signal in wing discs, normalized to Smg5G115/+. p-values determined by two-sided Student’s t-test between indicated conditions are displayed. ns indicates a p-value greater than 0.05. Error bars represent 2 SEM.
Figure 3 with 1 supplement
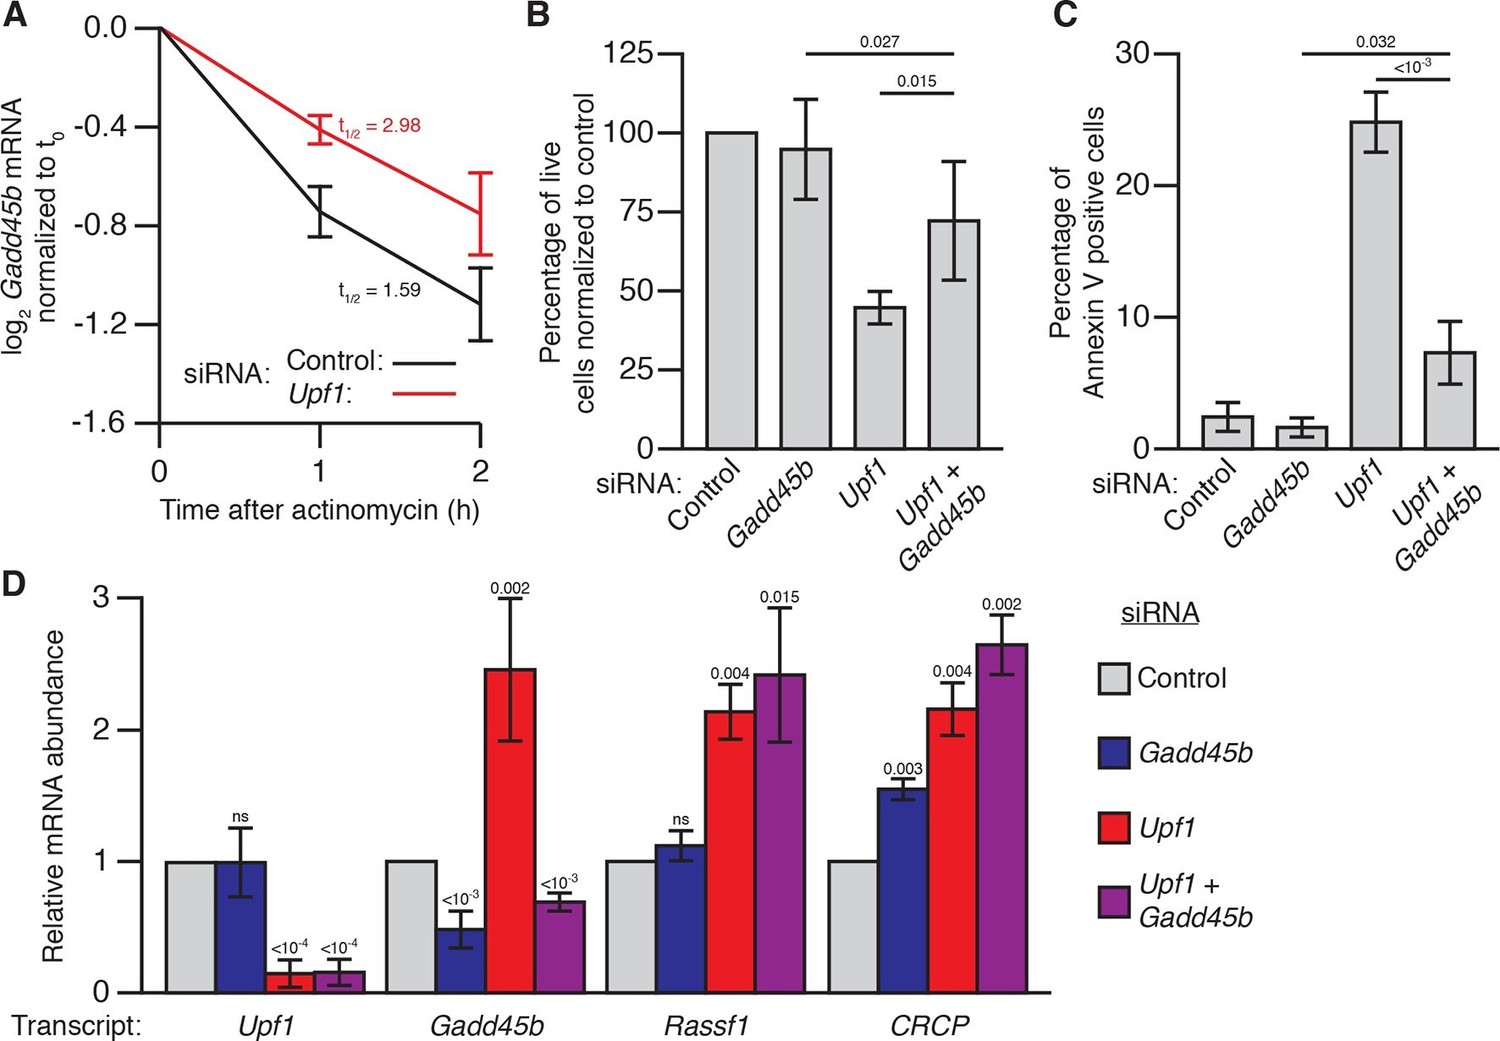
Gadd45b mediates cell lethality in Upf1 siRNA knockdown 3T3 mouse embryonic fibroblasts.
(A) Relative Gadd45b mRNA expression measured by qRT-PCR in NIH-3T3 cells after 48 hr of control (black) or Upf1 (red) siRNA treatment and 0 to 2 hr of actinomycin D treatment, normalized to expression prior to actinomycin treatment. The half-life calculated for each decay curve is indicated. (B) Relative viable cell count of Upf1 and Gadd45b single and double siRNA treatment normalized to control siRNA. p-values display two-sided Student’s t-test between indicated conditions. (C) Quantification of apoptosis as measured by annexin V staining. p-values display two-sided Student’s t-test between indicated conditions. (D) Relative mRNA expression of Upf1, Gadd45b, and two mammalian endogenous NMD targets, Rassf1 and CRCP (Tani et al., 2012) measured by qRT-PCR in Gadd45b and Upf1 single and double siRNA knockdown cells, normalized to expression in the control siRNA condition. p-values display one-sided Student’s t-test for each condition compared to control. Error bars represent 2 SEM.
Figure 3—figure supplement 1
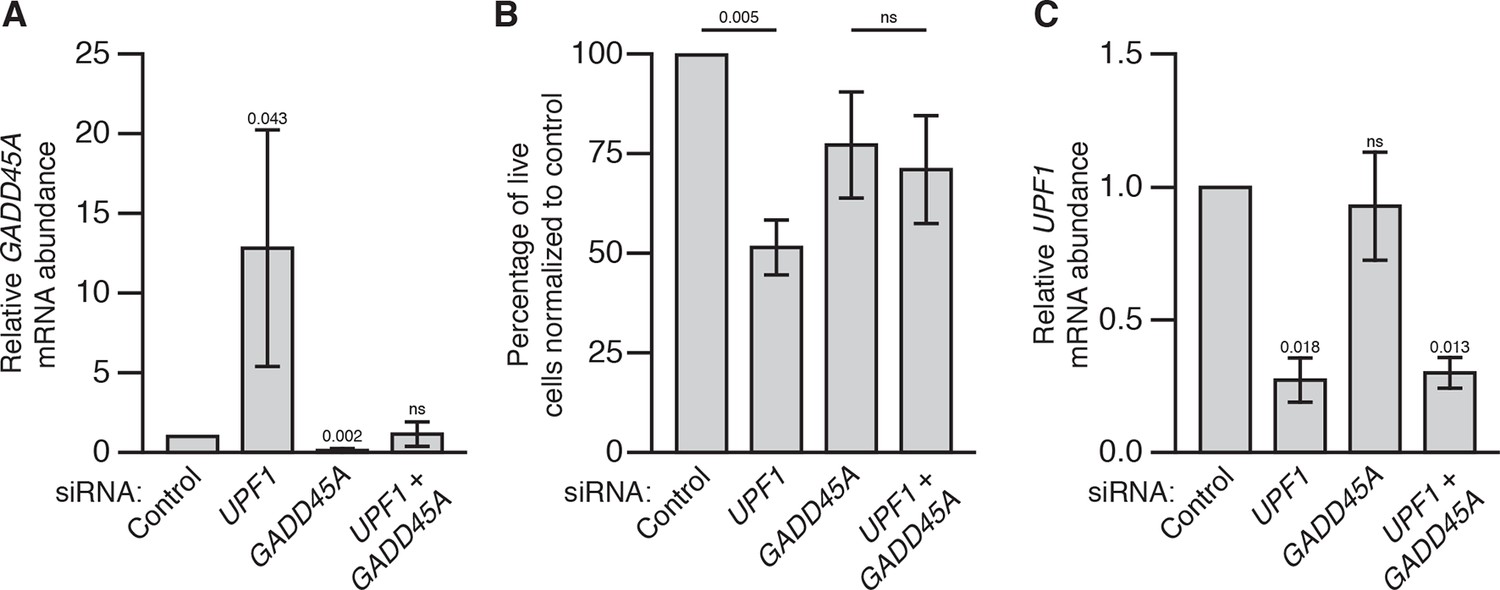
GADD45A mediates cell lethality in Upf1 knockdown HEK293 cells.
(A) Relative GADD45A mRNA expression measured by qRT-PCR in UPF1 and GADD45A single and double siRNA knockdown 72 hr after siRNA transfection in HEK293 cells, normalized to expression in the control siRNA condition. p-values display one-sided Student’s t-test for each condition compared to control. (B) Viable cell count of UPF1 and GADD45A single and double siRNA-treated cells normalized to control siRNA -treated cells. p-values display two-sided Student’s t-test between indicated conditions. (C) Relative UPF1 mRNA expression measured by qRT-PCR in UPF1 and GADD45A single and double siRNA knockdown, normalized to expression in control siRNA condition. p-values display one-sided Student’s t-test for each condition compared to control. Error bars represent 2 SEM.
Additional files
-
Supplementary file 1
Deficiencies used in deficiency suppressor screen.
- https://doi.org/10.7554/eLife.12876.012
-
Supplementary file 2
PCR primers used in this study.
- https://doi.org/10.7554/eLife.12876.013
Download links
A two-part list of links to download the article, or parts of the article, in various formats.
Downloads (link to download the article as PDF)
Open citations (links to open the citations from this article in various online reference manager services)
Cite this article (links to download the citations from this article in formats compatible with various reference manager tools)
Degradation of Gadd45 mRNA by nonsense-mediated decay is essential for viability
eLife 5:e12876.
https://doi.org/10.7554/eLife.12876


