Resolving rates of mutation in the brain using single-neuron genomics
- Boston Children's Hospital, United States
- Howard Hughes Medical Institute, Boston Children's Hospital, United States
- Harvard Medical School, United States
- Broad Institute of MIT and Harvard, United States
- Brigham and Women's Hospital, United States
Figures
Figure 1 with 1 supplement

Chimera artifacts in RC-seq.
(A) Full-length (FL) PCR using primers flanking the insertion site is necessary for definitive validation of somatic insertions in single cells in the setting of chimeras. One breakpoint per chimera DNA molecule refers to the breakpoint of the candidate insertion being analyzed since a DNA molecule can in principle have multiple different chimera events each involving different loci (which would be unlikely to create a structure that would validate by FL-PCR). For most RC-seq candidates, Upton et al. did not attempt 3’ or 5’ PCR for the computationally identified junction and only performed this for the opposite junction. (B) Top schematic illustrates one of several methods for identifying L1 chimeras in next-generation sequencing data such as RC-seq. Bottom schematic illustrates how two independent chimeras aligning to the same locus appear to have a TSD. (C) An example somatic insertion candidate that passed Upton et al. single-junction PCR validation but derived from two independent chimera artifacts. Yellow region is non-L1 sequence from chromosome 3 that allows tracing of the chimera to its source. L1Pa4 is an inactive L1 subfamily (Hancks and Kazazian, 2012). See Supplementary file 1 ('RC-seq | Somatic L1 PCR' sheet) for analyses of all somatic candidates passing Upton et al. PCR validation. See also Figure 1—figure supplement 1.
Figure 1—figure supplement 1
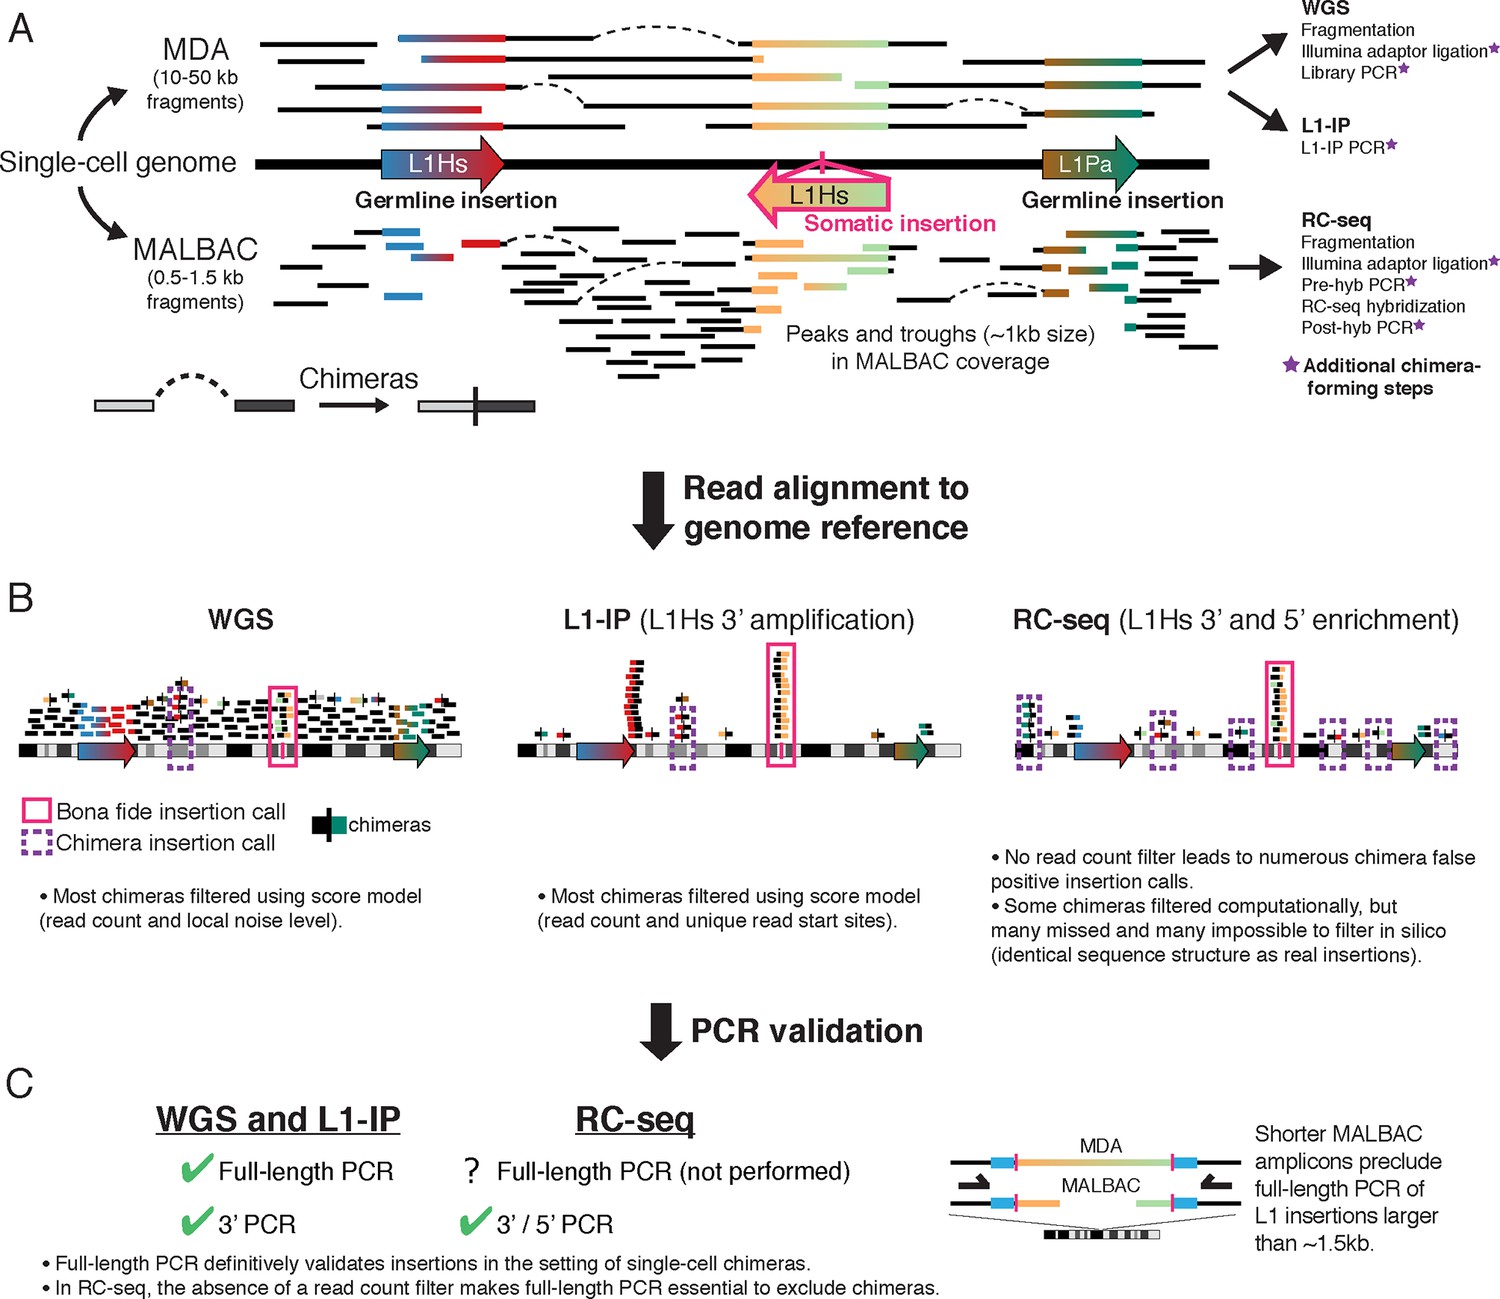
Overview of single-cell L1 profiling methods and chimeras in the context of genome amplification, analysis, and PCR validation
(A) MDA and MALBAC amplification of single-cell genomes and downstream L1 profiling steps. MALBAC generates shorter amplicons than MDA as well as peaks and troughs in genome coverage (see Figure 4). (B) Schematic of sequencing reads in WGS, L1-IP, and RC-seq L1 profiling methods. WGS and L1-IP filter most chimeras using a score model based on read count and other parameters, while RC-seq does not employ a read count filter, leading to over-calling of false-positive chimeras. (C) PCR validation approach in each L1 profiling method. Schematic on right illustrates short amplicon length of MALBAC, which precludes definitive validation of L1 insertions longer than the MALBAC amplicon length.
Figure 2 with 1 supplement
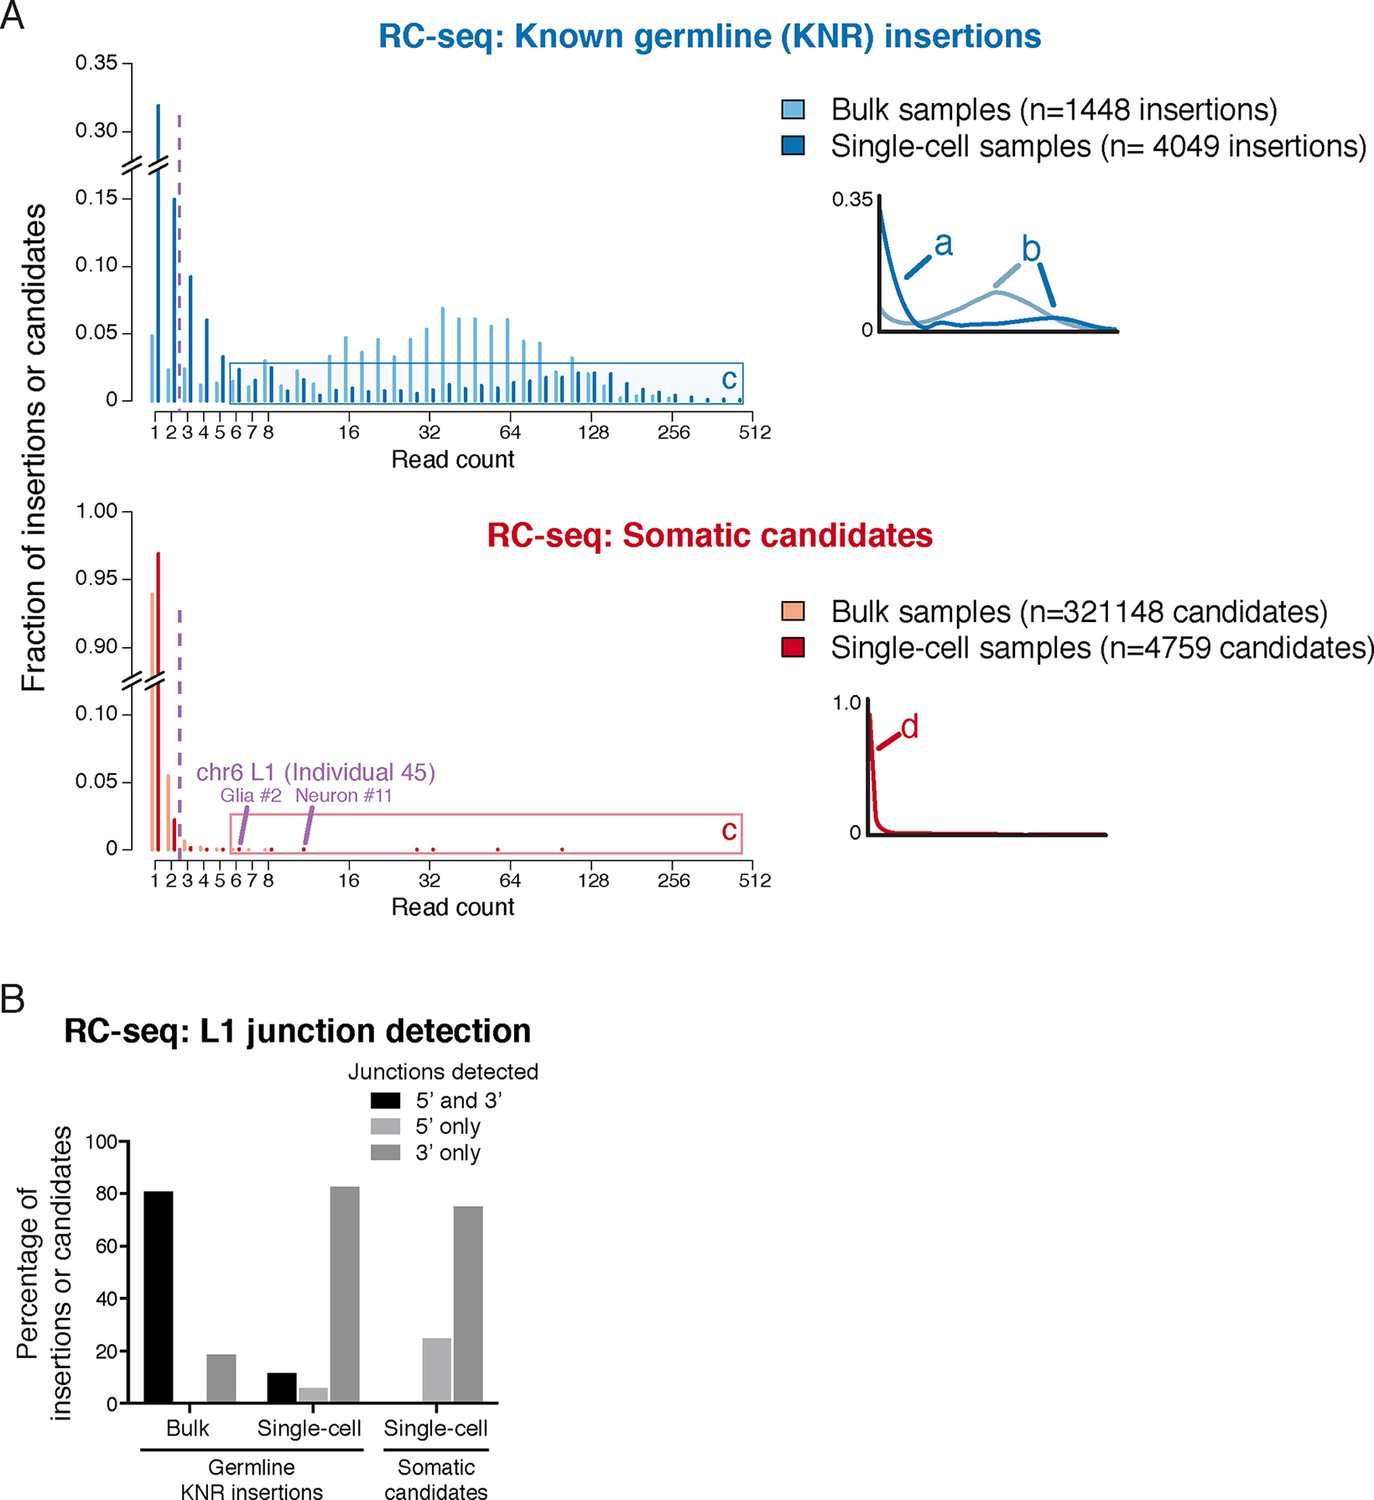
RC-seq read count distributions and junction detection rates of somatic insertion candidates are inconsistent with known true germline insertions.
(A) RC-seq read count distributions of bulk and single-cell germline known non-reference (KNR) insertion and somatic candidate calls (see 'Materials and methods'). Inset schematics and labels 'a' to 'd' illustrate key findings. Label 'a' (inset schematic) points to the subset of KNR insertions appearing at low read counts in single-cells, distinct from the distribution of KNR insertions in bulk samples, due to dropout/non-uniformity at length scales < 30 kb inherent to MALBAC amplification (Appendix 2). These factors are also responsible for the broader distribution of higher read count KNR insertions (label 'b') in single-cell versus bulk samples. Areas labeled 'c' in the top and bottom graphs highlight the population of single-cell KNR insertions at high read counts that is absent from single-cell somatic candidates. KNR insertions present in a single copy per cell (chrX insertions in male samples) show the same pattern (Figure 2—figure supplement 1A). Instead, single-cell somatic candidates appear at very low read counts (label 'd', inset schematic). The likely bona fide insertion detected in two single cells on chromosome 6 is labeled and appears at high read count relative to other somatic candidates. Purple dashed line indicates threshold of > 2 reads used for calculation of somatic retrotransposition rates. See also Figure 2—figure supplement 1. (B) L1 junction detection rates in bulk and single-cell RC-seq (see 'Materials and methods'). Fewer KNR insertions are detected at both (5' and 3') junctions in single-cell versus bulk samples due to MALBAC amplification dropout/non-uniformity. A significantly lower fraction of single-cell somatic candidates are detected at both junctions relative to single-cell KNR insertions, confirming the vast majority of somatic candidates are false-positives.
Figure 2—figure supplement 1
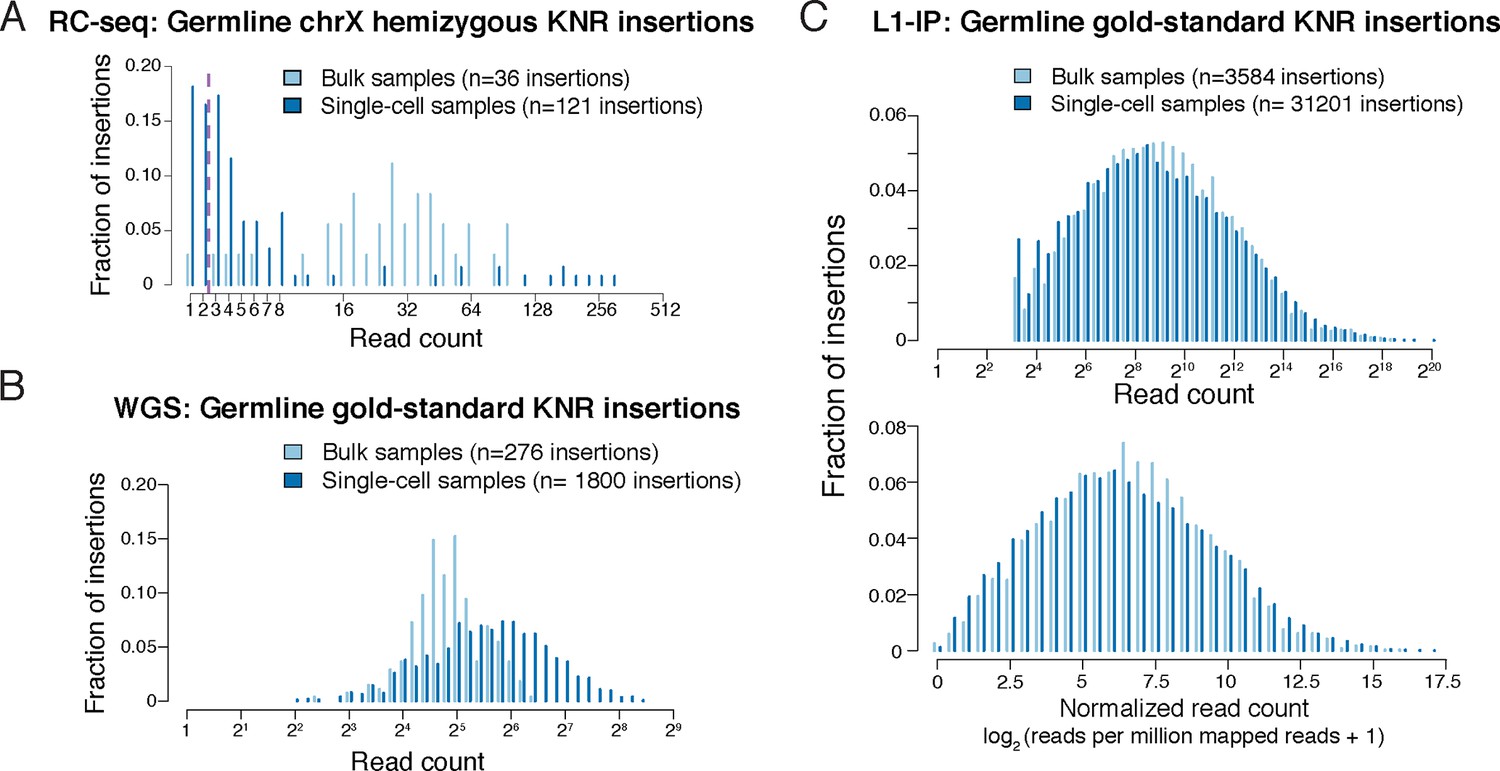
Read count distributions of known germline insertions in different L1 profiling methods.
(A) Read count distributions of chrX (hemizygous) KNR insertions, showing that most germline insertions present in a single copy per cell are still detected by multiple reads in single-cell RC-seq. KNR insertions are defined as in Figure 2A. Note that most KNR insertions in any individual are in the heterozygous state (i.e. single copy per cell) such that the read count distribution of all genome-wide KNR insertions (Figure 2A) still provides a good approximation of somatic insertions (see 'Materials and methods'). (B) Read count distribution of germline gold-standard KNR insertions in bulk and single-cell samples from Evrony et al. (2015) detected by the high-coverage whole-genome sequencing (WGS) L1 profiling method, illustrating that true insertions appear at high read counts. See Figure S4B in Evrony et al. (2015) 2B and S11 for histograms of insertion confidence scores. WGS gold-standard KNR insertions are defined as insertions identified in both bulk samples of the individual and detected in prior independent L1 profiling studies from other laboratories (see 'Materials and methods' for details). (C) Read count distribution of germline gold-standard KNR insertions in bulk and single-cell samples from Evrony et al. (2012) detected by the targeted L1-insertion profiling (L1-IP) method, illustrating that true insertions appear at high read counts. Raw (top) and normalized (bottom) read counts are shown. See Figure S4B in Evrony et al. (2012) for further read count and score histograms. The minimum number of raw reads for calling insertions in the pipeline is 10, as described in Evrony et al. (2012). L1-IP gold-standard KNR insertions are defined as insertions identified with a confidence score ≥0.5 in at least half of the bulk samples of the individual and detected in prior independent L1 profiling studies from other laboratories (see 'Materials and methods' for details).
Figure 3 with 1 supplement
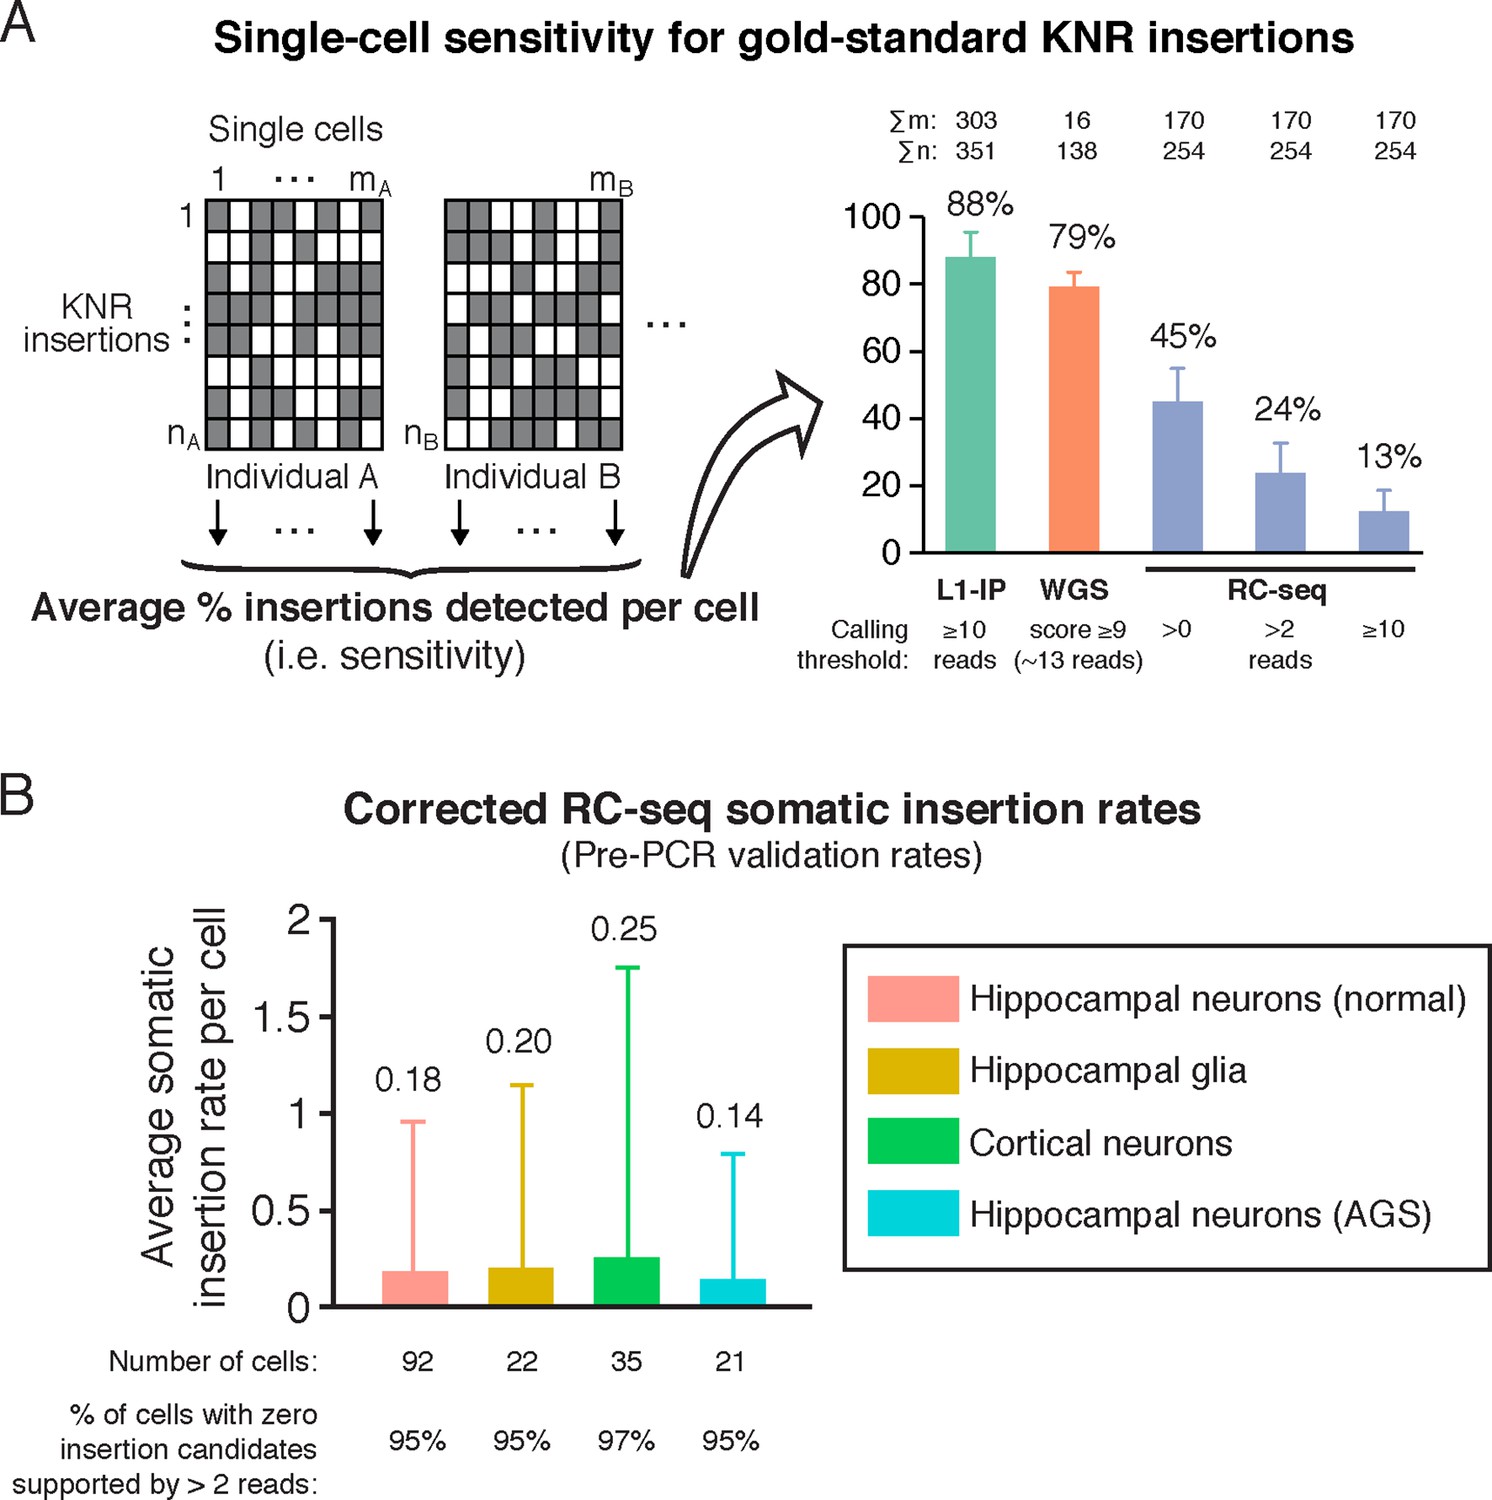
RC-seq sensitivity for gold-standard true insertions and corrected RC-seq somatic insertion rates.
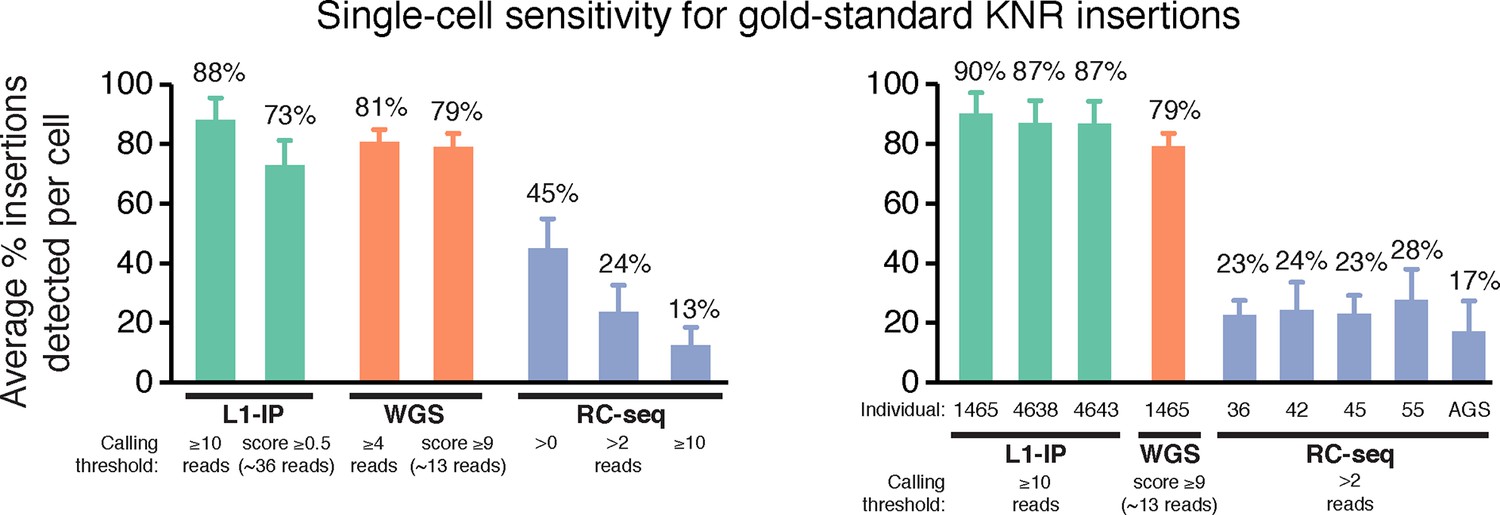
(A) Average sensitivity of single-cell RC-seq for gold-standard KNR insertions at different read count thresholds. Sensitivity of single-cell L1-IP (Evrony et al., 2012) and single-cell WGS (Evrony et al., 2015) are shown for comparison. Note, the average number of uniquely mapped reads in the targeted enrichment methods of L1-IP and RC-seq are 3.2 and 16.7 million reads, respectively, so L1-IP achieves higher sensitivity than RC-seq with fewer reads even with a more liberal read count threshold for RC-seq. Gold-standard KNR insertions are defined for each single-cell method as in Figures 2A and Figure 2—figure supplement 1B–C. Error bars ± SD. As illustrated in the schematic on the left, Σm is the number of single cells in the study (i.e. mA+mB+...), and Σn is the number of gold-standard KNR insertions used to calculate sensitivity across the profiled individuals (i.e. nA+nB+...; as seen in the schematic, Σn increases as more individuals are profiled). See also Figure 3—figure supplement 1. (B) Average RC-seq somatic insertion rates per cell. These are pre-PCR validation rates, since Upton et al. did not attempt PCR validation for these somatic candidates. The percentage of cells without any candidates (above the threshold of >2 reads and after excluding chimeras) is shown. See Supplementary file 1 ("RC-seq | Somatic L1 >2 reads" sheet) for analysis of all somatic candidate sequences. Error bars ± SD.
Figure 3—figure supplement 1
Single-cell sensitivity of L1-profilng methods for gold-standard germline KNR insertions.
Single-cell sensitivity of L1-profiling methods for gold-standard germline KNR insertions at additional read count and score thresholds not shown in Figure 3A, and separately for single-cell samples from each individual. RC-seq Aicardi-Goutieres (AGS) single cells have lower sensitivity (higher dropout) than single cells from other individuals, indicating lower quality tissue/single cells from this individual. Gold-standard KNR insertions are defined for each single-cell method as in Figures 2A and Figure 2—figure supplement 1B–C. Error bars ± SD.
Figure 4 with 2 supplements
MDA and MALBAC single-cell genome amplification uniformity.
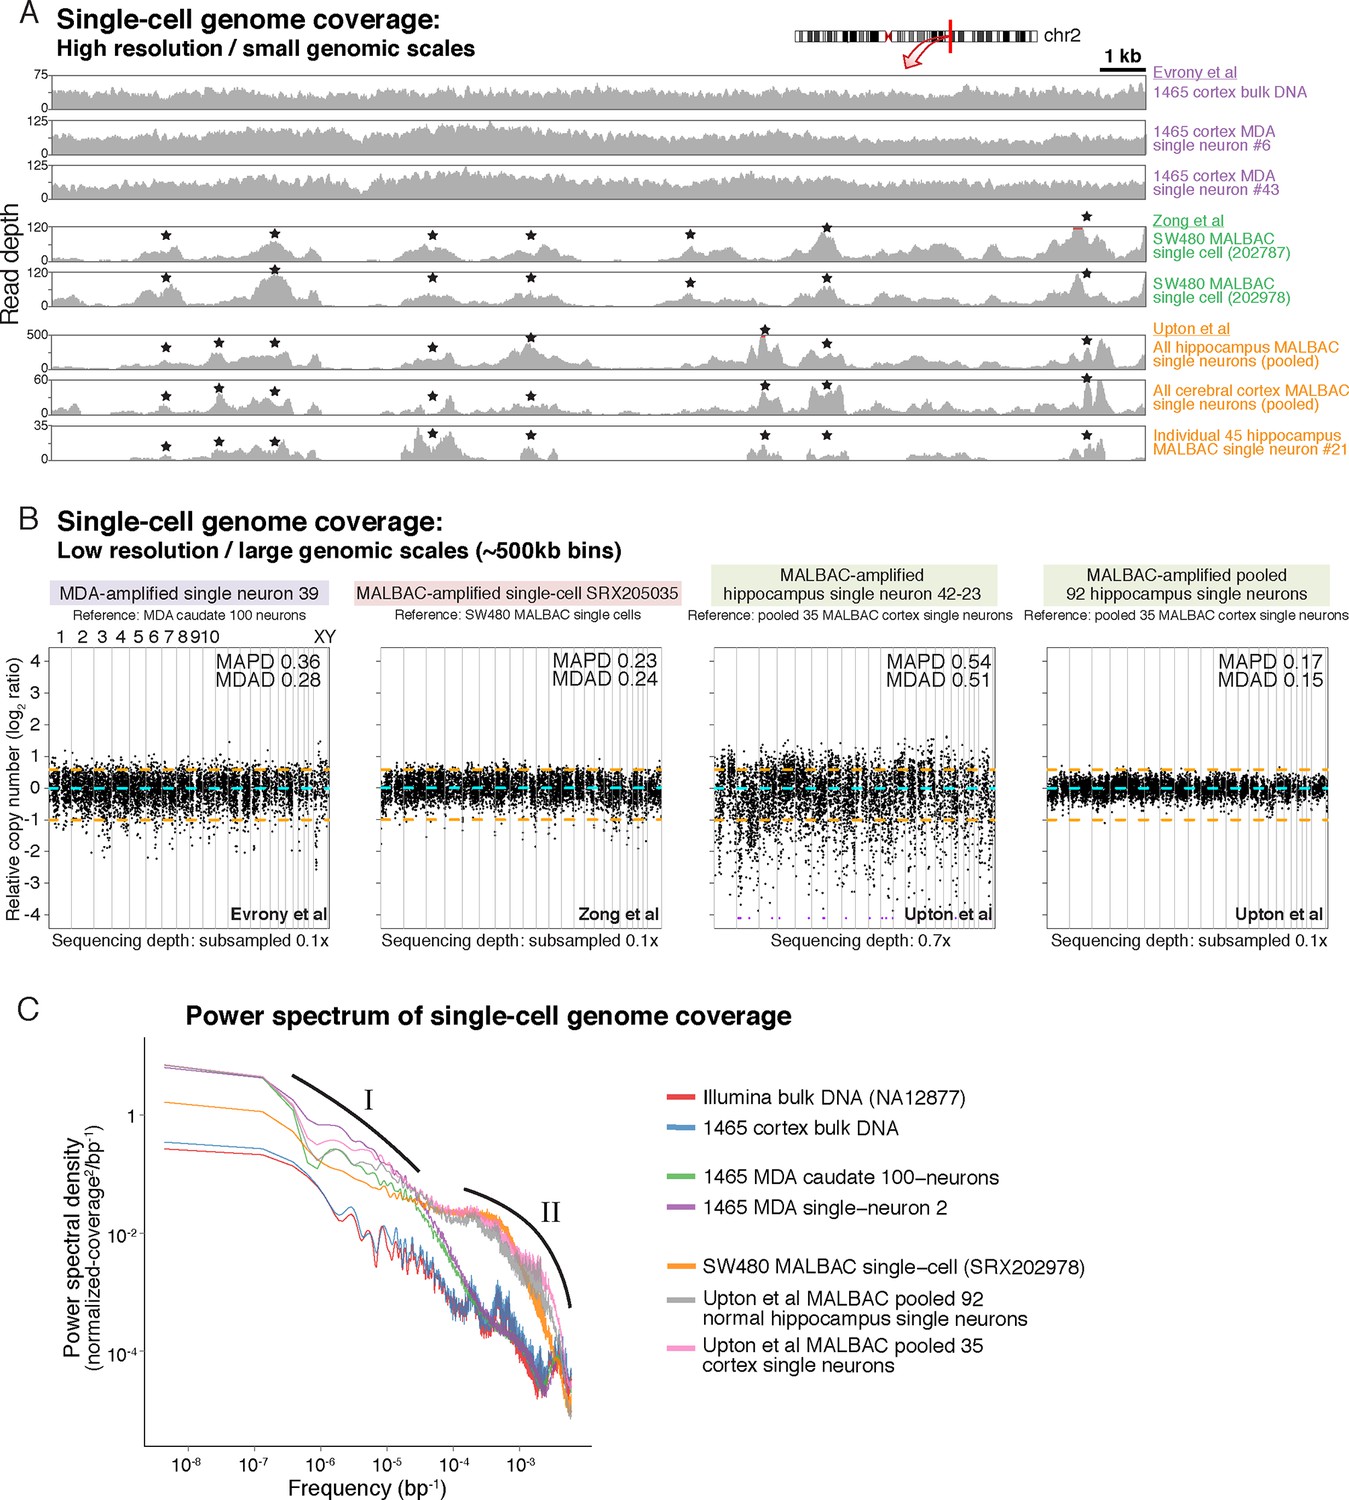
(A) High-resolution coverage plots of MDA single neurons (Evrony et al., 2015) and MALBAC single cells from Zong et al. (2012) and Upton et al. (2015). MALBAC samples show significant non-uniformity with systematic high peaks (stars) and troughs of genome amplification. MALBAC single neurons from Upton et al. were pooled from hippocampus (n = 92 cells) and cortex (n = 35 cells) of normal individuals to produce high-coverage samples for the plots. Pooling eliminates stochastic noise of individual cells but preserves systematic non-uniformity inherent to MALBAC. Area shown is chr2:155,815,550–155,848,725 encompassing the region of one of the single-cell RC-seq somatic L1 candidates detected with both 5' and 3' junctions (chr2:155,823,436). Red lines mark off-scale peaks. (B) Low-resolution (~500 kb bin) genome-wide coverage plots of representative single cells from the above studies. MALBAC single cells from Zong et al. have significantly better uniformity at these scales than MDA single neurons as measured by median absolute pairwise deviation (MAPD) and median absolute deviation from the median (MDAD) scores (lower scores indicate higher uniformity) (Cai et al., 2014; Evrony et al., 2015). In contrast, individual MALBAC single cells from Upton et al. have significantly lower quality than both MALBAC single cells from Zong et al. and MDA single neurons. Pooling of all 92 normal hippocampus single neurons from Upton et al. achieves high uniformity (low MAPD/MDAD scores), indicating the low quality of individual single cells from Upton et al. is due to stochastic noise, likely from factors preceding MALBAC amplification. Note, high-coverage MALBAC and MDA samples from Zong et al. and Evrony et al. were subsampled to a lower read depth similar to read depth of Upton et al. samples, confirming prior analyses showing uniformity quality metrics are not affected by sequencing depth in low resolution analyses (Evrony et al., 2015). (C) Power spectral density (y-axis), which reflects the degree of read depth variability (uniformity) as a function of genomic spatial frequency (x-axis). Higher spatial frequencies (right side of x-axis) reflect smaller genomic scales (i.e. higher resolution, as in Figure 4A), and lower spatial frequencies (left side of x-axis) reflect larger genomic scales (i.e. lower resolution, as in Figure 4B). Plots show differences in MDA and MALBAC genome amplification uniformity across genomic scales: MDA single cells have greater read depth variability at larger genomic scales than MALBAC single cells [label I], while MALBAC has greater read depth variability at smaller genomic scales < 30 kb [label II] (i.e. scale of SNVs, small indels, retrotransposons; frequencies > ~3.5·10–5 bp), consistent with high-resolution coverage plots (Figure 4A). MALBAC single cells from Upton et al. were pooled to obtain high-coverage samples for the analysis. Plots for individual 1465 and SW480 samples were calculated in Evrony et al. (2015) and are presented again for comparison to Upton et al. samples. Additional unrelated bulk sample NA12877 is plotted for comparison. See Appendix 2 for additional details, Figure 4—figure supplement 1 for average MAPD/MDAD scores of single cells and additional coverage plots, and Figure 4—figure supplement 2 for basic genome coverage statistics.
Figure 4—figure supplement 1
MDA and MALBAC single-cell quality and low-resolution genome-wide amplification uniformity.
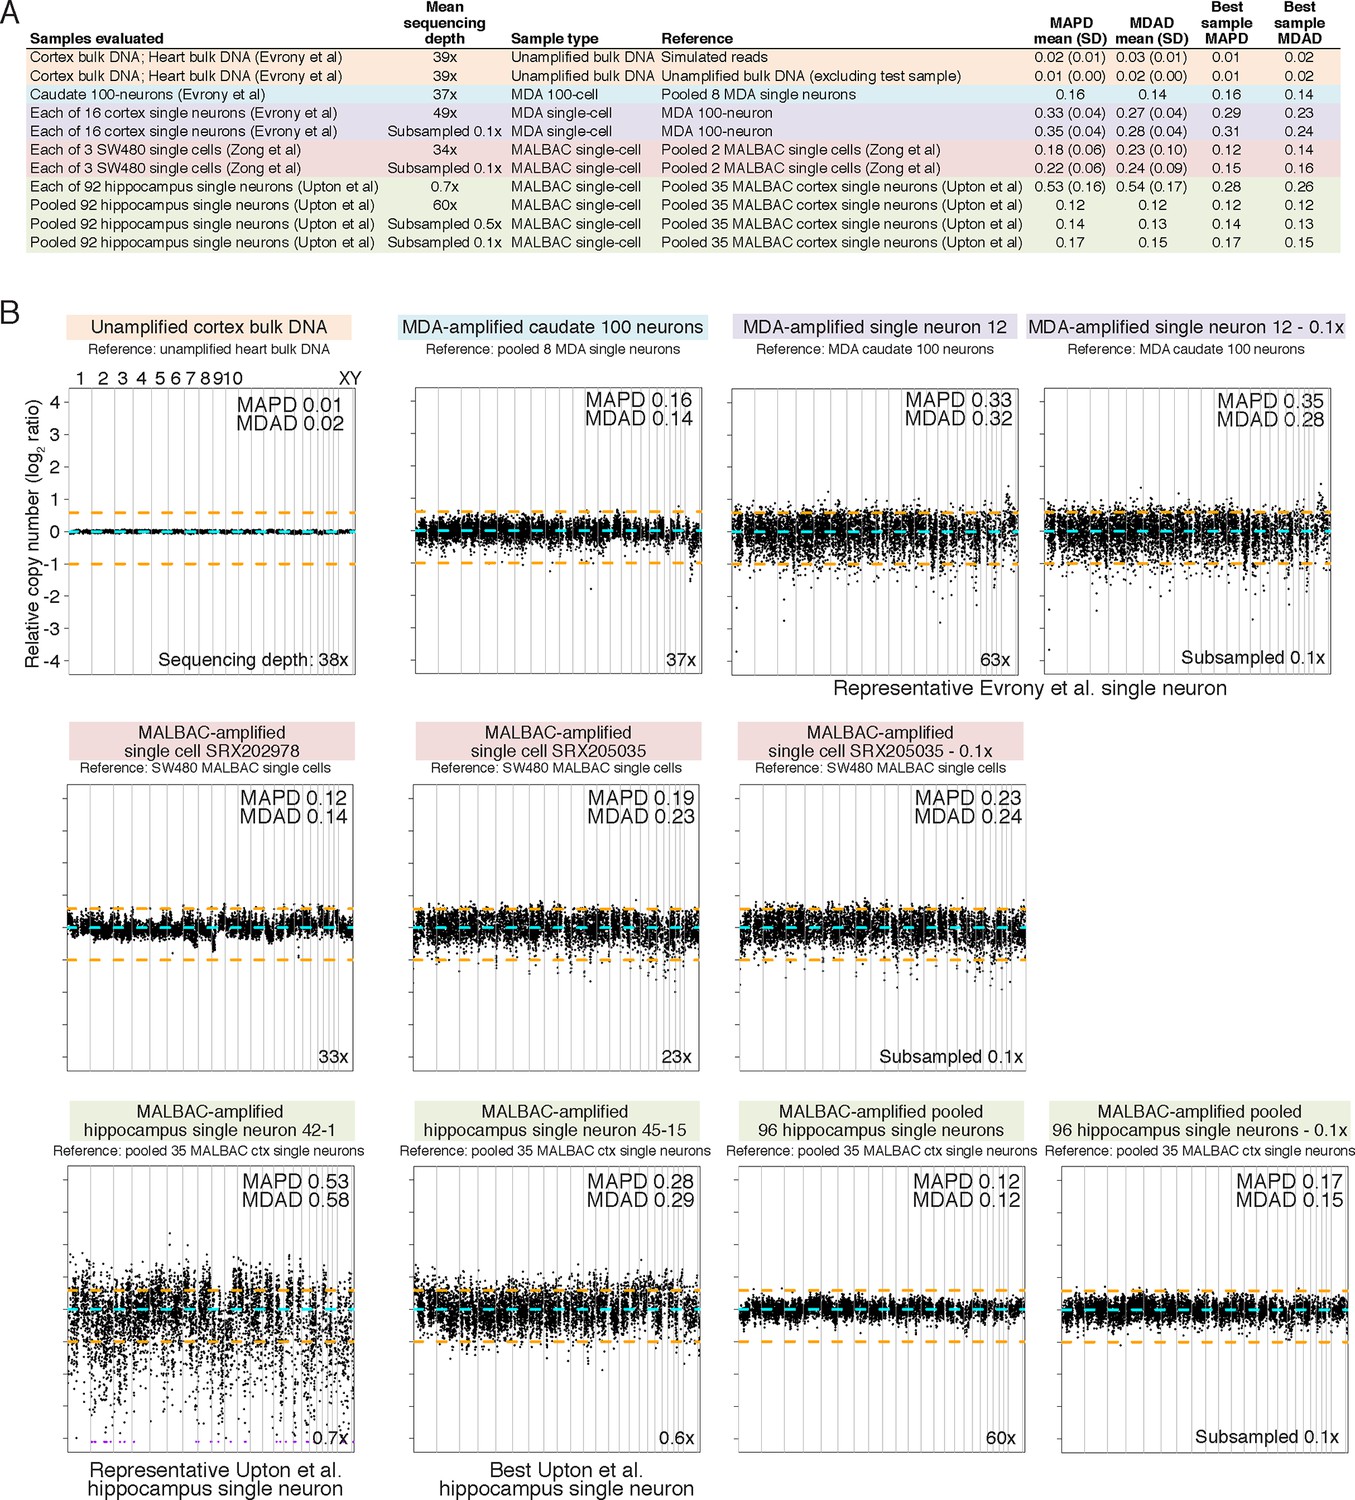
(A) MAPD and MDAD statistics of copy number (coverage) variability calculated in ~500 kb bins spanning the genome. Lower MAPD and MDAD scores reflect higher quality and uniformity of single-cell amplification. References used for normalization of genome coverage are listed. MALBAC single cells from Upton et al. have higher variability in quality/amplification uniformity among single cells and lower average quality/amplification uniformity than both MALBAC single cells from Zong et al. (2012) and MDA single neurons from Evrony et al. (2015). However, pooling of MALBAC single cells from Upton et al. achieves high quality and uniformity (low MAPD and MDAD scores) better than single-cell samples from other studies, indicating the low quality of individual single cells from Upton et al. is due to stochastic noise in each single cell likely from factors preceding MALBAC amplification such as poor tissue quality. The higher sequencing depth of MDA single neurons from Evrony et al. and MALBAC single cells from Zong et al. relative to MALBAC single cells from Upton et al. has minimal effect on MAPD/MDAD statistics since Poisson error of read counts in low-resolution 500 kb bins is well below the noise levels due to single-cell amplification even at low sequencing depths. This is confirmed by MAPD/MDAD statistics after subsampling high-coverage samples to lower read depths and by prior analyses in Evrony et al. (2015). (B) Representative genome-wide copy number (coverage) plots in ~500 kb equal-read bins for unamplified bulk DNA and MDA single-neuron samples from Evrony et al. (2015) (top row), MALBAC single cells from Zong et al. (middle row), and MALBAC single cells from Upton et al. (bottom row). Bin copy numbers are relative to the specified reference sample. These genome-wide copy number plots were used to calculate MAPD and MDAD statistics shown in panel A. MAPD and MDAD dispersion statistics are shown for each sample. Orange lines denote ± 1 copy. Purple points are off scale. Note the high quality of MALBAC single cells from Zong et al. at this resolution that achieve uniformity similar to the MDA 100-neuron sample. In contrast, the highest quality MALBAC hippocampus single neuron from Upton et al. (neuron 45–15) has uniformity similar to an average MDA single neuron and an average quality MALBAC neuron from Upton et al. (neuron 42–1) has significantly less uniformity. Although pooling of all Upton et al. normal hippocampus single neurons has uniformity similar to the highest quality MALBAC single cell from Zong et al., this reflects only systematic MALBAC noise since stochastic single-cell noise is mostly removed by pooling. On the other hand, individual MALBAC single cells from Zong et al. achieve high quality with both stochastic single-cell noise and MALBAC noise. This reflects the fact that the low quality of MALBAC single cells from Upton et al. is due to high stochastic noise present in each individual single cell that was likely present prior to MALBAC amplification. The bottom right corner of each plot shows the total sequencing depth of the sample. Plots after subsampling to lower sequencing depth shows that total sequencing depth has only a small effect on low-resolution coverage plots and statistics. Therefore, differences in sequencing depth between samples do not alter the conclusions regarding the quality of single cells from each study.
Figure 4—figure supplement 2

MDA and MALBAC genome coverage.
(A) Fraction of genome covered at nucleotide resolution at ≥1x and ≥10x read depth at different subsampled read depths. Data for 1465 and SW480 samples from Evrony et al. (2015) and Zong et al. (2012), respectively, is included for comparison and were previously shown in Evrony et al. (2015). Reads were randomly subsampled to obtain different total subsampled read depths (i.e. different subsampled total sequenced bases normalized to genome size), allowing comparison between samples regardless of their original total read depths. Upton et al. MALBAC hippocampus single neurons from normal individuals were pooled into one sample to achieve coverage necessary for the analysis. Plots show the average coverage across samples of each sample type (shading ± SD). Plots for each sample set are shown up to the maximum read depth that was possible to subsample equivalently across all samples in a sample set. Note the slightly improved coverage at ≥10x read depth of pooled MALBAC single neurons from Upton et al. relative to MALBAC single cells from Zong et al. However, this is a comparison between a pooled sample, which cancels stochastic noise present in individual single cells, versus single cells analyzed individually that were not pooled and still contain stochastic noise present in each cell. This suggests that the MALBAC implementation in Upton et al. was commensurate or slightly better than that in Zong et al., but individual cells in Upton et al. are still of significantly lower quality than individual cells in Zong et al. (Figure 4B and Figure 4—figure supplement 1) and if sequenced to high coverage would very likely have significantly greater dropout at nucleotide resolution. (B) Lorenz curves as in Evrony et al. (2015) showing the cumulative fraction of reads as a function of cumulative fraction of the genome, averaged across samples of each sample type. These curves reflect the uniformity of genome coverage. A sample with perfectly even genome coverage would appear on the diagonal y = x line. The left panel is plotted using all sequencing reads of each sample. The right panel is plotted after subsampling to the same total read depth across all samples (i.e. the total read depth of MALBAC single cell SRX202787, which has the lowest total read depth of the graphed samples), showing the same trends as the left panel. Note the better performance of pooled MALBAC single neurons from Upton et al. compared to individual MALBAC single cells from Zong et al. This is a result of pooling Upton et al. single neurons to obtain a high coverage sample for analysis, which cancels stochastic noise present in individual neurons as described in panel A. Plots for individual 1465 and SW480 samples were calculated in Evrony et al. (2015) and are presented again for comparison to the Upton et al. sample.
Figure 5
A mathematical framework for single-cell sequencing.
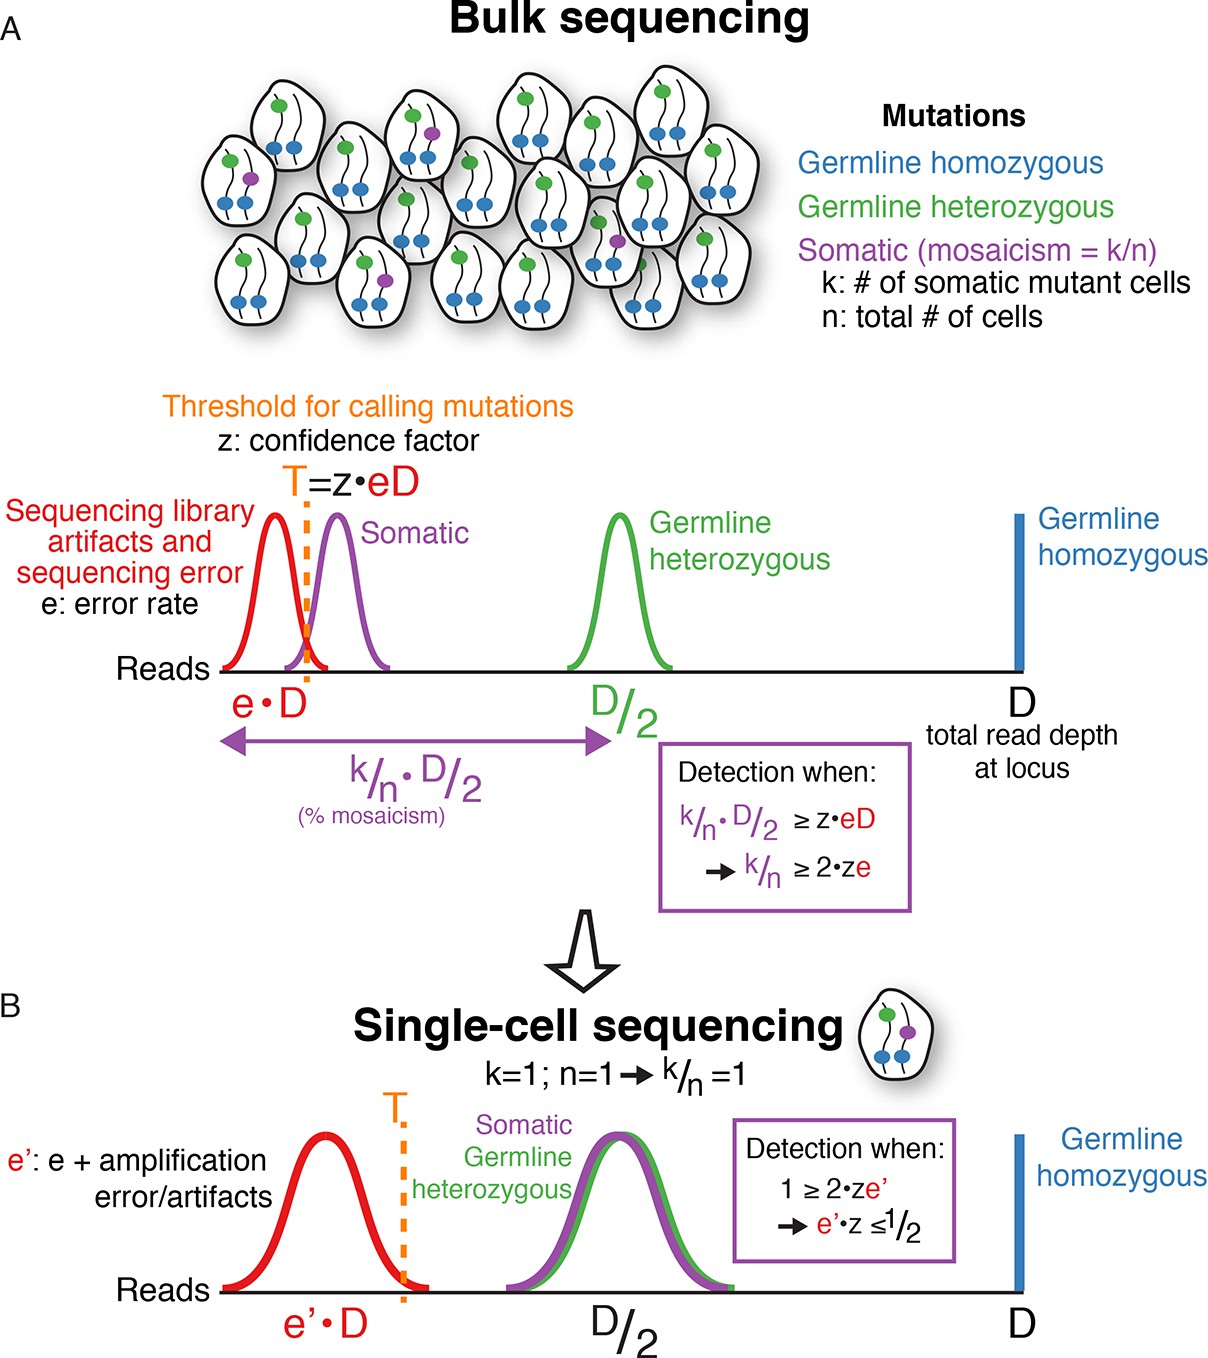
(A) In bulk sequencing, a somatic mutation present in k out of n cells pooled together for sequencing (i.e. mosaicism of k/n), with read coverage D at the mutation locus, will be detected on average in k/n·D/2 reads with a variance depending on sampling error; i.e. the number of reads detecting the mutation correlates linearly with the percent mosaicism. In contrast, germline heterozygous and homozygous variants are present in D/2 and D reads, respectively. Due to sequencing artifacts and sequencing errors, a mutation must be detected above a threshold number of reads, T, which also depends on the sequencing depth, D, since errors occur at rates, e, that are a constant fraction on average of the total number of reads (T=z·e·D; z is a constant chosen based on desired detection sensitivity and specificity). The fraction of error reads, e, is a constant on average that is independent of total sequencing depth, D, because library artifacts and sequencing errors occur at rates that are independent of total sequencing depth. The threshold, T, can be reduced with methods reducing sequencing error, but errors are still present in any current sequencing technology. Combining equations simplifies to k/n ≥ 2·z·e. This means that the mosaicism of a somatic mutation must be at least twice the sequencing error rate (or more, depending on the confidence factor) for detection to be possible in bulk DNA sequencing, regardless of sequencing depth. Below a certain level of mosaicism that depends on the sequencing error rate, detection is unlikely. Note: for simplicity, the height of the histograms (# of mutations) is scaled to the same height, and the equations do not include variance terms. (B) In single-cell sequencing, somatic mutations are present at the same signal level on average as germline heterozygous variants (i.e. D/2, since k/n = 1), enabling detection of low mosaicism mutations that would otherwise be below detection thresholds of bulk sequencing due to sequencing error. Due to whole genome amplification, single-cell sequencing also leads to greater variance in mutation and error signal level distributions (non-uniform amplification and dropout) and entails additional artifacts not present in bulk sequencing, which increases the noise level, e', but still a lower level on average than true heterozygous mutations. However, the signal distribution of artifacts may still overlap that of true mutations, necessitating careful bioinformatics and modeling of error and true mutation signals along with rigorous validation. Note, for simplicity, the equations here do not include variance terms and bioinformatic modeling usually includes additional parameters other than read count illustrated here. Single-cell sequencing does not achieve increased sensitivity for somatic mutations without cost, because to detect a given mutation with k/n mosaicism, more than n/k single cells may need to be sequenced. The benefit of single-cell sequencing is not to reduce sequencing costs, but rather its ability to overcome limitations due to sequencing error rates on the minimum mosaicism detectable and maintaining information as to which somatic mutations are found within the same cell, which enables lineage tracing.
Appendix 4—figure 1
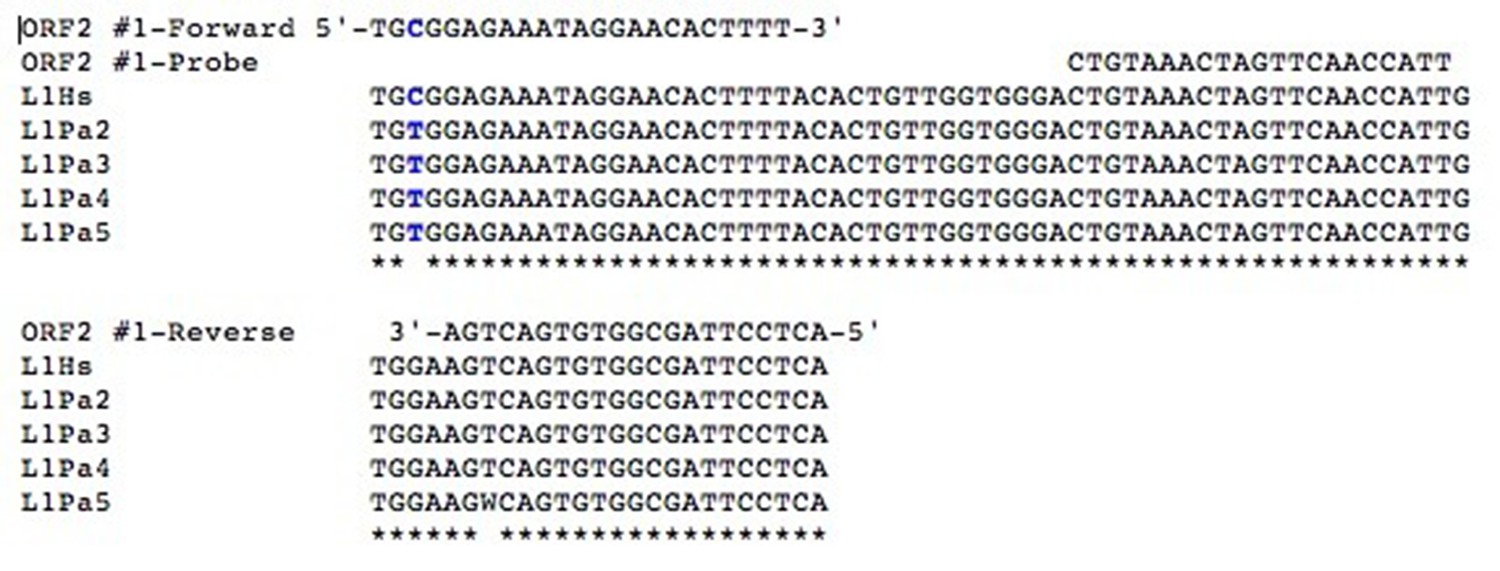
Alignment of the qPCR assay primers and probe to the L1Hs and L1Pa2-5 consensus sequences.
https://doi.org/10.7554/eLife.12966.014Additional files
-
Supplementary file 1
Sequence analysis of RC-seq somatic retrotransposon insertion candidates, and validation results of low read-count L1-IP candidates.
Detailed sequence analyses of RC-seq candidates can be found within the embedded word documents in the 'Sequence Analysis' column of each RC-seq spreadsheet (double-click to open documents). "RC-seq | Somatic L1 PCR" sheet presents sequence analyses of all RC-seq candidates passing Upton et al.'s RC-seq PCR validation; see candidate chr6:37821198 analysis document for example schematic. "RC-seq | Somatic L1 > 2 reads" sheet presents sequence analyses of all RC-seq somatic L1 candidates detected by > 2 reads in a single cell; this is the set of somatic candidates above the read count threshold chosen for calculation of corrected RC-seq somatic insertion rates. This sheet contains sequence analysis of the likely bona fide insertion at chr6:58481778. "RC-seq| Somatic hippoc. 5+3 jxn" sheet presents sequence analyses of all RC-seq somatic L1 candidates detected in hippocampal single neurons at both 5' and 3' junctions. "RC-seq| Bulk somatic L1 TSD>=50" sheet presents sequence analyses of 10 randomly selected RC-seq somatic L1 candidates detected in bulk samples with a TSD of at least 50 bp; see candidate chrX:85583069 analysis document for example schematic. In RC-seq sheets, columns with new analyses have blue column headers. Remaining columns with white headers (candidate metadata and sequences) were obtained as follows: candidate metadata and sequences for "RC-seq | Somatic L1 PCR", "RC-seq | Somatic L1 > 2 reads", and "RC-seq| Somatic hippoc. 5+3 jxn" sheets were obtained from Table S2 ("Somatic L1" and "Somatic L1 PCR" sheets) of Upton et al.; candidate metadata and sequences for the "RC-seq| Bulk somatic L1 TSD>=50" sheet were obtained from the full RC-seq bulk somatic insertion table provided by Geoffrey Faulkner.
"L1-IP | low-read-count" sheet presents candidate information and validation results of 24 randomly selected L1-IP candidates detected by only 1 read and 24 L1-IP candidates randomly selected without any read count filter. Candidates were obtained from L1-IP data from Evrony et al. (2012). All candidates failed PCR validation, illustrating true insertions do not preferentially appear at low read counts in L1-IP and the importance of using read counts to filter candidates.
- https://doi.org/10.7554/eLife.12966.013
Download links
A two-part list of links to download the article, or parts of the article, in various formats.
Downloads (link to download the article as PDF)
Open citations (links to open the citations from this article in various online reference manager services)
Cite this article (links to download the citations from this article in formats compatible with various reference manager tools)
Resolving rates of mutation in the brain using single-neuron genomics
eLife 5:e12966.
https://doi.org/10.7554/eLife.12966


