The ‘de novo’ DNA methyltransferase Dnmt3b compensates the Dnmt1-deficient intestinal epithelium
- University of Pennsylvania, United States
Figures
Figure 1
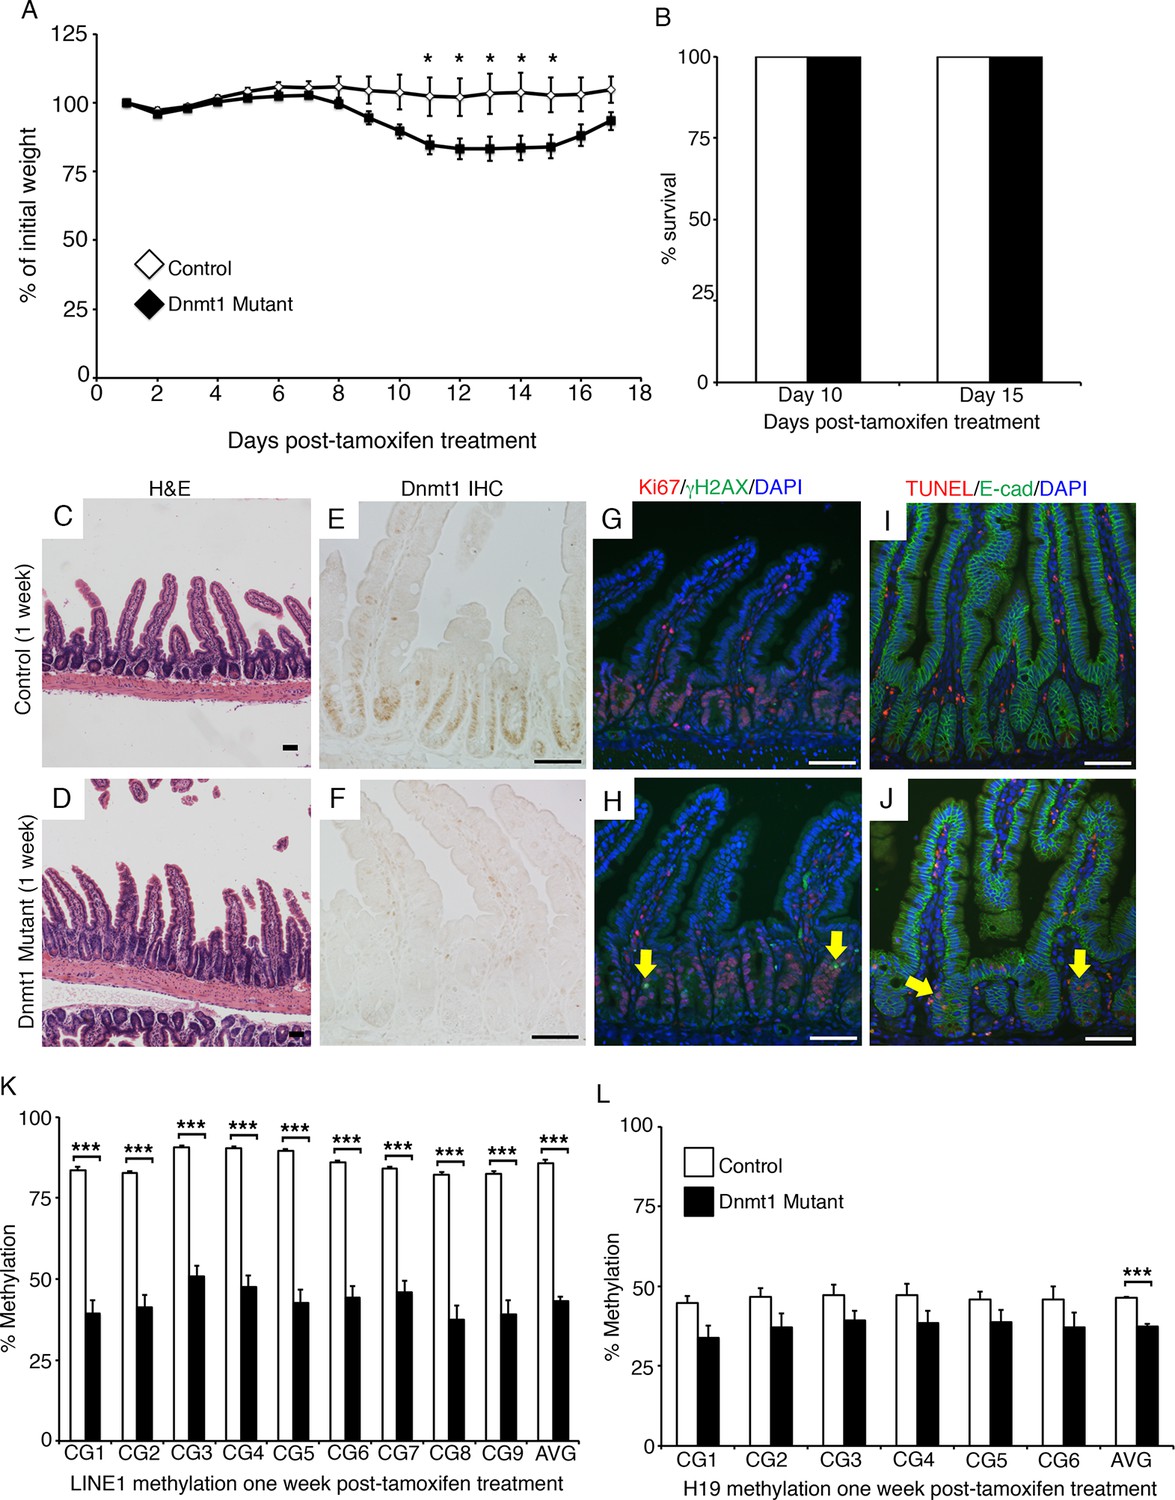
Dnmt1 ablation results in genomic instability and apoptosis one week following tamoxifen treatment.
(A, B) Dnmt1loxP/loxP(control, n=5) and Dnmt1loxP/loxP;Villin-CreERT2 (Dnmt1 mutant, n=9) mice were tamoxifen treated at four weeks of age, and weighed every day over a 17-day period. Dnmt1 mutants lost a significant amount of weight by day 11, but recovered to near-starting weight by day 16. *p<0.05, Student’s t-test. (B) All Dnmt1 mutants survive the 17-day time-course described in (A), similar to controls. (C–D) Hematoxylin and Eosin staining of control and Dnmt1 mutant intestines. One week post-ablation, Dnmt1 mutants exhibit loss of crypt integrity, vacuolization of the epithelium, and an increase in crypt fission (D) compared to controls (C). (E–F) Immunohistochemistry confirms loss of Dnmt1 protein in mutants one week following tamoxifen treatment (F) relative to control intestine (E). (G-H) Immunofluorescent staining for Ki67 (red), which marks proliferating cells, and γH2AX (green), which marks DNA double-strand breaks as a marker of chromosomal instability. One week following Dnmt1 ablation, mutant crypts display increased levels of γH2AX foci (H, yellow arrows) relative to controls (G). Dnmt1 mutants also display slightly enlarged crypts (Ki67 in H versus G), as described previously (Sheaffer et al., 2014). (I–J) Immunofluorescent TUNEL staining (red), which marks apoptotic nuclei, and E-cadherin (green), to outline the intestinal epithelium. One week after tamoxifen treatment, Dnmt1 mutants display increased crypt cell apoptosis (J, yellow arrows) compared to controls (I). (K–L) Crypts were isolated from paraffin-embedded tissue by laser capture microdissection, and the methylation levels of LINE1 loci and the imprinting control region of H19 were determined by targeted bisulfite sequencing. One week after tamoxifen treatment, methylation of LINE1 (K) and H19 (L) are significantly decreased in Dnmt1 mutants compared to controls (n=4 per genotype). ***p<0.001, *p<0.05, Student’s t-test. For data and p values, refer to Figure 1—source data 1. Error bars represent S.E.M. Scale bars are 50 μm. For all staining, n=3 biological replicates.
-
Figure 1—source data 1
Contains mouse weight/survival data in Figure 1A–B, targeted bisulfite sequencing data in Figure 1K–L.
- https://doi.org/10.7554/eLife.12975.004
Figure 2
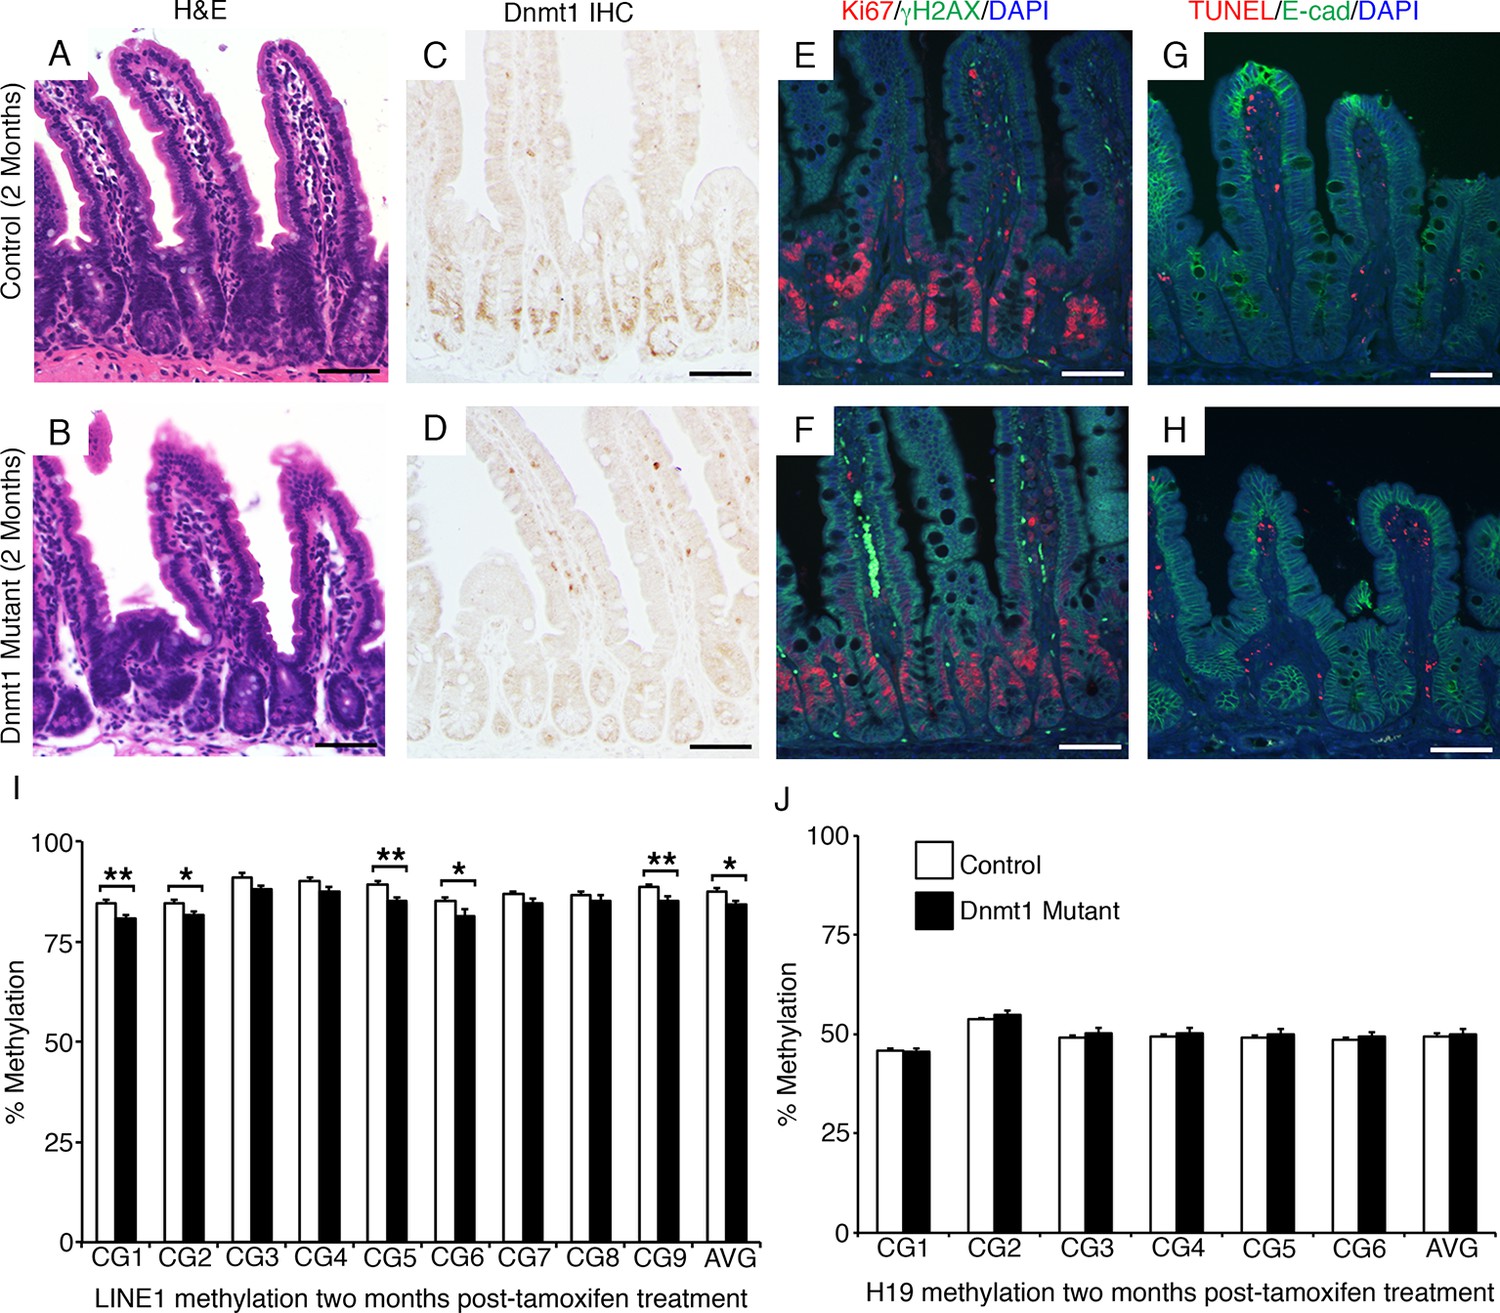
The Dnmt1 mutant intestinal epithelium recovers with time.
Dnmt1loxP/loxP(control) and Dnmt1loxP/loxP;Villin-CreERT2 (Dnmt1 mutant) mice were tamoxifen treated at four weeks of age, and intestines were harvested two months later for immunostaining and DNA methylation analysis. (A–B) Hematoxylin and eosin staining revealed that two months following tamoxifen treatment, the Dnmt1 deficient epithelium appears similar to controls (B versus A). (C–D) Epithelial Dnmt1 deletion is maintained in Dnmt1 mutants two months after tamoxifen injections (D versus C). (E–F) Immunofluorescent staining for Ki67 (red), which marks proliferating cells, and γH2AX (green), which marks DNA double-strand breaks as a marker of chromosomal instability. By two months post-Dnmt1 deletion, the mutant epithelium has returned to baseline levels of DNA damage (F versus E control). (G–H) TUNEL staining (red), which marks apoptotic nuclei, and immunostaining for E-cadherin (green), to outline the intestinal epithelium. Two months following tamoxifen injection, Dnmt1 mutants appear similar to controls and display no apoptosis in the epithelium (H versus G, respectively). (I,J) Crypts were isolated from paraffin-embedded tissue by laser capture microdissection, and the methylation levels of LINE1 loci and the imprinting control region of H19 were determined by targeted bisulfite sequencing. Two months following tamoxifen injection, Dnmt1 mutants have mostly regained methylation at both the LINE1 (E) and H19 (F) loci, and are comparable to controls (n=5–6 per genotype). However, the slight demethylation across the entire LINE1 loci is significantly decreased compared to controls. For data and p values per CpG, refer to Figure 2—source data 1. Error bars represent S.E.M. Scale bars are 50 μm. For all staining, n=3 biological replicates.
-
Figure 2—source data 1
Contains targeted bisulfite sequencing data presented in Figure 2I–J.
- https://doi.org/10.7554/eLife.12975.006
Figure 3 with 2 supplements
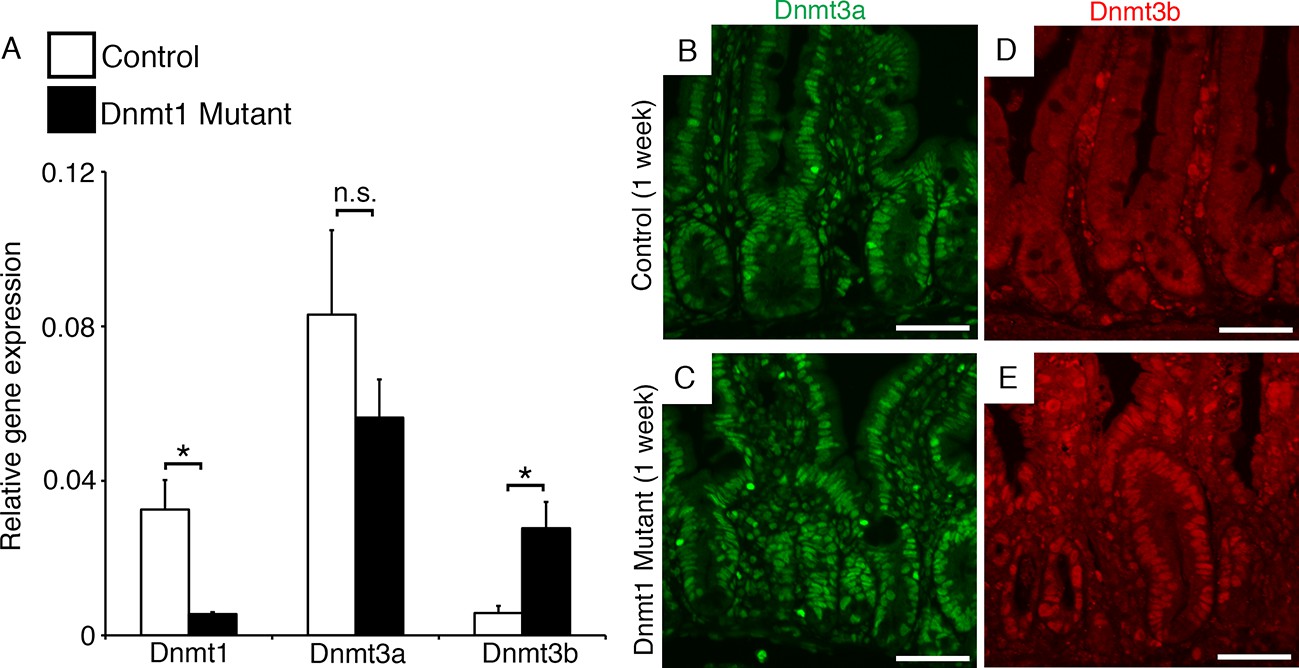
Dnmt3b is upregulated following Dnmt1 ablation.
Dnmt1loxP/loxP(control) and Dnmt1loxP/loxP;Villin-CreERT2 (Dnmt1 mutant) intestines were harvested one week following tamoxifen treatment for gene expression and immunostaining analysis. (A) qRT-PCR comparing the relative gene expression levels of Dnmt1, Dnmt3a, and Dnmt3b in the jejunum of tamoxifen-treated controls and Dnmt1 mutants (n=3–4 per genotype). Compared to controls, Dnmt1 mutants express significantly lower levels of Dnmt1, while Dnmt3b expression is significantly increased. Gene expression was calculated relative to the geometric mean of TBP and β-actin. p<0.01, Student’s t-test. For data and p-values, refer to Figure 3—source data 1. (B–C) Controls (B) and Dnmt1 mutants (C) display similar levels of Dnmt3a protein (green). (D–E) Dnmt1 mutants (E) display elevated Dnmt3b protein in intestinal crypts, compared to controls (E). Error bars represent S.E.M. Scale bars are 50 μm. For all staining, n=3 biological replicates.
-
Figure 3—source data 1
Contains qPCR data and analysis shown in Figure 3A.
- https://doi.org/10.7554/eLife.12975.008
-
Figure 3—source data 2
Contains targeted bisulfite sequencing data presented in Figure 3—figure supplement 2.
- https://doi.org/10.7554/eLife.12975.009
Figure 3—figure supplement 1
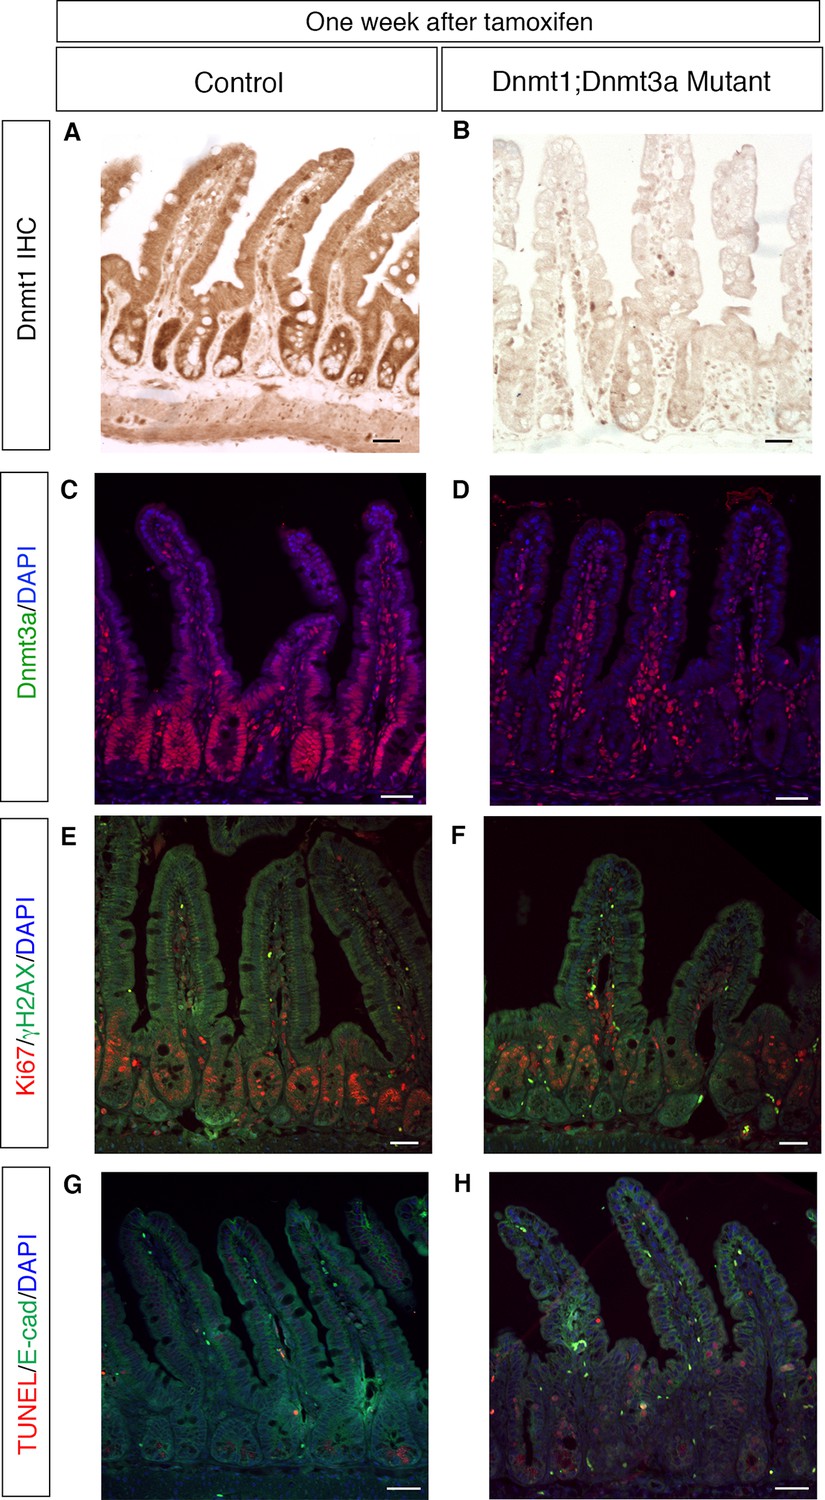
Deletion of Dnmt3a in addition to Dnmt1 causes no additive effects on epithelial proliferation, genome stability or cell death within one week.
(A,B) Dnmt1loxP/loxP; Dnmt3aloxP/loxP (A, control) and Dnmt1loxP/loxP;Dnmt3aloxP/loxP;Villin-CreERT2 (B, Dnmt1;Dnmt3a mutant) intestinal epithelium one week after tamoxifen injection. Immunohistochemistry for Dnmt1 confirms loss of protein in tamoxifen-treated Dnmt1;Dnmt3a mutant relative to controls. (C,D) Immunofluoresence for Dnmt3a confirms loss of protein in tamoxifen-treated Dnmt1;Dnmt3a mutant intestinal epithelium (D) compared to control (C). (E,F) Co-staining for Ki67 (red), a marker of proliferation, and γH2AX (green), which marks DNA double-stranded breaks. Control (E) has minimal γH2AX foci. Dnmt1;Dnmt3a mutants (F) have increased proliferation, similar to what is seen in Dnmt1 mutants. Contrary to Dnmt1 deletion, Dnmt1;Dnmt3a mutants do not display increased γH2AX foci one week after tamoxifen injection. (G,H) TUNEL staining to detect apoptosis (red) with E-cadherin (green) to outline the epithelium. Controls (G) display no apoptotic nuclei in crypt cells. Dnmt1;Dnmt3a mutants (H) display a slight increase in apoptosis, similar to what is observed in Dnmt1 mutant crypts one week after tamoxifen injection. All scale bars are 50 μm. For all staining, n=3 biological replicates.
Figure 3—figure supplement 2
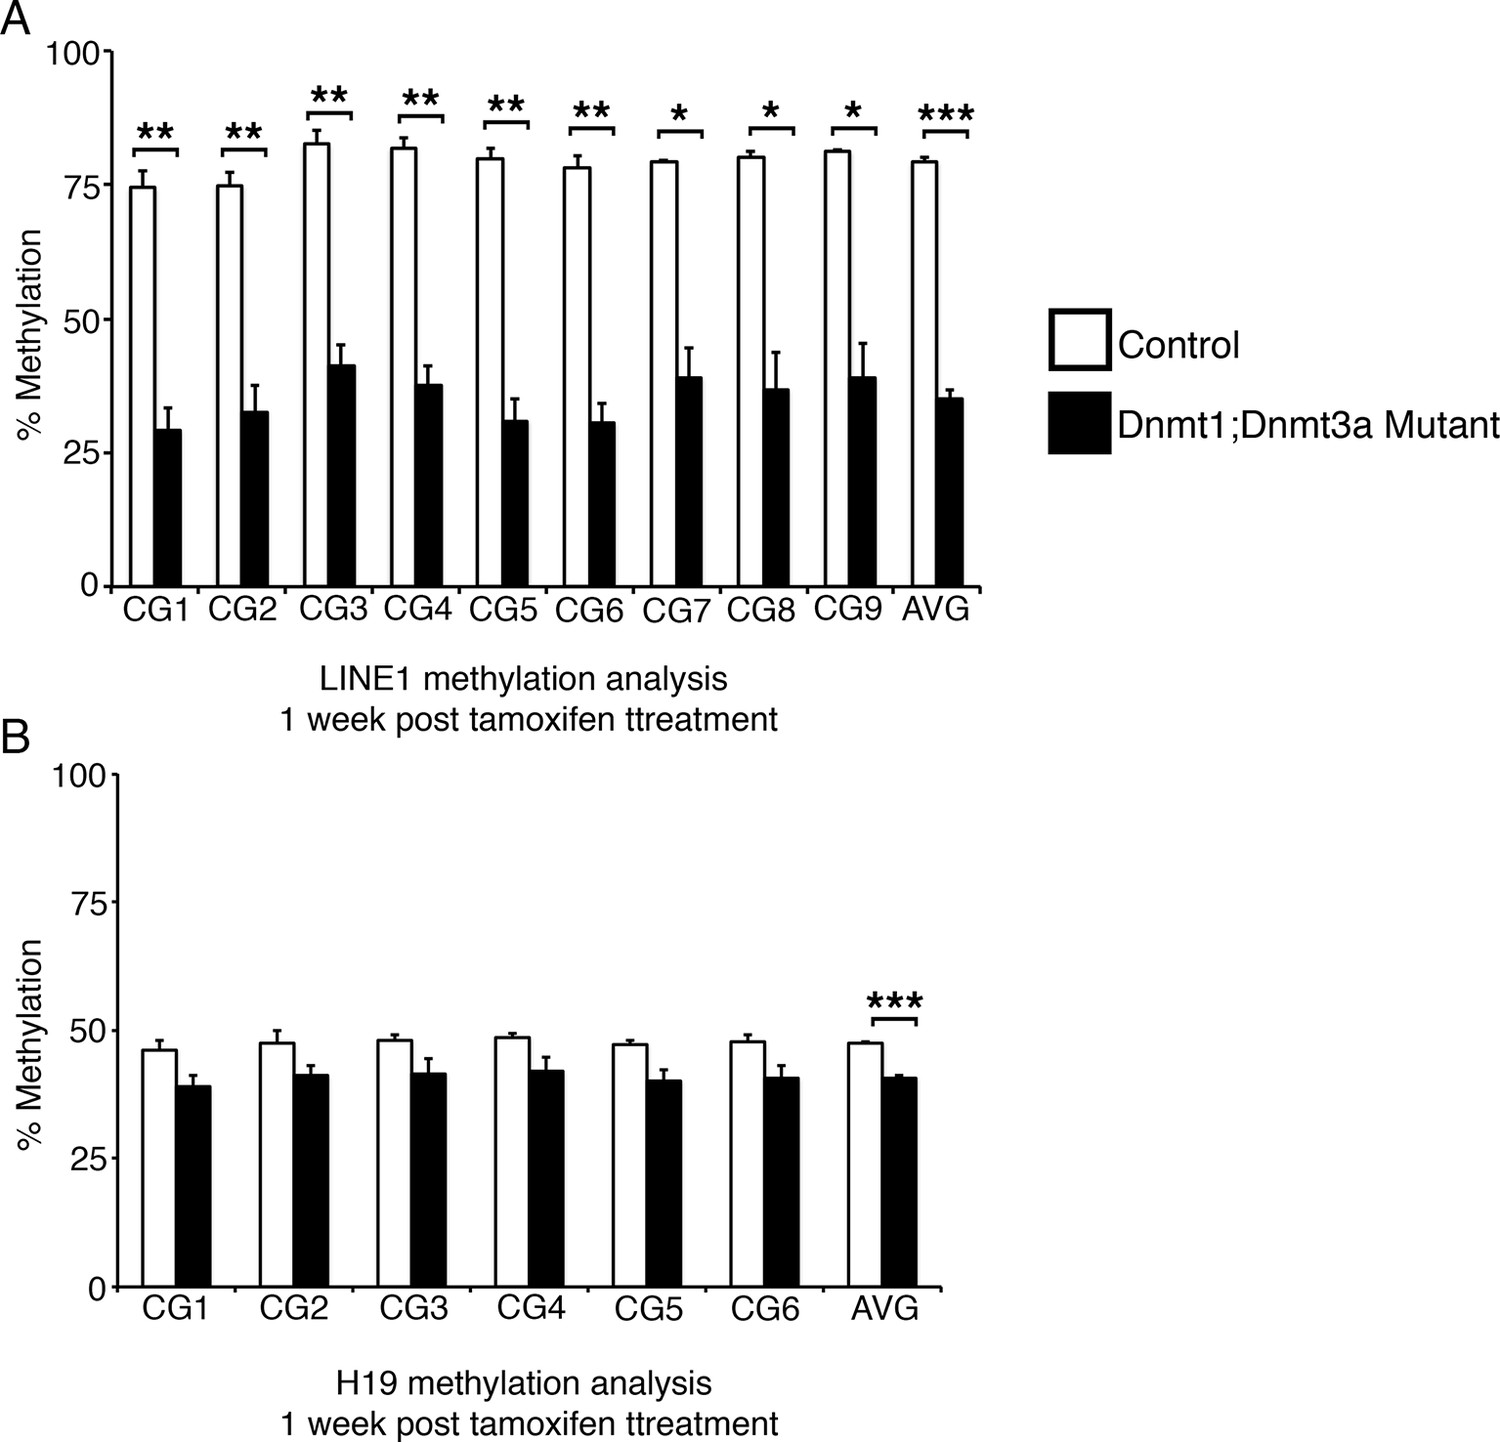
Ablation of Dnmt3a and Dnmt1 induces genome demethylation at LINE1 and H19 loci.
Intestines from Dnmt1loxP/loxP;Dnmt3aloxP/loxP (control, n=2) and Dnmt1loxP/loxP;Dnmt3aloxP/loxP;VilllinCreERT2 (Dnmt1;Dnmt3a mutant, n=3) mice were harvested one week after tamoxifen treatment. Crypt cells were isolated by laser capture microdissection and the methylation levels of LINE1 loci and the imprinting control region of H19 were determined by targeted bisulfite sequencing. (A,B) Methylation of LINE1 (A) and H19 (B) are significantly decreased in Dnmt1;Dnmt3a mutants one week after tamoxifen treatment. In all graphs, error bars are S.E.M. *p<0.05, **p<0.01, ***p<0.001, Student’s t-test. For data and p-values per CpG, refer to Figure 3—source data 2.
Figure 4 with 1 supplement

Loss of both Dnmt1 and Dnmt3b in the intestinal epithelium results in decreased survival.
(A) Percent survival of Dnmt1loxP/loxP;Dnmt3bloxP/loxP(control, n=8), Dnmt1loxP/loxP;Villin-CreERT2 (Dnmt1 mutant, n=16), and Dnmt1loxP/loxP;Dnmt3bloxP/loxP;Villin-CreERT2(Dnmt1;Dnmt3b mutant, n=10). All mice were tamoxifen treated at four weeks of age, and followed 17 days to record weight and survival. Significantly fewer Dnmt1;Dnmt3b mutants survive, compared to both controls and Dnmt1-deficient mice. ***p<0.001, Log-rank test. (B) Percent of initial weight each day following tamoxifen treatment in (A). Gradual weight loss is observed in both Dnmt1 mutants (white diamonds) and Dnmt1;Dnmt3b mutants (grey triangles). (C) Statistical comparison of weight loss between controls, Dnmt1 mutants, and Dnmt1;Dnmt3b mutants. At day 10 post-tamoxifen treatment, both mutant groups have lost a significant amount of weight relative to controls. Dnmt3b;Dnmt1 mutants have also lost significantly more weight relative to Dnmt1 mutants. At day 15, both mutant genotypes weigh significantly less than controls. **p<0.01, ***p<0.001, one-way ANOVA. For all data and p-values, refer to Figure 4—source data 1.
-
Figure 4—source data 1
Contains mouse weight and survival data analysis in Figure 4.
- https://doi.org/10.7554/eLife.12975.013
Figure 4—figure supplement 1

Dnmt1;Dnmt3b mutant intestinal epithelia contain Dnmt3b+ escaper crypts, which do not display DNA damage.
Intestines were harvested from mutant Dnmt1loxP/loxP;Dnmt3bloxP/loxP;Villin-CreERT2 (Dnmt1;Dnmt3b mutant) and sibling Dnmt1loxP/loxP;Dnmt3bloxP/loxPcontrols one week post-tamoxifen treatment. Immunofluorescent staining was performed for Dnmt3b (red), γH2AX (green) to visualize DNA double strand breaks, and DAPI (blue) to stain nuclei. The majority of mutant crypts are null for Dnmt3b relative to control (yellow arrows in B pointing out Dnmt3b-null crypts). However, some mutants contain Dnmt3b-positive crypts, which escaped Cre-loxP recombination (white outline in B). The escaper crypts do not display elevated levels of DNA damage compared to the Dnmt3b-ablated epithelium (yellow arrow points out γH2AX staining in a Dnmt3b-null crypt). Scale bars are 50 μm. For all staining, n=3 biological replicates.
Figure 5 with 3 supplements

Simultaneous loss of Dnmt1 and Dnmt3b results in acute genomic instability, increased apoptosis, and genome demethylation.
(A) Dnmt1loxP/loxP;Dnmt3bloxP/loxP(control), Dnmt1loxP/loxP;Villin-CreERT2 (Dnmt1 mutants) and Dnmt1loxP/loxP;Dnmt3bloxP/loxP;Villin-CreERT2 (Dnmt1;Dnmt3b mutant) intestines were harvested one week following tamoxifen treatment for DNA methylation analysis. Crypts were isolated from paraffin-embedded tissue by laser capture microdissection, and the methylation levels of LINE1 loci were determined by targeted bisulfite sequencing. LINE1 methylation is significantly decreased in both Dnmt1 and Dnmt1;Dnmt3b mutants compared (n=4–6 per genotype). Error bars are S.E.M. **p<0.01, one-way ANOVA. For data and p-values per CpG, refer to Figure 5—source data 1. (B–C) Hematoxylin and eosin staining of Dnmt1;Dnmt3b mutants (C) compared to controls (B). Double mutants display severe crypt and villus loss compared to controls. (D-G) Immunostaining confirms Dnmt1 and Dnmt3b protein loss in the Dnmt1;Dnmt3b mutant intestinal epithelium (E,G) compared to control (D,F). (H,I) Immunofluorescent staining for Ki67 (red), which marks proliferating cells, and γH2AX (green), which marks DNA double-strand break loci as a marker of genome instability. One week following tamoxifen injection, Dnmt1;Dnmt3b mutants (I) display decreased proliferation and increased DNA damage compared to controls (H). (J,K) Immunofluorescent TUNEL staining (red), which marks apoptotic nuclei, and E-cadherin (green), to outline the intestinal epithelium. One week after tamoxifen treatment, Dnmt1;Dnmt3b mutants (K) display increased crypt cell apoptosis relative to controls (J). All scale bars are 50 μm. For all staining, n=3 biological replicates.
-
Figure 5—source data 1
Contains targeted bisulfite sequencing data shown in Figure 5A.
- https://doi.org/10.7554/eLife.12975.016
-
Figure 5—source data 2
Contains targeted bisulfite sequencing data presented in Figure 5—figure supplement 1.
- https://doi.org/10.7554/eLife.12975.017
-
Figure 5—source data 3
Contains targeted bisulfite sequencing data shown in Figure 5—figure supplement 3.
- https://doi.org/10.7554/eLife.12975.018
Figure 5—figure supplement 1

Ablation of Dnmt3b and Dnmt1 induces genome demethylation at H19 loci.
(A) Dnmt1loxP/loxP;Dnmt3bloxP/loxP(control), and Dnmt1loxP/loxP;Dnmt3bloxP/loxP;Villin-CreERT2 (Dnmt1;Dnmt3b mutant) intestines were harvested one week following tamoxifen treatment for DNA methylation analysis. Crypts were isolated from paraffin-embedded tissue by laser capture microdissection, and the methylation levels of the H19 imprinting control region was determined by targeted bisulfite sequencing. H19 methylation is significantly decreased in the Dnmt1;Dnmt3b mutants, relative to controls, when comparing averages of the entire sequenced region (n=4–6 per genotype). Error bars are S.E.M. *p<0.05, Student’s t-test. For data and p-values per each CpG, refer to Figure 5—source data 2.
Figure 5—figure supplement 2
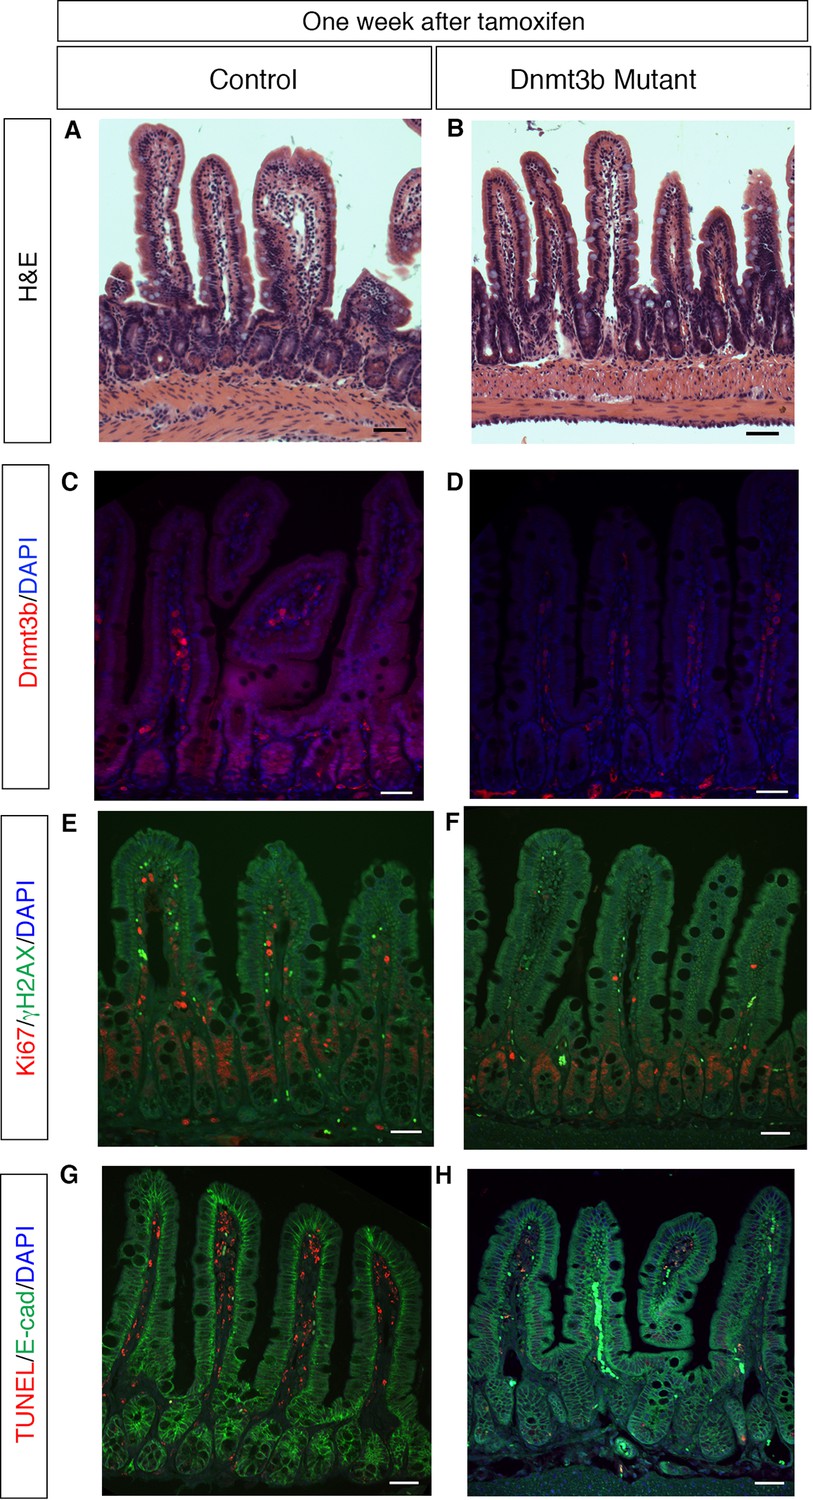
Dnmt3b deletion has no effect on epithelial proliferation, genome stability, or cell death within one week.
(A,B) Dnmt1loxP/loxP; Dnmt3bloxP/loxP (A, control) and Dnmt1loxP/+;Dnmt3bloxP/loxP;Villin-CreERT2 (B, Dnmt3b mutant) intestinal epithelium one week after tamoxifen injection. Hematoxylin and Eosin staining demonstrates no difference in epithelial integrity in the Dnmt3b mutant (B) versus control (A). (C,D) Immunofluoresence for Dnmt3b confirms loss of protein in tamoxifen-treated Dnmt3b mutant (D) compared to control (C). (E,F) Co-staining for Ki67 (red), a marker of proliferation, and γH2AX (green), which marks DNA double-stranded breaks. Both control (E) and Dnmt3b-deficient (F) epithelia have minimal γH2AX foci and display no difference in proliferation. (G,H) TUNEL staining to detect apoptosis (red) with E-cadherin (green) to outline the epithelium. No apoptotic nuclei is found in control (G) or Dnmt3b mutant (H) crypt cells. All scale bars are 50 μm. For all staining, n=3 biological replicates.
Figure 5—figure supplement 3
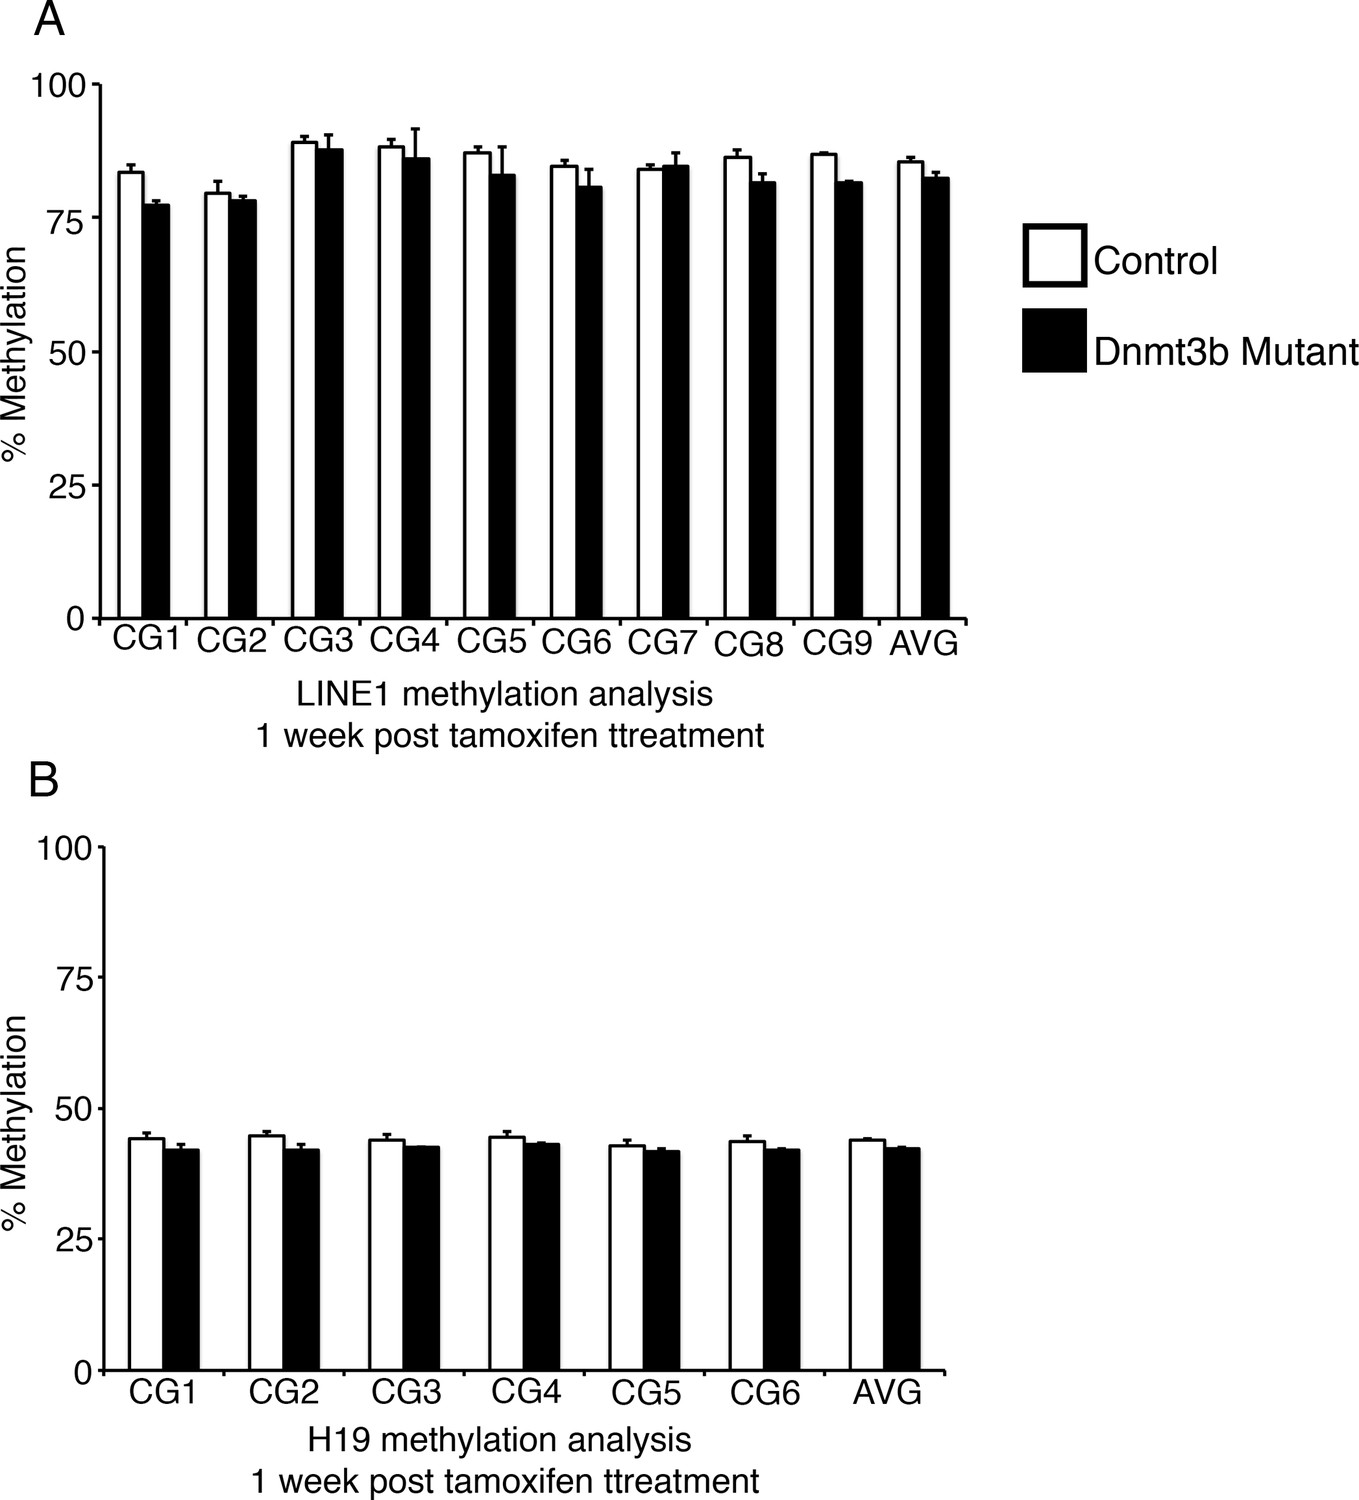
Ablation of Dnmt3b alone is not sufficient to induce genome demethylation.
Intestines from Dnmt3bloxP/loxP (control, n=4) and Dnmt3bloxP/loxPVillin-CreERT2 (Dnmt3b mutant, n=2) mice were harvested one week after tamoxifen treatment. Crypt cells were isolated by laser capture microdissection and the methylation levels of LINE1 loci and the imprinting control region of H19 were determined by targeted bisulfite sequencing. (A,B) Methylation of LINE1 (A) and H19 (B) are similar in Dnmt3b mutants compared to controls. In all graphs, error bars are S.E.M. For data and p-values per CpG, refer to Figure 5—source data 3.
Tables
Table 1
qRT-PCR primer sequences.
| Gene | Forward 5'-3' | Reverse 5'-3' |
|---|---|---|
| Beta-actin | GAAGTGTGACGTTGACATCCG | GTCAGCAATGCCTGGGTACAT |
| TBP | CCCCTTGTACCCTTCACCAAT | GAAGCTGCGGTACAATTCCAG |
| Dnmt1 | CTTCACCTAGTTCCGTGGCTA | CCCTCTTCCGACTCTTCCTT |
| Dnmt3a | GCACCAGGGAAAGATCATGT | CAATGGAGAGGTCATTGCAG |
| Dnmt3b | GGATGTTCGAGAATGTTGTGG | GTGAGCAGCAGACACCTTGA |
Table 2
Bisulfite sequencing primer sets.
| Gene | Sequence (5'-3') |
|---|---|
| H19 PCR#1 Forward | GTTTGTTGAATTAGTTGTGGGGTTTATA |
| H19 PCR#1 Reverse | TAAAAAAAAAAACTCAATCAATTACAATCC |
| LINE1 PCR#1 Forward | GTTAGAGAATTTGATAGTTTTTGGAATAGG |
| LINE1 PCR#1 Reverse | CCAAAACAAAACCTTTCTCAAACACTATAT |
| Unique Barcode PCR#2 Forward | AATGATACGGCGACCACCGAGATCTACACTCTTTCCCTACACGAC |
| Unique Barcode PCR#2 Reverse | CAAGCAGAAGACGGCATACGAGATGTGACTGGAGTTCAGACGTGT |
-
Red text, Illumina adapter sequence; blue text, Unique Illumina Sequencing Barcodes, 1–48.
Download links
A two-part list of links to download the article, or parts of the article, in various formats.
Downloads (link to download the article as PDF)
Open citations (links to open the citations from this article in various online reference manager services)
Cite this article (links to download the citations from this article in formats compatible with various reference manager tools)
The ‘de novo’ DNA methyltransferase Dnmt3b compensates the Dnmt1-deficient intestinal epithelium
eLife 5:e12975.
https://doi.org/10.7554/eLife.12975


